
Abstract
The susceptibility of immature rat brain to neurotoxicity of N-methyl-D-aspartate (NMDA) has provided a widely used in vivo paradigm to study excitotoxicity relevant to acute neurodegenerative diseases such as cerebral ischemia. In this study, in vivo excitotoxicity was induced via injection of ouabain (1 mM/0.5 μL), a Na+/K+-ATPase-inhibitor, into neonatal rat brain and compared with NMDA injection. The aim of the study was to induce excitotoxicity secondary to cellular membrane depolarization, thereby more closely mimicking the pathophysiologic processes of ischemia-induced brain injury where NMDA-receptor overstimulation by glutamate follows, not precedes, membrane depolarization. Na+/K+-ATPase-inhibition caused an acute, 40% ± 8% decrease of the apparent diffusion coefficient (ADC) of water, as measured using diffusion-weighted magnetic resonance imaging (MRI), and resulted in infarctlike lesions as measured using T2-weighted MRI and histology up to 2 weeks later. Localized one- and two-dimensional 1H-magnetic resonance spectroscopy (MRS) demonstrated that the early excitotoxic diffusion changes were not accompanied by an overall metabolic disturbance. Furthermore, 31P-MRS demonstrated that energy depletion is not a prerequisite for ADC decrease or excitotoxic cell death. Treatment with the NMDA-antagonist MK-80 (1 mg/kg) attenuated the volume of tissue exhibiting a decreased ADC (P < 0.005), demonstrating that the ouabain-induced injury is indeed excitotoxic in nature. The authors argue that, compared with NMDA-injection, ouabain-induced excitotoxicity elicits more appropriate glutamate-receptor overstimulation and is better suited to detect relevant neuroprotection in that it is more sensitive to attenuation of synaptic glutamate levels.
Keywords
In the brain, at least 40% of the energy delivered by respiration is required by Na+/K+-ATPase to maintain ion gradients across cell membranes (Astrup et al., 1981). Energy deficiency and concurrent failure of Na+/K+-ATPase function lead to dissipation of these gradients, membrane depolarization, and excessive release of excitatory amino acids (i.e., the induction of excitotoxicity). In excitotoxicity, cell death is initiated by over-activation of N-methyl-D-aspartate (NMDA) receptors by glutamate, after release of the voltage-sensitive Mg2+ block from the receptor (Choi et al., 1988). Excitotoxicity takes center stage in the pathologic sequelae of acute insults such as stroke, status epilepticus, and traumatic brain injury (Faden et al., 1989; Lee et al., 1999; Meldrum 1993). Antagonizing the NMDA-type glutamate receptor proved to be most effective in blocking glutamate overstimulation and attenuating excitotoxicity in animal models of these diseases (Faden et al., 1989; Hahn et al., 1988; Simon et al., 1984). Application of glutamate-receptor agonists, such as NMDA, kainate, or glutamate itself has been extensively used to model excitotoxic cell death, both in vitro and in vivo (Lipton, 1999). In the present study, we focus on the application of these models to the study of excitotoxicity in a setting of cerebral ischemia. Young animals are often used in these studies because of their intrinsic high vulnerability to excitotoxins (Ikonomidou et al., 1989; McDonald et al., 1989a; van Lookeren Campagne et al., 1996). A frequently used approach is the injection of NMDA into neonatal rat brain to achieve overstimulation of NMDA receptors and thus induce excitotoxicity (Dijkhuizen et al., 1999; Dijkhuizen et al., 1996; McDonald et al., 1989b; van Lookeren Campagne et al., 1996; van Lookeren et al., 1994; Verheul et al., 1993). This glutamate-agonist approach to induce excitotoxicity, however, does not take into account membrane depolarization and the subsequent influx of calcium before glutamate release. In this respect it differs from the sequence of events that occur after ischemia. In fact, by inducing depolarization via NMDA-receptor overstimulation, it reverses the causality of depolarization causing the release of glutamate. Furthermore, the extracellular levels of excitotoxins, especially glutamate, that are needed to induce excitotoxicity by exogenous supply are much higher than the glutamate levels reached when excitotoxicity is induced secondary to ischemic depolarization (Benveniste et al., 1992; Mangano and Schwarcz, 1983; Obrenovitch et al., 2000).
Therefore, it is thought that inducing excitotoxicity secondary to cellular membrane depolarization more closely mimics the pathophysiologic processes of ischemia-induced brain injury, after which excessive NMDA-receptor stimulation by synaptically released glutamate, follows, not precedes, membrane depolarization. In this study, secondary excitotoxicity was induced via injection of ouabain, a Na+/K+-ATPase-inhibitor, in neonatal rat brain. Our aim was to characterize secondary excitotoxicity in neonatal rat brain and to compare it with the widely employed NMDA model.
Magnetic resonance imaging (MRI) and spectroscopy (MRS) were chosen as the primary read-out modalities, because (1) they have been extensively used to study NMDA-induced excitotoxicity; (2) they sensitively detect tissue changes related to excitotoxic injury, both in animal models and in human disease; and (3) they are as such commonly applied in the clinic to diagnose and study human acute stroke. The latter is especially true for diffusion-weighted (DW) MRI, which is applied worldwide for the diagnosis of acute stroke. A decrease in the apparent diffusion coefficient (ADC) of water, as measured using DW-MRI, occurs early after the onset of cerebral ischemia and is thought to correlate to acute, excitotoxic tissue changes (Benveniste et al., 1992; Moseley et al., 1990). Therefore, in the present investigation we used DW-MRI to assess the acute ADC decrease elicited by ouabain-induced excitotoxicity in neonatal rat brain. We investigated the contribution of synaptic glutamate release to the ADC decline using the NMDA-receptor antagonist MK-801. Furthermore, because mitochondrial damage may contribute to excitotoxicity, we studied the possible metabolic disturbance and occurrence of energy failure, using one- and two-dimensional COSY 1H-MRS and 31P-MRS. T2-weighted MRI and histology performed 7 days later served as end-point measurements to determine the fate of brain tissue exhibiting decreased ADCs in the acute phase after Na+/K+-ATPase inhibition.
MATERIALS AND METHODS
Animal model
Wistar rats (U:Wu/Cpb, 7- or 8-day-old) were anesthetized with ether and immobilized in a stereotaxic frame. A small burr hole was drilled in the cranium over the left hemisphere, 2.5 mm lateral of bregma. A 1-μL syringe was lowered into the left striatum to a depth of 4.0 mm (Dijkhuizen et al., 1999). Ouabain (0.5 μL, 1 mmol/L; n = 22), NMDA (0.5 μL, 20 mmol/L; n = 9) or vehicle (0.5 μL 40-mmol/L Tris-HCl buffer, pH 7.4; n = 3) was injected at a rate of 0.125 μL/min using a micro-drive. The dosage of excitotoxins was chosen on the basis of doses earlier reported to induce extensive neuronal depolarization and tissue injury as defined by ADC decreases of ≥40% (i.e., comparable to ischemia-induced ADC decreases). For NMDA, these data came from neonatal rat brain (Dijkhuizen et al., 1999; van Lookeren et al., 1994; Verheul et al., 1993); for ouabain, they were extrapolated from literature on adult rat brain (Benveniste et al., 1992). After injection, the needle was left in situ for 2 minutes to avoid leakage of injection fluid from the needle tract. To assess the role of glutamate release, four additional animals received systemic treatment with the NMDA-receptor antagonist MK-801 (1 mg/kg; intraperitoneally) 15 minutes before ouabain injection. Body temperature was maintained at 37°C using a water-filled heating pad and an infrared heating lamp. Animals were then positioned in the magnet and anesthesia was continued using a mixture of halothane (0.4% to 1%) in N2O/O2. The Animal Experiment Ethical Committee of the Utrecht University approved all animal experiment protocols.
Nuclear magnetic resonance protocol
All nuclear magnetic resonance (NMR) experiments were performed using a 4.7T horizontal bore spectrometer (Varian Instruments, Palo Alto, CA, U.S.A.) with a 220-mT/m gradient insert. For proton detection, radio-frequency excitation and signal detection were accomplished by means of a Helmholtz volume coil (9-cm diameter) and an inductively coupled surface coil (2-cm diameter), respectively. For phosphorous spectroscopy, a double-turn surface coil (2-cm inner diameter) was used for excitation and detection.
Magnetic resonance imaging
A single-scan diffusion-trace MRI sequence (de Graaf et al., 1999) [4 b values = 100-1,300 s/mm2, diffusion-gradient duration (δ) = 3.15 milliseconds, gradient separation (Δ) = 13.50 milliseconds, diffusion time (Δ-δ/4) = 12.71 milliseconds, repetition time (TR) = 3 seconds, echo time (TE) = 100 milliseconds, number of transients (nt) = 2] was used to generate quantified images of tissue water-trace ADC. Diffusion-trace and T2-weighted (T2W) imaging (TE = 18, 40, 62 and 84 milliseconds; TR = 2 seconds; nt = 2) were performed in all animals (2.2 × 2.2 cm2 field-of-view; 64 × 64 data-matrix), starting 15 minutes after injection on day 0. As expected, at the early time point no changes in T2W-MRI were detected. Both types of imaging were repeated on day 7. To assess further lesion evolution, MRI scans were obtained again on day 14 in five ouabain- and three NMDA-treated animals. Both the T2W and the diffusion-weighted (DW) datasets consisted of seven consecutive, 1.5-mm-thick slices, with a 0-mm slice gap. To minimize interference at the slice boundaries, slices were acquired in alternating order. For the DW imaging, we used a double spin-echo pulse sequence with four pairs of bipolar gradients with specific predetermined signs in each of the three orthogonal directions, as recently described elsewhere (de Graaf et al., 1999). The combination of gradient directions leads to cancellation of all off-diagonal tensor elements, effectively measuring the trace of the diffusion tensor. This provides unambiguous and rotationally invariant ADC values in one experiment, circumventing the need for three separate experiments.
31P-magnetic resonance spectroscopy.
The 31P-MR spectra were acquired starting 1.5 hours after ouabain injection (n = 5) using a two-dimensional ISIS sequence (TR = 10 seconds, nt = 128). Sagittal slices (4.0 mm) were positioned in the ipsilateral and contralateral hemispheres as guided by DW images and limited to the hemisphere in the rostrocaudal (z) dimension as guided by a rapid transversal scout imaging experiment. After acquisition, the 31P-MR data were zero-filled to 4k and 15-Hz line broadening was applied before Fourier transformation.
One-dimensional 1H-magnetic resonance spectroscopy
One-dimensional 1H MRS was performed starting 1.5 hours after injection of NMDA (n = 5) or ouabain (n = 9), using a point-resolved spectroscopy (PRESS) sequence (TE = 144 milliseconds, TR = 2 seconds, nt = 128). Spectra were acquired from 36-μL voxels positioned in the ipsilateral or contralateral hemisphere. Chemical-shift-selective (CHESS) pulses and dephasing gradients were used to suppress the water signal. Positioning of the ipsilateral voxel was guided by the DW images acquired just before the MRS experiment. The contralateral voxel was placed in a position symmetrical to the ipsilateral voxel, using the midline as a reference. After acquisition, the data were zero-filled to 8k and 4-Hz line broadening was applied.
Two-dimensional 1H-magnetic resonance correlation spectroscopy.
To overcome the problem of spectral overlap between lactate and lipid resonances at 1.33 ppm in one-dimensional 1H spectra, two-dimensional 1H spectra were acquired at 1.5 hour after ouabain injection in four additional animals. Repetition of the measurement during a 20-minute anoxic stimulus served as a positive control for lactate detection. Spectra were acquired from two 100-μL voxels positioned in the ipsilateral and contralateral hemispheres with acquisition times of 2 × 20 minutes starting at 1.5 hour after ouabain injection, and 2 × 10-minute acquisition times starting on removing the oxygen from the breathing mixture. Acquisition time for two-dimensional spectra was longer than for one-dimensional spectra. Therefore, localization of two-dimensional spectra was done using Hadamard encoding, enabling the acquisition of data from the two voxels simultaneously (Delmas et al., 2001; Hennig, 1992), thus avoiding differences in starting time for data acquisition from ipsilateral and contralateral voxels. Localization was performed with a double spin-echo volume selective sequence (TE1 = 7.65 milliseconds, TE2 = 4.85 milliseconds, TR = 2 seconds, nt = 8). Simultaneous acquisition of the Hadamard-encoded signal arising from the two voxels was done with nt = 4 for each encoding step. The final pulse of the double spin-echo sequence was applied for two-dimensional polarization transfer, resulting in correlation spectroscopy (COSY)-type spectra (80 t1-increments, np = 512). Water suppression was obtained, before the localization sequence using three gaussian CHESS pulses followed by crusher gradients. The third CHESS pulse was optimized to yield minimal water signal at the start of the localization sequence (i.e., to account for T1 relaxation during the last crusher gradient) (Webb et al., 1994).
Histology
After the last NMR measurements, animals destined for histology (n = 8) received an overdose of pentobarbital and were transcardially perfused with 4% paraformaldehyde in 0.1 mol/L phosphate buffer. Dissected brains were postfixed overnight by immersion in the same fixative, cryoprotected in 10% sucrose in phosphate-buffered saline (PBS) for 24 hours followed by 25% sucrose in PBS for 72 hours, and snap-frozen in liquid nitrogen-cooled isopentane. Coronal sections (10 μm) were cut and stained for glial fibrillary acidic protein (GFAP) with Nissl-substance or with hematoxylin-eosin using standard procedures. The position of the histologic slices was matched to the position of the MRI images by known position relative to bregma, after which a gross correlation was done.
Data analysis
The ADC and T2 maps were generated by monoexponential fitting using the Interactive Data Language software package (Research Systems, Boulder, CO, U.S.A.). Parametric images were analyzed in anatomic regions of interest using the same software package. Voxels in the ipsilateral hemisphere were considered pathologic if their ADC or T2 value differed more than 20% (corresponding to a ≥2x SD difference) from the mean value in the contralateral hemisphere. The ventricles were segmented out in the average ADC and T2 measurements.
The lesion volume per slice was calculated by multiplying the number of pathologic voxels in that slice by the voxel volume. The total lesion volume was obtained by summation of the lesion volumes for all slices. The absence of a slice gap makes interpolation of lesion areas between slices unnecessary, reducing systematic errors to within-slice “averaging” of signal intensity.
One-dimensional 1H- and 31P-MR spectra were analyzed using the VARPRO (variable projection) nonlinear least-square time-domain fitting method. Intracellular pH (pHi) was calculated from the chemical shift difference between the inorganic phosphate (Pi) and phosphocreatine (PCr) resonances (Decorps et al., 1984). All chemical shift values were referred to the methyl proton resonance of NAA at 2.02 ppm or the PCr resonance at 0 ppm for 1H and 31P spectra, respectively.
Data postprocessing of two-dimensional 1H-MR spectra, including Hadamard decoding, was performed with GIFA software (ftp://www.cbs.univ-montp1.fr/pub/gifa_v4). The two-dimensional dataset was apodized with a standard sine function and zero-filled in both dimensions. Decoding was obtained by addition and subtraction of the two Hadamard-encoded spectra, which corresponds to the multiplication of the data by the Hadamard matrix. Two-dimensional spectra are shown as contour plots. All chemical shift values were referred to the methyl proton resonance of NAA at 2.02 ppm.
Statistical analysis was carried out using SPSS 10.0 (SPSS Inc., Chicago, IL, U.S.A.). Data are presented as mean ± SD. Differences between groups were analyzed using Student's t-test; reported P values correspond to two-tailed significance.
RESULTS
Diffusion- and T2-weighted MRI magnetic resonance imaging after Na+/K+-ATPase inhibition in neonatal rat brain
In all animals, we first acquired DW-MR images starting 15 minutes after ouabain injection. DW-MRI can report on excitotoxic tissue changes, as evidenced by a decrease in the ADC of water that accompanies a relocation of part of the extracellular water into depolarized cells (Benveniste et al., 1992; Mintorovitch et al., 1994; van der Toorn et al., 1996). Ouabain injection resulted in a 40% ± 8% drop in ADC (from 1.09 × 10⁻³ mm2/sec to 0.66 × 10⁻³ mm2/sec, mean value of all pathologic voxels; P < 0.0001; Fig. 1A, Table 1). Injection of vehicle did not result in ADC reduction (data not shown). The extent of the ADC decrease correlates to the severity of tissue injury (Desmond et al., 2001). Therefore, we compared the ADC decrease caused by ouabain-induced excitotoxicity with that caused by NMDA. Injection of NMDA resulted in a 45% ± 9% ADC drop (from 1.12 × 10⁻³ mm2/sec to 0.62 × 10⁻³ mm2/sec; P < 0.0001; Table 1), which was slightly more than the ouabain-induced decrease (P < 0.05). The values found for NMDA are in agreement with previous findings (Benveniste et al., 1992; Dijkhuizen et al., 1999; van Lookeren Campagne et al., 1996).
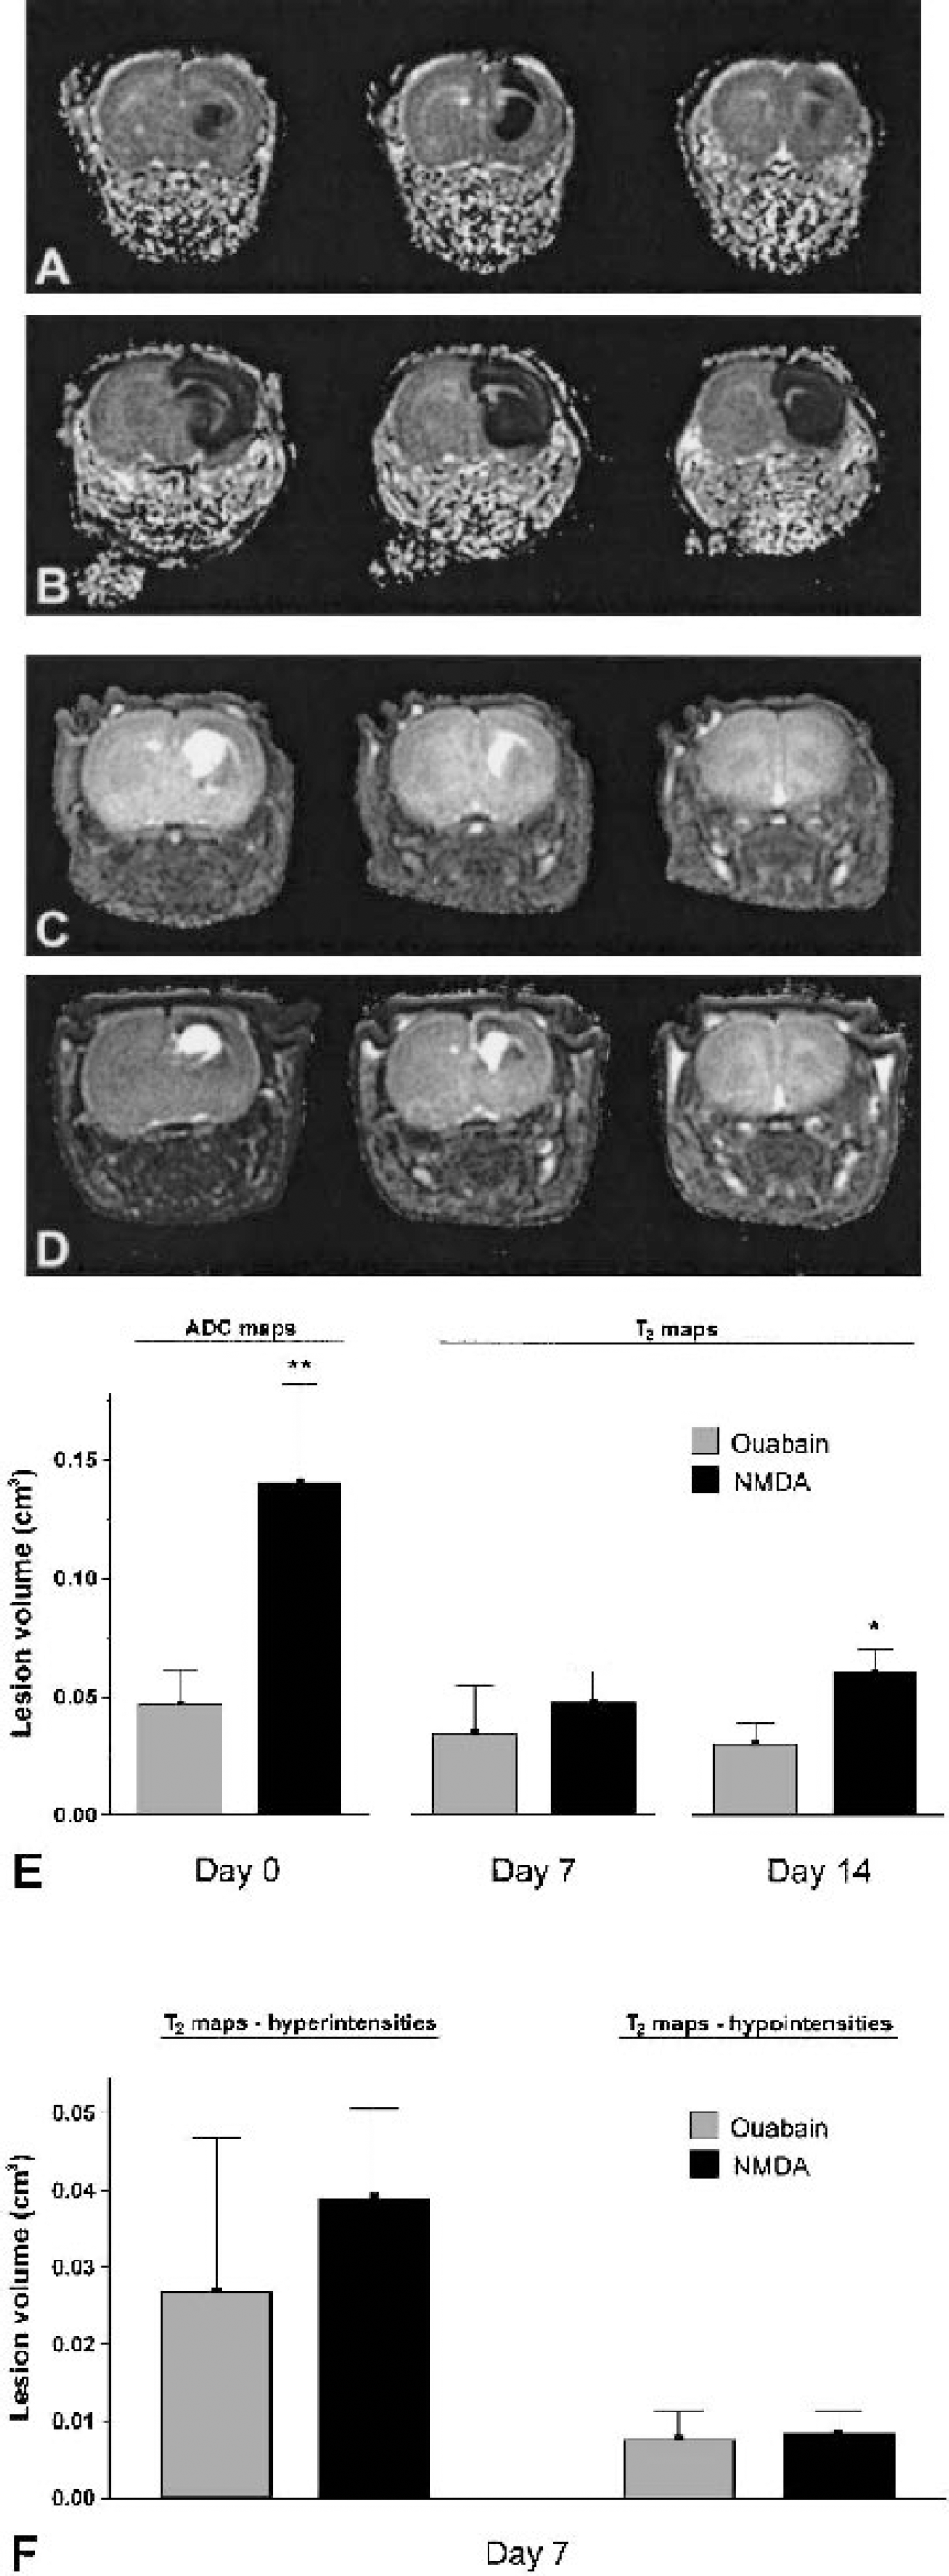
Consecutive parametric apparent diffusion coefficient (ADC) maps acquired 15 minutes after ouabain injection
Mean values of apparent diffusion coefficient of water and T2, for lesions and contralateral tissue
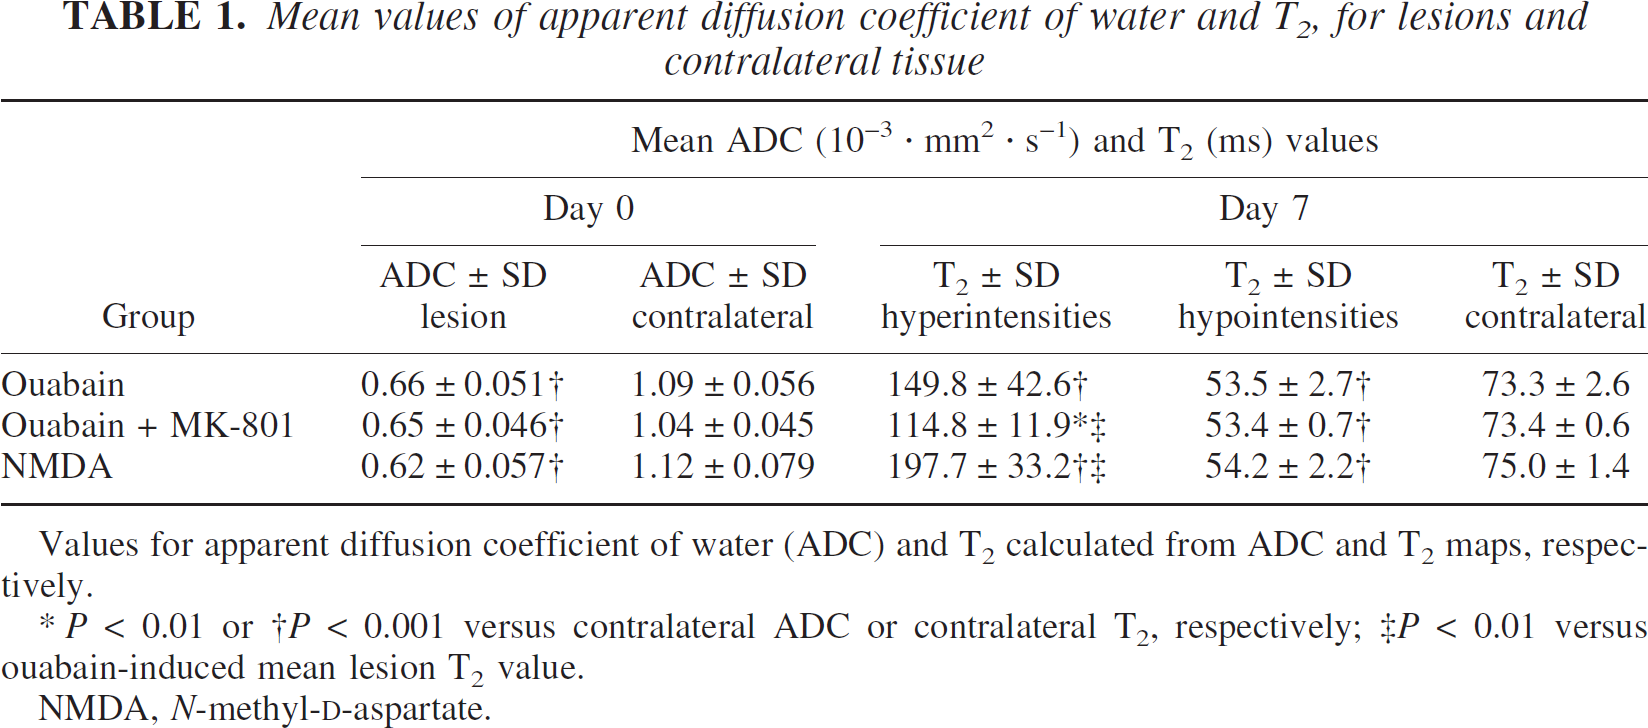
Values for apparent diffusion coefficient of water (ADC) and T2 calculated from ADC and T2 maps, respectively.
P < 0.01 or †P < 0.001 versus contralateral ADC or contralateral T2, respectively; ‡P < 0.01 versus ouabain-induced mean lesion T2 value.
NMDA, N-methyl-D-aspartate.
The total volume of tissue exhibiting an ADC decrease of 20% or more (corresponding to a ≥2x SD difference) was calculated from the multislice DW-MRI datasets and is shown in Fig. 1E. At this acute time point, 15 minutes after injection, the volume of the affected brain region was 67% smaller (P < 0.0001) in the ouabain-injected animals compared with the NMDA-injected animals. The caudate-putamen and the dorsally situated motor-and forelimb-sensory cortex were invariably affected in both groups, whereas in the NMDA-treated animals the dorsal hippocampus and more frontoparietal cortex were also included in the lesion (Figs. 1A and 1B). Seven days after toxin injection, lesion volumes were again determined from T2W-MRI data sets (Figs. 1C and 1D). The hyperintense signal on these maps corresponds to ex vacuo ventricular dilatation and vasogenic edematous and necrotic tissue (Fig. 2A) (van Lookeren et al., 1994; Verheul et al., 1993). Hypointense areas on T2-maps corresponded to areas of extensive reactive gliosis on GFAP-stained histologic sections (Figs. 2A and 2E) and formed part of the area defined as a lesion in Nisslstained sections (Figs. 2D and 2E), which is in excellent agreement with previous findings after NMDA-induced excitotoxicity (van Lookeren Campagne et al., 1996; van Lookeren et al., 1994). Neuronal loss, defined by hypointensities and hyperintensities on day 7, was similar in the ouabain- and NMDA-injected animals (Fig. 1E). The hypointense, gliotic tissue usually surrounded the hyper-intense tissue (Figs. 1C and D; Figs. 2B and C), and its contribution to the total lesion volume on T2-maps was comparable between ouabain- and NMDA-injected animals (Fig. 1F). From day 0 to 7, the size of the lesion was stable in ouabain-injected animals but had decreased by more than twofold in NMDA-injected animals. To assess further lesion evolution, MRI scans were obtained again on day 14 in five ouabain- and three NMDA-treated animals. These data showed that from day 7 to 14, the volume of the lesion volume had not significantly changed in either group, although the volume in ouabain-injected animals was now significantly smaller than in NMDA-injected animals (P < 0.05, Fig. 1E).
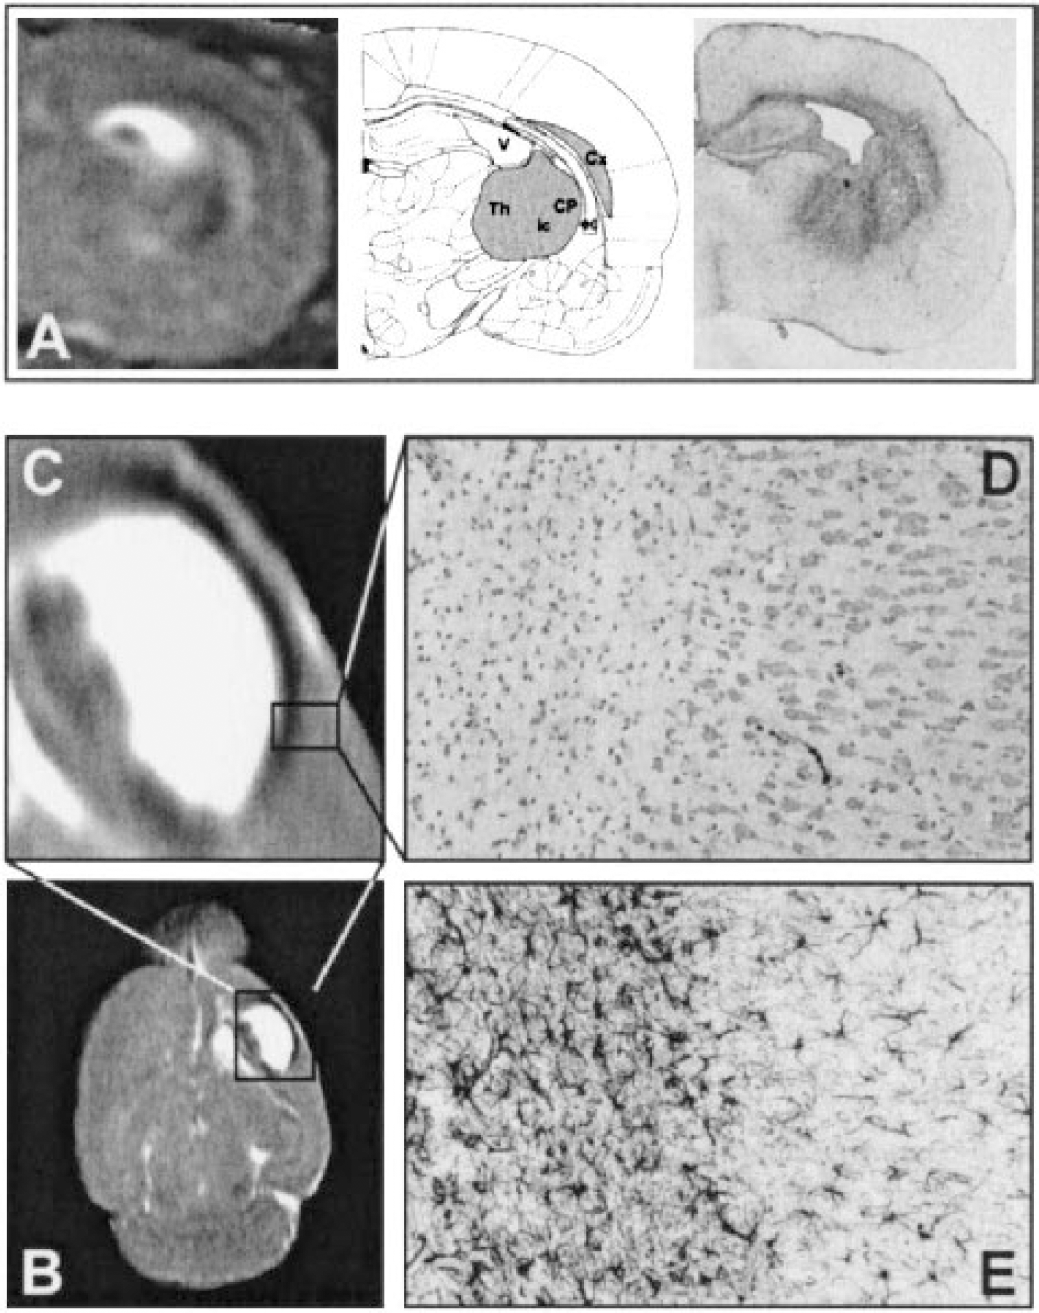
(A) Coronal T2 map and corresponding glial fibrillary acidic protein (GFAP) staining for astroglial intermediate filaments of rat brain after ouabain injection. Markedly increased staining was observed in the thalamus (Th), external capsule (ec), and cortex (Cx) of the injected hemisphere, whereas normal staining was seen in the contralateral hemisphere. Increased staining corresponds to hypointense areas on T2 maps.
1H-magnetic resonance spectroscopy
During cerebral ischemia, oxygen depletion impedes mitochondrial respiration. The ensuing energy failure and standstill of the Na+/K+-ATPase lead to dissipation of the membrane potential. The resulting loss of the voltage-sensitive Mg2+ block of the NMDA receptor and stimulation by synaptically released glutamate greatly enhance calcium influx. The resulting increase in intracellular calcium levels activates many deleterious processes, including further disruption of mitochondrial function. To assess whether mitochondrial failure is associated with excitotoxic cell death in our model, 1H MR-spectra were obtained in the acute phase after Na+/K+-ATPase inhibition to search for increased lactate production and metabolic derangement. Single-voxel 1H spectra were acquired from affected tissue in the ipsilateral hemisphere (Fig. 3B) and from the corresponding region in the contralateral hemisphere (Fig. 3A) using the PRESS technique. The spectra obtained from the unaffected contralateral hemisphere showed the typically low total creatine (tCr), low N-acetylaspartate (NAA), and high taurine (Tau) levels characteristic of P7 brain as compared with adult brain (Burri et al., 1988). The excitotoxic tissue damage witnessed by DW-MRI directly after ouabain injection was not accompanied by a major disturbance in the levels of 1H-MRS-detectable metabolites 1.5 hours after injection (Fig. 4). Seven days after injection, spectra acquired from the unaffected contralateral hemisphere showed the expected increase in the intensity of the peak from the neuronal marker NAA, related to continuing brain development. This increase was strongly diminished in the ipsilateral hemisphere (P < 0.05, Fig. 4C), indicative of the neuronal loss also witnessed on T2-maps and Nissl histology. 1H-MRS measurements in five animals in which excitotoxicity was induced by NMDA injection yielded similar results (Fig. 4). Occasionally a small peak was observed at the lactate resonance frequency, which could indicate lactate formation (Fig. 3B). The spectral overlap with lipid resonances, however, hampered the accurate detection of small amounts of lactate. To overcome this problem, two-dimensional 1H-spectra were acquired 1.5 hours after ouabain injection in four additional animals. Because the lactate crosspeak at 1.33 × 4.1 ppm is completely separated from the lipid resonance and because shorter TEs can be used, localized two-dimensional COSY allows the uncontaminated detection of low lactate levels (Delmas et al., 2001). The peaks on the diagonal in the two-dimensional spectra are the peaks as they are detected in the one-dimensional spectra (Fig. 3), and once again indicated that there were no major differences in metabolite levels between spectra obtained from the affected ipsilateral and unaffected contralateral hemisphere. At 1.33 × 4.1 ppm where the lactate crosspeak arises, no lactate was detected in either hemisphere in all animals (Figs. 3C and 3D). Next, a strong anoxic stimulus was given by removing the oxygen from the breathing mixture, which served as a positive control for lactate detection. Two-dimensional acquisition was repeated starting on anoxia and completed 20 minutes later. Lactate was detected within minutes and a large amount of lactate was seen in two-dimensional spectra of both hemispheres at the end of the measurement (Figs. 3E and 3F). Lac/tCr and Lac/NAA ratios (0.61 ± 0.27 and 1.31 ± 0.98 for the ipsilateral voxel and 0.49 ± 0.31 and 0.81 ± 0.51 for the contralateral voxel) were 22% and 62% higher, respectively (P > 0.05) in the ouabain-injected hemisphere compared with the contralateral tissue.
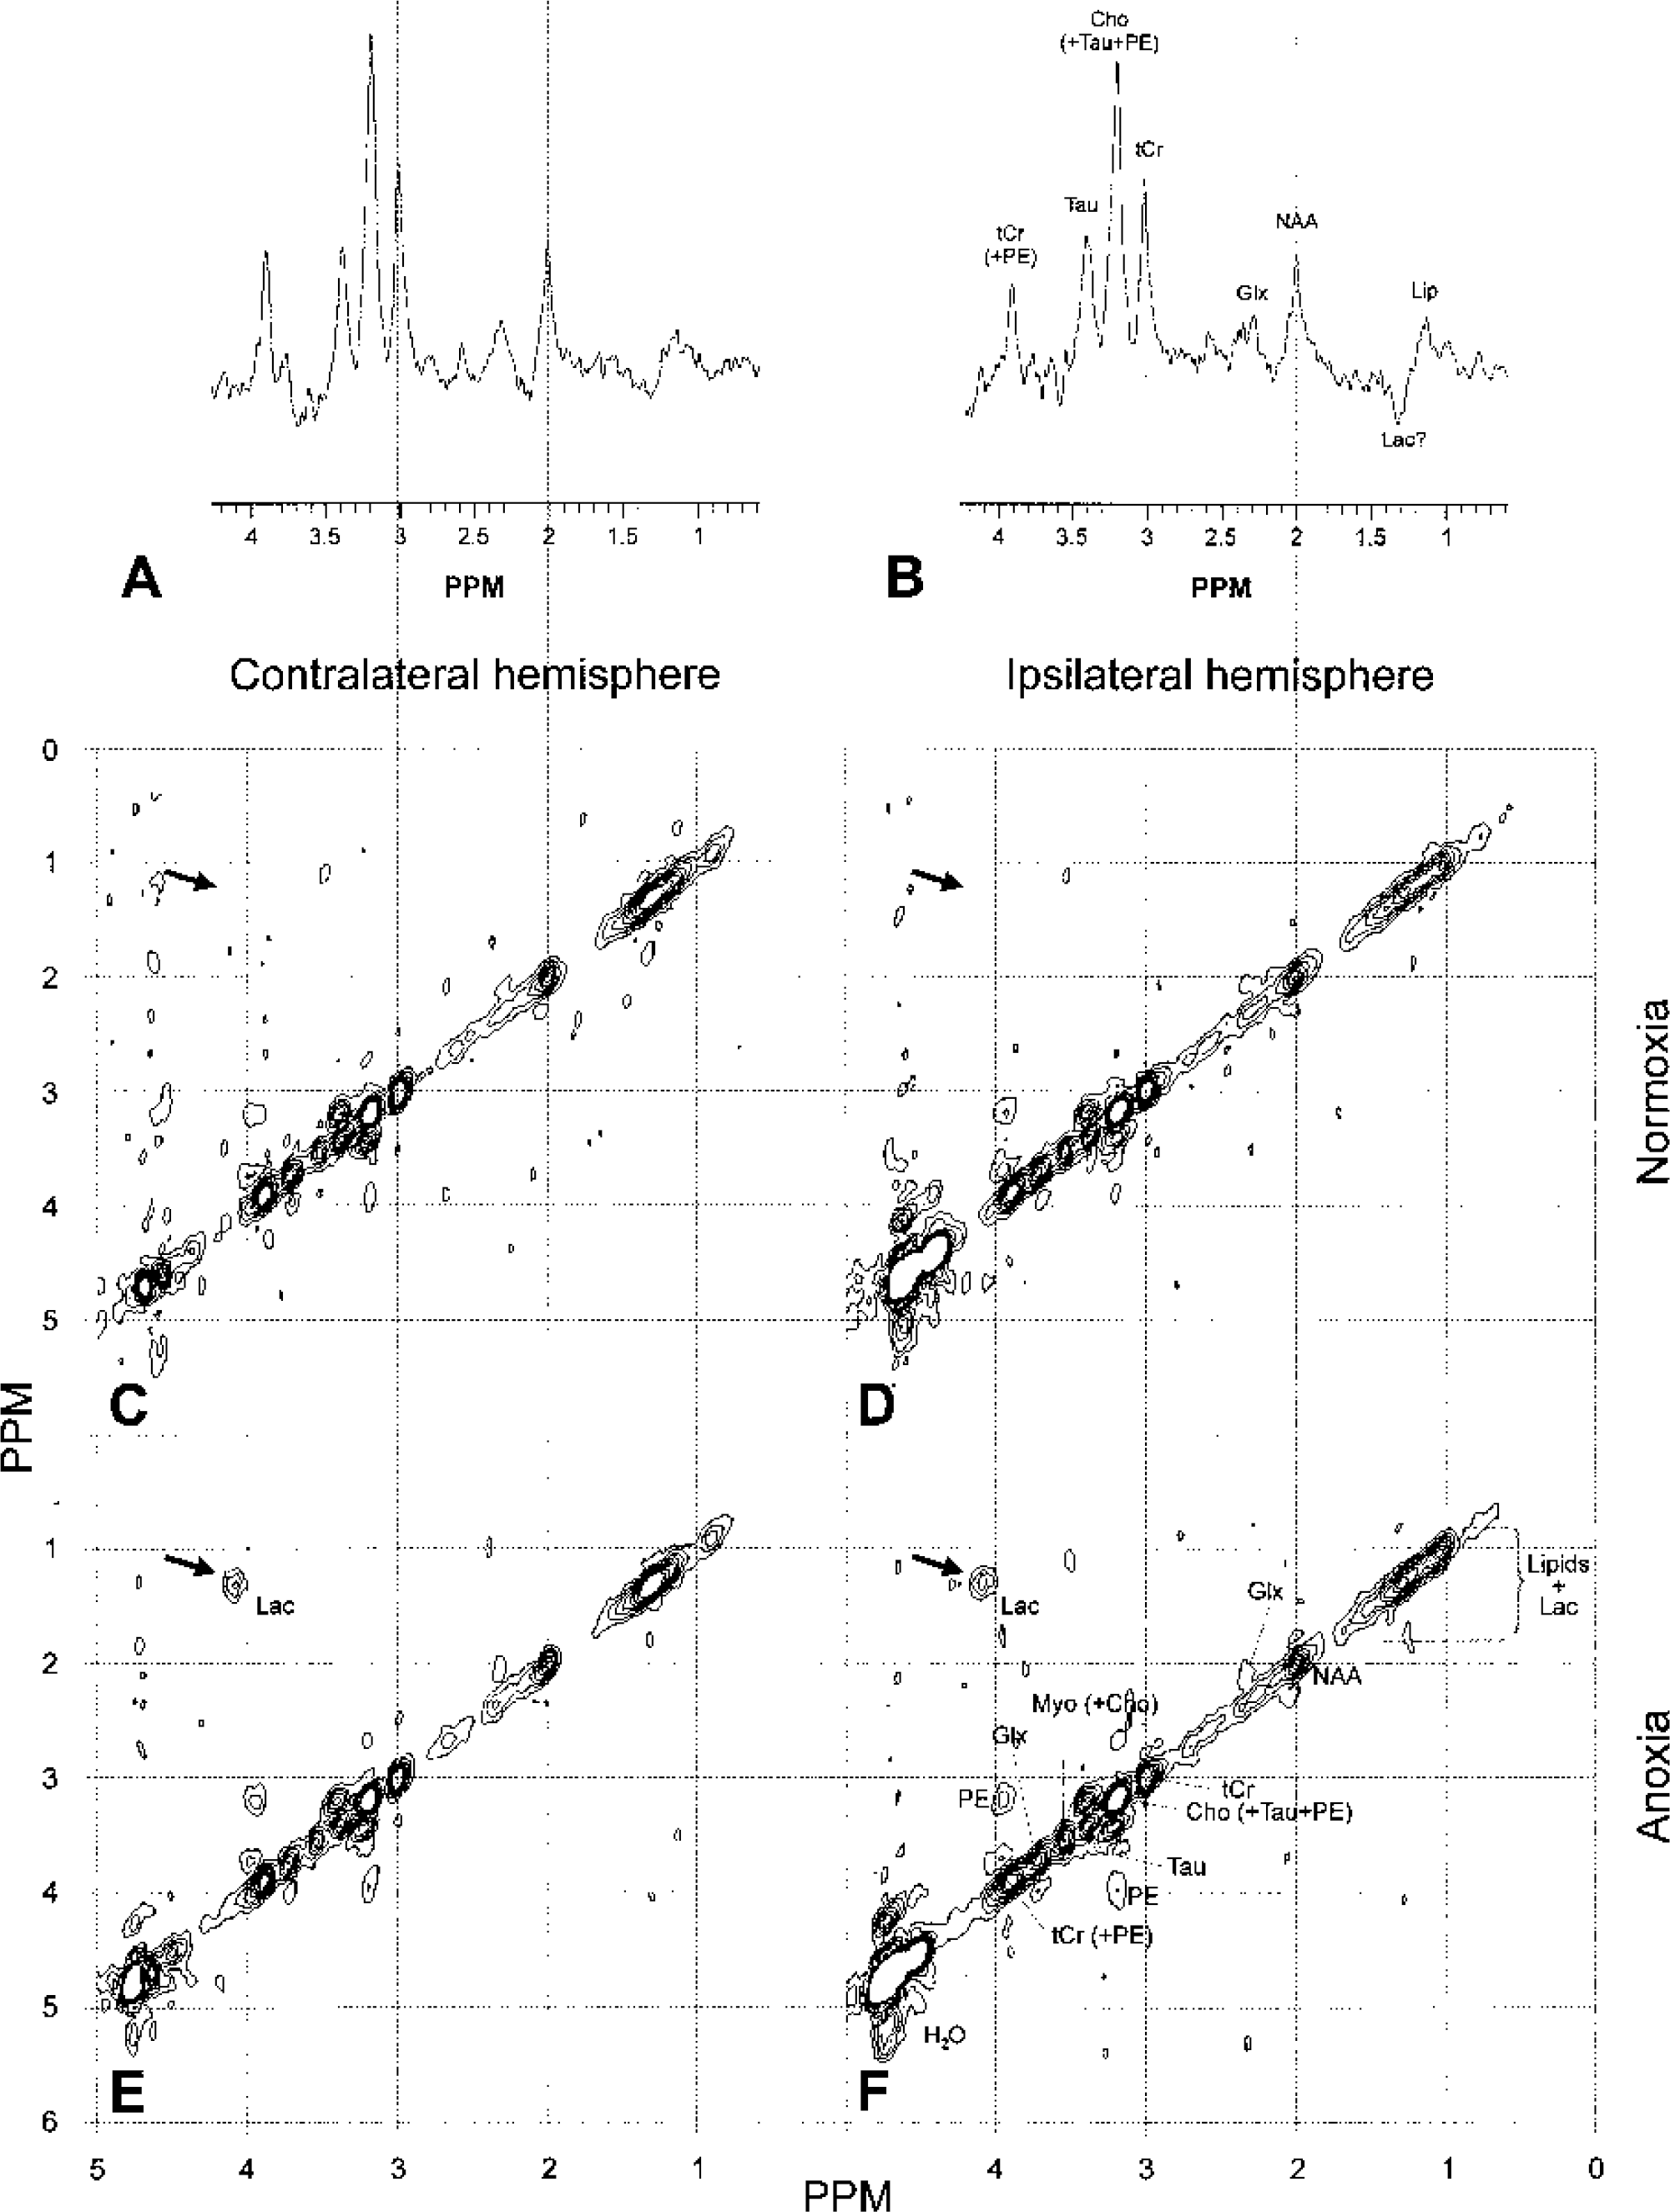
1H-magnetic resonance spectra acquired 1.5 hours after ouabain injection from the unaffected contralateral
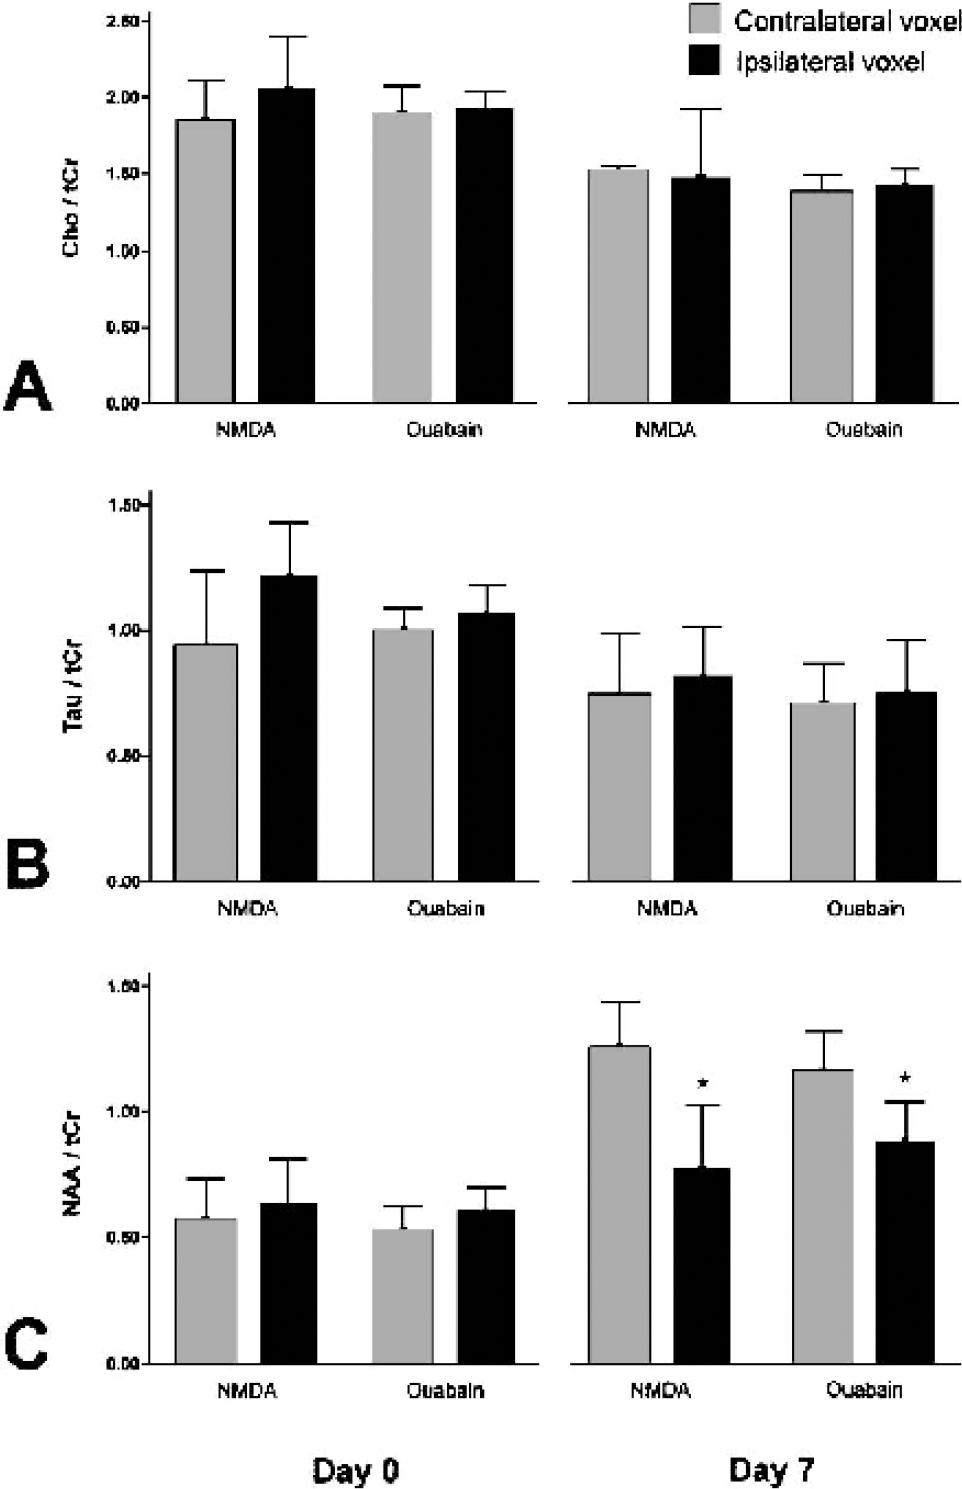
Metabolite ratios determined from single-voxel 1H-magnetic resonance spectra acquired 1.5 hours after intracerebral injection of ouabain or N-methyl-D-aspartate (NMDA). Note the change in the relative signal intensities of N-acetylaspartate (NAA) and taurine (Tau) from the typically low NAA and high Tau concentrations of neonatal brain to the higher NAA
Energy status and pHi after Na+/K+-ATPase inhibition assessed by 31P-magnetic resonance spectroscopy
To gain more direct information on the cerebral energy status after Na+/K+-ATPase inhibition, 31P-MR spectra were acquired starting 1.5 hours after ouabain injection in an additional five animals. The 31P spectra acquired from the contralateral hemisphere showed the prominent phosphomonoester (PME) peak typical of neonatal brain (Burri et al., 1988; Tofts and Wray, 1985) (Fig 5). In line with the 1H-MRS results, no overt lactacidosis was detected using 31P-MRS. Intracellular brain pH (pHi), as calculated from the chemical shift difference between the inorganic phosphate and the phosphocreatine resonance (Decorps et al., 1984), was 7.38 ± 0.11 for the ipsilateral side and 7.30 ± 0.09 for the contralateral side. Previously, pHi values of 7.09 ± 0.14 and 7.26 ± 0.06 have been reported for the ipsilateral and contralateral hemispheres, respectively, after NMDA-injection (Dijkhuizen et al., 1996) compared with 7.25 ± 0.05 in controls (Suzuki et al., 1992).
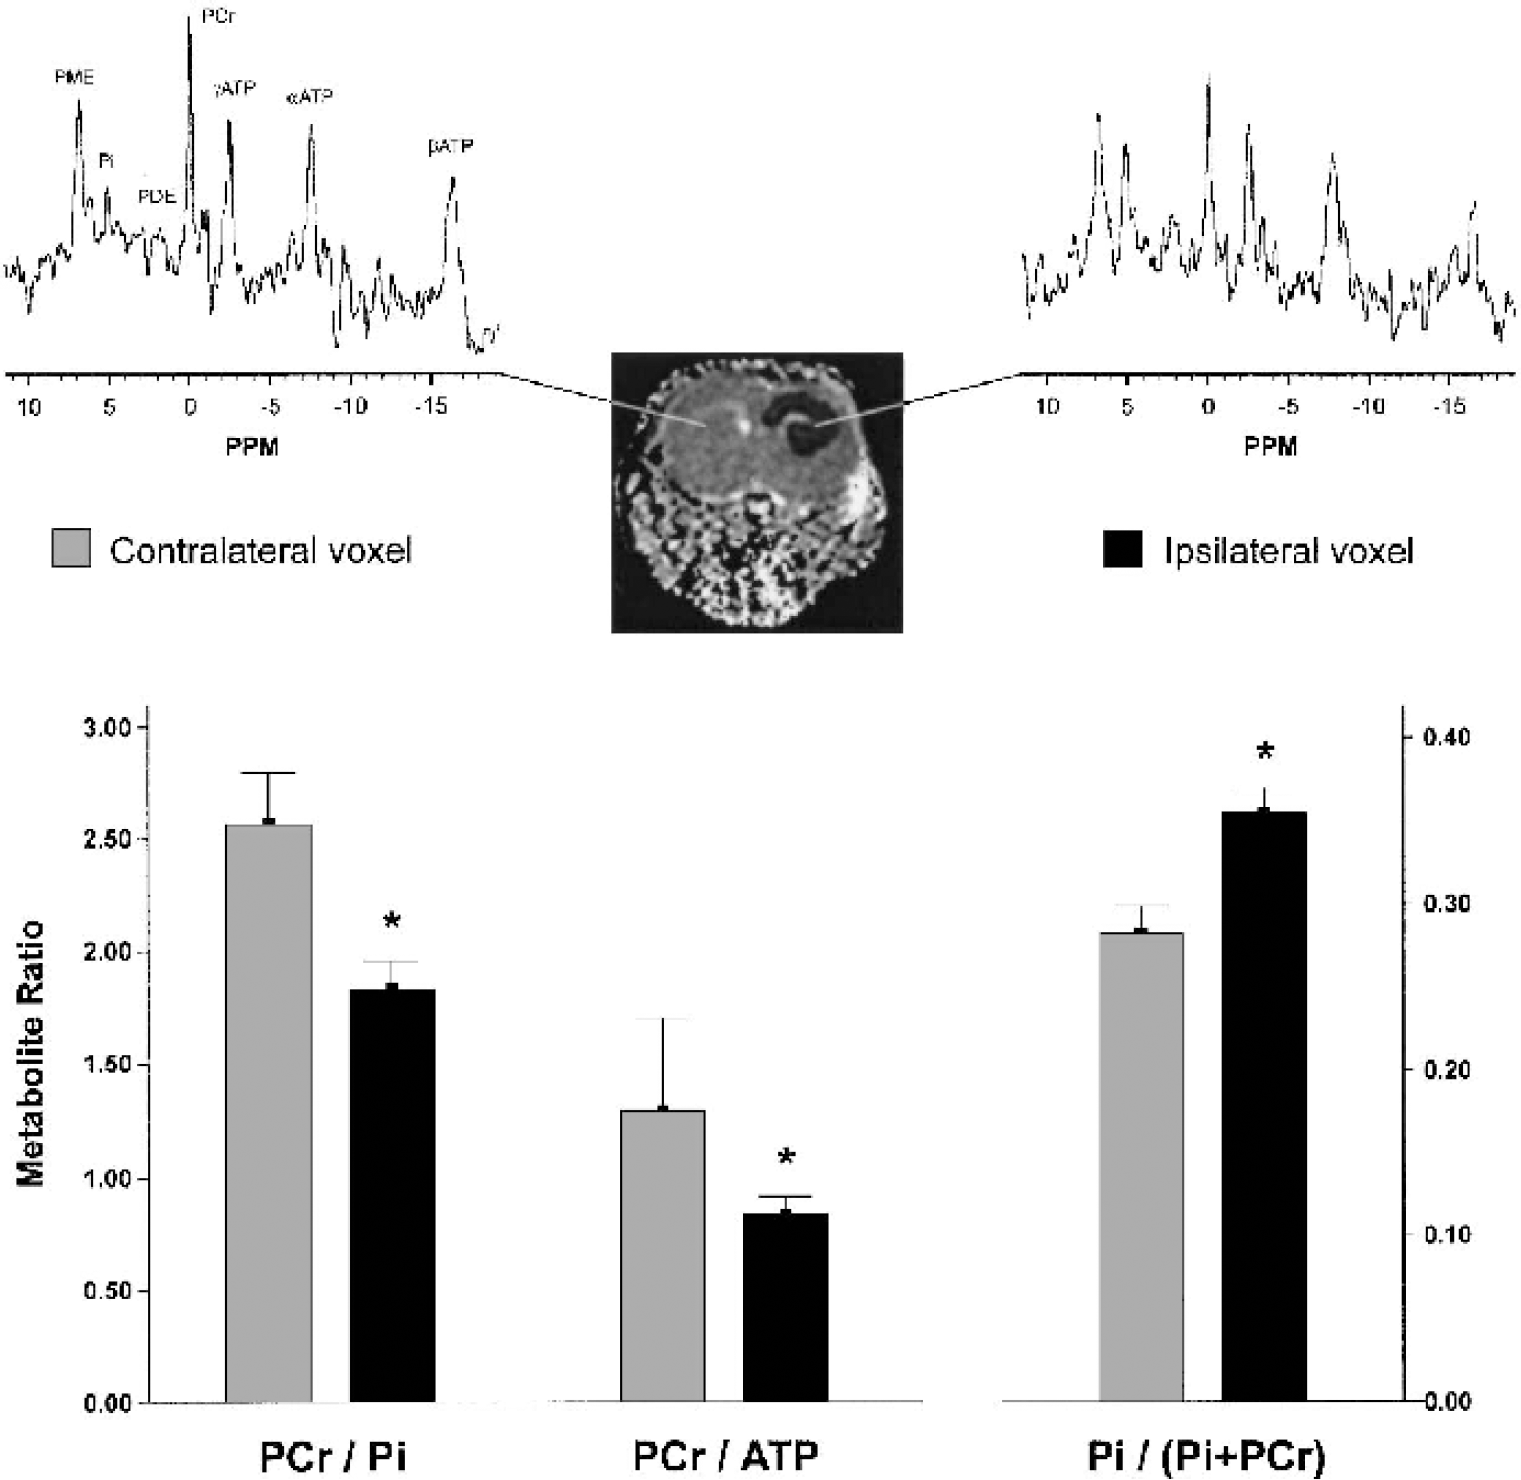
31P-MR spectra acquired 1.5 hours after Na+/K+-ATPase inhibition. The spectra showed the prominent phosphomonoester (PME) peak typical of neonatal brain. Spectra acquired from the ipsilateral voxel showed a decline in phosphocreatine (PCr) and concomitant increase in phosphate (Pi). Metabolite ratios calculated from the spectra indicated a decreased phosphorylation potential. *P < 0.05 vs. contralateral hemisphere. PDE, phosphodiester.
The ratio of PCr to Pi and the Pi index, Pi/(Pi + PCr), are both sensitive indicators of energy status. A Pi index of 0.28 ± 0.03 was found for the unaffected contralateral hemisphere, which is similar (0.28 ± 0.12) to control values reported previously (Dijkhuizen et al., 1996). After ouabain injection, the PCr/Pi and the PCr/ATP ratios were decreased (P < 0.05). Concomitantly, the Pi index increased to 0.36 ± 0.03 (compared with 0.34 ± 0.18 after NMDA injection; Dijkhuizen et al., 1996), indicative of a compromised energy status.
Effect of MK-801 on the consequences of Na+/K+-ATPase inhibition
To confirm a role of excitotoxicity in neurodegeneration after Na+/K+-ATPase inhibition, four additional animals received systemic injections with the NMDA-receptor antagonist MK-801 15 minutes before intracerebral ouabain injection. The excitotoxic tissue response was strongly attenuated in the acute phase after Na+/K+-ATPase inhibition (P < 0.05, Figs. 6A and 6C), signifying that the ouabain-induced depolarization is followed by overstimulation of the NMDA receptor, much like the sequence of events known to occur after ischemia-induced membrane depolarization. T2 maps acquired 1 week later showed persistently reduced lesion volumes (P < 0.05, Figs. 6B and 6C). Thus, the protection offered by acute NMDA-receptor blockage was not transient, confirming that excitotoxicity is at the basis of neuronal injury caused by Na+/K+-ATPase failure in this model.
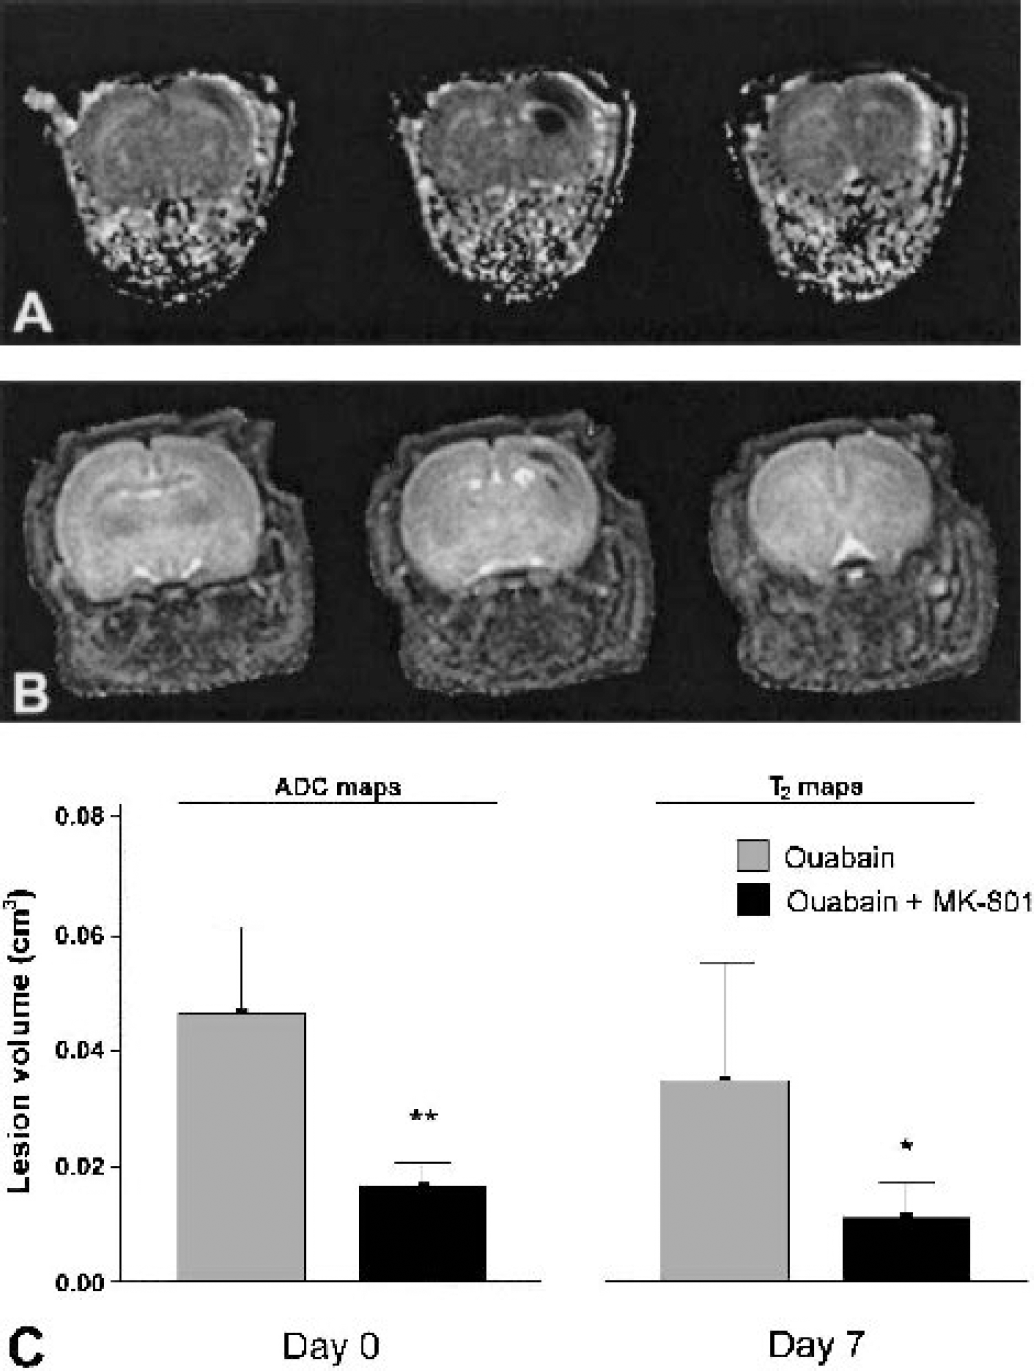
Attenuation of cytotoxic tissue injury and final tissue loss by N-methyl-D-aspartate (NMDA)-receptor antagonism.
DISCUSSION
The effect of in vivo Na+/K+-ATPase inhibition in neonatal rat brain is described in terms of NMR parameters. Ouabain injection was explored as a more relevant strategy to study in vivo neuronal injury relevant to cerebral ischemia than direct excitotoxin injection. Immature brain is often used for these studies because of its high susceptibility to the consequences of intrathecal excitotoxin injection, resulting in large, distinct excitotoxic lesions (Ikonomidou et al., 1989; McDonald et al., 1989a; van Lookeren Campagne et al., 1996).
We will first discuss the current setup of ouabain-induced, secondary excitotoxicity in neonatal rat brain and compare it with existing models of excitotoxicity using direct excitotoxin injection, in particular NMDA injection. We will then discuss the nature of the ADC decrease in our model with respect to the current discussion about the mechanism behind the ADC decrease in the acute phase after stroke. Finally, we address application of the present setup to the study of neuroprotection relevant to cerebral ischemia.
Ouabain-induced in vivo excitotoxicity
We showed that inhibition of Na+/K+-ATPase in neonatal rat brain results in a decrease of the water ADC by 40%. It is thought that the sequence of events leading to the ADC decrease after ouabain injection is as follows (see also schematic in Fig. 7): the Na+ gradient set up by Na+/K+-ATPase pumping will run down owing to diffusion of Na+ down its concentration gradient. The potassium equilibrium, responsible for the major component of the resting membrane potential maintained by potassium diffusion through K+-leak channels, will be lost when it is no longer electrogenically balanced by low intracellular Na+. Membrane depolarization triggers the opening of voltage-gated Ca2+ channels and synaptic release of glutamate. Together with the loss of the voltage-sensitive Mg2+ block from the NMDA receptor, this results in a massive increase of intracellular calcium concentration ([Ca2+]i) (Antonov and Johnson, 1999; Novelli et al., 1988). In addition, the dissipation of the Na+ gradient disrupts transport processes, such as the uptake of synaptic glutamate (Rossi et al., 2000), but also the functionality of the Na+/Ca2+ exchanger will be disturbed. This will further increase [Ca2+]i (Czyz et al., 2002; Koch and Barish, 1994). The rise in intracellular Na+ leads to electrogenic Cl− uptake (Rothman, 1985), osmotic cell swelling, and a decrease of the ADC of water. Waves of spreading depression, resulting from excessively released K+ and glutamate, may then contribute to expansion of the lesion (Balestrino et al., 1999) and to a further increase of extracellular glutamate levels (Basarsky et al., 1999).
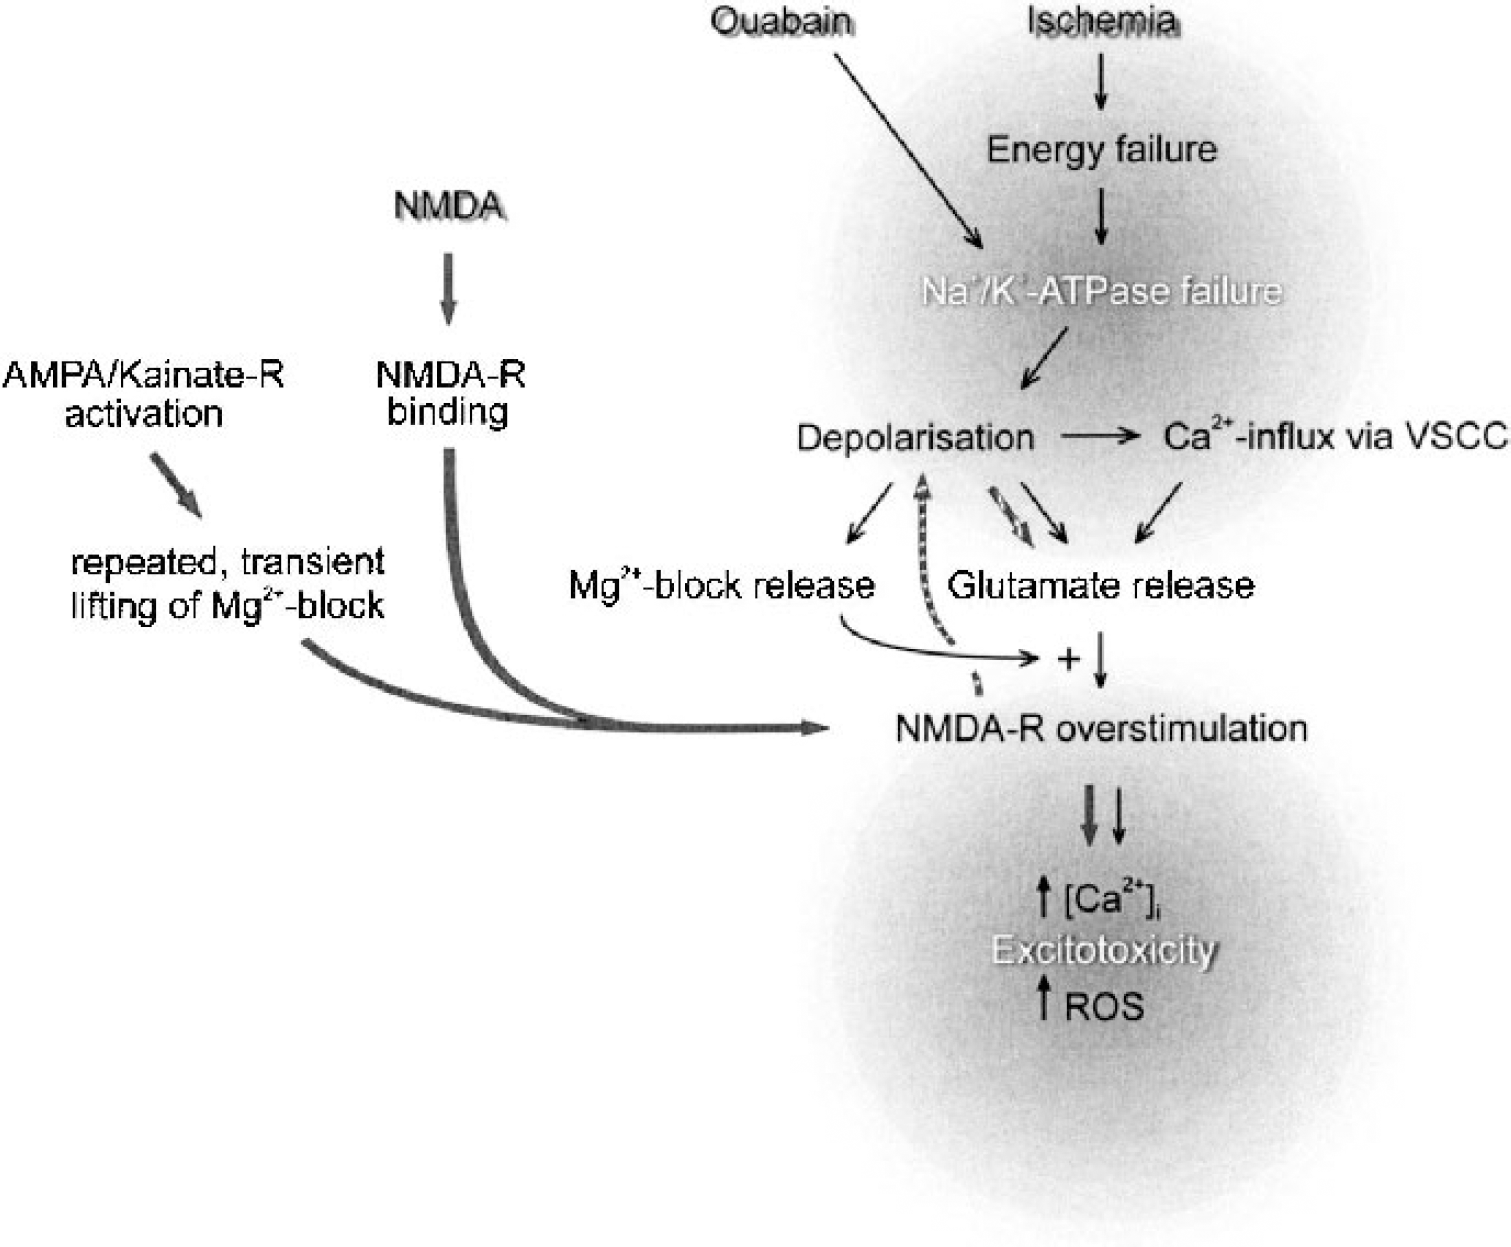
Schematic overview comparing N-methyl-D-aspartate (NMDA)-, ouabain-, and ischemia-induced excitotoxicity. Ouabain application and ischemia (black arrows) both induce acute failure of Na+/K+-ATPase. Depolarization and Ca2+ influx induce glutamate release, both from synaptic terminals, and more importantly from neuronal somata, dendrites, and astroglia via interference with the Na+-gradient-dependent glutamate transporters. The concurrent persistent relief of the Mg2+ block allows activation of NMDA-type glutamate receptors, leading to influx of cytotoxic Ca2+ levels and production of reactive oxygen species (ROS). Administered NMDA (grey arrows) can open the NMDA-receptor-linked ion channel only on release of the voltage-sensitive Mg2+ block from the receptor. Steady-state activation of AMPA/Kainate-receptors will transiently release the Mg2+ block from the NMDA receptor to allow subsequently released glutamate to activate the receptor. When NMDA is present in the extracellular space, it can immediately activate the NMDA receptor. Repeated, transient activation will eventually overload the capacity of Na+/K+-ATPase to restore membrane potential, only then leading to cellular depolarization (striped arrows). Thus, NMDA initiates excitotoxicity in a different way and with a different timing of Ca2+ influx, cellular depolarization, and glutamate release compared with ouabain or ischemia.
T2-weighted MRI and histologic analysis showed that ouabain-injection in neonatal rat brain resulted in distinct, infarctlike lesions 7 days later. Injection of ouabain (0.1 nmol) into the striatum of adult rats (Lees and Leong, 1995) resulted in much smaller lesions (0.65 ± 0.04 mm3) than injection of ouabain into the striatum of neonatal animals described here (0.5 nmol; 46 ± 15 mm3). This cannot just be explained by the lower dose of ouabain used, since, in that study, doubling the dose of ouabain still resulted in lesion volumes of only 2.7 ± 0.8 mm3. Moreover, striatal injection of a 1-nmol dose of ouabain in adult rats in another study lesioned 9.2 ± 1.8 mm3 of tissue (Greene and Greenamyre, 1996). Injection of ouabain into the hippocampus of adult rats, a region known to be particularly vulnerable to ischemia, elicits severe neuronal injury, although also in only a small volume of tissue (Lees et al., 1990). A low dose (0.1 nmol) of ouabain resulted in a hippocampal neuronal loss of up to 40%, and a high dose (1 nmol) resulted in apparent infarction and a complete loss of neurons. However, no damage was seen outside the hippocampus at either dose in that study. Application of ouabain to the adult hippocampus via microdialysis (60-minute perfusion at 5 μL/min of a 1 mmol/L ouabain solution) resulted in a 41 ± 14% ADC decrease (Benveniste et al., 1992), very similar to the ADC decrease described here after ouabain injection into neonatal brain. In that study, lesion volumes were not determined, but based on histologic sections, a 1,500-μm lesion radius was reported. Assuming a spherical lesion, this yields an estimated volume of 4 mm3, which is also smaller than the lesion volumes reported in the present study. The sensitivity of neonatal rat CNS to NMDA-receptor overstimulation peaks during the first 2 postnatal weeks and declines to adult levels during the following weeks (Ikonomidou et al., 1989; Izumi et al., 1995; Mitani et al., 1998; van Lookeren Campagne et al., 1996). We have shown here that ouabain-induced injury in neonatal brain is largely dependent on NMDA-receptor activation. Furthermore, compared with adult brain, 7-day-old rat brain poses less restriction to diffusion in the extracellular space, as measured via Mn+ or [3H]-AMPA tracing using T1W-MRI and autoradiography, respectively (van Lookeren Campagne et al., 1996), or as determined using iontophoresis (Lehmenkuhler et al., 1993). The increase in diffusional restriction developing over the subsequent weeks is paralleled by a decrease in the ADC of water. Thus, as compared with adult brain, the larger lesion volumes obtained after ouabain application to neonatal brain are likely due to both the higher sensitivity of neonatal brain to NMDA-receptor overstimulation, and to the less hindered extracellular diffusion of ouabain compared with adult brain.
The initial ADC decrease after ouabain injection was not accompanied by a major disturbance in metabolite levels or intracellular pH as detected by 1H- and 31P-MRS, respectively. These findings are in good agreement with those of previous studies that have used NMDA injection (Dijkhuizen et al., 1999; Dijkhuizen et al., 1996; Young et al., 1991). A reduction in the mitochondrial membrane potential (Δψ) and impaired mitochondrial function can be expected to occur given the suspected increase in [Ca2+]i (Nicholls and Ward, 2000). A complete dissipation of Δψ preceding the anoxic stimulus, however, was not a feature of ouabain-induced excitotoxicity. This is in line with earlier observations in the NMDA model of only moderately declined tissue energy status 24 hours after injection, a time point at which there is already extensive neuronal injury (Dijkhuizen et al., 1996). The decline in 31P-metabolite levels in that study was somewhat less than the decline that we observed after ouabain injection. This difference is more relevant when one considers the error induced by the partial volume effect due to the 31P voxel being larger than the lesion, which will underestimate the changes in 31P-metabolite levels. As is clear from Fig. 1, the initial lesion size after NMDA injection is larger than after ouabain injection, resulting in larger partial volume effects in the latter model. We conclude that, although ouabain-induced excitotoxic cell death is not accompanied by complete energy depletion, mitochondrial function is clearly compromised. ATP levels are maintained through creatine kinase activity, which is accompanied by reduced PCr levels and increased Pi levels. The maintenance of sufficiently high ATP levels allows for the execution of apoptosis (Nicotera and Lipton, 1999). This supports the in vitro observation that ouabain-induced cell death is executed as mixture of necrosis and apoptosis (Xiao et al., 2002; reviewed in Martin et al., 1998).
The decreased NAA/tCr ratio detected 7 days after ouabain injection reflects the neuronal loss also detected on Nissl stainings (McDonald et al., 1990). The area of neuronal loss extended into the area of reactive gliosis, which is detected by its hypointense signal on T2 maps and increased staining for GFAP on histologic sections. Reactive gliosis is a typical response to brain injury. It has been previously described to accompany excitotoxicity, both in adult (Wang et al., 1991) and neonatal rats (van Lookeren et al., 1994), and to occur after ischemic insults (Kajihara et al., 2001; Schroeter et al., 2001). Ultrastructurally, excitotoxin-induced cell death has been described to resemble ischemia-or trauma-induced cell death (Ishimaru et al., 1999). Observations further underscoring the relevance to hypoxia/ischemia-induced brain injury are, for example, similarities in selectively vulnerable brain regions (McDonald and Johnston, 1990) and the similar efficacy of NMDA-receptor antagonists in attenuating injury. Furthermore, the intracellular and extracellular changes in Na+, K+, and Ca2+ ion concentrations induced by inhibition of Na+/K+-ATPase are very similar to those produced by excitotoxins released by other mechanisms (reviewed in Lees, 1991), including ischemic damage (Choi, 1987; Choi, 1988; Goldberg and Choi, 1993; Lee et al., 1999).
ADC decrease after Na+/K+-ATPase inhibition
A reduction in the ADC of water as measured using DW-MRI occurs early after the onset of cerebral ischemia, but the exact mechanism behind the decrease is unknown (for a recent review see Hoehn et al., 2001). On cessation of blood flow, energy failure and subsequent loss of Na+/K+-ATPase function result in a shift of water from the extracellular space into depolarized cells. This leads to swelling of some cellular compartments and to a net decrease of extracellular volume and an increase in intracellular volume. It is thought that these changes to a large extent underlie the decrease in ADC that occurs in the acute phase after the onset ischemia (Benveniste et al., 1992; Liu et al., 2001; Pfeuffer et al., 1998; van der Toorn et al., 1996). In our model, inhibition of Na+/K+-ATPase resulted in an acute 40% drop in water ADC, which could be attenuated, but not completely prevented, by pretreatment with the NMDA-receptor antagonist MK-801. Injection of NMDA results in a slightly stronger ADC decrease (45%), which can be completely prevented by prophylactic MK-801 treatment and can even be reversed by post hoc treatment (Dijkhuizen et al., 1999; Dijkhuizen et al., 1996; van Lookeren et al., 1994; Verheul et al., 1993). These findings suggest that after ischemia-induced Na+/K+-ATPase failure, ADC decrease can start before glutamate is excessively released, and is then aggravated by such release. The initial, glutamate overload-independent ADC decrease can be caused by the net influx of water arising when the free diffusion of Na+ is no longer compensated for by Na+/K+-ATPase activity. Indeed, in vitro treatment of neuronal cultures with ouabain increased [Na+]i and induced cell swelling, even when MK-801 was added to the culture medium (Xiao et al., 2002). During ischemia, the main cause of extracellular glutamate increase is the reversed operation of glutamate transporters, which occurs only after dissipation of the Na+ gradient, their main driving force. This would seem to be in line with the finding that the increase in extracellular glutamate levels and the occurrence of anoxic depolarization as measured using microdialysis and DC-potential recordings, respectively, do not precede the early rapid ADC decrease after cerebral ischemia (Harris et al., 2000). Furthermore, it has been proposed that a decrease in energy-dependent intracellular circulation (or cytoplasmic streaming) is a predominant mechanism for the decrease in water ADC associated with cell injury (Dijkhuizen et al., 1999; Duong et al., 1998; Li et al., 2002; Norris, 2001). In the present excitotoxicity paradigm, we measured ADC decreases of the same order of magnitude as those that occur after brain ischemia (Albers, 1998). Both 1H-MRS and 31P-MRS demonstrated the absence of energy depletion during the ADC decrease, suggesting that a loss of energy-dependent cytoplasmic streaming is not a major determinant of diminished intracellular bulk water motion and decreased intracellular water ADC. It should be noted in this respect that Ca2+ overload associated with NMDA-receptor overstimulation and opening of voltage-sensitive Ca2+ channels can interfere with cytoplasmic circulation, independent of energy failure (Kamiya, 1984; Stearns, 1982). In a recent study using the Xenopus oocyte, however, it was shown that diffusion of ions, water, and several other small molecules was consistent with Brownian motion (Sehy et al., 2002). Even though extrapolation to mammalian neurons is not straight-forward, these findings preclude a significant contribution of cytoplasmic streaming to water ADC, at least in that system.
Applications
The use of ouabain injection to model excitotoxicity in a setting of cerebral ischemia is chosen when a more mechanistic approach to acute neuronal injury is desired than, for example, middle cerebral artery occlusion. Using the ouabain model we have shown that administration of the cannabinoid Δ9-tetrahydrocannabinol (Δ9-THC) or the endocannabinoid anandamide affords protection against excitotoxic acute neuronal injury (van der Stelt et al., 2001a, b). The ouabain model allowed us to study the neuroprotective properties of these compounds in a setting that separates their modulatory effect on glutamatergic transmission from their complex cerebrovascular effects. Interestingly, these experiments underscored the subtle difference between the ouabain and NMDA approach to excitotoxicity studies, in that, while Δ9-THC proved neuroprotective against excitotoxicity elicited via ouabain-injection, it had an adverse effect when excitotoxicity was elicited via NMDA injection (W. B. Veldhuis and M. van der Stelt, unpublished observations, 2001). It has been demonstrated that cannabinoid receptor (CB1) activation can inhibit glutamatergic transmission via closing of N and P/Q-type Ca2+ channels (Gerdeman and Lovinger, 2001; Shen et al., 1996). Because the protection afforded by Δ9-THC was CB1 dependent, the lack of protection in a situation where glutamate-receptor agonists are exogenously supplied compared with after ouabain injection, when their endogenous release is induced, can be explained. This lack of protection of CB1 activation against NMDA-induced excitotoxicity has recently also been shown by Hansen et al. (2002).
CONCLUSIONS
In conclusion, we have shown that inhibition of Na+/K+-ATPase in neonatal animals produces distinct, excitotoxic brain lesions that progress to apparent infarction within 7 days. Ouabain-induced injury is largely dependent on NMDA-receptor stimulation and is comparable to NMDA-induced brain injury. As a model, however, the ouabain approach better reproduces the sequence of events that occurs during ischemia-induced in vivo excitotoxicity, and is therefore better suited for the investigation of these mechanisms. This approach may permit the evaluation of putative neuroprotective drugs not identifiable using the NMDA-injection paradigm, such as those that prevent presynaptic glutamate release and glutamate release due to reversed operation of glutamate transporters.
Footnotes
Acknowledgements
The authors thank G. van Vliet for technical expertise in constructing the purpose-built 31P-NMR coil, R. van Sluis for developing the data-processing software, and H. Veldman for histological expertise.