
Abstract
The glutamate—glutamine shuttle requires a flux of fixed N from neurons to astrocytes. The suggestion that some or all of this N is ammonium has received support from reports that ammonium (as NH+4) rapidly enters astrocytes. Ammonium might also help control astrocyte energy metabolism by increasing lactate production. If ammonium has these functions, then its effect on brain metabolism must be rapid and reversible. To make a minimal test of this requirement, we have followed the time courses of the changes induced by a 4 min venous infusion of 1 mol/L NH4Cl, 2.5 mmol/kg body weight, in rat. Extracellular [NH+4] in cortex, monitored with ion-selective microelectrodes, reached a peak of approximately 0.7 mmol/L 1.65 mins after the end of the infusion, then recovered. Brain metabolites were monitored non-invasively every 4 mins by 1H magnetic resonance spectroscopy. Lactate peak area during the 3.2 min acquisition starting at the end of the infusion was 1.84 ± 0.24 times baseline (± s.e.m., P = 0.009, n = 9). Lactate increased until 13.2 ± 2.1 mins after the end of the infusion and recovered halfway to baseline by 31.2 mins. Glutamate decreased by at least 7.1% (P = 0.0026). Infusion of NaCl caused no change in lactate signal. Cerebral blood flow, measured by arterial magnetization labeling, more than doubled, suggesting that the lactate increase was not caused by hypoxia. At least three consecutive ammonium-induced increases in lactate signal could be evoked. The results are compatible with an intercellular trafficking/signaling function for ammonium.
Introduction
Excessive ammonium toxic to the brain and is the main link between liver failure and hepatic encephalopathy (Felipo and Butterworth, 2002). Partly for this reason, and partly because we are concerned mainly by the transmembrane transport of NH+4 and the allosteric actions of NH+4, we use the term ‘ammonium’ to denote an equilibrium mixture of NH+4 and NH3) At the same time, ammonia is essential to physiological brain function, participating in at least the reactions catalyzed by glutamate dehydrogenase, glutamine synthetase, and glutaminase. It is well established that much of the glutamate released at synapses is taken up by astrocytes, a process lasting, at most, seconds. In the astrocytes, most of this glutamate is converted to glutamine. Glutamine is transferred to neurons where it is deamidated into glutamate (see Bak et al, 2006). This shuttle requires that fixed nitrogen be returned to the astrocytes. Leucine is rapidly taken up into astrocytes in culture and donates nitrogen for the synthesis of glutamate and glutamine (Yudkoff et al, 1996); it has been suggested that there may be a leucine/α-ketoisocaproic acid shuttle between neurons and astrocytes (Lieth et al, 2001). However, this shuttle would tend to reduce, rather than restore, neuronal glutamate: Yudkoff et al (1996) proposed that it may have a long-term homeostatic role, but it could not contribute to the rapid refilling of synaptic vesicles. Alanine might also play a role: after incubation of cultures of astrocytes, neurons or both in various radiolabeled substrates for 4 to 24 h the redistribution of label shows transfer of alanine from neurons to astrocytes, in exchange for lactate (see Bak et al, 2006). However, the long timescale of these experiments suggests again that it is more likely that this process would be involved in long-term maintenance of metabolite levels, rather than in transmitter recycling.
Benjamin and Quastel (1975) made the simplest suggestion: that there is a flux of ammonia itself. There is no direct experimental evidence for this hypothesis, and it has been objected that diffusion of NH3 through cell membranes would both disturb intracellular pH (pHi) and be difficult to regulate (Bak et al, 2006). Recent findings greatly weaken both of these objections. Most relevantly, it has been shown that astrocytes take up ammonium mainly in the NH+4 form (Nagaraja and Brookes, 1998; Marcaggi and Coles, 2001) 1 . Because only approximately 2% of the NH+4 that enters a cell dissociates to NH3 +H+, uptake of NH+4 causes relatively little perturbation of pHi, except in artificial experimental situations, that allow outward shuttling of NH3. In cultured astrocytes, NH+4 appears to enter either through an ion channel, so that rapid entry is facilitated by the membrane potential, or by co-transport with Cl−, which benefits from the inward concentration gradient of Cl−. Ion channels and co-transporters in general are regulated by intra- or extracellular signals. It has also been shown that ammonia enters synaptic glutamate vesicles (Miesenbock et al, 1998), and it is to be expected that, because of their acidity, vesicles will accumulate ammonium, which will then be released into the synaptic cleft by exocytosis together with glutamate (Marcaggi, 2006).
In addition to being a candidate molecule for the transfer of fixed nitrogen from neurons to astrocytes, it has been suggested that ammonium may have another, closely related, physiological role in astrocytes by contributing to stimulation of glycolysis. Several laboratories have suggested that glycolysis in astrocytes is coupled to the activity of glutamatergic synapses (see Pellerin and Magistretti, 2005). This proposal originally stemmed from the observation that lactate release from astrocytes was increased by glutamate (see Pellerin and Magistretti, 2005), but it has subsequently been found that glycolysis is also increased by application of ammonium to astrocytes (Kala and Hertz, 2005) and to glial cells of bee retina (Tsacopoulos et al, 1997), and by ammonium plus glutamate to retinal Müller glial cells (Poitry et al, 2000). In contrast, application of ammonium to neurons does not increase net lactate production (Kala and Hertz, 2005). It has long been known that increased cerebral activity increases brain ammonium concentration (Tsukada, 1966).
Most reports of the effects of ammonium on the brain in vivo have been concerned with chronic hyperammonemia, usually induced by bypassing the liver (Felipo and Butterworth, 2002). Other reports describe measurements made at one time point after an intraperitoneal injection of ammonium (Hindfelt and Siesjö, 1971b; Hawkins et al, 1973; Hindfelt, 1973; O'Connor et al, 1984), or during a maintained constant concentration in the blood (Fitzpatrick et al, 1989). Acute hyperammonemia increases brain lactate concentration (Hindfelt and Siesjö, 1971b; Hawkins et al, 1973; O'Connor et al, 1984; Fitzpatrick et al, 1989), but it is not known whether this indication of increased glycolysis has a rapid onset nor whether it reverses rapidly: these are necessary conditions if ammonium is to be considered as a candidate physiological signal. As a first step toward testing this, we have made new kinds of measurements, with improved time resolution, of changes induced by brief (4 mins) intravenous infusions of ammonium. The authors cited above used acetate as the anion for NH+4. Acetate is taken up into brain and metabolized (Gonda and Quastel, 1966; Oldendorf, 1973), so it will change some metabolite concentrations; we therefore used Cl− as anion. We report the first measurements of changes in brain extracellular [NH+4], ([NH+4]e), and [K+]e, which we recorded continuously, in vivo, by means of triple-barreled ion-selective microelectrodes. We report the first measurements of ammonium-induced changes in metabolite concentrations measured non-invasively by in vivo 1H magnetic resonance spectroscopy (MRS) in a specified volume of the brain (localized MRS), and the first serial MRS measurements, spectra being acquired every 4 mins. In addition, we measured cerebral blood flow, also non-invasively and continuously, by the nuclear magnetic resonance technique of arterial spin labeling. The results show that the increase in [NH+4]e peaks 1.65 mins after the infusion, that the increase in total lactate is well under way by this time, and that this increase is reversible. We show that ammonium infusion leads to vasodilatation, and that it does not significantly perturb homeostasis of [K+]e. We conclude that ammonium merits further investigation both as a possible carrier of fixed nitrogen from neurons to astrocytes, and as a possible physiological signal regulating astrocyte metabolism.
Materials and methods
Animal Preparation
All the procedures involving animals conformed to French Government guidelines (decree no. 87-848 of 19 October 1987; licenses 380321, A3851610004, and B3851610003). Male Wistar rats, 380 to 450 g, were maintained with free access to food (A04, Scientific Animal Food and Engineering, Augy, France). They were anesthetized with 4% isoflurane in air, and anesthesia was then maintained with 1 to 2% isoflurane in air enriched with O2 to 35%. Catheters were introduced in the left femoral vein, for infusion of solutions of NH4Cl or NaCl, and in the left femoral artery for monitoring blood pressure. Rectal temperature was maintained at 37°C with a heating pad under the abdomen. Arterial pressure, ventilation, and rectal temperature were monitored throughout the experiment.
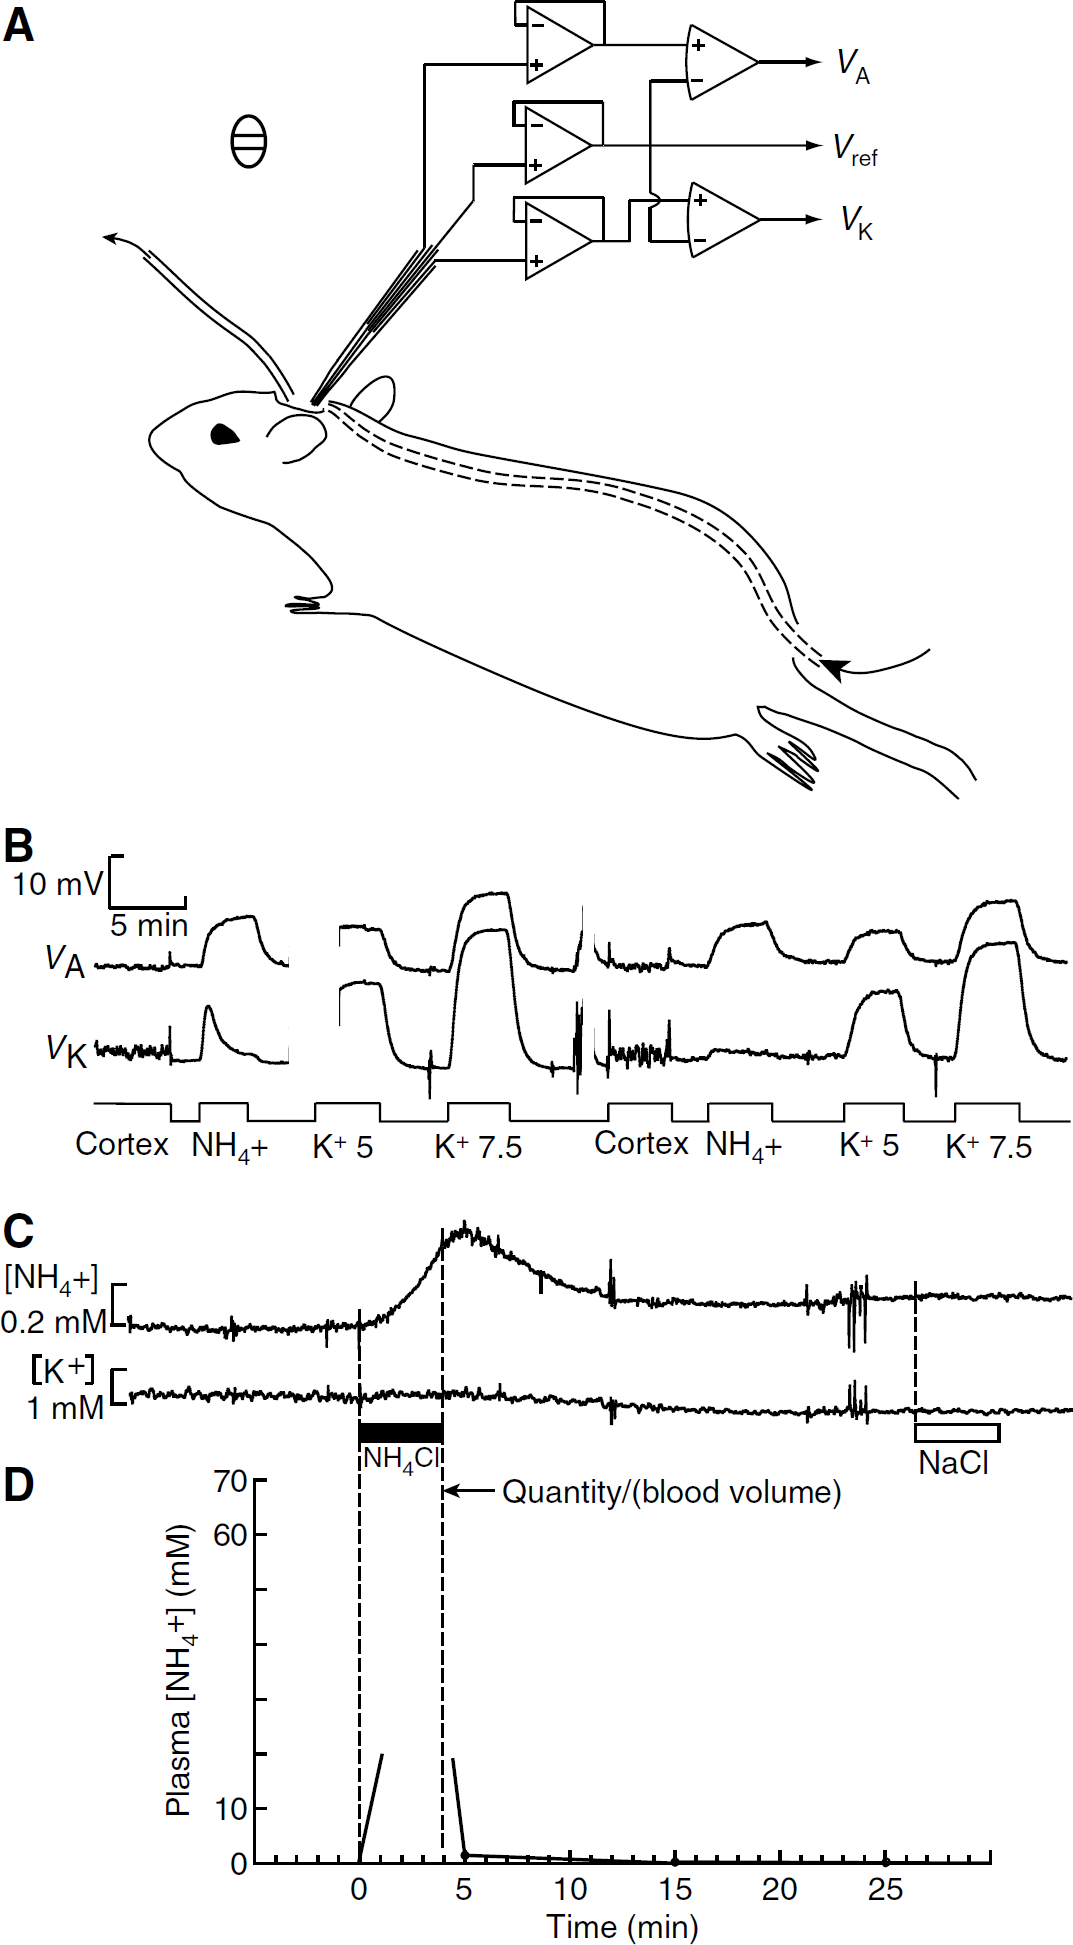
For measurements of brain [NH+4]e, the head of the rat was held by ear bars in a stereotaxic frame (David Kopf Instruments, Tujunga, CA, USA). A midline incision was made and a cranial window (7 mm anteroposterior and 5 mm lateral) was made with a dental drill over the parietal cortex, between the coronal, sagittal, and lambdoid sutures. The dura was retracted to expose the pia. The frame with the rat was placed in a Faraday cage. A pool approximately 2 mm deep was created over the cranial window by gravity-driven inflow and aspirated outflow of Locke solution containing (mmol/L) NaCl, 145; KCl, 2.5; CaCl2, 1.2; MgCl2, 8; N-2-hydroxyethylpiperazine-N′-2-ethanesulfonic acid, 10; pH adjusted with NaOH to 7.3. To bring the temperature of the solution close to the body temperature of the rat, the inflow catheter was passed under the skin from the rump to the neck (Figure 1A). An Ag/AgCl pellet was placed under the skin close to the cranial window, and connected to ground. For some experiments, the Faraday cage was warmed by a flow of hot air. Anesthesia was deepened if necessary by intramuscular injection of a solution containing a mixture of ketamine (100 mg/mL) and xylazine (20 mg/mL), up to 0.1 mL every hour.
Ammonium in blood and brain extracellular space. (
For nuclear magnetic resonance experiments, the rats were tracheostomized and ventilated mechanically. Arterial blood samples were taken before each infusion, and 20 to 30 mins later. Pa
Measurement of the Time Courses of Changes in Brain Extracellular [NH+4] and [K+]
We made recordings of changes in brain [NH+4]e using liquid membrane ion-selective microelectrodes based on an ‘ammonium’ sensor (Bührer et al, 1988, Fluka 09877). This sensor is sensitive to K+ as well as to NH+4, so we made electrodes with three barrels: ‘ammonium,’ reference, and K+. Knowing [K+], we could extract the true [NH+4] from the ‘ammonium’ signal (see below). Triple-barreled microelectrodes were pulled from capillaries with two parallel septa (Figure 1A) and the outer barrels were silanized as described by Coles (1995). The central reference barrel was filled with Locke solution. One outer barrel was back-filled with a highly selective K+ sensor based on valinomycin (Coles and Poulain, 1991), and the other with the ‘ammonium’ sensor. The electrode tips were beveled to an outer diameter of 3.0 to 3.5 μm on a miniature diamond grindstone (De Marco Engineering, Meyrin, CH, Switzerland). The Ag/AgCl wires from the electrode were connected by short wires to three high-input-impedance head-stage voltage followers (Figure 1A). The signals VA and VK were digitized using a Handyscope 3 (TiePie Engineering, Sneek, NL), and stored on a hard disk for analysis off-line. The electrodes had long sensor columns of 7.5 to 11 mm and were sensitive to changes in the temperature difference between the two extremities of the sensor column. To minimize changes in the temperature difference, we (1) calibrated the electrodes immediately after any recording, in solutions flowing over the cortex, (2) warmed these solutions to approximately the body temperature of the rat (Figure 1A), and (3) advanced the electrode tip no more than a few hundred microns into the cortex.
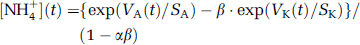
The electrode was attached to the vertical drive of the stereotaxic frame, calibrated in the pool over the cranial window, and inserted approximately 100 μm into the cortex. After the recording, the electrode was withdrawn to the bath and immediately calibrated again (Figure 1B). Calibration solutions were prepared by adding 1 mol/L stock solutions of NH4Cl or KCl to the Locke solution to give solutions with 5 mmol/L K+, 7.5 mmol/L K+,or 1 mmol/L NH+4. In most experiments, infusion of ammonium did not detectably change [K+]e, so [NH+4]e could be calculated from the NH+4 voltage signal (VA(t)) using the NH+4 calibration. In some cases, the valinomycin barrel acquired some sensitivity to NH+4 and/or the ammonium infusion caused a detectable rise in [K+]e. In these cases, we fitted the voltages, VK, for the calibration points of the ‘K+‘ barrel with the equation: VK = SK ln([K+] + α[NH+4]), where SK and α are constants for the electrode barrel. The calibration points for the ammonium barrel were fitted with a similar equation: Va = Sa ln([NH+4] + β[K+]). Hence:
Nuclear Magnetic Resonance Measurements
The rat was placed in a 20 cm horizontal bore, 7 T magnet with actively shielded gradients (Magnex Scientific Ltd, Abington, UK). Sequences were controlled by a SMIS console (Surrey Medical Imaging, Guildford, UK). For MRS experiments, a 25 mm surface coil was positioned above the brain for radiofrequency emission and reception. In separate experiments to measure changes in cerebral blood flow, the rat was placed in a volume quadrature coil. In all experiments, scout spin echo images were obtained (slice thickness 1 mm, repetition time TR = 3 secs, echo time TE = 80 msecs, 128 × 128 pixels, 9 axial and 9 coronal slices). A 4 × 4 × 4 mm3 voxel was selected centered on the striatum. The magnetic field homogeneity was adjusted by an automatic method Fast automatic shimming technique by mapping along projections (FASTMAP); Gruetter, 1993), to obtain a line width in the voxel for water of 15 Hz.
Single Voxel Magnetic Resonance Spectroscopy
For the single voxel MRS, a point-resolved spectroscopy sequence (PRESS) TE = 136 ms was preceded by a variable pulse power and optimized relaxation delays(VAPOR) module for water suppression (Tkac et al, 1999). Repetition time was 3 secs and 64 signals were averaged, giving an acquisition time of 3 mins 12 secs. Before each acquisition, the excitation frequency was re-adjusted to the water resonance frequency. A spectral width of 10 kHz was acquired on 1,024 points, 512 points before the echo maximum, and 512 after it.
Infusion of NH4Cl or NaCl
Magnetic resonance spectroscopy acquisitions were made every 4 mins throughout the experiment. After three acquisitions under control conditions, a 1 mol/L solution of NH4Cl was infused through the femoral vein, using a syringe pump. Each infusion started at the same time as an acquisition and lasted 4.0 mins. The standard quantity was 2.5 mmol/(kg body weight). When, on visual inspection of the spectra, the lactate signal was seen to have fallen back to near its baseline, another infusion was made. Control infusions were made of NaCl (1 mol/L).
In parallel experiments, 0.5 mL blood samples were taken before the infusion, 1 min after the end of the infusion, and then at 10 min intervals. The samples were immediately centrifuged at 4°C and the plasma stored at −20°C. Ammonium concentration was measured by the glutamate dehydrogenase method on a Roche Modular DP analyzer (Hoffman-La Roche, Basel, CH, Switzerland).
Magnetic Resonance Spectroscopy Data Treatment
Data were treated with the program IDL (RSI, Boulder, CO, USA). Signals were broadened with an exponential corresponding to 8 Hz, and zero-filled to 4,096 points. Fourier transformation and phase correction of zero and first orders were performed. Lorentzian line shapes were fitted to the peaks in the real components of the spectra using an in-house algorithm. The peaks fitted were at 1.3 p.p.m. (lactate), 2.0 p.p.m. (mainly N-acetylaspartate (NAA)), near 2.3 p.p.m. (mainly glutamate—see below), 3.05 p.p.m. (creatine phosphate/creatine (tCr)) and 3.2 p.p.m. (choline phosphate/choline (tCho)).
Separation of Glutamate
The 1H signal peak observed near 2.3 p.p.m. included components arising from the resonances of glu, glutamine, NAA and γ-amino butyric acid. Our analysis is described in Supplementary Material. In brief, spectra were obtained in vitro from solutions containing 100 mmol/L of these compounds. The amplitudes of the spectra were then weighted according to concentrations reported in the literature for rat brain, and summed. The results suggested that glutamate contributed about 79% of the area of the 2.3 p.p.m. peak in vivo.
Cerebral Blood Flow
In separate experiments, changes in cerebral blood flow were measured by the continuous arterial water labeling method (Williams et al, 1992). In the presence of a 10 mT/m gradient roughly parallel to the carotid artery, water proton magnetization in the neck region was inverted by applying radiofrequency power during 4 secs at a frequency offset by 8,500 Hz from the resonance frequency. Tissue water magnetization was measured using PRESS in a volume selected to be identical to that for the spectroscopy (4 × 4 × 4 mm3). A control magnetization signal was obtained with identical settings except for a reversed frequency offset. Acquisitions with and without labeling were interleaved, and, for each pair, the signal with labeling was subtracted from the control signal to give a value proportional to the cerebral blood flow. To test the method, CO2 was added to the ventilating gas mixture for 5 mins to give the following composition: air, 60.0%; O2, 34.7%; CO2, 5.3%.
Statistics
Errors are given as s.e.m. P-values were calculated by Student's two-tailed t-test.
Results
Effects of Ammonium Infusion on Brain Extracellular [NH4+] and [K+]
The tip of a triple-barreled ion-selective microelectrode that measured [NH+4] and [K+] was positioned in the solution that flowed continuously over the cranial window, and calibrated in variants of Locke solution. The electrode was then advanced into the parietal cortex to a depth of approximately 100 μm (Figure 1B). Apparent baseline [K+]e varied from rat to rat in the range 2.50 to 3.6 mmol/L (7 sites in 3 rats). Apparent values of baseline [NH+4]e ranged from −0.14 to + 0.9 mmol/L (four rats), suggesting that both systematic and random errors were introduced in the absolute calibration as the electrode tip was moved from the Locke solution into the cortex and back. We made a venous infusion of 2.5 mmol/kg body weight of 1 mol/L NH4Cl over 4 mins. [NH+4]e started to increase within 1 min from the beginning of the infusion, and reached a peak approximately 1.65 mins after the end of the infusion (Figure 1C and Table 1). In contrast, there was little or no change in [K]e (range, 0.00 to 0.12 mmol/L, n = 4) (Figure 1C). [NH+4]e had recovered half way to baseline approximately 3.1 mins after peaking (Figure 1C and Table 1). We tentatively estimate the mean amplitude of the infusion-induced increases to be approximately 0.70 ± 0.19 mmol/L (Table 1). Infusion of 1 mol/L NaCl caused no detectable changes in [K+]e or [NH+4]e (n = 2, Figure 1C).
After the standard infusion of ammonium, the mean plasma concentration had decreased to 1.49 ± 0.32 mmol/L (n = 6) by 1 min after the end of infusion, and to 0.21 ± 0.08 mmol/L by 11 mins (Figure 1D). If all the infused ammonium (2.5 mmol/kg body weight) had remained in the plasma, a volume of approximately 36 ml/kg body weight, its maximum concentration would have been approximately 69 mmol/L. There was, therefore, a rapid clearance of ammonium from the plasma, which is sketched in Figure 1D, and which agrees with the measurements of Cooper and Freed (2005).
Major changes induced by ammonium infusionchar
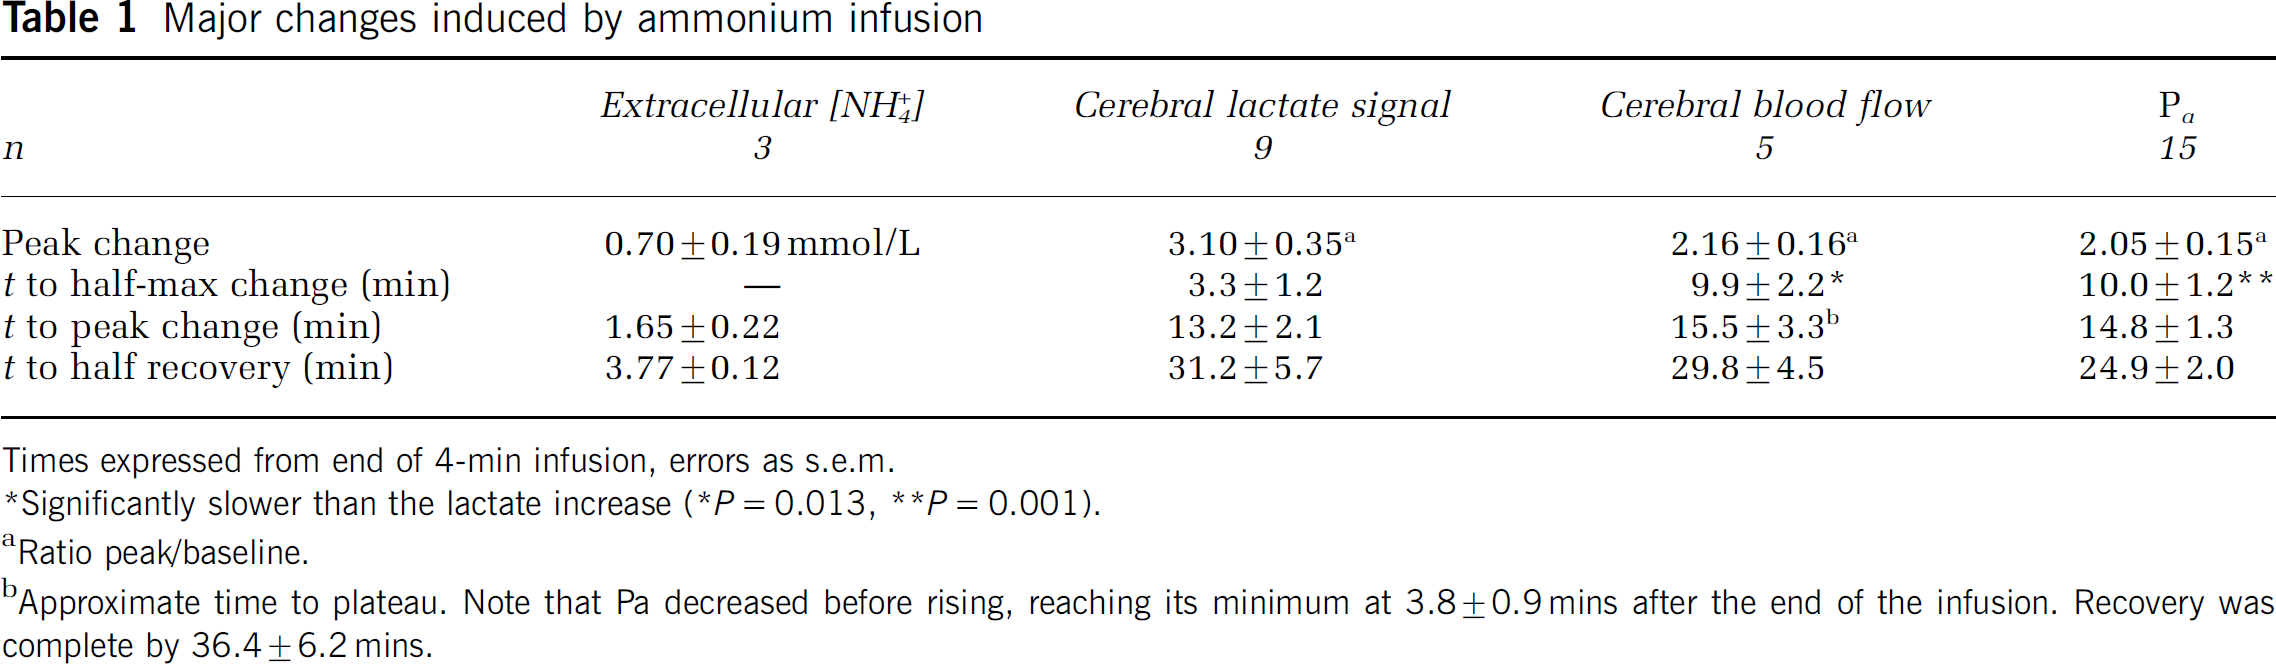
Times expressed from end of 4-min infusion, errors as s.e.m.
Significantly slower than the lactate increase (* P = 0.013, ** P = 0.001).
Ratio peak/baseline.
Approximate time to plateau. Note that Pa decreased before rising, reaching its minimum at 3.870.9mins after the end of the infusion. Recovery was complete by 36.4 ± 6.2 mins.
Ammonium-Induced Changes in Nuclear Magnetic Resonance Metabolite Signals
Figure 2A shows 1H spectra each acquired over 3.2 mins from a 64 μL voxel centered on the striatum. The main identified peaks are tCho, tCr, NAA, and lactate, which appears negative-going because the echo time (136 ms) was the inverse of the spin—spin coupling constant. Analysis described in Supplementary Material suggested that the area of the peak near 2.3 p.p.m. was 79% glutamate. Under control conditions (thin line) the lactate peak was small. The standard infusion of NH4Cl increased the lactate peak, whereas the other peaks hardly changed (heavy line in Figure 2A). Eighty-eight minutes later, the lactate peak had fallen to close to its initial value (dashed line). The areas of the peaks for all the spectra from this experiment were calculated, and four of them are shown as a function of time in Figure 2B. The ordinate scale in Figure 2B (and also Figures 3A and 3B) has been set so that the initial area of the lactate peak (mean of first three acquisitions) is equal to unity. Because the recording conditions remained unchanged throughout each experiment, it was not necessary to normalize the areas with respect to a supposedly constant metabolite, such as NAA.
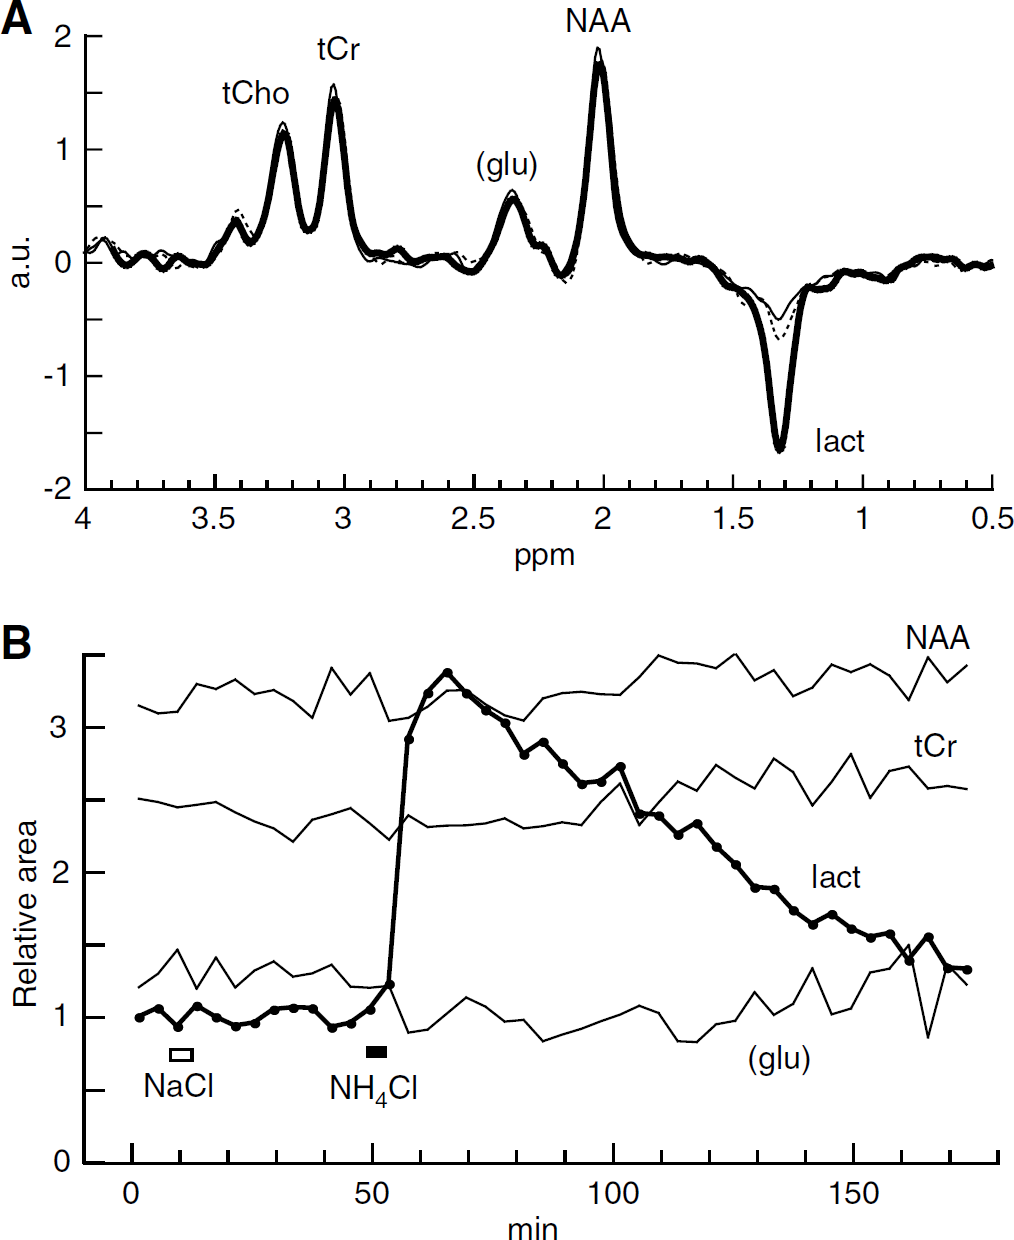
Ammonium increases the lactate signal. ±
After an infusion of NaCl (the same molar quantity as for the NH4Cl infusions; open rectangle in Figure 2B), no marked changes in metabolite signals were apparent in this experiment. This was confirmed in four other experiments: no statistically significant changes were found except for a small decrease in tCr signal (Table 2).
In contrast, an infusion of NH4Cl (full rectangle in Figure 2B) caused a marked increase in the lactate peak area. During the 3.2 mins acquisition which started immediately at the end of the infusion, this increase was well established: the mean lactate peak area was then greater than baseline by a factor of 1.84 ± 0.25, P = 0.009, n = 9. Lactate stopped increasing approximately 13 mins after the end of the infusion and then promptly started to fall back toward the baseline (Table 1). The ammoniuminduced changes in the peak areas of other metabolites were too small to detect in a single experiment, although, in Figure 2B, a possible small decrease in the peak area corresponding mainly to glutamate is apparent. To obtain average fractional changes, we calculated the average value of the peak areas for the acquisitions starting at 8, 12, and 16 mins after the infusion, and compared this with the average for the three acquisitions before the infusion. For the 2.3 p.p.m. peak, there was a mean decrease of 7.1% (see Table 2) a change in the direction reported previously for glutamate (Hindfelt and Siesjö, 1971b; O'Connor et al, 1984; Bates et al, 1989; Fitzpatrick et al, 1989; Zwingmann et al, 2003). There was also a significant increase in the NAA peak area, but this change, like the decrease at 2.3 p.p.m., was very small compared with the increase in the lactate peak area (Table 2).
Changes in metabolite peak areas
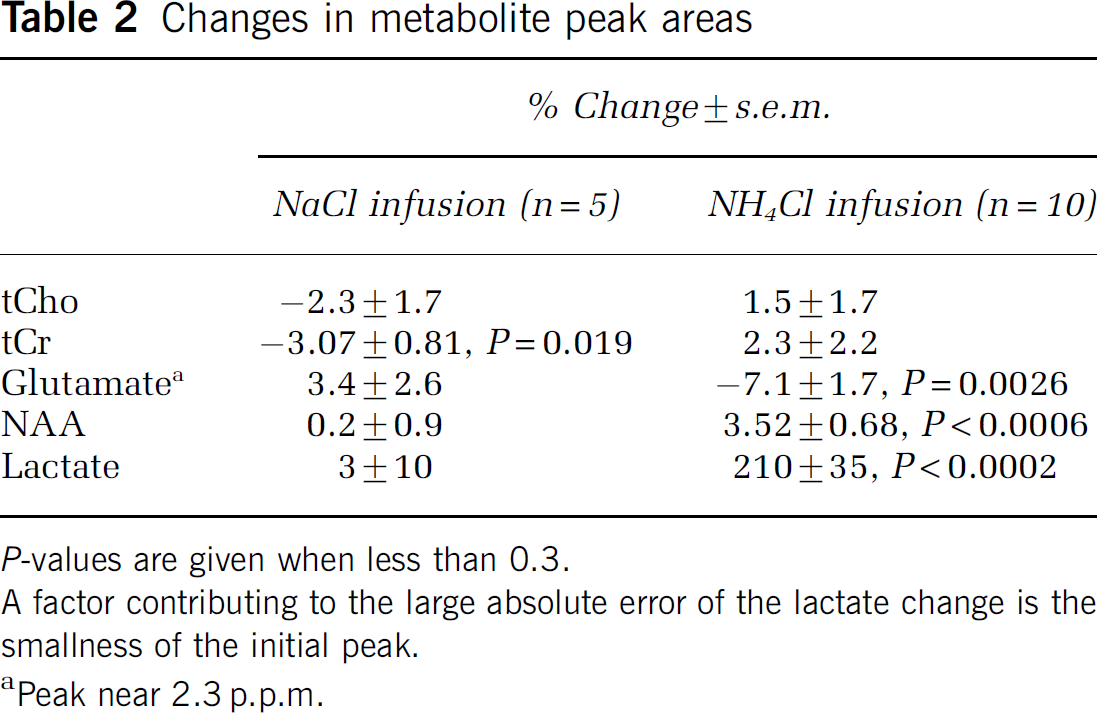
P-values are given when less than 0.3.
A factor contributing to the large absolute error of the lactate change is the smallness of the initial peak.
Peak near 2.3 p.p.m.
Figure 3A shows results from an experiment in which a second infusion of NH4Cl was made after the lactate signal had recovered from the first. This second infusion again produced a large increase in lactate signal. A third infusion of a smaller quantity of NH4Cl (20% of the standard infusion) produced a smaller increase. A slow increase over 3.5 h in baseline lactate is seen in Figure 3A. However, no increase in baseline was observed in 3 out of 8 experiments. The ammonium-induced increases in lactate peak area are shown for nine infusions (from seven rats) in Figure 3B. A 10th result, in which the signal was small and noisy, is not shown.
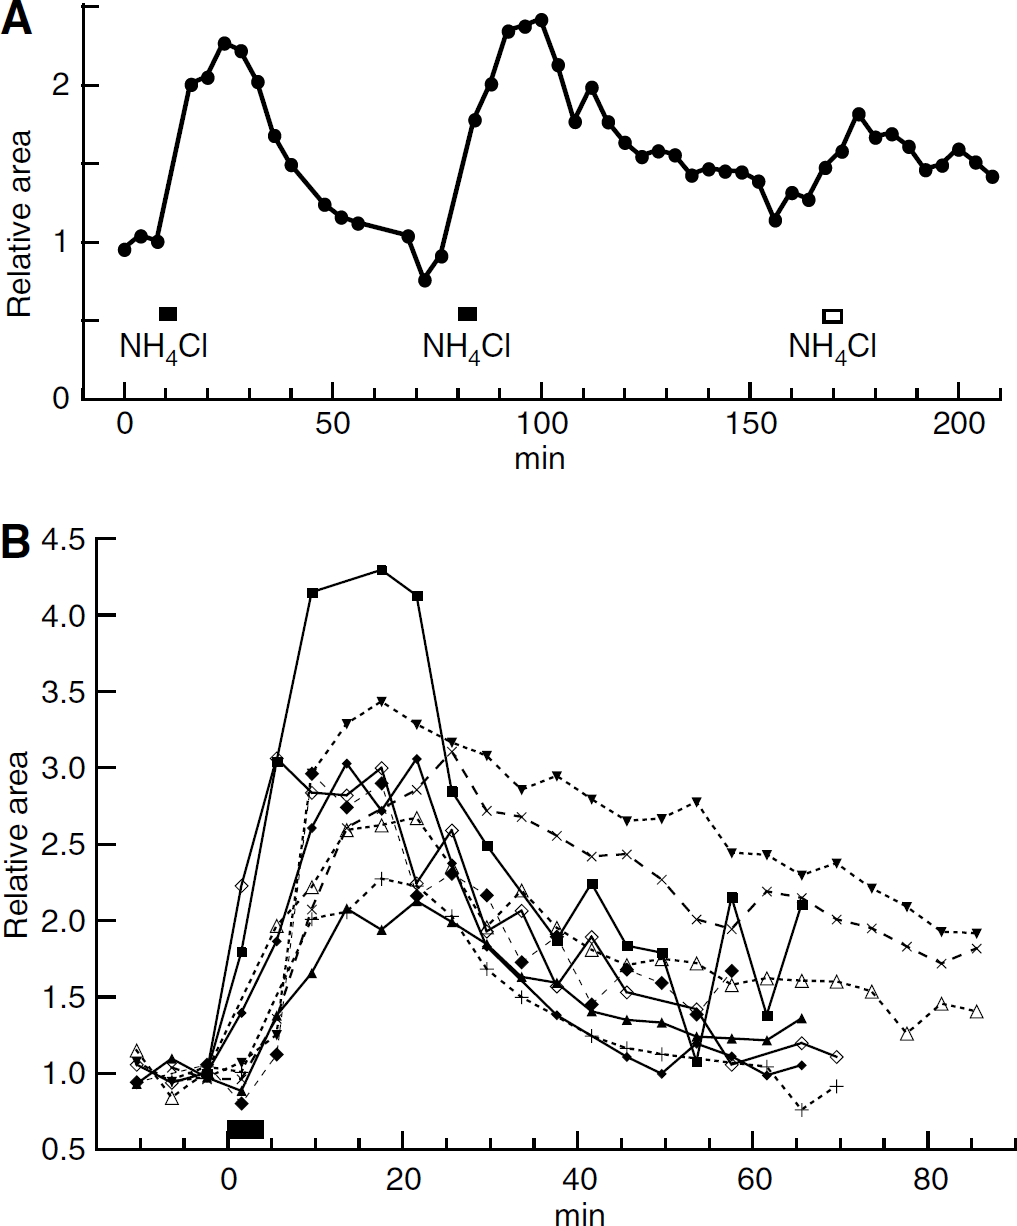
(
The Ammonium Infusion Increased Cerebral Blood Flow
A decrease in cerebral blood flow can cause an increase in lactate concentration (Petroff et al, 1985). To test whether this could be a possible cause of the ammonium-induced increase in lactate signal, we monitored cerebral blood flow by arterial water proton magnetization labeling. We first checked that, in our hands, the arterial labeling technique detected changes in perfusion, by inducing hypercapnia. Addition of CO2 to a concentration of 5.3% to the air/O2 mixture increased the perfusion signal, the mean peak response being 2.45 times the baseline (Figure 4A). This is in quantitative agreement with the results of Williams et al (1992). Infusion of ammonium with the same protocol as for the MRS also increased perfusion, on average to 2.16 times the baseline (Figure 4C and Table 1).
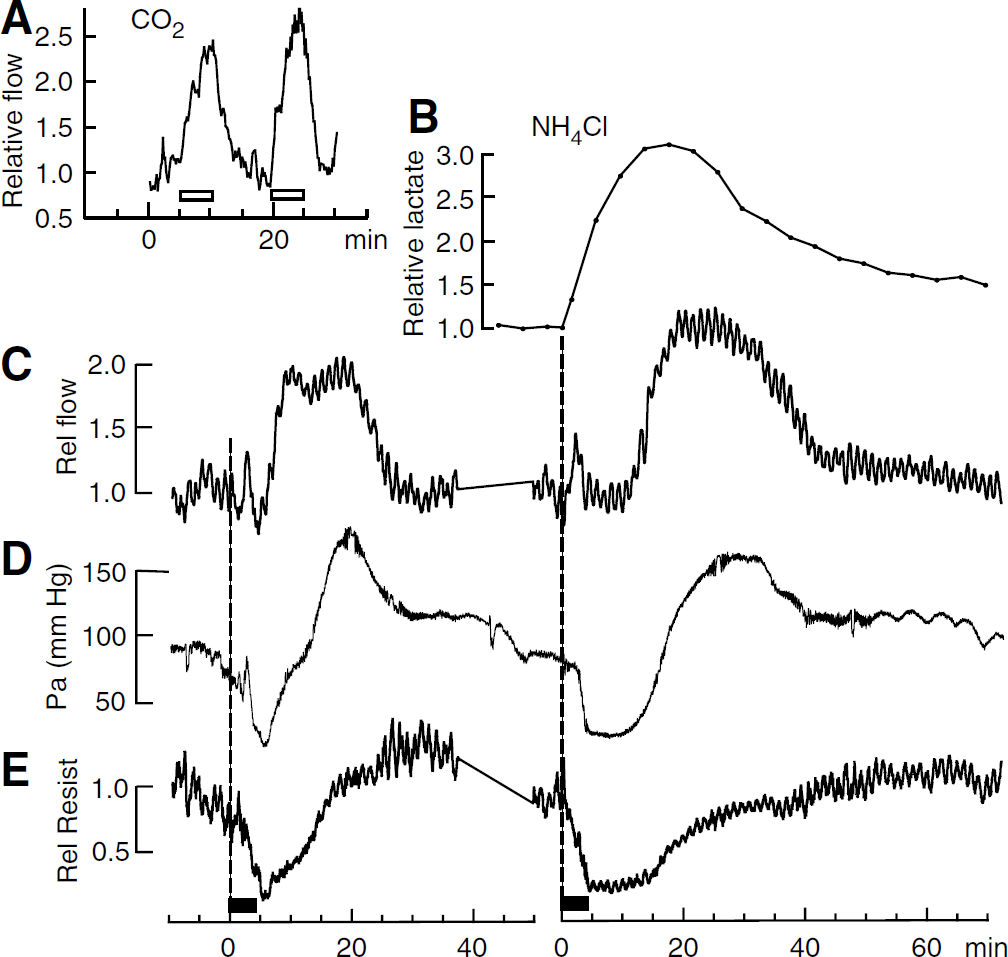
Hemodynamic changes. (
Blood Pressure and Vascular Resistance
The infusion of NH4Cl caused transient changes in mean arterial blood pressure (Pa). In 15 infusions out of 20 there was a decrease followed by an increase, as illustrated in Figure 4D. The mean initial Pa was 92 ± 5 mm Hg; it decreased to a mean minimum of 43 75mm Hg, n = 15 and rose to a mean maximum of 172 ± 7 mm Hg. Parameters summarizing the mean time courses of the changes are given in Table 1. In the experiments in which cerebral blood flow was measured, it was seen that in the face of reduced Pa, blood flow was well regulated for the first 5 to 10 mins (Figures 4C and 4D). The decrease in vascular resistance responsible for this regulation is illustrated in Figure 4E. Pa then recovered more rapidly than did the vascular resistance so that blood flow increased before Pa was above normal (Figure 4C to 4E).
In contrast to infusion of NH4Cl, infusion of 1 mol/L NaCl caused no decrease in Pa, only a variable increase (15 and 55 mm Hg in two rats). These increases peaked at 4 and 7 mins after the end of the infusion, and the recoveries were complete at 27 and 33 mins.
In agreement with Hindfelt and Siesjö (1971a), infusion of either NH4Cl (n = 10) or NH4 acetate (n = 1) caused little change in plasma pH (a decrease by 0.1 U at 25 mins after the end of the infusion). Weyne ef al (1970) have shown that decreasing blood pH reduces brain lactate concentration, so the observed change in plasma pH may have partly counteracted the ammonium-induced increases in lactate. Infusion of NaCl did not change plasma pH by more than 0.05 U.
Discussion
The Ammonium-Induced Increase in Brain Lactate
A small change in a MRS peak area can arise from causes other than a change in metabolite concentration, as discussed below. However, in the case of the lactate peak, the response to ammonium infusion was an increase by, on average, more than 200%, and this increase can safely be attributed to a corresponding increase in lactate concentration (Table 2). This increase is larger than the increases reported previously for injections of comparable quantities of NH+4 (Hindfelt and Siesjö, 1971b; Hawkins et al, 1973; O'Connor et al, 1984). This may be because these previous workers delivered the ammonium by intraperitoneal injection, rather than venous infusion, and measured lactate at only one time, so a transient peak might have been missed. Another difference was their use of a metabolizable anion, acetate, whereas we used Cl−.
An increase in lactate was already apparent in the 3.2 min MRS acquisition that started at the beginning of the ammonium infusion (Figure 4B). After the end of the infusion, net lactate production continued for an additional 13.2 mins (Table 1). By this time, [NH+4]e had recovered to a steady level (Figure 1C), but any free intracellular ammonium would necessarily have taken longer to leave the cells.
After reaching its peak, brain lactate concentration decreased relatively slowly. The concentration reflects the balance of production, consumption, and efflux to blood and we cannot specify the relative contributions of these three processes. However, some 20 to 40 mins after the peak of the lactate signal, the brain did return to a state where a second, or third, infusion of ammonium produced similar metabolic effects (Figure 3A).
Infusion of a solution containing no hemoglobin (such as the NH4Cl solution) might be expected to lead to significant hypoxia with a consequent increase in lactate. This possibility can be ruled out by the absence of effect of the control infusions of NaCl solution on the lactate signal. The solutions were infused at a rate of only approximately 1.7% of the blood volume per minute, so this apparent lack of hypoxia is not surprising.
The observed increase in blood flow is compatible with the conclusion of Hindfelt and Siesjö (1971a) that hyperammonemia does not lead to hypoxia. It is also known that infusion or injection of quantities of ammonium similar to our infusions does not decrease high-energy phosphates (Hindfelt and Siesjö, 1971b; Hawkins et al, 1973; Fitzpatrick et al, 1989).
The Ammonium-Induced Changes in Peak Areas for Glutamate and N-Acetylaspartate
Ammonium infusion induced statistically significant changes in the MRS peak areas for NAA and for the peak near 2.3 p.p.m., which was mainly glutamate (Table 2). Because these changes were relatively small, we could not immediately assume that they represented changes in metabolite concentration. Our repetition time of 3 secs was about twice the longitudinal relaxation time, T1, of typical proton resonances from metabolites at 7 T, so longitudinal magnetization had not completely decayed between measurement sequences, and a decrease in T1 for any proton resonance would have increased the corresponding peak area. The effect of a change in the transverse relaxation time, T2, is in the opposite direction: the signal from each metabolite decays with time constant T2 during the echo time, and since our echo time of 136 ms was in the range of proton T2 reported for metabolites, the peak area would decrease if T2 decreased. We cannot be certain that T1 and T2 for metabolite protons did not change after ammonium infusion, for example, as a result of edema. However, any changes are likely to be in the same direction for all metabolites, so effects of this kind would not account for both the increase in NAA peak area and the decrease in the area of the peak at 2.3 p.p.m. Artifactual increases in apparent peak areas can also be observed if blood flow increases more than oxygen consumption, resulting in a decrease in the deoxyhemoglobin concentration. Deoxyhemoglobin causes heterogeneity of the magnetic field and widening of the spectral peaks, so reducing deoxyhemoglobin narrows the peaks and can make them appear larger. (Zhu and Chen, 2001). The values given in Table 2 for the ammonium-induced changes in peak areas were measured during the time (8 to 19.2 mins after the infusion) when blood flow was increasing, principally as a consequence of increasing Pa (Figures 4C and 4E). We find no report of the effect of ammonium infusion or injection on brain oxidative metabolic rate except that of Hawkins et al (1973). These authors reported an increase in the arteriovenous difference of O2 of 35%, but their rats had been starved for 48 h, and the anion for ammonium was acetate, which is a substrate of energy metabolism (Gonda and Quastel, 1966); the sudden arrival of metabolic substrate might have stimulated oxidative metabolism. In any case, the 116% increase in blood flow that we observed was much greater than the possible increase in oxygen consumption, so there may indeed have been a decrease in deoxyhemoglobin concentration, and a consequent apparent increase in peak area. The mean ammonium-induced changes in the areas for the three peaks, tCho, tCr, and NAA, were all positive compared with the changes induced by NaCl (see Table 2), as would be expected if a reduction in deoxyhemoglobin were the cause. In conclusion, we cannot exclude the possibility that the increase in NAA peak area was artifactual.
In contrast to the other four peaks studied, the peak at 2.3 p.p.m., which we estimate to be 79% glutamate under normal conditions (see Supplementary Material), was significantly reduced by ammonium. We can therefore be confident that glutamate decreased, in agreement with previous reports that hyperammonemia decreases glutamate (Hindfelt and Siesjö, 1971b; O'Connor et al, 1984; Bates et al, 1989; Fitzpatrick et al, 1989; Zwingmann et al, 2003). Quantitatively, the decrease in glutamate concentration would have been somewhat greater than the 7.1% decrease in the peak area. One reason is that glutamine, which makes a small contribution to this peak, increases in hyperammonemia (Hawkins et al, 1973; O'Connor et al, 1984; Bates et al, 1989; Fitzpatrick et al, 1989; Zwingmann et al, 2003). The other is that there may have been a decrease in deoxyhemoglobin, which would lead to overestimation of the peak area and hence to underestimation of the decrease in concentration.
How Does Ammonium Increase Lactate Production?
Lactate production is determined by the reaction:

All three of the reactants are produced by glycolysis and all three are consumed by the tricarboxylic acid cycle coupled to oxidative phosphorylation. Hence, lactate production increases if the glycolytic flux increases relative to oxidative phosphorylation.
Acute moderate hyperammonemia increases cerebral ATP consumption in several ways. It leads to incorporation of ammonia in glutamine by a reaction that requires ATP (Cooper et al, 1979). The major route of uptake of NH+4 by astrocytes is inhibited by barium and is presumably via an ion channel (Nagaraja and Brookes, 1998; Marcaggi and Coles, 2001), so ATP will be required to restore the membrane potential. Other energy-requiring pathways, such as the NMDA receptor-coupled nitric oxide—cyclic GMP signal transduction pathway, are also activated (Felipo and Butterworth, 2002). To balance the increase in ATP consumption, ATP production must increase, and this requires an increase in glycolytic flux. In vitro, ammonium activates at least three enzymes of the glycolytic pathway: hexokinase, phosphofructokinase, and pyruvate kinase (Muntz and Hurwitz, 1951), and this effect may contribute to the stimulation of glycolysis in vivo (Hawkins et al, 1973).
Thus, acute moderate hyperammonemia must certainly increase glycolysis, but what is its effect on oxidative phosphorylation? Since oxidative phosphorylation produces most of the ATP in a cell (approximately eight times as much as glycolysis), and total ATP production increases, it would take a very large increase in glycolysis to compensate for a small decrease in oxidative phosphorylation. There is no evidence for a decrease in oxygen consumption, and the observation that blood flow increases (Figure 4C) tends to argue against this. Nevertheless, two mechanisms have been described by which acute moderate hyperammonemia is likely to inhibit oxidative phosphorylation. First, ammonium may have a direct effect since it inhibits the α-ketoglutarate dehydrogenase complex of the tricarboxylic acid cycle (Lai and Cooper, 1986). Second, ammonium may have an indirect effect via the reduction in glutamate concentration observed by us (Table 2) and by others (Hindfelt and Siesjö, 1971b; O'Connor et al, 1984; Bates et al, 1989; Fitzpatrick et al, 1989; Zwingmann et al, 2003). The main cause of this decrease is presumably the conversion of glutamate into glutamine by the astrocyte-specific enzyme glutamine synthase (Cooper et al, 1979; Waniewski, 1992). The decrease in glutamate estimated from our measurements was only about 7% (Table 2), which seems too small to have a major effect. However, within the astrocytes, the fractional reduction in glutamate will be greater. The astrocyte glutamate pool has been estimated to be 15.5% of the total (Van den Berg and Garfinkel, 1971), so a 7.1% decrease in total glutamate corresponds to a 47% decrease in the astrocytic glutamate pool. A fall of this magnitude is expected to inhibit the malate/aspartate shuttle across the inner mitochondrial membrane, and, in astrocytes cultured from neonatal mice, Kala and Hertz (2005) concluded, from the effect of glutamate on the pyruvate/lactate ratio, that this was indeed the case. However, it has been reported that adult rat brain, such as we used, appears to have few aspartate—glutamate carriers compared with the neonate (Ramos et al, 2003).
We conclude that the main effect of acute moderate hyperammonemia on energy metabolism is stimulation of glycolysis. Our measurements do not allow us to decide whether this was associated with an inhibition of oxidative phosphorylation, although some inhibition appears likely.
Is there a Neuron-Astrocyte Flux of Ammonium?
Concepts of how ammonium moves in and out of cells have been revolutionized by the discovery of specific ammonium transporters. Two genes of the Rh family, which code for ammonium-transporting proteins, are widely expressed in murine brain (www.brainatlas.org/aba). A Cl−-dependent transporter selective for NH+4 against K+ has been described on glial cells in the bee (Marcaggi et al, 2004), and astrocytes take up ammonium in the NH+4 form by routes that can be blocked by Ba2+ or bumetanide (Nagaraja and Brookes, 1998; Marcaggi and Coles, 2001). The two main other candidates for transfer of fixed nitrogen from neurons to astrocytes, leucine, and alanine, appear to be unsuitable for rapidly replenishing neuronal stocks of glutamate: a leucine/α-isocaproic acid shuttle between neurons and astrocytes would reduce, rather than restore, neuronal glutamate (Yudkoff et al, 1996), and the localizations of the different membrane transporters of alanine appear to be more appropriate for a flux from astrocytes to neurons (Marcaggi and Attwell, 2004). The original suggestion of Benjamin and Quastel (1975) that ammonium is the carrier, merits further experimental investigation. Ammonium has the additional attraction that, like glutamate, it is also a signal that increases lactate production (Figure 5).
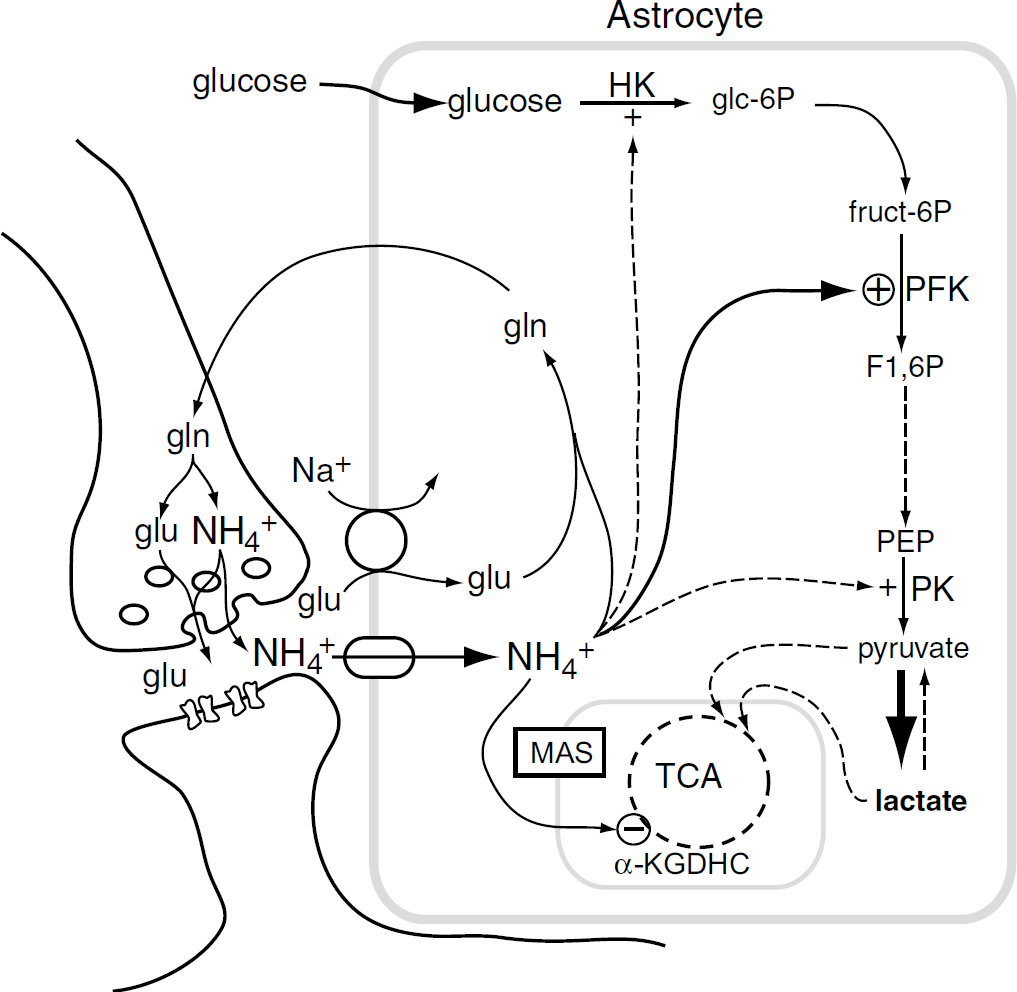
Scheme of some known actions of ammonium on brain energy metabolism. Ammonium is produced in neurons when glutamine (gln) is deamidated to glutamate (glu) and it is taken up into astrocytes on channels and transporters. Within the astrocyte, ammonium activates hexokinase (HK), phospho-fructokinase (PFK), and pyruvate kinase (PK), and inhibits the α-ketoglutarate dehydrogenase complex (α-KGDHC). This leads to accumulation of lactate, which may leave the cell. Pyruvate, or lactate, enters the mitchondria. The ammonium-induced reduction in astrocyte glutamate might impede the malate-aspartate shuttle (MAS) across the mitochondrial membrane (Kala and Hertz, 2005). See text for other references. It has been suggested that at least some ammonium in nerve terminals is exocytosed together with glutamate (Marcaggi, 2006).
Footnotes
Acknowledgements
We thank Drs Serge Bottari and Jean-Charles Renversez for the plasma ammonium analysis, and Dr Chantal Rémy for invaluable advice.
1
Ammonium in solution at 37°C reaches an equilibrium mixture of the NH+4 and NH3 forms within milliseconds. At physiological pH values, the solution then contains > 98% NH+4 and < 2% NH3 (see Marcaggi and Coles, 2001; Cooper and Freed, 2005).
References
Supplementary Material
Please find the following supplemental material available below.
For Open Access articles published under a Creative Commons License, all supplemental material carries the same license as the article it is associated with.
For non-Open Access articles published, all supplemental material carries a non-exclusive license, and permission requests for re-use of supplemental material or any part of supplemental material shall be sent directly to the copyright owner as specified in the copyright notice associated with the article.