
Abstract
Serotonergic system abnormalities have been implicated in major depression, suicide, violence, alcoholism, and other psychopathologies. The prolactin response to fenfluramine has been widely used as a neuroendocrine probe to study brain serotonin responsivity. We have extended this methodology by using the positron emission tomography (PET) 18F-fluorodeoxyglucose (18FDG) method to examine the fenfluramine-induced changes in regional cerebral glucose metabolism (rCMRglu), an indicator of changes in regional neuronal activity. We report results on 16 healthy controls, each of whom underwent two PET studies. One group of six subjects had a placebo on day 1 and a single 60 mg oral dose of fenfluramine on day 2. The second group, of 10 subjects, was tested on two consecutive occasions without drug or placebo. Data were analyzed for significant rCMRglu changes on day 2 vs day 1 using the statistical parametric mapping method (p < 0.01). Subjects who did not receive drugs showed no statistically significant areas of rCMRglu increase or decrease on day 2 versus day 1. In contrast, the group that received fenfluramine showed significant fenfluramine-induced responses. Areas of rCMRglu increases involved mainly the left prefrontal and left temperoparietal cortex. Within the prefrontal cortex, two major areas of rCMRglu increase included, first, an area centered on the anterior cingulate and, second, an area in the lateral prefrontal cortex involving principally the inferior, middle, and superior frontal gyri. Some decreases in rCMRglu were observed, principally in the right hemisphere. This PET-fenfluramine paradigm is a potentially useful method for studying abnormalities of serotonin function in the prefrontal cortex.
Important relationships have been found between altered serotonergic function and suicidal behavior (Arango et al., 1990; Arango and Mann, 1992; Åsberg et al., 1986; Mann and Arango, 1992), aggression (Brown et al., 1979, 1982), depression (Coppen, 1969; Coppen et al., 1972; Åsberg et al., 1984), obsessive-compulsive disorder (Hollander et al., 1992), alcoholism (Ballenger et al., 1979; Sellers et al., 1992), anxiety disorders (Charney et al., 1990), and schizophrenia (Meltzer and Nash, 1991; Krystal et al., 1993). Studies of the serotonergic system in humans (Mann et al., 1992) have been confined to indirect assessments, including measurement of serotonin-related proteins in platelets, cerebrospinal fluid (CSF) levels of 5-hydroxyindoleacetic acid (5-HIAA) and neuroendocrine challenge tests. None of these methods has identified the regional brain changes involving the serotonergic system. One way in which a single transmitter system such as the serotonergic system can contribute to the pathophysiology of so many psychiatric disorders is to be altered in specific brain regions relevant for each of these psychiatric disorders. Regional localization of altered serotonergic function could result from loss of target neurons or via local modulatory effects upon serotonin release or activation of postsynaptic receptors. We therefore sought to identify a method for studying regional brain serotonergic responsivity in vivo in human subjects.
The approach we tested involved use of a serotonergic challenge agent that activated the serotonergic system; we then detected effects of that activation by positron emission tomographic (PET) imaging of regional cerebral glucose metabolism (rCMRglu) (Sokoloff et al., 1977; Sokoloff, 1978). Such a method would potentially permit studies of regional brain effects of serotonergic activation in human subjects that could be applicable to clinical studies.
The most widely used serotonergic challenge agent has been DL-fenfluramine (McBride et al., 1990), and investigators have identified correlations of lower prolactin responses to fenfluramine with aggressivity (Coccaro et al., 1989), depression (Siever et al., 1984), and suicidal behavior (Coccaro et al., 1989; Mann et al., 1992). Significant age and gender effects have also been reported (McBride et al., 1990). We have found that the prolactin response to fenfluramine correlates with CSF levels of 5-HIAA in depressed patients (Mann et al., 1992), and Cocarro and colleagues (1993) have reported a high correlation between prolactin response to D-fenfluramine (selective for the serotonin system) and DL-fenfluramine (not known to be as selective for the serotonin system), providing further evidence that this index is related to serotonergic function. Since DL-fenfluramine is the most widely used serotonin challenge agent in the psychiatric literature, we chose to use this drug in a study employing PET 18F-fluorodeoxyglucose (18FDG) imaging of rCMRglu as an index of regional neuronal responses to serotonin activation stimulated by fenfluramine in healthy controls. In one group of subjects, PET images after fenfluramine were contrasted to PET images on the placebo day. The findings were compared to results in a second group of controls, who were scanned after FDG administration on two separate days without drug or placebo on either day, and then the images from those two days were tested for change.
METHODS
Sixteen healthy controls were screened from responses to newspaper advertisements and medical center announcements. All subjects gave written informed consent as required by the Institutional Review Board for Biomedical Research. All female subjects had a serum pregnancy test immediately prior to each PET scan to confirm that they were not pregnant at the time of scanning. Six subjects participated in the fenfluramine group undergoing a PET study on day 1 (placebo administration) and a day 2 PET study following fenfluramine administration. Each of these subjects was free of significant Axis I or Axis II psychopathology as assessed by the Structured Clinical Interview (SCID I; Spitzer et al., 1989) and the Personality Disorder Examination (PDE; Loranger et al., 1991). These subjects also received a complete medical history and physical examination and underwent blood tests, an electrocardiogram (ECG), a urine analysis, and a drug screen to rule out any medical disorder or substance abuse. The fenfluramine group consisted of four men and two women. The mean age was 26.7 ± 10.3 years. All subjects had graduated from high school and all but one had completed or partly completed college. The other 10 subjects participated in the norfenfluramine or no-drug comparison group, undergoing PET studies on two separate days without drug or placebo on either day. These subjects were part of a separate protocol studying the effects of repeat FDG studies on two separate days. They were free of any significant medical and psychiatric disorders based on a screening interview. The nonfenfluramine comparison group consisted of five men and five women. The mean age was 25.4 ± 7.7 years. All but one subject had completed some college. Thus the fenfluramine and the no drug groups did not differ on these demographic variables.
Subjects in the fenfluramine group were admitted to the NIH General Clinical Research Center at the University of Pittsburgh Medical Center on the afternoon prior to commencing the study. Subjects were fasted from midnight on each of the two nights prior to study. At 8:00 AM the next day, a heparin lock was inserted and the subject was transported to a study room in the PET center. After a 45-min accommodation period in the room, the first blood sample was taken 15 min before administration of placebo, and then a second baseline sample was taken immediately before placebo. The placebo pills were identical to fenfluramine. The study design was single-blind such that the patient was unaware of the identity of the medication. Blood samples taken 15 min before and immediately before drug or placebo administration were for prolactin levels. Subsequently, hourly blood samples were taken for 5 h for prolactin levels as well as for fenfluramine and norfenfluramine levels. All samples were coded and laboratory staff were not aware of the experimental conditions. Vital signs were measured throughout. Levels of fenfluramine and norfenfluramine were assayed by high-performance liquid chromatography (HPLC) as previously reported (McBride et al., 1989, 1990). Prolactin levels were assayed using an immunoradiometric assay kit purchased from Hybritech (McBride et al., 1989, 1990). The lower level of sensitivity of the prolactin assay was 0.3 ng/ml and interassay coefficient of variation was 4%. Results of prolactin responses at each time point were calculated as the difference between the prolactin response on the fenfluramine day and the prolactin level on the placebo day at each time point. 18FDG was injected (as described below) 3 h after drug or placebo administration. On the second morning, an identical procedure was followed except that the subject received 60 mg of fenfluramine instead of placebo. Subjects in the nonfenfluramine comparison group were instructed to fast for 6 h prior to their PET studies. These subjects arrived at the PET center approximately 1 h prior to their PET studies and had an intravenous catheter for FDG injection placed at that time.
The PET scanning technique was identical for all subjects. Studies were conducted with a Siemens EC AT 951r/31 scanner (Siemens Medical Systems Inc., Hoffman Estates, IL, U.S.A.). Subjects lay supine on the scanning table with the head comfortably positioned on the head holder. An individually molded, thermoplastic mask was placed over the head and face and attached to the head holder to minimize head movement. The head was then positioned such that the lowest scanning plane (visualized by a system of laser lines within the scanner gantry) was parallel to, and 1.0 cm above, the canthomeatal line. The gantry's system of laser lines was used to mark the mask with ink in five distinct places for checks of head movement during the scanning session. For the subject's second PET study, the head was positioned as close as possible to the position of the first study and the original mask with its ink markings was reused to facilitate this process. Once the head was appropriately positioned, a 10-min transmission scan was obtained utilizing the scanner's three retractable rotating 68Ge/68Ga rods. The transmission scan was followed by intravenous bolus injection of 10 mCi of 18FDG. This was followed by a 40-min distribution phase and then a 45-min emission scan. During the first 30 min of the distribution phase, all subjects were instructed to fixate on a central cross-hair on an otherwise blank video monitor positioned perpendicular to the subjects' line of vision. Five of the nonfenfluramine comparison group also repeated single words delivered by a tape recorder at a rate of one every 2 s during this 30-min period of both PET studies. All other subjects were given no additional instructions or tasks during this time. After the first 30 min of the distribution phase, all subjects were instructed to close their eyes and relax for the remainder of the uptake period and the duration of the emission scan. Since we were interested in relative rCMRglu changes on day 2 vs. day 1, rather than absolute rCMRglu values, arterial or arterialized venous blood samples were not obtained.
Relative rCMRglu was estimated by the distribution of radioactive counts from the emission scan. After attenuation correction (measured by the transmission scan), the emission data were reconstructed as 31 transaxial images (Hanning cutoff frequency of 0.4 cycles/pixel).
The day 1 scan was oriented to the midline vertical plane. This involved centering left vs. right and rotating in the coronal and transverse planes such that the midsagittal plane corresponded to the midline of the image field. This was performed using the approach validated by Minoshima et al. (1991) and modified to use the algorithm of Woods et al. (1992) for iterative optimization and image interpolation. The day 2 scan was then mathematically aligned to the day 1 scan using the automated software algorithm Automated Image Registration (Woods et al., 1992). Significant group differences in relative rCMRglu on day 2 vs. day 1 were identified using statistical parametric mapping (Friston et al., 1991). This technique involves the following: (a) converting the pair of images for each subject (since the images are aligned, transformation is calculated from the first image and applied to both) to a standard stereotaxic atlas space (Talairach and Tournoux, 1988); (b) convolving the images with a low-pass filter to increase the signal-to-noise ratio; (c) removing confounding effects of differences in global rCMRglu by analysis of covariance; (d) calculating a day 1 and day 2 adjusted mean rCMRglu and error variance for each pixel in the stereotaxic atlas space; (e) comparing the means between day 1 and day 2 on a pixel-by-pixel basis using the t statistic; and (f) constructing a whole-brain parametric map distributed according to the t values (displaying all pixels significant at p < 0.01). Regions of rCMRglu change were considered significant, and hence reported herein, based on the following criteria: (a) omnibus significance of the comparison at p < 0.001 (based on a χ2 analysis comparing the expected vs. observed number of pixels above a significance at p < 0.01) and (b) presence of a contiguous group of pixels (all significant at p < 0.01 and at least some pixels with a z score >3 or at ∼p < 0.001) overlying the region and extending over more than one transverse plane. By combining the significance level of p < 0.01 for a contiguous area with p < 0.001 for individual pixels within that area, we are able to maintain greater stringency for statistical significance with the ability to better visualize the pattern and extent of the areas of change.
RESULTS
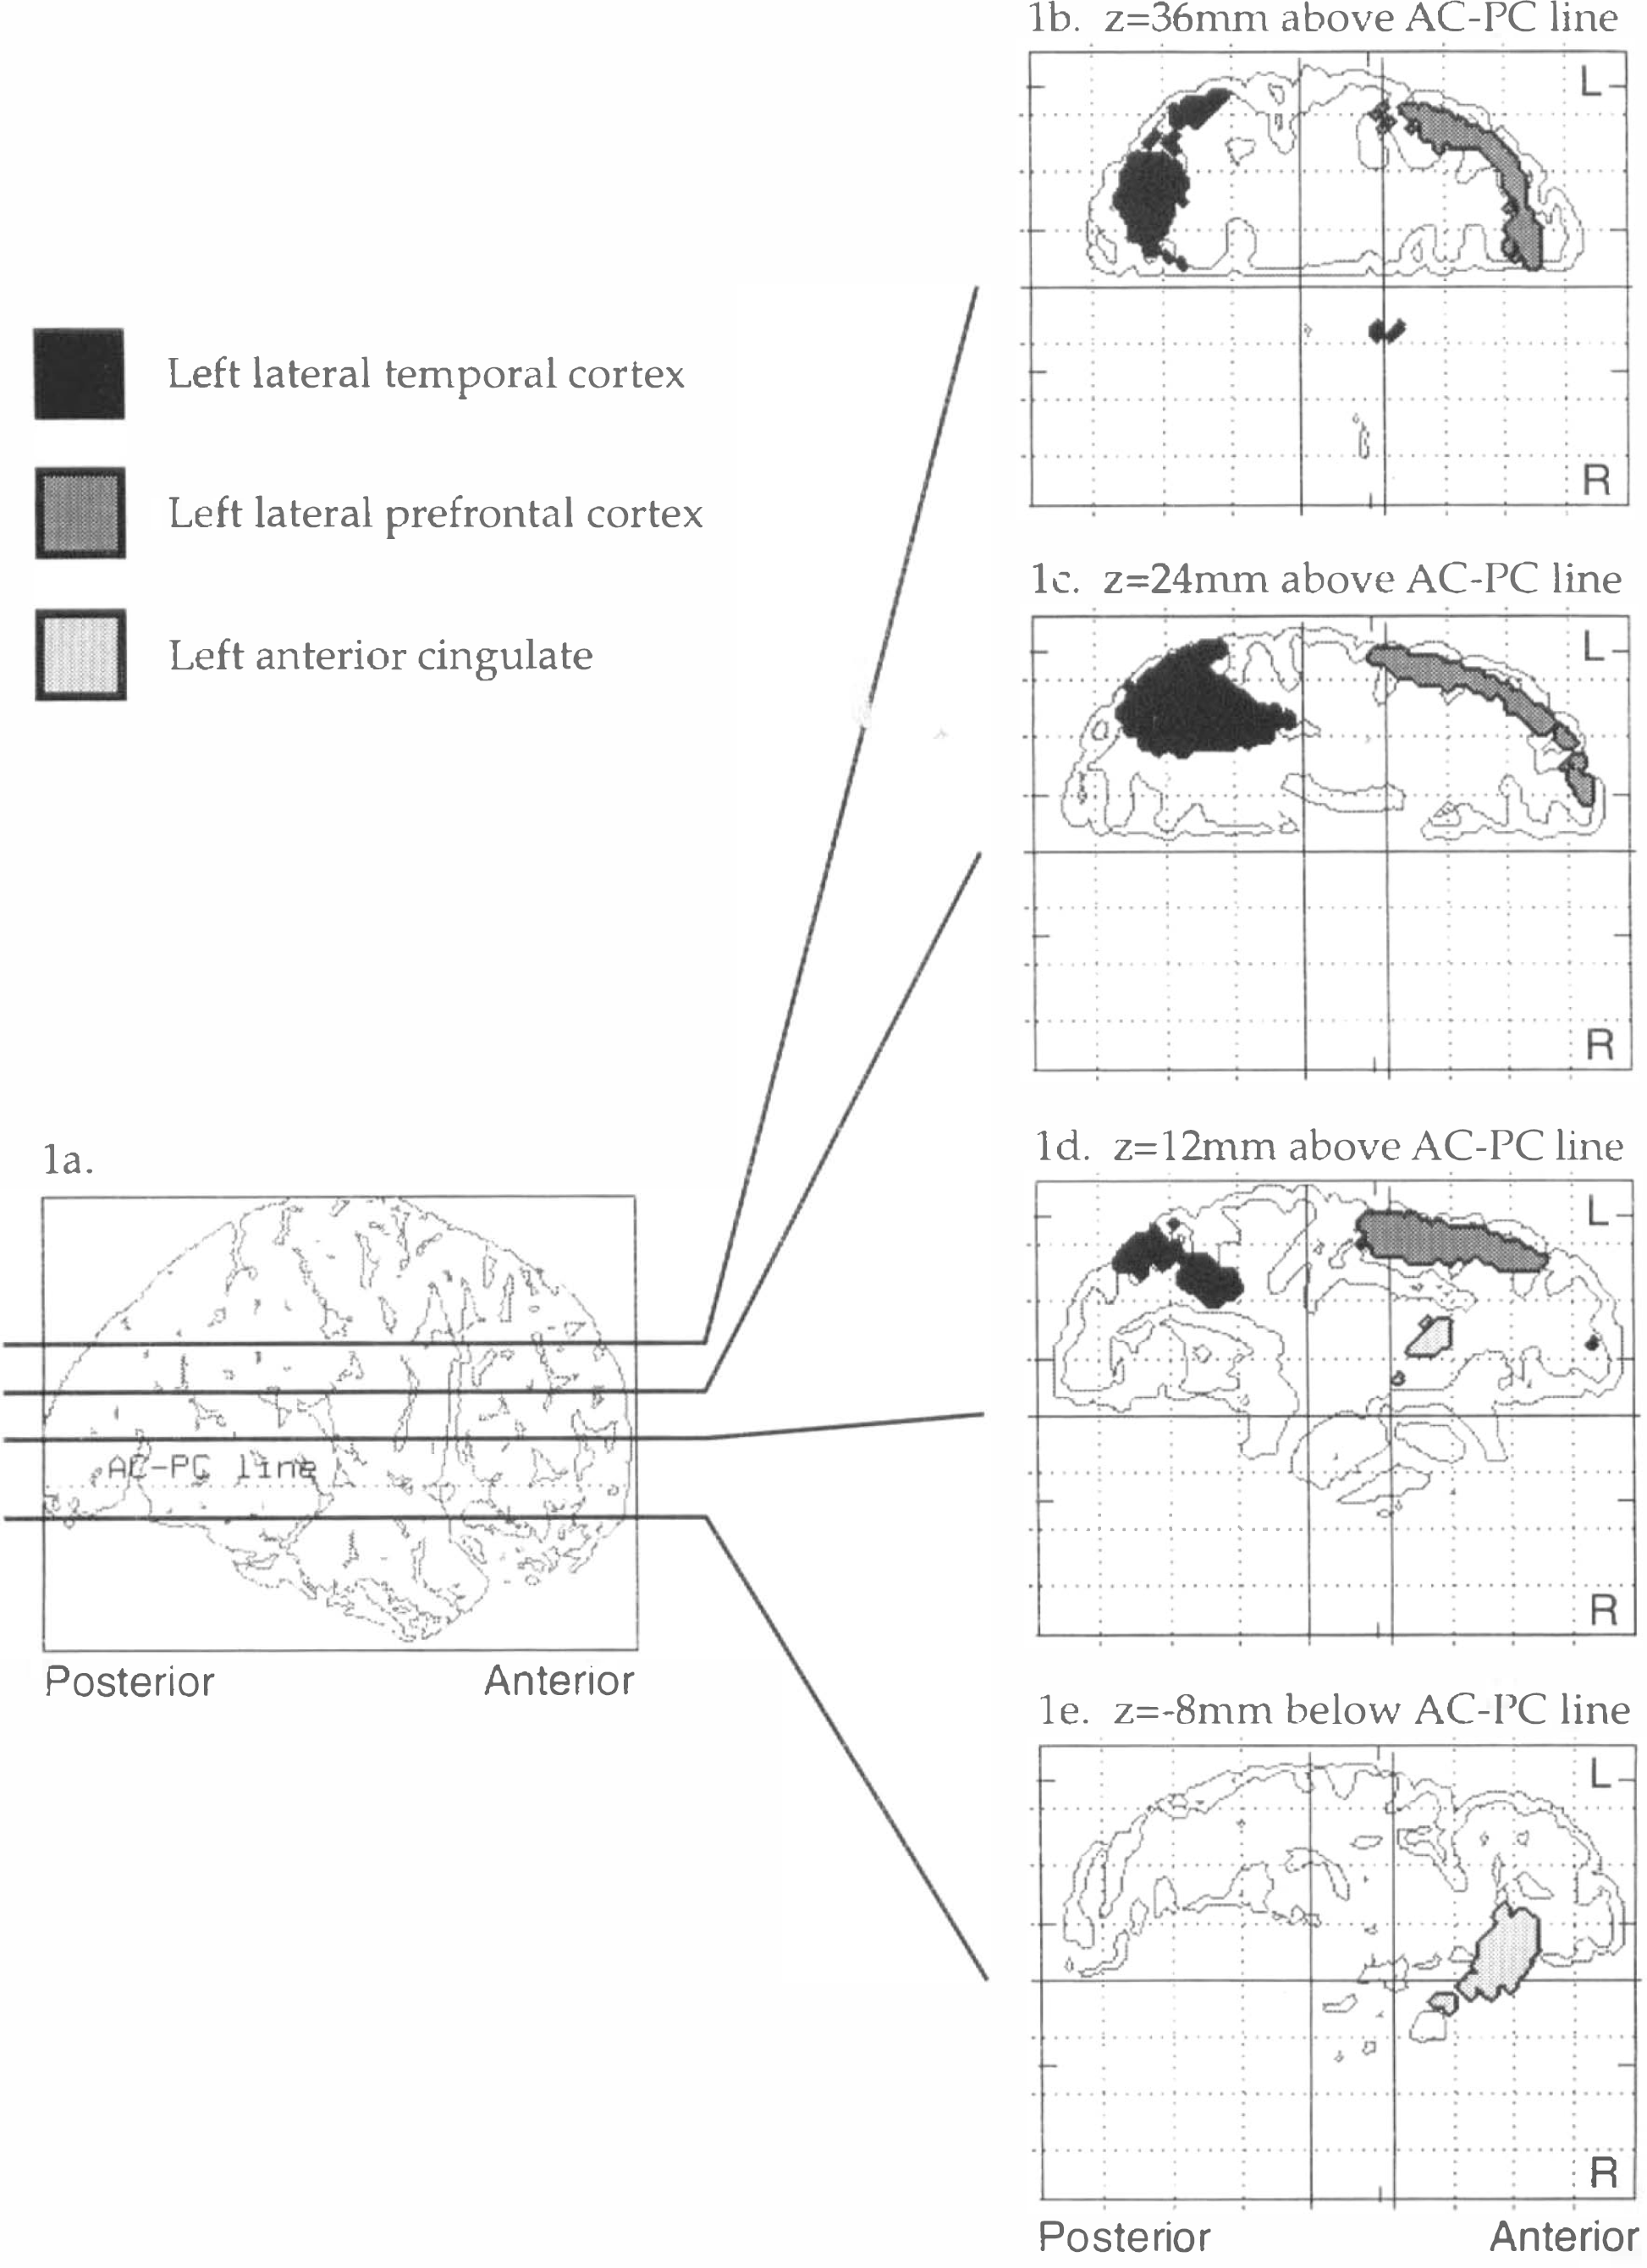
As we have previously reported (McBride et al., 1990), there was a significant increase in prolactin levels in the fenfluramine condition relative to placebo (Table 1). In the fenfluramine group, the omnibus significance of the day 2 rCMRglu increases (i.e., the fenfluramine-induced rCMRglu increases) was highly significant (χ2 = 1,375, df = 1, p = 0). Fenfluramine-induced rCMRglu increases were observed in two areas: the left prefrontal cortex and the left temporal and parietal cortex (Fig. 1, Table 2). Two nonconfluent areas of rCMRglu increase were observed within the left prefrontal cortex. The first area was centered on the anterior cingulate. The robustness of this effect in the anterior cingulate is shown in Figure 2a. This increase was observed in all six subjects, and the adjusted rCMRglu after fenfluramine did not overlap with adjusted rCMRglu levels during the placebo condition in any of the subjects. This area extended from an axial or horizontal plane 12 mm below the AC-PC line to the level of the AC-PC line (Table 2). A second area of rCMRglu increase involved the left lateral prefrontal cortex extending from approximately 4 mm above the AC-PC line to 56 mm above that level. This area corresponded to approximately Brodmann areas 44, 45, and 46 and involved the inferior, middle, and superior frontal gyri. This area of change was localized to the cortical rim. We examined subtraction images from each subject and found no evidence of misalignment or change occurring outside the brain that would explain this finding. The third area of rCMRglu increase was the left temporal lobe and included the middle temporal gyrus and part of the inferior parietal lobe. This area extended from ∼8 mm to 36 mm above the AC-PC line. Brodmann areas that appear to be involved include 22, 39, and 40. Although the most intense pixel change (coordinates −32, −48, 24) appears to lie just within the white matter, the rest of the area of change corresponds to gray matter. In all but one of the areas of increase in rCMRglu described above, an increase was observed in every subject. The only exception was at Talairach coordinates −38, 30, 36, where four of six subjects had an increase in rCMRglu. Thus, these effects were remarkably robust and uniform within the group of subjects and across brain regions. Group means and standard deviations for increases and decreases in each area are shown in Figures 2a and b, respectively.
Subject demographics and prolactin responses (ng/ml) to placebo (day 1) and fenfluramine (day 2)
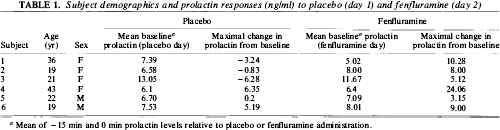
Mean of −15 min and 0 min prolactin levels relative to placebo or fenfluramine administration.
Areas of increase in regional glucose metabolism by fenfluramine
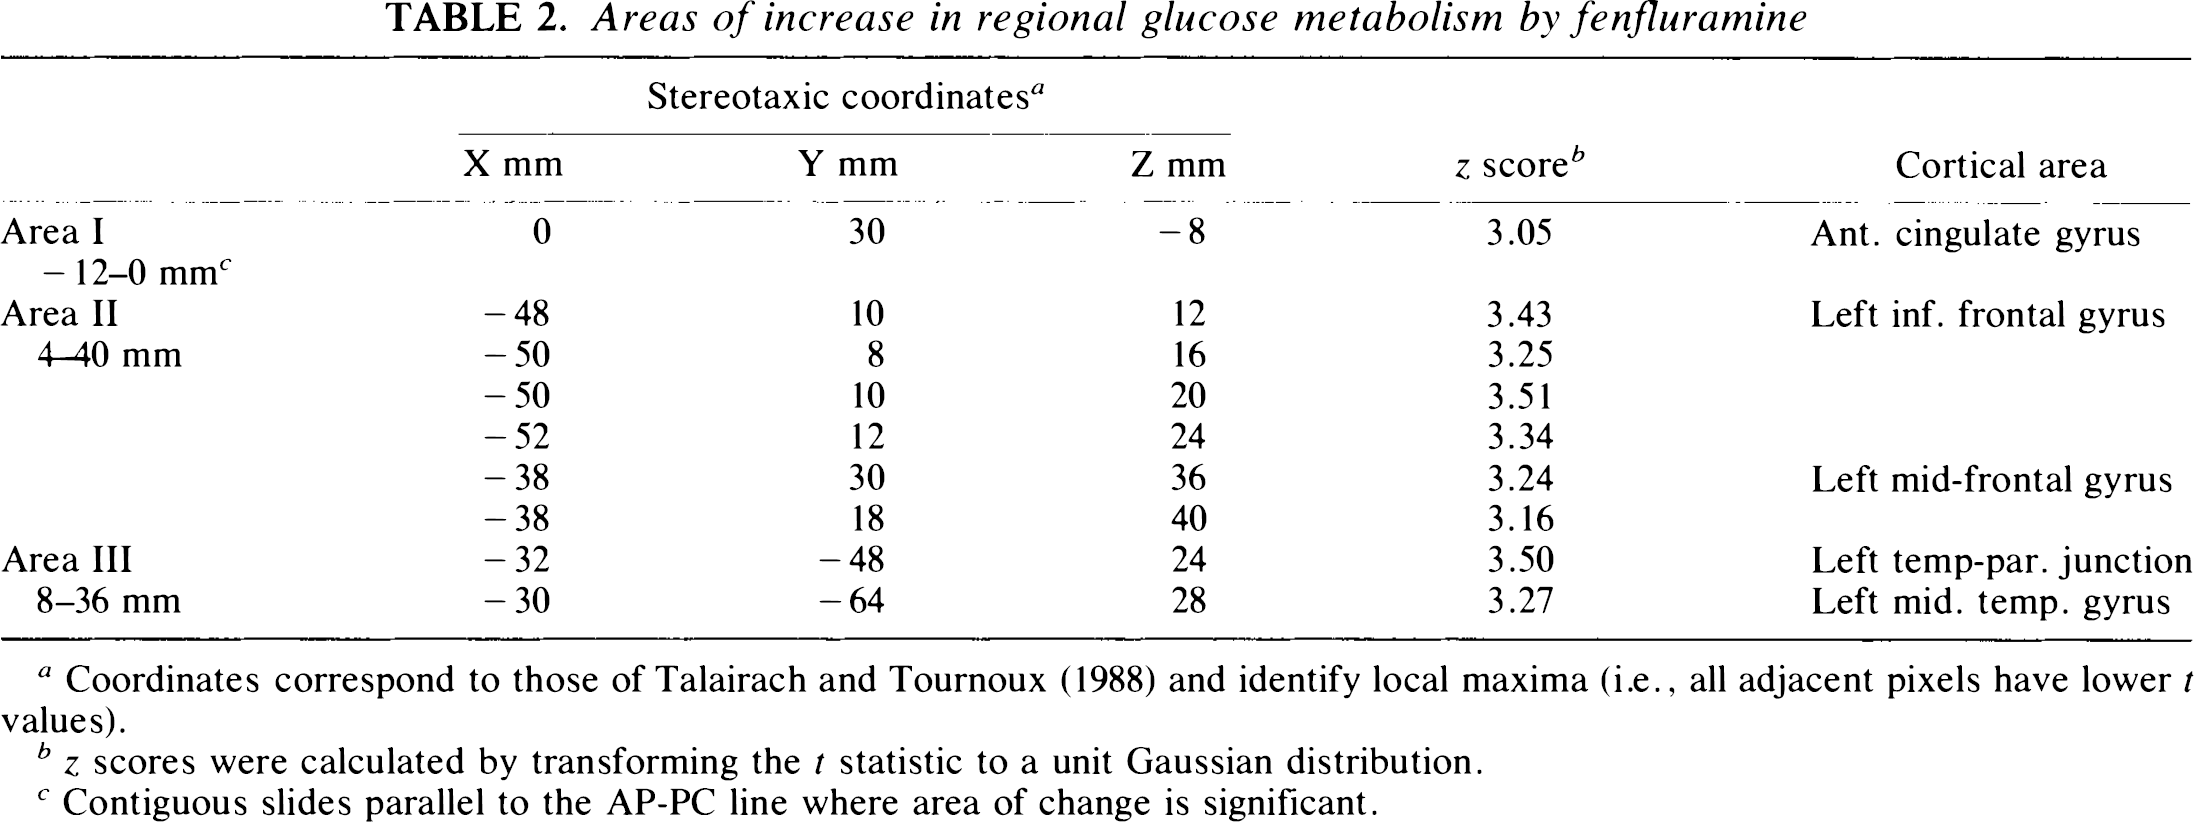
Coordinates correspond to those of Talairach and Tournoux (1988) and identify local maxima (i.e., all adjacent pixels have lower t values).
z scores were calculated by transforming the t statistic to a unit Gaussian distribution.
Contiguous slides parallel to the AP-PC line where area of change is significant.
Areas of significant increase (p < 0.01) in brain regional glucose metabolism following fenfluramine,
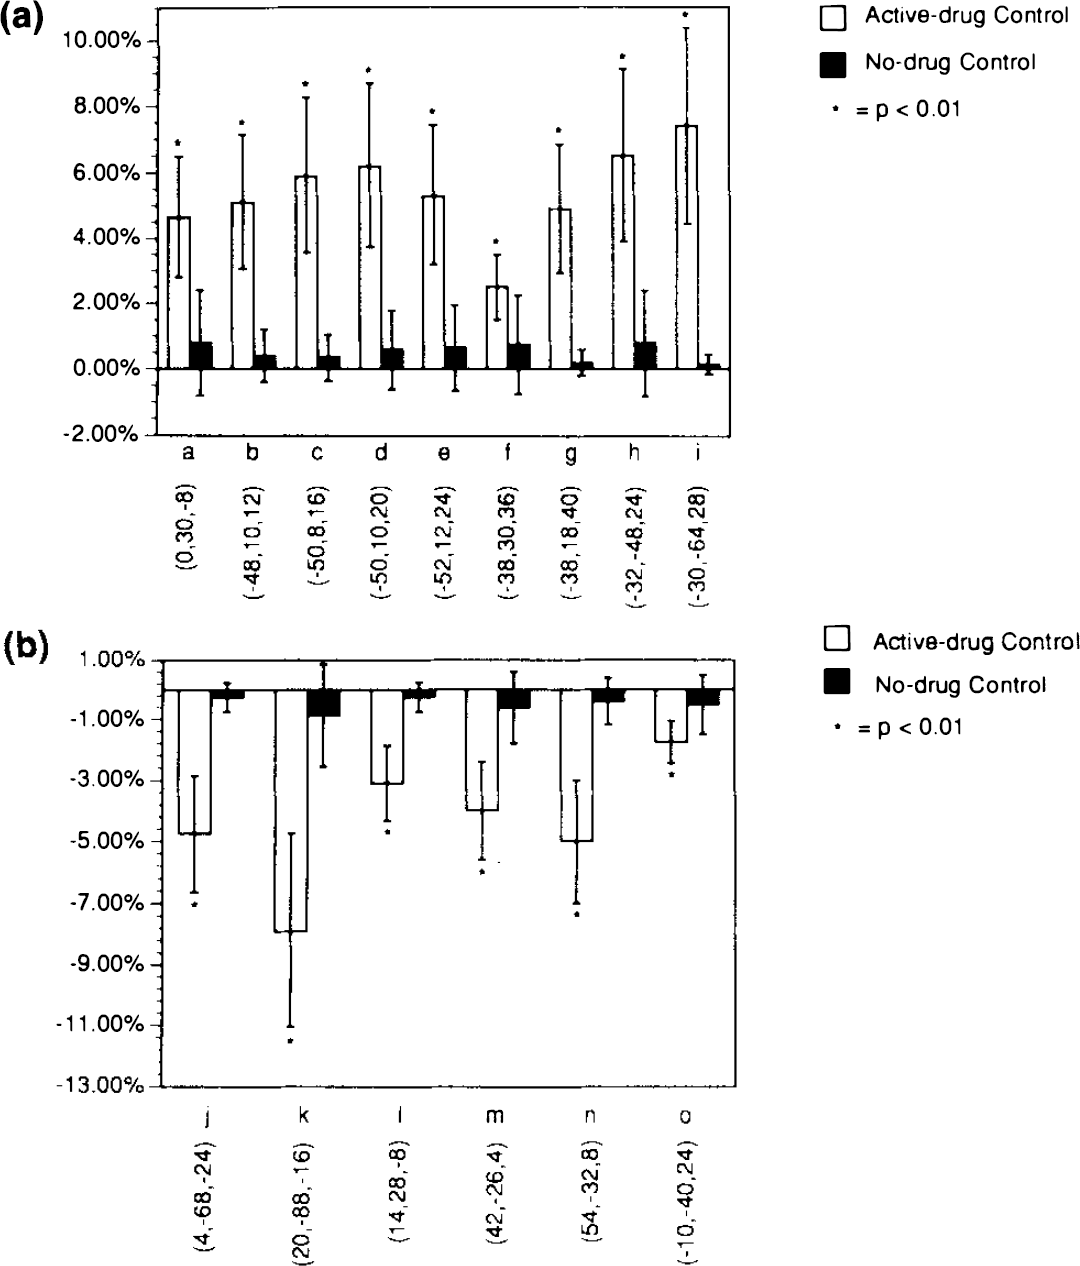
Mean and standard deviation of percent increases
The omnibus significance of the fenfluramine-induced rCMRglu decreases was statistically significant (χ2 = 2,357, df = 1, p = 0). The major areas of decreased rCMRglu (Fig. 1, Table 3) were as follows. One area involved the right occipital pole, particularly its inferior surface, and the cerebellum (Table 3). This area extended from an axial plane 24 mm below the AC-PC line to the plane of the AC-PC line. The most inferior extent of this area of activation overlapped with the inferior edge of the PET axial field of vision for many subjects; thus, identification of cerebellar activation should be considered tentative. A second area involved the posterior part of the right superior and middle temporal gyri extending from the AC-PC line to a plane 16 mm above it. A third area involved the left posterior cingulate and is seen in axial planes from 8 to 20 mm above the AC-PC line. A small fourth area appears to be the left hippocampal gyrus and extends from 4 to 8 mm below the AC-PC line. The most intense pixel change is somewhat medial to the hippocampus, but much of the full area of change overlies the gyrus.
Areas of decrease in regional glucose metabolism after fenfluramine
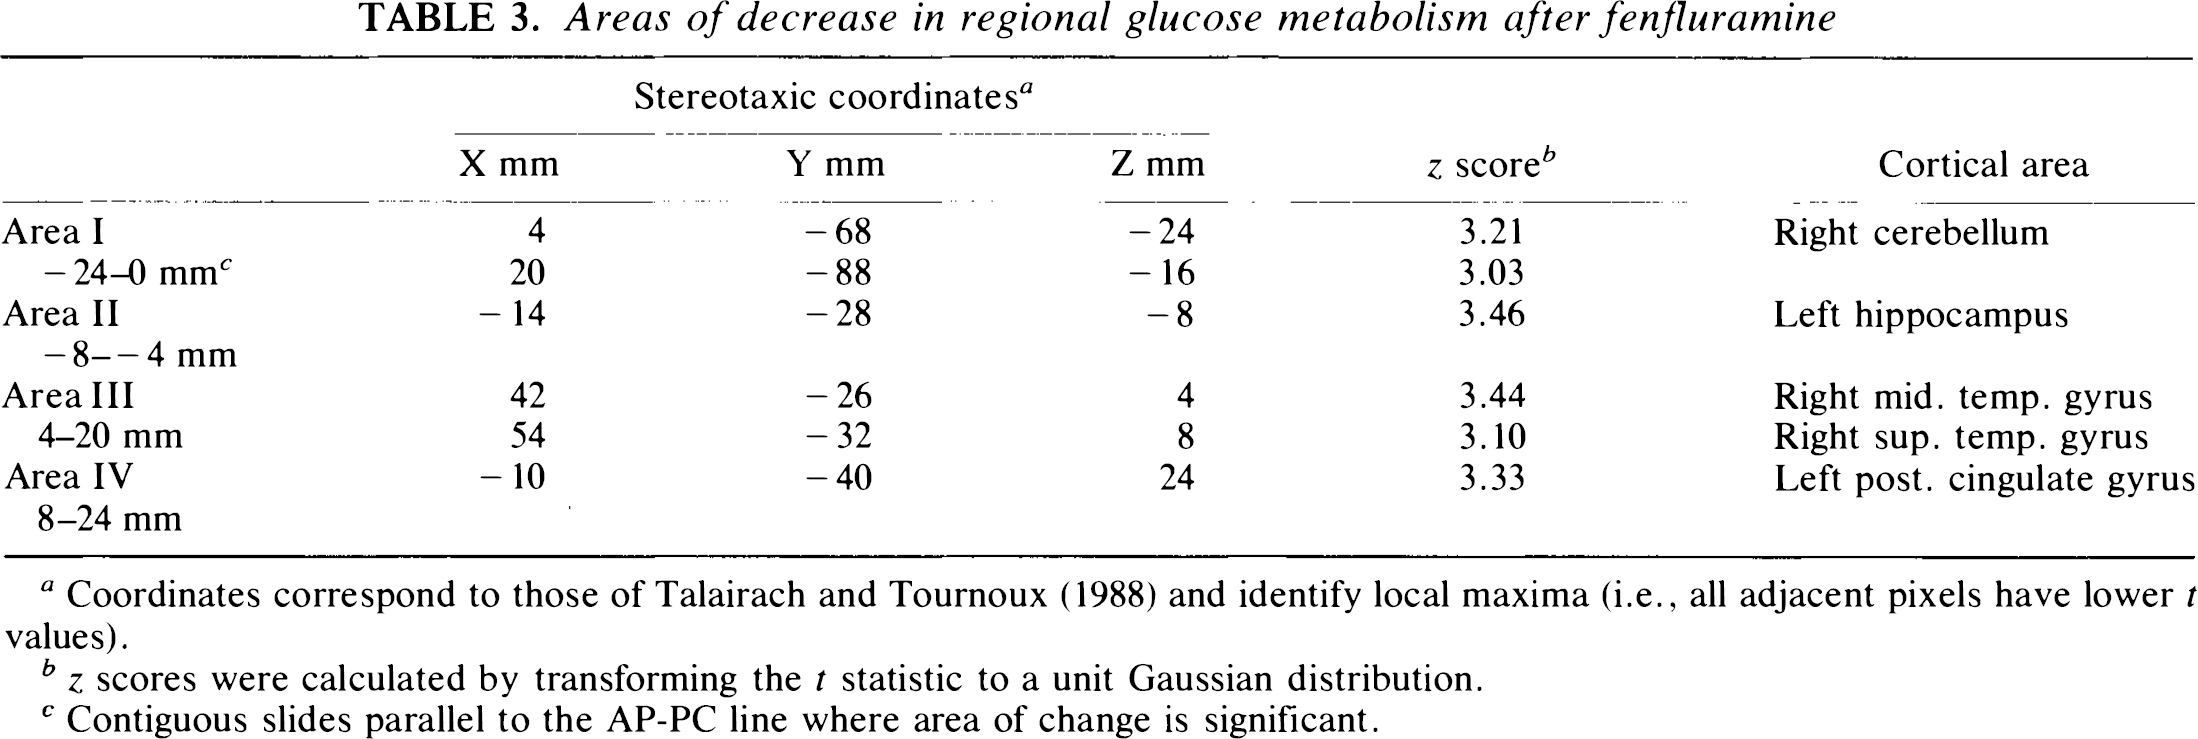
Coordinates correspond to those of Talairach and Tournoux (1988) and identify local maxima (i.e., all adjacent pixels have lower t values).
z scores were calculated by transforming the t statistic to a unit Gaussian distribution.
Contiguous slides parallel to the AP-PC line where area of change is significant.
In contrast, using the same significance criteria, the healthy controls in the norfenfluramine comparison group showed no significant areas of increased or decreased rCMRglu on day 2 vs. day 1. Omnibus significance was nonsignificant for day 2 rCMRglu increases (χ2 = 0, df = 1, p = 1) and for rCMRglu decreases (χ2 = 0, df = 1, p = 1).
Too few cases were included in this study to analyze meaningfully the effects of age or gender on the fenfluramine response.
DISCUSSION
This study reports a method for examining the regional brain effects of serotonin activation or release by comparing the results of fenfluramine and placebo on rCMRglu. Another set of control subjects had two identical 18FDG studies done on different days and thereby controlled for artifacts and type I errors related to the acquisition, reconstruction, image processing, and statistical thresholds used, as well as for the nonspecific biological and/or psychological effects of having two successive scan sessions. Our results, therefore, can be more confidently attributed to a real pharmacological effect. A recent report of prefrontal activation after fenfluramine administration (Kapur et al., 1994) supports out results, although the area of activation was mostly right-sided in that study.
Serotonin innervation of the cerebral cortex arises in the dorsal and median raphe nuclei and is mostly ipsilateral (Fallon and Loughlin, 1987). Serotonin terminals in the cerebral cortex exert their major effect by activating inhibitory GABA interneurons which have relatively local cortical effects and also by activating pyramidal neurons (Aghajanian, 1991) via the spiny horns on the apical dendrites. An unexpected and intriguing result of this study was the asymmetric effect of fenfluramine on rCMRgiu in the left compared to the right hemisphere. The effect, detected at 3 h by l8FDG, seems to be largely one of increased rCMRglu in several discrete areas located mainly in the left hemicerebrum. It has been estimated that almost 80% of oxidative catabolism of glucose is required for energy-dependent ion pumps (Crane et al., 1978; Astrup et al., 1981). Ion pumps are densest in nerve terminals, which would account for the bulk of rCMRglu change on activation (Schwartz et al., 1979; Mata et al., 1980). Thus, an increase in rCMRglu would be due to both serotonin nerve terminal discharge as well as the initial effect of activating inhibitory GABAergic neurons and their local terminal fields. This increase would be offset as a result of these neurons inhibiting other local cortical neurons, thereby decreasing the glucose utilization of these secondary target neurons. One possible explanation of our results is that inhibitory effects are outweighed by increased glucose metabolism in some brain areas, mainly in the left hemisphere, and that the reverse occurs more often in the right hemisphere. It has been reported that serotonin transporter binding, as indicated by 3H-imipramine binding, is greater in the right prefrontal cortex (Arató et al., 1991). This may underlie a functional asymmetry related to that observed in response to fenfluramine. Such a left-right asymmetry may also be relevant for the observation that left-sided cortical lesions are more frequently associated with depression (Sackeim et al., 1982; Robinson et al., 1984; Starkstein et al., 1987, 1988), whereas some rightsided activation states (epileptic foci) are associated with uncontrolled laughter (Sackeim et al., 1982).
Another possibility is that the observed changes are associated with side effects of fenfluramine, independent of direct serotonergic activation. We have previously reported (Myers et al., 1994) that prominent side effects following fenfluramine occur in a minority of psychiatric patients and are associated with exaggerated prolactin responses. In this study, none of the controls reported such symptoms. Moreover, since all subjects displayed the same rCMRglu responses, an idiosyncratic response can be ruled out as an explanation of our results.
Based on the results of this study, critical areas of brain function, such as the prefrontal cortex, can now be studied from the vantage point of serotonergic activation. By normalizing the data to global glucose metabolism, we were able to detect region-specific effects. Since the prefrontal cortical areas that show rCMRglu increase in the left hemisphere are also associated with suicidal behavior (Arango et al., 1991), impulse disorders including aggression (Damasio et al., 1990), depressive disorders (Robinson et al., 1984), and disorders of working memory and cognition (Friston, 1992; Frith et al., 1991), it is likely that this approach will prove of value for detecting abnormalities involving serotonergic input into these cortical regions. Global serotonergic deficits at the level of the raphe nuclei may be manifested by global changes in serotonin-stimulated glucose metabolic responses.
It is of particular importance to develop methods for studying serotonin input into the prefrontal cortex in aggression and suicidal behavior because the orbital frontal cortex is involved in behavioral inhibition. A defect in inhibition could explain why certain individuals are at risk for violent or suicidal behavior. Identification of a deficiency of serotonin input into an anatomically relevant target region would be of great theoretical importance in understanding the pathogenesis of these condition and of practical importance as a possible diagnostic tool. We have reported alterations in serotonin receptor subtypes localized to the lateral and orbital frontal cortex in the brain of suicide victims (Arango et al., 1991). Such alterations in the serotonin system may be detectable in high-risk patients using this PET-FDG method.
In an earlier study using the partial 5-HT1A agonist buspirone and C15O2 to monitor blood flow responses, Friston et al. (1992) reported significant increases in regional cerebral blood flow (rCBF) bilaterally in an area centered in the cuneus of the occipital lobe. They also observed significant reductions in rCBF in the left dorsal lateral prefrontal cortex and bilaterally in the posterior cingulate cortex but only under the condition of five word-list learning task. Although they observed a significant increase in plasma prolactin and growth hormone following buspirone administration, they did not comment on whether it correlated with the degree of the changes in blood flow. McBean et al. (1991) reported that rCBF and glucose metabolism in rats remained coupled following 5-HT1A receptor stimulation by 8-OHDPAT, though blood flow was greater relative to metabolism after drug administration. On the basis of this rat study, it may be suggested that the finding of altered rCBF by Friston et al. (1992) reflects similar changes in glucose uptake or neuronal activation. However, that hypothesis remains to be tested in human subjects. The effects of buspirone on rCBF regarding the brain areas affected and the direction of change diverge somewhat from our own observations with fenfluramine, but the reasons for these differences may be straightforward. Fenfluramine releases serotonin and to some degree inhibits its reuptake. The released serotonin would in turn activate all available pre- and postsynaptic serotonin receptors in the terminal fields. Thus, the effects of fenfluramine would be far more general than the effects of a somewhat selective 5-HT1A agonist such as buspirone. Moreover, we examined glucose metabolism, whereas Friston and colleagues (1992) examined blood flow. In the event that there is regional uncoupling of blood flow and metabolism resulting from direct neurovascular effects on blood flow, the results of an rCBF study would differ from those of an FDG study.
This study included too few subjects to conclude confidently whether there is a relationship between the rCMRglu responses and another recognized serotonin-related response—namely, the release of prolactin. However, there was a statistically significant robust prolactin response to active drug, providing evidence that these rCMRglu changes may represent a real drug effect.
In another study using the tracer 99Tc-HMPAO and imaged by single photon emission computed tomography (SPECT) (J. J. Mann et al., unpublished data), we have demonstrated a significant bilateral increase in anterior cingulate blood flow in 10 depressed, unmedicated patients following a fenfluramine challenge. In that study, we found a trend for a positive correlation between blood flow increase and maximal prolactin release, suggesting that the rCBF change was related to serotonin activation. Lack of resolution using SPECT may have contributed to our inability to distinguish the additional separate areas of increased and decreased rCMRglu found by PET imaging of glucose metabolism. Moreover, the method of statistical analysis applied to the PET data was far more sophisticated than that applied to the SPECT data, partly due to a difficulty in registering the SPECT images in stereotaxic atlas coordinates for significance probability mapping analysis. Nevertheless, there is some agreement in the results between the two studies—namely, that at least one area of increased rCMRglu involves the anterior cingulate and perhaps the other areas of the prefrontal cortex.
In conclusion, we report a method for evaluating in vivo serotonin responsivity in the human prefrontal cortex, which may be valuable in studying the role of serotonergic dysfunction in a variety of psychiatric disorders, as well the effects of treatment. Such an approach complements other methods of imaging the serotonin system—for example, using ligands for the nerve terminal serotonin transporter (Biegon and Mathis, 1993).
Footnotes
Acknowledgment:
This work was partly supported by the NIMH Functional Brain Imaging Center (MH49815), Neurobiological Studies of ECT in Depression (MH40695), the Clinical Research Center for the Study of Suicidal Behavior (MH46745), and NIH/NCRR/GCRC grant 5 MOI RR0056.