
Abstract
Reference tissue methods to estimate neuroreceptor binding are not applicable to [18F]FP-TZTP (a muscarinic-2 cholinergic receptor ligand), because there is no suitable receptor-free reference region. We evaluated a new method to estimate, without using arterial data or a receptor-free reference region, a receptor parameter called the normalized distribution volume, V*T, using a region containing receptors as the input tissue. V*T is defined as VT/K′1 (distribution volume (VT) normalized by K′1 of the input region). We used a two-parameter multilinear reference tissue model (MRTM2) to generate parametric images of V*T and R1 (R1 = K1/K′1) from [18F]FP-TZTP PET data of healthy aged subjects (10 with apolipoprotein E-ε4 alleles (APOE-ε4(+)) and nine without (APOE-ε4(–)). VT and VT were normalized by plasma-free fraction, fP. By one-tissue kinetic analysis (1TKA) with metabolite-corrected plasma data, VT was previously reported as higher in the APOE-ε4(+) group. The noise magnitude of MRTM2 V*T and R1 images were nearly identical to those of 1TKA VT and K1 images. K′1 or fP was not different between the two groups. V*T (mins) (1,659 ± 497) and VT (mL/cm3) (701 ± 99) in APOE-ε4(+) were higher by 38 and 22% than those (1,209 ± 233 and 577 ± 112) in APOE-ε4(–), respectively. The statistical significance for V*T (0.041) was lower than that for VT (0.025), due to the higher intersubject variability of V*T (25%) than that of VT (17%). We conclude that MRTM2 V*T allows detection of group differences in receptor binding without arterial blood or a receptor-free reference region.
Keywords
Introduction
An F-18-labeled muscarinic-2 (M2) subtype-selective agonist, 3-(3-(3-[18 F]flouropropyl)thio)-1,2,5-thiadiazol-4-yl)-1,2,5,6 tetrahydro-1-methylpyridine ([18F]FP-TZTP), has been successfully used for positron emission tomography (PET) imaging of central M2 cholinergic receptors in human (Cohen et al, 2003). In these [18F]FP-TZTP PET studies, the gray matter distribution volume of [18F]FP-TZTP (a measure of M2 receptor binding) was greater in aged healthy subjects with an apolipoprotein E-ε4 (APOE-ε4) allele(s) that confers an increased susceptibility to Alzheimer's disease than those without an APOE-ε4 allele (Cohen et al, 2003). The greater M2 binding found in these studies is consistent with decreased synaptic concentrations of acetylcholine in aged subjects with an APOE-ε4 allele and, therefore, the findings support the hypothesis of the involvement of the cholinergic system in Alzheimer's disease and age-related cognitive changes.
Kinetic modeling studies of [18F]FP-TZTP PET data have shown that [18F]FP-TZTP time—activity data can be described by the one-tissue (1T) compartment model with two kinetic rate constants, K1 (mL/min per cm3, the rate constant for transfer from plasma to the tissue) and k2 (min−1, the tissue clearance rate constant) (Carson et al, 1998, 1999). Because of the widespread distribution of M2 receptors throughout the brain, there is no suitable receptor-free reference region for [18F]FP-TZTP. Therefore, noninvasive reference tissue methods (Ichise et al, 1996, 2003; Logan et al, 1996, 2001; Lammertsma and Hume, 1996) that allow estimation of binding potential (BPND; Mintun et al, 1984) without arterial data are not applicable to [18F]FP-TZTP data, although the 1T model is applicable for all regions. Instead, the total distribution volume (VT (mL/cm3)) of [18F]FP-TZTP has been used as an M2 receptor parameter for the comparison of subjects belonging to different groups or under different experimental conditions (Carson et al, 1998; Cohen et al, 2003). Estimation of VT unlike that of BPND, however, requires the acquisition of invasive arterial blood samples and technically demanding corrections for radiolabeled metabolites, which are used as an estimate of the arterial input function.
To avoid the invasive arterial sampling, one approach may be the use of standardized input curves (Takikawa et al, 1993; Onishi et al, 1996). However, standard input curves need to be established a priori and, furthermore, intersubject differences in metabolite-corrected arterial plasma data must be small. Otherwise, compartment model fitting of individual PET data with a standard input curve may not be accurate. Another noninvasive approach to estimate the input function involves mathematical extraction of vascular time-activity data from dynamic PET data, which then can be used as the input function in certain situations (Feng et al, 1997; Liptrot et al, 2004). However, the latter approach would not be applicable to neuroreceptor tracers such as [18F]FP-TZTP, where the input function requires corrections for radiolabeled metabolites.
Alternatively in this study, we evaluated a new method to estimate, without the use of arterial input functions or a receptor-free reference region, a newly defined parameter called the normalized distribution volume (V*T). In this method, a region containing receptors (the cerebellum) is selected and used as the input tissue region instead of a receptor-free reference tissue region. Mathematically, V*T is defined as V*T = VT/K′1 (VT normalized by the tracer delivery (K′1) of the input region). V*T is independent of regional blood flow (although it is linearly proportional to the tracer delivery or blood flow of the input region). Therefore, V*T may be a useful receptor parameter if an input region with tracer delivery (blood flow), which is unchanged between subject groups or experimental conditions can be defined. V*T and additionally relative tracer delivery (R1 = K1/K′1) can then be estimated with the two-parameter multilinear reference tissue model (MRTM2; Ichise et al, 2003). Two-parameter multilinear reference tissue model provides less noise in parametric images than does the original three-parameter MRTM.
Here, the new method was applied to human [18F]FP-TZTP PET data described previously (Cohen et al, 2003) of healthy aged subjects with and without APOE-ε4 alleles. As stated above, the gray matter of VT was shown previously to be higher in subjects with an APOE-ε4 allele(s) (Cohen et al, 2003). The hypothesis in this study was that V*T can also differentiate the two subject groups without the use of the arterial input function data. The use of MRTM2 requires estimation of k′2 (tracer clearance rate constant from the reference region or the input region-containing receptors in this study) by three-parameter MRTM (Ichise et al, 2003). Therefore, conditions that might affect accurate estimation of k′2 were evaluated by computer data simulation analysis.
Theory
Estimation of the total distribution volume, VT, by 1T kinetic analysis (KA) applicable to 1T tracers such as [18F]FP-TZTP uses the following operational equation:
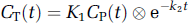
where CT(t) is the region of interest (ROI) or voxel tissue tracer concentration (kBq/cm3), CP(t) the metabolite-corrected plasma tracer concentration (kBq/mL), and ⊗ the convolution symbol. Equation (1) allows nonlinear least-squares estimation of two parameters from the entire data set. VT is calculated as K1/k2.
Two-parameter multilinear reference tissue model (Ichise et al, 2003), which is applicable to tracers such as [18F]FP-TZTP with 1T kinetics, is proposed to estimate the normalized distribution volume (V* = V/K′1) and relative tracer delivery (R1 = K1/K′1) without the use of arterial input functions. Two-parameter multilinear reference tissue model can be expressed as
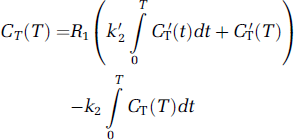
where CT(T) and C′T(T) are the ROI or voxel tissue tracer concentrations and the prime sign indicates the reference region (input region). Equation (2) involves two parameters (R1 and k2) if the value of k′2 is known a priori. Equation (2) is applicable to the entire time—activity data for [18F]FP-TZTP with 1T kinetics, that is for T > 0. Two-parameter multilinear reference tissue model (equation (2)) then allows estimation of R1 and k2 using an input region containing receptors, from which V*T = VT/K′1 = R1/k2 can be calculated. V*T can also be expressed as V*T = (BPND + 1)/k′2, if the input region has no receptors (then called the reference region). Therefore, the noise magnitude of V*T images by MRTM2 should be identical to that of BPND images. When given a priori the correct value of k′2, the noise magnitude of MRTM2 parameter estimation is nearly identical to that of 1TKA (Ichise et al, 2003), because both are two-parameter methods. The value of k′2 can be estimated by the three-parameter MRTM using ROI time—activity curves (TACs) (Ichise et al, 2003). The operational equation of MRTM is
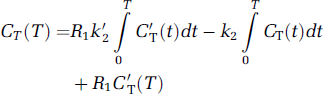
Equation (3) estimates three parameters, R1, k′2, and k2, using the input and target tissue TACs. We have shown previously that the bias and variability of k′2 estimation by MRTM increases with noise in the target ROI TAC (Ichise et al, 2003). In addition, our preliminary analysis indicated that the magnitude of the bias and variability of k′2 estimation depends on the k2/k′2 ratio and the magnitude of k′2. For example, if the two-tissue TACs used in MRTM2 have identical clearance rates (k2/k′2 = 1), then estimation of k′2 with equation (3) becomes unidentifiable or unstable. In this study, because the range of k2 for [18F]FP-TZTP is not large, the accuracy of MRTM k′2 estimation will be evaluated for simulated data in the k2/k′2 parameter space. Note that estimation of V*T and R1 can also be accomplished by using the nonlinear version of MRTM2, namely, simplified reference tissue model 2 (SRTM2) (Wu and Carson, 2002). The advantage of MRTM2 over SRTM2 is MRTM2's computational ease and therefore its greater suitability for parametric imaging (Ichise et al, 2003).
Materials and methods
Positron Emission Tomography Data
The healthy human [18F]FP-TZTP PET data were selected from the study described previously (Cohen et al, 2003). The subjects consisted of 19 aged healthy individuals (mean age = 62 ± 8 years; range: 52 to 75 years) in two groups, 10 (six men and four women) with one or more APOE-ε4 alleles (APOE-ε4(+)) and nine (four men and five women) without APOE-ε4 alleles (APOE-ε4(–)). The PET procedure has been described previously in detail (Cohen et al, 2003). In brief, the PET study was approved by the NIMH Institutional Review Board and written informed consent was obtained from each subject. [18F] FP-TZTP PET scans were acquired in three-dimensional mode on the GE Advance tomograph (GE Medical Systems, Waukesha, WI, USA) for 120 mins (33 frames with scan duration ranging from 30 secs to 5 mins) after a bolus administration of 10.2 ± 0.3 mCi of the tracer. The GE Advance acquires 35 simultaneous slices, with 4.25 mm interslice distance with a reconstructed spatial resolution of 6 to 7 mm in all directions. To reduce head motion, all subjects wore individualized thermoplastic facemasks that were fixed to the scanner headrest. Positron emission tomography scanning was preceded by an 8-min transmission scan to correct for attenuation.
Twenty-eight arterial blood samples were obtained, for the 120-min PET scanning. The parent fraction for the arterial input function was determined from extraction in ethyl acetate followed by thin-layer chromatography analysis. The product of the plasma activity and metabolite fraction curves generated a metabolite-corrected plasma curve. The resulting curve was used as the input function for estimation of 1T kinetic parameter values. Plasma protein binding was determined by measuring the plasma-free fraction (fP) of parent compound using ultrafiltration.
To be used for image coregistration and anatomical reference, each subject had a 124-slice whole brain magnetic resonance imaging (MRI) scans on a General Electric SIGNA 1.5 T (GE Medical Systems) scanner using a T1-weighted three-dimensional gradient echo sequence with radio frequency spoiling (TR (repetition time)/TE (echo time)/flip angle, 24 ms/3 ms/45°).
Positron Emission Tomography Study Analysis
The original reconstructed PET data were corrected for subject motion during the 120-min acquisition by registering each time frame to the subject's MR image using the automatic image registration (AIR) algorithm (Woods et al, 1993) in the image analysis software MEDx (Sensor Systems Inc., Sterling, VA, USA). Note that in the study described previously (Cohen et al, 2003), parametric images of VT and K1 were generated from PET data after MRI-based partial volume corrections. In this study, all parametric images were generated from the original motion-corrected PET data without partial volume corrections. For all nonlinear (equation (1)) and linear (equations (2 and 3)) fitting, scan data were weighted by (1/s.d.2), where s.d. of the data was estimated based on the noise-equivalent counts as described previously (Carson et al, 1998). All VT and V*T values were corrected for plasma-free fraction, fP.
Parametric images of VT and K1 were generated from the motion-corrected data and metabolite-corrected arterial input functions by 1TKA (equation (1)) implemented in IDL (Research Systems Inc., Boulder, CO, USA). Parametric imaging of V*T and R1 by MRTM2 (equation (2)) requires selection of an input region and preliminary estimation of k′2 by MRTM (equation (3)) from ROI data. First, the cerebellum was chosen as the input region, because cerebellar blood flow (K′2) is known to be unchanged with the current and related conditions considered in this study (Cohen et al, 2003). Second, our preliminary data analysis (data not shown) and simulation analysis (see below) indicated that for accurate MRTM k′2 estimation, target ROIs should have a k2/k′2 ratio different from unity. Therefore, thalamus and striatum were chosen as target regions because k2/k′2 ratios of these regions were farthermost away from unity. From the two k′2 values estimated by MRTM using the cerebellum ROI and two target ROIs (thalamus and striatum), a weighted mean k′2 value was calculated with the target ROI size used as the weighting factor; this weighted mean k′2 was used for MRTM2 estimation of V*T and R1.
To this end, ROI TACs from the cerebellum (∼1,100 voxels, voxel size = 2.0 × 2.0 × 4.25 mm), thalamus (∼600 voxels), and striatum (∼200 voxels) were manually defined on the K1 image fused with the coregistered MRI image using a fusion module in the pixel-wise kinetic modeling (PMOD) software (PMOD Group, Zurich, Switzerland). Multilinear reference tissue model (equation (3)) fitting was implemented in MATLAB (The MathWorks, Natick, MA, USA). The accuracy of MRTM k′2 values was evaluated by comparison with 1TKA k′2 values using paired t-test and linear regression analysis. The 1TKA k′2 values were calculated as the mean voxel k′2 within the cerebellum ROI, where voxel k′2 values were calculated using, k′2 = K′1/V′T. In selected samples (n = 9), we also performed cerebellum ROI TAC 1TKA fit to estimate the k′2 values (0.0093 ± 0.0014 min−1); these were similar to the mean k′2 values (0.0096 ± 0.0016 min−1) estimated voxel-wise with the mean percent differences of −3 ± 4% between the two methods.
V*T and R1 parametric imaging by MRTM2 (equation (2)) was performed in pixel-wise kinetic modeling installed on a personal computer workstation (Dell Computer Co., Austin, TX, USA, 1.7 GHz Pentium® IV/1GB RAM running on Microsoft® Windows 2000, Microsoft Co., Redmond WA, USA). To compare the parameters, VT, K1, V*T, and R1, between the two groups of subjects with and without APOE-ε4 alleles, several ROIs were defined on the K1 image in addition to the striatum, thalamus, and cerebellum as above, which consisted of the frontal cortex (∼1,100 voxels), cingulate gyrus (∼200 voxels), temporal cortex (∼600 voxels), parietal cortex (∼600 voxels), occipital cortex (∼800 voxels), and amygdala (∼70 voxels). The region size weighted mean voxel parameter values of these six cerebral cortex regions were compared between the two subject groups by t-test.
Intersubject variability of parameters was defined as the coefficient of variation (CV = 100 × s.d./group mean parameter value) and was averaged over the two subject groups. For all voxels defined by the ROIs, V*T and R1 values were also calculated from the corresponding 1TKA parameter values and the 1TKA cerebellum (input region) parameter values. The accuracy of MRTM2 V*T and R1 estimations was evaluated voxel-wise by calculating percent differences between MRTM2 and 1TKA. 1TKA V*T and R1 values for the cerebral cortex were also compared between the two subject groups. Statistical significance was defined as P < 0.05.
Simulation Analysis
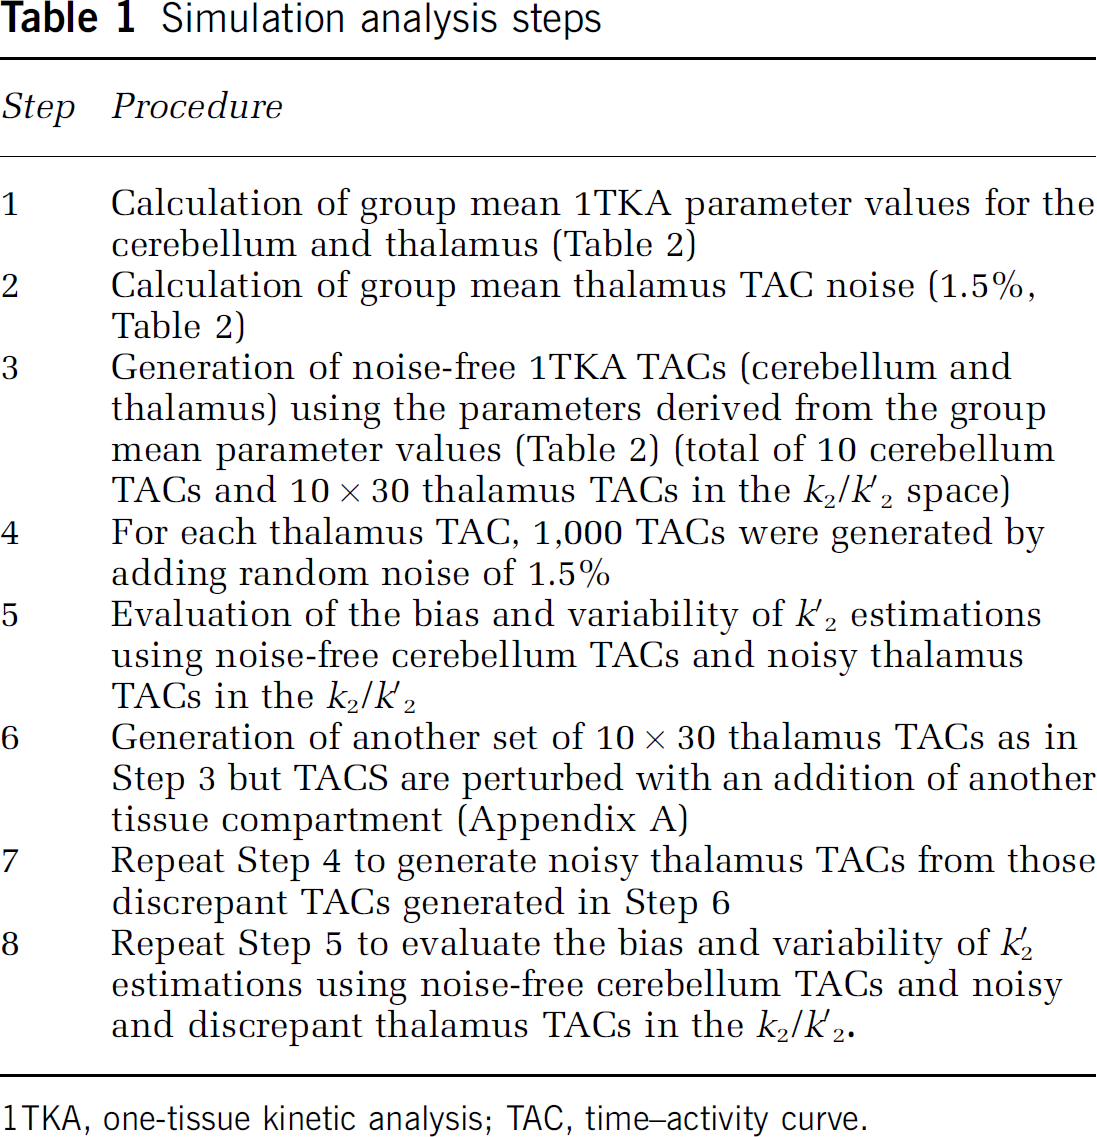
The computer simulation analysis was performed to evaluate the accuracy of k′2 estimation by MRTM. The steps taken for the simulation analyses are outlined in Table 1.
Simulation analysis steps
1TKA, one-tissue kinetic analysis; TAC, time—activity curve.
Step 1. To calculate group mean parameter values that can be used for computer simulation analysis, ROI TACs were fitted by 1TKA using individual metabolite-corrected plasma input functions. The mean 1TKA parameter values from 11 subjects (Table 2) were then used to generate noise-free TAC data as described below in Step 3.
One-tissue compartment kinetic parameter values and % noise of time-activity curve derived from the mean of 11 subjects and used for computer simulation analysis
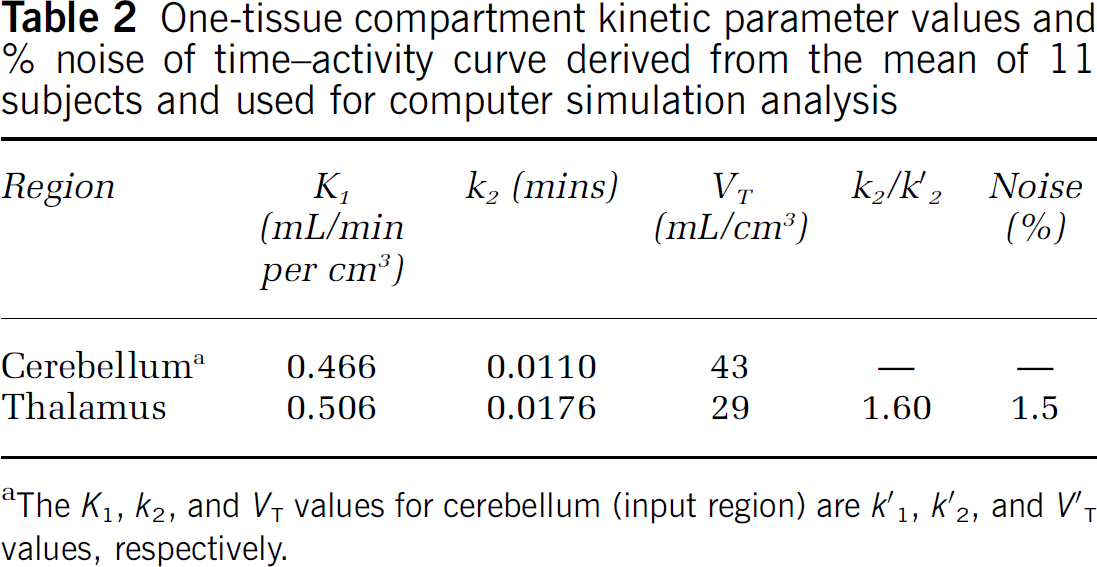
The K1, k2, and VT values for cerebellum (input region) are k′1, k′2, and V′T values, respectively.
Step 2. ROI TAC percent noise was calculated based on deviations from 1TKA fitting (100 × s.d./mean) for the latter portion of the TAC (60 to 120 mins) and the mean percent noise over these 11 subjects was calculated (Table 2).
Step 3. Our preliminary simulation analysis suggested that the bias and variability of MRTM k′2 estimation at a typical ROI noise level are dependent on the k2/k′2 ratio and the magnitude of k′2. Therefore, 1T TAC data were simulated in the k2/k′2 parameter space. To this end, one typical metabolite-corrected plasma input was selected from the subject group, and was scaled to a group mean injected dose of 10.2 mCi. Noise-free TACs for cerebellum (input region) and thalamus (target region) were simulated using the 1T parameter values derived from the group mean K1 and k2 values (n = 11) estimated by 1TKA for the respective regions (Table 2) for 120 mins (33 frames, the same sampling as used in actual PET data). Intravascular radioactivity was not included since its contribution would be minimal due to the high K1 and VT values. The thalamus was chosen because k2/k′2 = 1.60 was highest. Then, another nine noise-free cerebellar TACs were generated where k′2 was varied from 0.005 to 0.023 min−1 in 0.002 increments, keeping the same value of K′1 = 0.466 mL/min per mL. Corresponding to each of these 10 cerebellum TACs, 30 thalamus TACs were generated (total of 10 × 30 or 300 TACs), keeping the same value of K1 = 0.506 mL/min per cm3, but with different values of k2 such that k2/k′2 varied from 0.25 to 7.14.
Step 4. Then, random amounts of normally distributed mean zero noise were added to the noise-free thalamus TACs using the noise model described previously (Ichise et al, 2003). One thousand noisy TACs were generated for each of the thalamus TACs at a noise level of 1.5%, which was the mean % noise of 11 subjects (Table 2) (total of 1,000 × 300 TACs).
Step 5. The accuracy of k′2 estimation was evaluated by calculating the bias (% deviation of the sample mean (n = 1,000) from the true value) and the variability (% sample s.d. relative to the true value). Weighted linear least-squares MRTM fitting was performed with weights equal to the inverse of the simulated data variance.
Step 6. Our preliminary simulation analysis suggested that substantial MRTM k′2 bias might be introduced by a slight discrepancy for the IT model. Therefore, for each of the 10 cerebellum TACs, another set of 30 thalamus TACs were generated in the same manner as above, except that another tissue compartment in parallel with the original 1T compartment was added as described in Appendix A.
Step 7. Step 4 was repeated to generate noisy thalamus TACs from those discrepant TACs generated in Step 6.
Step 8. Step 5 was repeated to evaluate the bias and variability of k′2 estimations using noise-free cerebellum TACs and noisy and discrepant thalamus TACs in the k2/k′2 space.
All simulation analyses were performed in MATLAB and/or pixel-wise kinetic modeling.
Results
Positron Emission Tomography Study Analysis
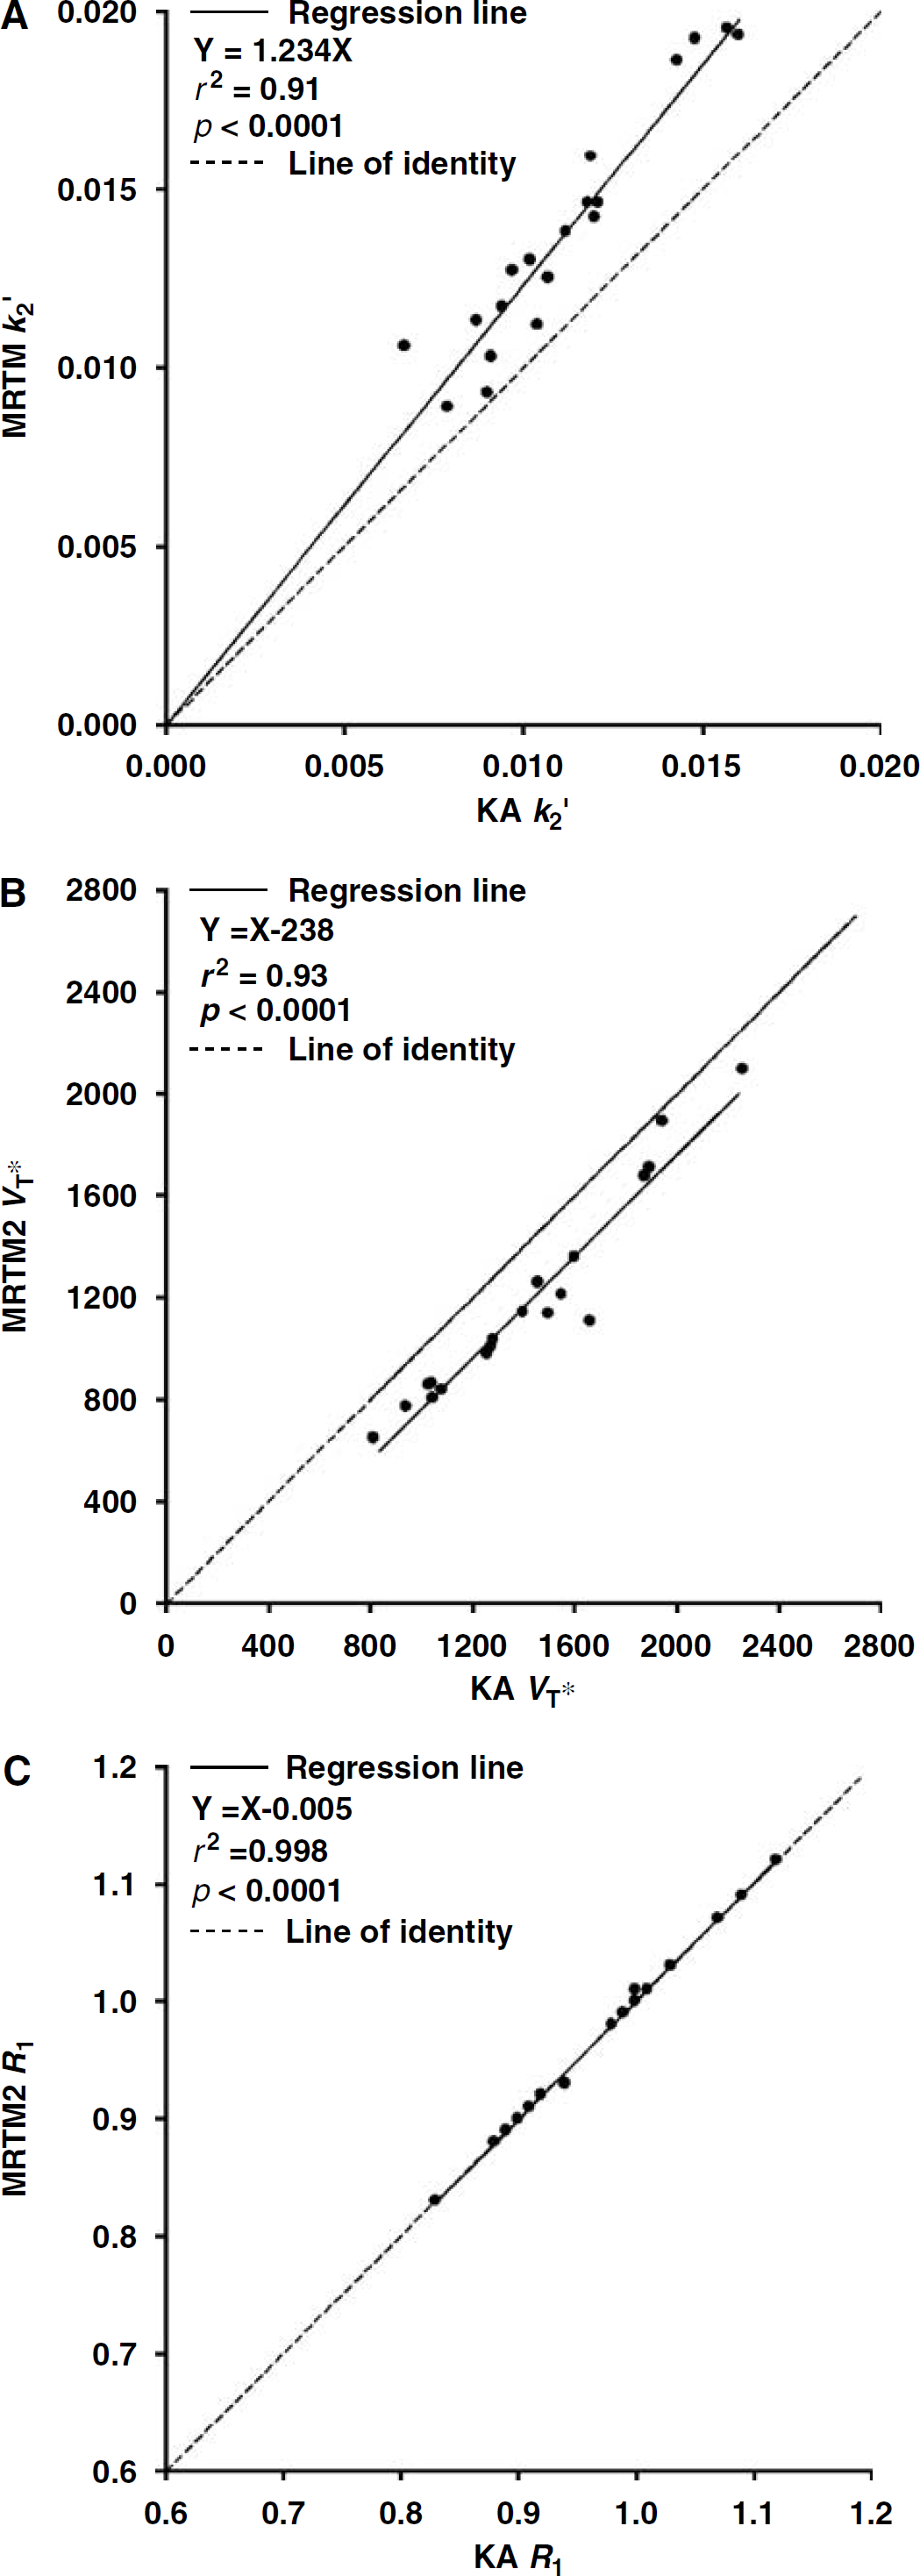
Estimation of k′2. The MRTM k′2 values (0.014 ± 0.003 min−1, CV = 25%) were higher by 24 ± 12% than those estimated by 1TKA (0.011 ± 0.003 min−1, CV = 22%) with a strong positive linear correlation between the two methods of estimation (r2 = 0.91, n = 19 subjects; Figure 1A). This k′2 bias motivated the simulation study (see below).
(
Parametric Images. The noise magnitude of the MRTM2 V*T and R1 images were nearly identical to the corresponding 1TKA VT and K1 images, where V*T or VT and R1 or K1 images reflected the knownregional distribution of M2 receptors and brain blood flow, respectively (Figure 2).
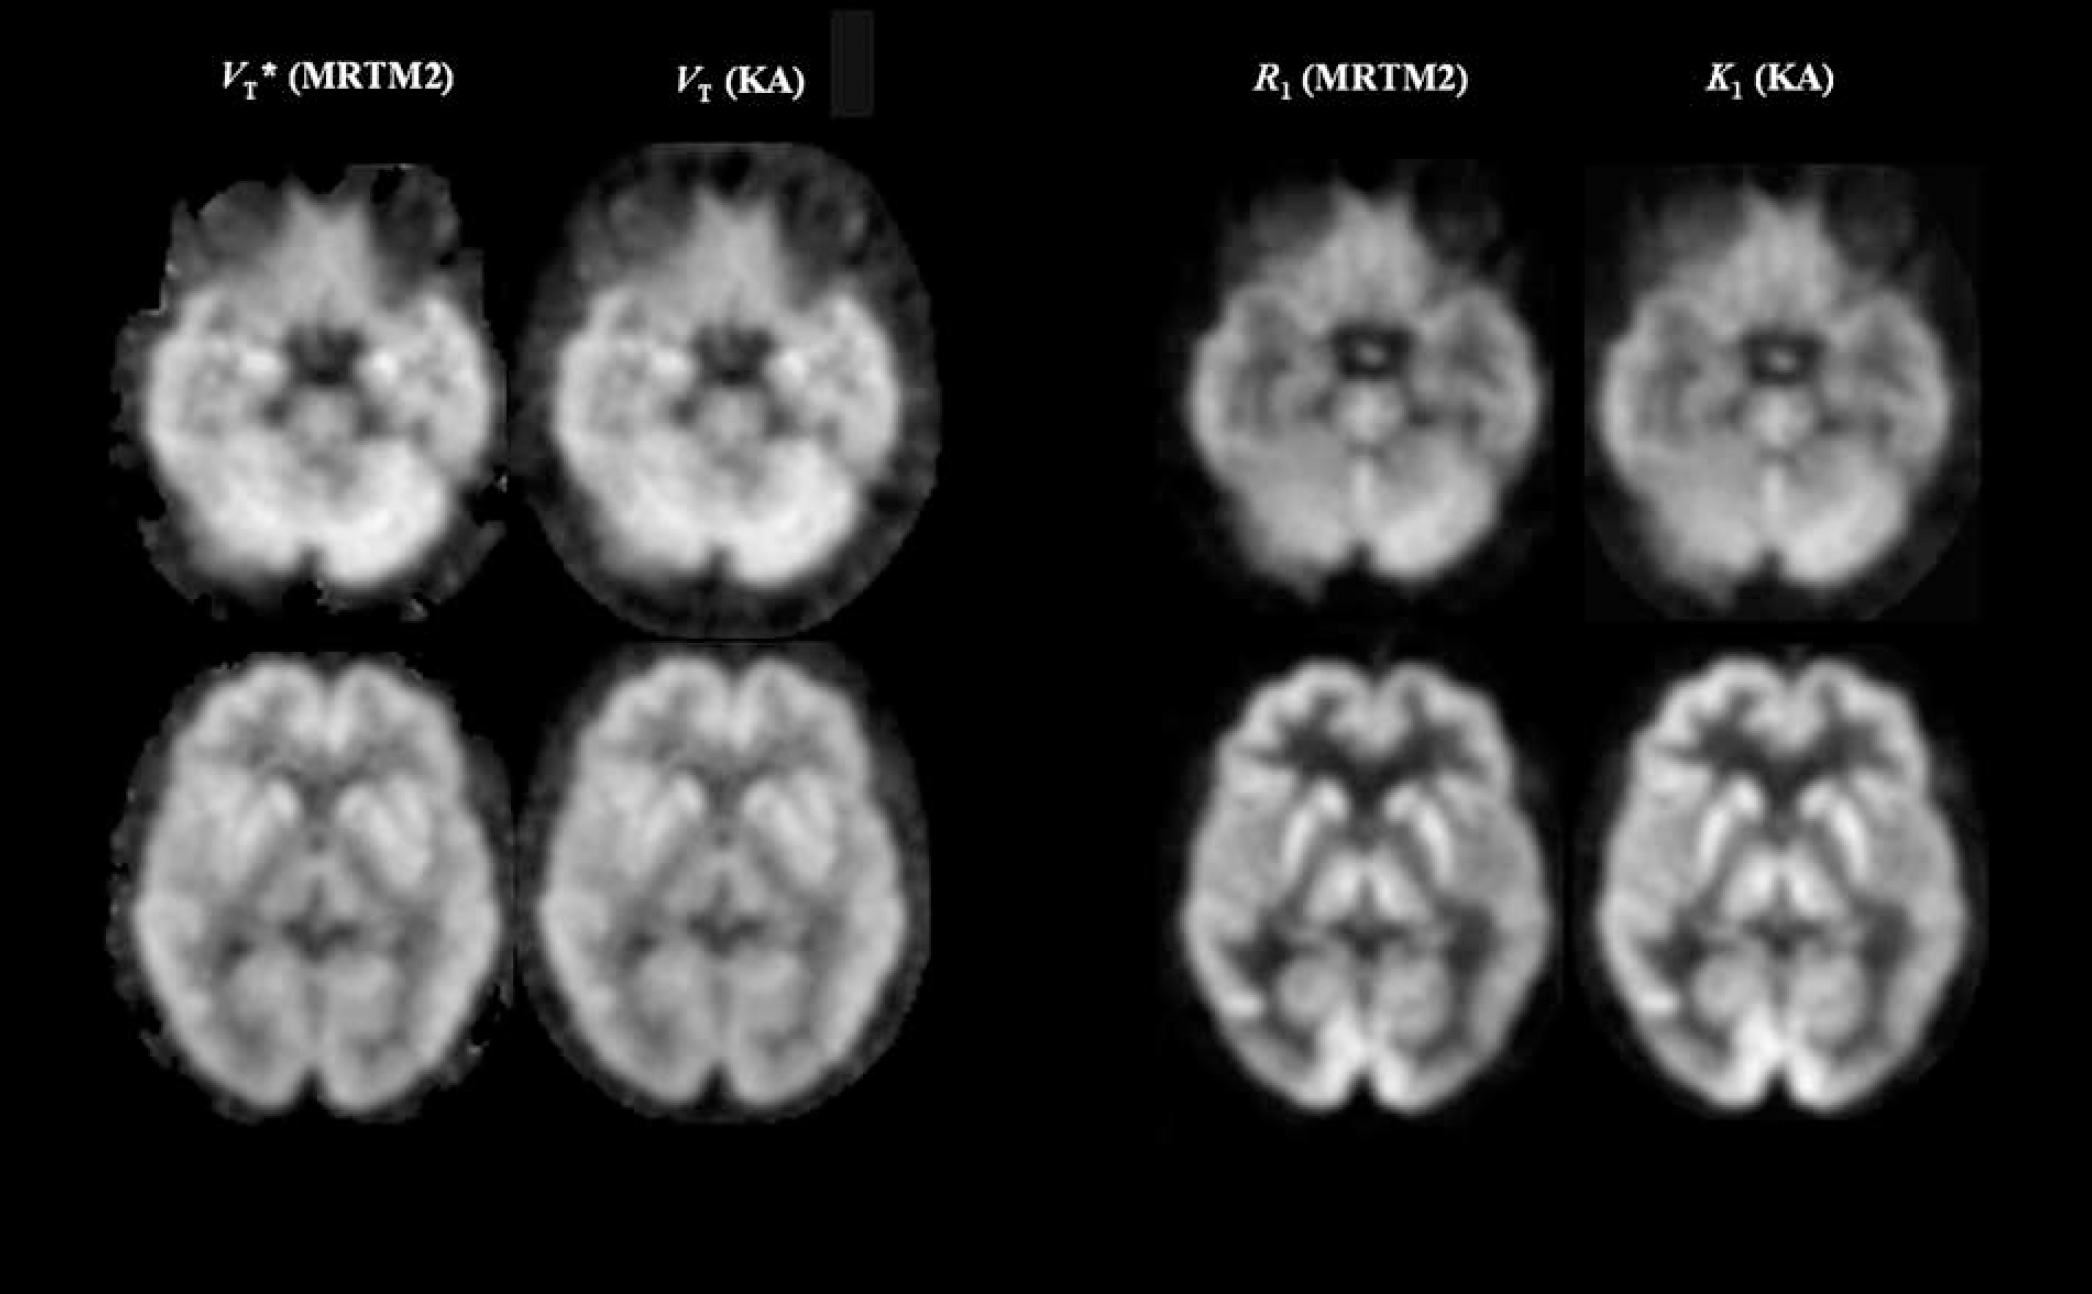
Parametric images of the normalized distribution volume (V*T) versus distribution volume (VT) (left two columns), and the relative tracer delivery (R1) versus tracer delivery (K1) (right two columns). V*T and R1 images were generated by the two-parameter multilinear analysis (MRTM2), whereas VT and K1 images were generated by the nonlinear one-tissue kinetic analysis (1TKA). Images are normalized to the maximal voxel value within the brain displayed using a linear gray scale (white to black in descending voxel values).
Estimation V*T and R1. The mean MRTM2 V*T values of six cerebral cortex regions (1,178 ± 403 mins, ∼3,400 voxel values per subject, n = 19) were lower by 18% than the mean 1TKA V*T values (1,420 ± 391 mins), with mean percent voxel-wise V*T differences between the two methods (–18 ± 7%) and a strong positive linear correlation between the two methods (r2 = 0.93, n = 19 subjects) (Figure 1B) There was a significant linear correlation (r2 = 0.57, n = 19) between the MRTM2 V*T and 1TKA VT (643 ± 124 mL/cm3) values. The intersubject variability of MRTM2 V*T, 1TKA V*T, VT, and K′1 (0.466 ± 0.067 mL/min per cm3) were 25, 21, 17, and 14%, respectively. Conversely, the mean R1 values (0.97 ± 0.08, CV = 8%) estimated by MRTM2 were virtually identical to the mean R1 values estimated by 1TKA (0.97 ± 0.08, CV = 8%), with mean percent voxel-wise differences between the two methods (0.1 ± 0.4%) and a very strong positive linear correlation between the two methods (r2 ≈ 1.0, n = 19 subjects) (Figure 1C). Thus, despite the use of biased estimate of k′2 for MRTM2, R1 estimation was unbiased and was very similar to R1 estimation by 1TKA, whereas V*T showed a consistent bias.
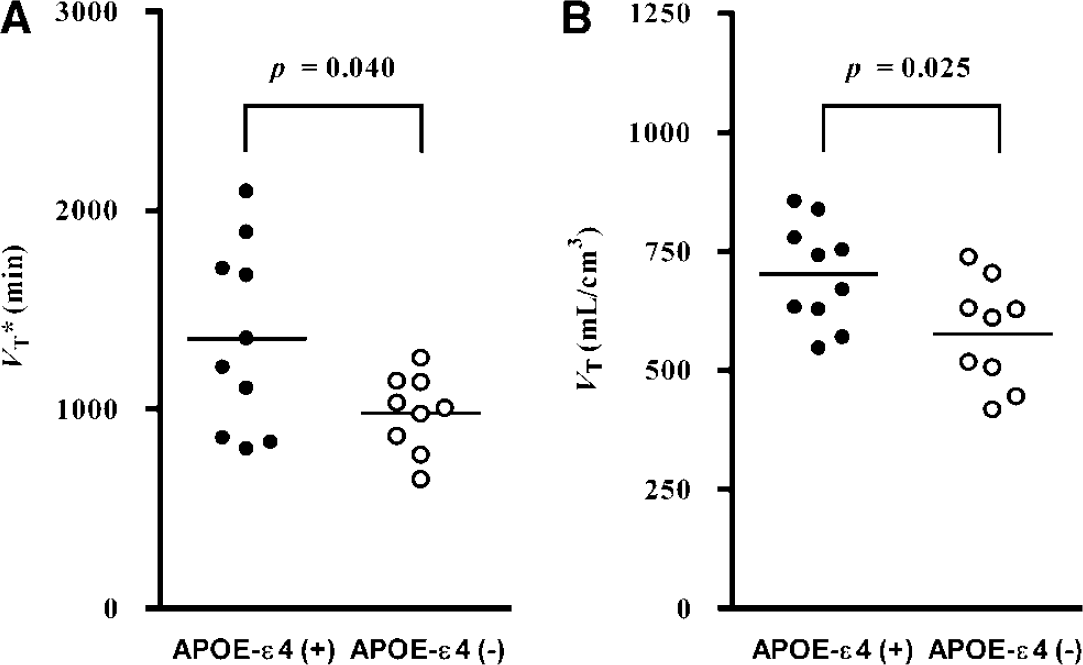
APOE-ε4(+) versus APOE-ε4(–). The mean MRTM2 V*T (mins) values (1,659 ± 497) in APOE-ε4(+) were higher by 38% than those (1,209 ± 233) in APOE-ε4(–) (Figure 3A). Similarly, the 1TKA VT (mL/cm3) values (701 ± 99) in APOE-ε(+) were higher by 22% than those (577 ± 112) in APOE-ε4(–) (Figure 3B). However, the statistical significance for MRTM2 V*T comparison (P = 0.041) was slightly lower than that for 1TKA VT comparison (0.025) (Figure 3). There were no significant differences in the mean fP (P = 0.17) or K1 (P = 0.54) between APOE-ε4(+) (fP = 0.055 ± 0.010 and K′1 = 0.457 ± 0.082 mL/min per cm3) and APOE-ε4(–) (fP = 0.063 ± 0.011 and K′1 = 0.477 ± 0.048 mL/min per cm3). The statistical significance for V*T (0.041) was thus lower than that for VT (0.025), owing to the higher intersubject variability of V*T (25%) than that of VT (17%), caused presumably by the variability of K′1 (14%) and a higher variability of MRTM k′2 (25%) than that of 1TKA k′2 (22%). In contrast to V*T or VT, however, there were no significant differences in the mean R1 (P = 0.6) or K1 (P = 0.7) values between APOE-ε4(+) (R1 = 0.980 ± 0.073 and K1 = 0.446 ± 0.072 mL/min per cm3) and APOE-ε4(–) (R1 = 0.958 ± 0.087 and K1 = 0.454 ± 0.035 mL/min per cm3).
Comparison of VT (
Simulation Analysis
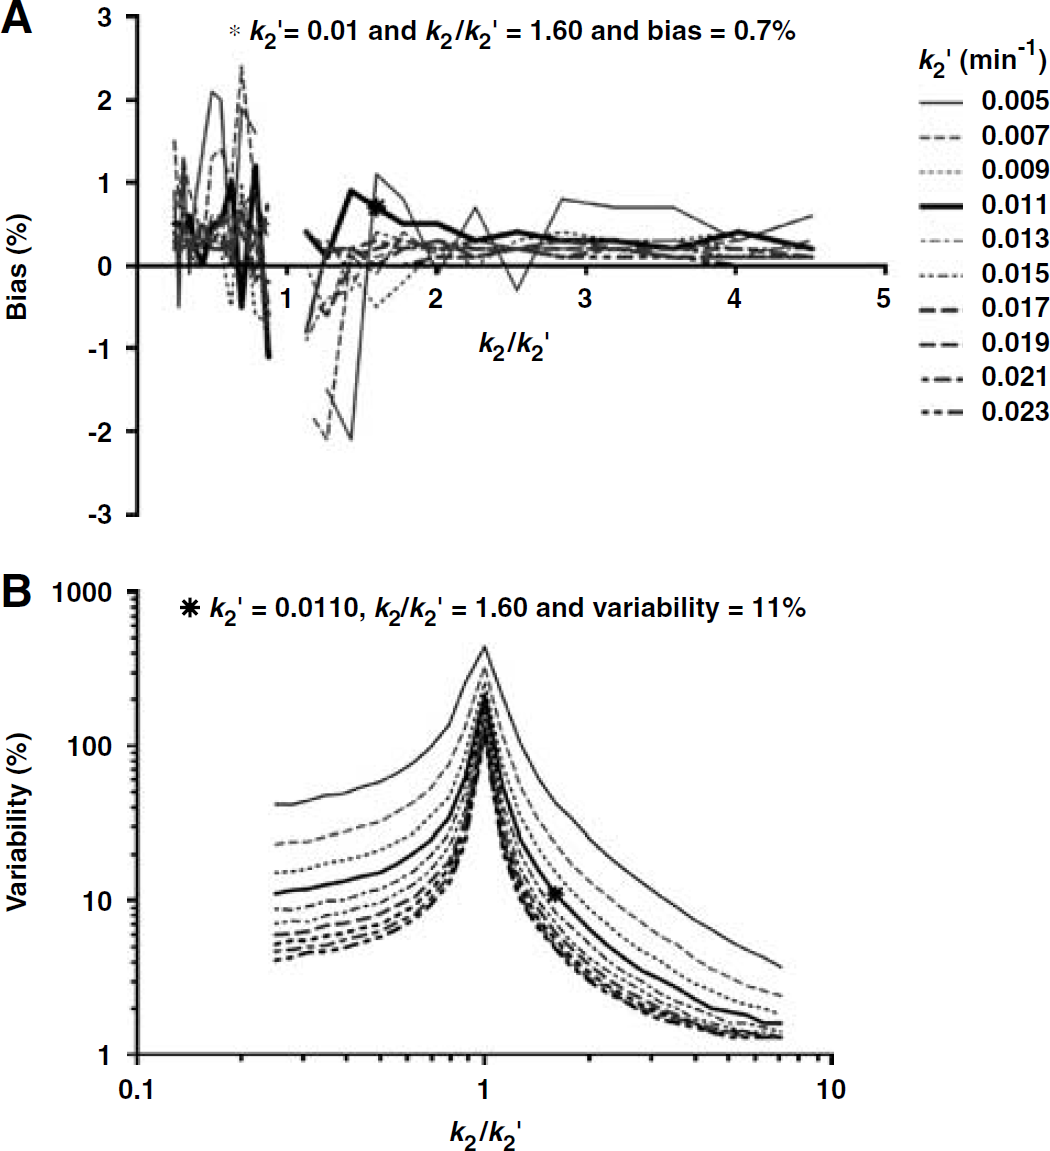
Figure 4 shows bias (4A) and variability (4B) of k′2 estimation by MRTM at target region noise (thalamus) of 1.5% for simulated time—activity data with parameter values from Table 2 in the k2/k′2 parameter space. The bias of k′2 estimation by MRTM was very small at 0.7% (Figure 4A) and relatively independent of the magnitude of k′2 across the k2/k′2 parameter space except when k2/k′2 became very close to unity (bias = 130% when k2/k′2 was unity) (Figure 4A). The reason for this exceptionally large k′2 bias at k2/k′2 = 1 is that equation (3) becomes unstable when both the input and target regions have the same tissue clearance rate constant (k′2 = k2). The MRTM k′2 bias for the simulated data was not consistent with that for our [18F]FP-TZTP data, where MRTM k′2 was positively biased by 24% (see above). This inconsistency of the MRTM2 k′2 bias prompted the further simulation study (see Appendix A and Figure 5).
Bias (
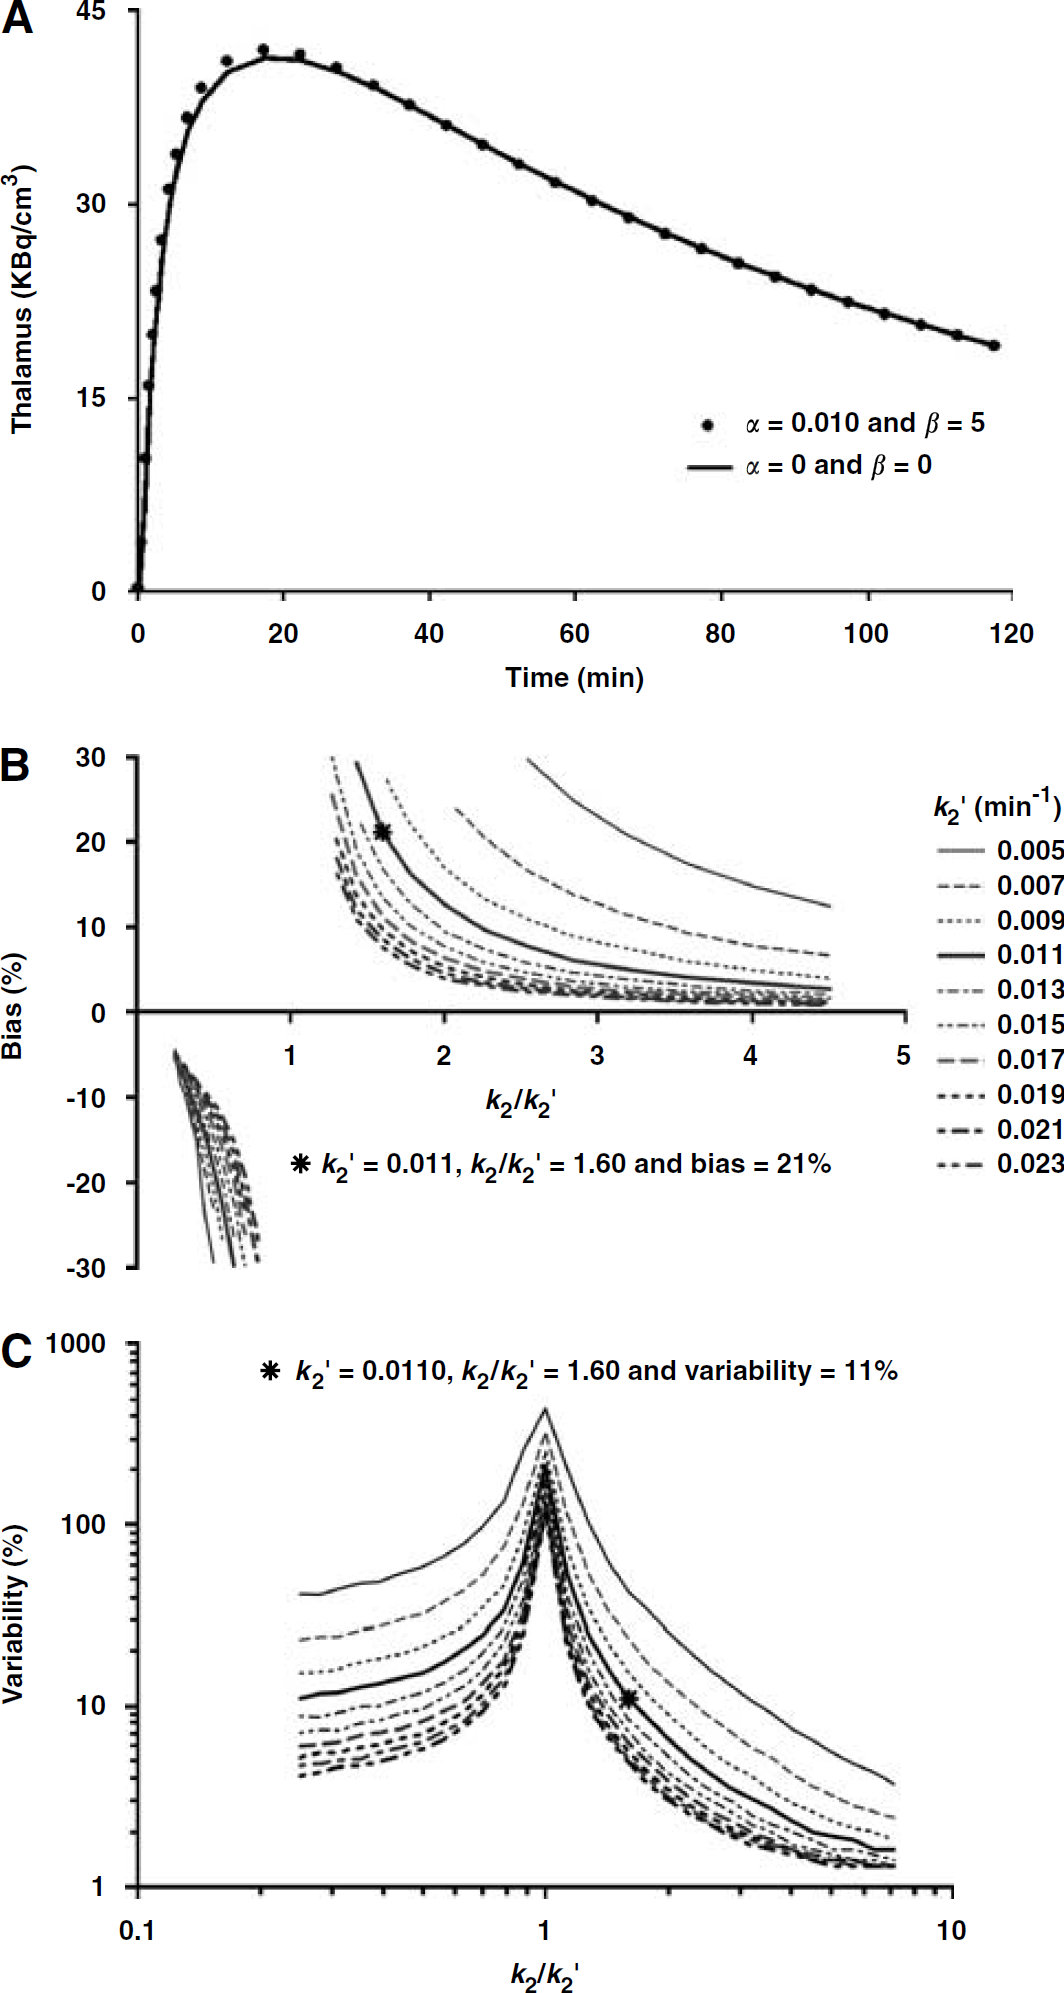
A perfect 1T TAC (α = 0 and β = 0, solid line) and a slightly discrepant 1T TAC (α = 0.01 and β = 5, solid circle) simulated according to equation (4) using the parameter values for thalamus in Table 2 (
In contrast to the bias, the MRTM k′2 variability was strongly dependent on both the k2/k′2 ratio and the magnitude of k′2. The k′2 variability increased asymptotically as k2/k′2 approached unity (Figure 4B). Conversely, the k′2 variability decreased as k2/k′2 moved further away from unity. For example, with k′2 = 0.011, the variability was 2.3, 11.0, and 230% when k2/k′2 was 4.0, 1.6, and 1.0, respectively. In addition, the k′2 variability in the k2/k′2 space decreased progressively as the k′2 value increased (Figure 4B). For example, with k′2 = 0.023, the variability was 1.5, 4.9, and 118% when k2/k′2 was 4.0, 1.6, and 1.0, respectively.
In contrast to the case with the data simulated by the perfect IT model, as described in detail in Appendix A, the bias of MRTM k′2 estimation for the slightly discrepant [18F]FP-TZTP 1T data was significantly biased (Figure 5B). However, the variability of k′2 estimation was essentially the same for the two data sets (Figures 4B and 5C). The simulation data for the slightly discrepant 1T model also showed that both the bias and variability of MRTM k′2 estimation could be significantly reduced if k2/k′2 was well away from unity.
Discussion
Traditional noninvasive reference tissue parameter estimation methods are not applicable to many neuroreceptor radioligands such as [18F]FP-TZTP for muscarinic M2 receptors, [11C]flumazenil for benzodiazepine receptors, and 2-[18F]fluoro-3-(2(S)azetidinylmethoxy)pyridine (2[18F]A) or [123I]5-iodo-3-(2(S)-2-azetidinylmethoxy) pyridine ([123I]5-I-A) for α4β2 nicotinic receptors, because there are no suitable receptor-free reference regions for these tracers. For these tracers, therefore, the total distribution volume (VT) has been used as a receptor parameter for the comparison of different subject groups. However, VT estimation requires the acquisition of invasive arterial blood samples and technically demanding corrections for radiolabeled metabolites. In this study, to avoid the need for arterial samples, we first defined a parameter, called the normalized distribution volume (V*T = VT/K′1), which is VT normalized by the tracer delivery (K′1) of receptor-containing input region (here, the cerebellum). Then, we proposed the estimation of V*T and relative tracer delivery (R1) by the MRTM2 for [18F]FP-TZTP PET human data. As expected, the MRTM2 V*T was able to discriminate between APOE-ε4(+) and APOE-ε4(–) groups in a similar manner to that shown previously for VT. Thus, V*T may be a useful receptor parameter, which can be estimated noninvasively for tracers such as [18F]FP-TZTP without any suitable receptor-free reference region. Although this receptor parameter, V*T, was useful to make intergroup comparisons in this study, it should also be useful for within-subject comparisons in experimental paradigms to evaluate drug effects, activations, and so on), provided that K′1 (tracer delivery of the input region) does not change between experimental conditions or K′1 is reproducible within-subject on different scan occasions.
In this study, the receptor parameters, V*T and VT, were normalized by the plasma-free fraction, fP. Measurement of fP is actually no more invasive than is intravenous injection of the tracer. Measurements of fP requires only a small amount of venous blood obtained just before injection of the tracer from the same intravenous line for the tracer injection. Determination of fP is accomplished in vitro by ultrafiltration and no metabolite correction is needed. VT is the sum of VS (specific distribution volume) and VND (nondisplaceable distribution volume). VS is proportional to the concentration of unoccupied or available receptor, Bavail, as follows: VS = fP Bavail/KD, where KD is the dissociation constant. Therefore, normalization of VT or V*T by fP removes this nonreceptor factor, fP, from the parameters VT or V*T. The fP normalization is therefore appropriate when the plasma protein binding of radioligands has significant intersubject variability and/or it is different between subject groups. The intersubject variability of fP for [18F]FP-TZTP in this study was 20% and the mean subgroup fP was lower by 12% for the APOE-ε4(+) group than was for the APOE-ε4(–), although this difference was not statistically significant. As was originally reported by Cohen et al, VT normalized by fP was significantly higher in the APOE-ε4(+) group than was in the APOE-ε4(+) group. Without this fP normalization, VT (mL/cm3) was higher by 12% in the former (38 ± 7) than in the latter (35 ± 5). However this VT difference was no longer statistically significant (P = 0.3). Likewise, V*T without fP normalization was higher by 18% in the former, but the difference was not statistically significant either.
In this study, V*T was normalized by fP to remove the contribution of plasma protein binding as explained above. V*T is defined as VT/K′1 = K1/k2K′1 containing the K1/K′1 ratio. However, the normalization of V*T by fP does not cancel in this ratio for the following reason. The plasma-free fraction, fP, is the equilibrium-free fraction in plasma. In general, higher free fraction correlates (ideally linearly) with higher tracer activity levels in tissue and higher VT values. However, K1 or K′1 is different; it is not an equilibrium value. In most cases, tracer easily comes off the protein and can enter the brain during one capillary transit, that is, fP does not linearly affect K1. If it did, then the highest possible value for K1 would be fP × CBF (cerebral blood flow). For [18F]TZTP, K1 is equal to approximately 80% of CBF (as measured with [15O]water), as opposed to 10% of CBF (fP ∼ 10%). Thus, while there may be a mild correlation between K1 or K′1 and fP, division of K′1 by fP is inappropriate. Therefore, V*T is affected linearly by fP, whereas the effects of fP on K1 or K′1 are minor, that is, the predominant effect is in k2. Therefore, normalization by fP is appropriate for both VT and V*T.
One advantage of V*T is that it is not affected by potential errors in the measurements of arterial plasma data and metabolite corrections, because V*T estimation involves only the tissue TACs and not the plasma data. However, in the case of [18F]FP-TZTP, statistical significance for MRTM2 V*T comparison was somewhat lower than that for 1TKA VT comparison (Figure 3) due to a higher intersubject variability in V*T (25%) than in VT (17%). Therefore, the use of V*T would require a larger sample size to achieve the same significance as VT (see below). The relatively small intersubject variability of VT of only 17% and the fact that 1TKA showed excellent data fitting (data not shown) suggest that errors in the measurements of plasma radioligand activity including metabolite corrections were probably small in this study. The significant increase in the variability of MRTM2 V*T as compared with ITKA VT was caused by two factors in this study. First, although there were no differences in the mean input region K′1 between the two groups, the intersubject variability in K′1 (14%) inherently increased the intersubject variability of V*T(= VT/K′1), under the assumption of no correlation between VT and K′1. If VT and K′1 are positively (or negatively) correlated, then V*T will have a smaller (or larger) intersubject variability than in the case where the values are uncorrelated.
In this study, VT and K′1 were correlated positively (r = 0.17) in the APOE-ε4(–) group and negatively (r = −0.43) in the APOE-ε4(+) group. Although neither of these correlations was statistically significant (i.e., random observation), these correlations affected the intersubject V*T variability of the two groups differently, such that the V*T variability (19%) in the APOE-ε4(–) was similar to that of VT (19%), whereas it was considerably higher (30%) than that of VT (14%) in the APOE-ε4(+) group (Figure 3) (with the two groups combined, the variability of V*T was 25% and that of VT was 17%). Second, MRTM k′2 (25%) had a higher intersubject variability than that by 1TKA k′2 (22%), which also contributed to the higher variability of V*T. In the latter situation, our simulation study suggests that variability of MRTM k′2 can be significantly reduced if an input tissue region can be selected such that k2/k′2 is well away from unity. However, the availability of such an input region depends on the tracer.
The increase in intersubject variability of V*T (25%) as compared with VT (17%) with [18F]FP-TZTP in this study reduced the statistical significance to P = 0.040 from P = 0.025. For V*T to have the same statistical significance as VT, the sample size would need to be increased. We performed a power analysis to calculate the required sample size (N) for a future study to detect the same mean differences as found in this study of VT or V*T between the two populations (APOE-ε4(+) and APOE-ε4(–)) at a power of 80% and an α = 0.05 given the two subgroup pooled standard deviations of 124 mL/cm−3 for VT and 489 min−1 for V*T. This power analysis showed that N = 17 for VT and N = 20 for V*T. The use of V*T would thus require a slightly larger sample size to achieve the same statistical significance as VT. Therefore, one needs to consider carefully the advantage (noninvasive) and disadvantage (a larger sample size) of this V*T method in designing [18F]FP-TZTP PET experiments.
In this study, MRTM estimation of k′2 was substantially biased (+24%), which resulted in biased estimation of V*T by MRTM2 (–18%), although R1 was unbiased. Our simulation analysis has shown that this k′2 bias can be introduced by ROI data that slightly disagrees with the 1T model, by adding another parallel tissue compartment. However, this MRTM k′2 bias is a systematic bias with its characteristics dependent on k′2 and k2/k′2 (Figure 5B). As is the case with the k′2 estimation variability, this k′2 bias can be significantly reduced if an input tissue region can be selected such that k2/k′2 is well away from unity. However, this k′2 bias per se would not reduce the group discriminatory power of the receptor parameter V*T, because there are no differences in the variability of MRTM k′2 estimation at a noise level of 1.5% between the 1T and slightly discrepant 1T data. However, as compared with the 1TKA V*T, the variability of MRTM2 V*T increases because of the variability of MRTM k′2 estimation, which in turn reduces the statistical group discriminatory power of MRTM2 V*T. For the use of V*T as a receptor parameter, however, it is important that an input region be defined such that the tracer delivery (K′1) is unchanged between subject groups or experimental conditions. Otherwise, group difference in V*T could be misinterpreted. In addition, use of V*T as a measure of group differences in receptor binding also depends on the assumption that there is no difference in the level of nonspecific binding between groups.
Our simulation analysis of MRTM k′2 estimation in the k2/k′2 space suggests that the k2/k′2 ratio and the magnitude of k′2 are key to accurate k′2 estimation by MRTM. With k′2 = 0.011 and, for example, k2/k′2 > 3, both the bias and variability MRTM k′2 estimation would be very small. However, for our [18F]FP-TZTP PET data, there are no regions that can give k2/k′2 > 3. Thus, the availability of two tissue regions with k2/k′2 well away from unity and high values of k′2 will depend on the tracer and the type of receptor system being imaged. Previously, we applied the MRTM2 to estimate BPND with serotonin transporter imaging tracer, [11C]DASB (Ichise et al, 2003), where the cerebellum was chosen as an input region (receptor-free). The mean k′2 was very high (0.056 min−1) and k2/k′2 ranged from 0.23 to 0.38 (or k′2/k2 ranged from 2.6 to 4.3). The variability of MRTM k′2 estimation was small (> 6%), which is consistent with our current simulation analysis results (Figures 4B and 5C). Although the k2/k′2 ratio for [18F]FP-TZTP was only 1.6, it can be much higher for other tracers as well. For example, for [123I]5-I-A, the k2/k′2 ratio (thalamus/cerebellum) can be close to 3 with k′2 = 0.015 min−1 (Ichise et al, 2004). For [123I]5-I-A, there is also no suitable receptor reference region because of wide spread distribution of α4β2 nicotinic receptors in brain. Therefore, [123I]5-I-A may be an example where V*T may be a useful noninvasive receptor parameter, provided that K′1 of the input region (e.g., the cerebellum) is unchanged between subject groups. Another example is [11C]flumazenil for imaging of the central benzodiazepine receptor, which is also widely distributed in the brain. [11C]flumazenil is characterized by 1T kinetics and k2/k′2 ratio (pons/cerebellum) is 2.2 with k′2 = 0.091 min−1 (Koeppe et al, 1991). Although the k2/k′2 ratio is only slightly higher than that for [18F]FP-TZTP (1.6), this increase to 2.2 has a substantial effect on reducing the bias and variability of k′2 estimation to only a few percent (Figures 5B and 5C). Additionally, k′2 (0.091) is much higher than that for [18F]FP-TZTP (0.011), which also contributes to decreasing the bias and variability of k′2 estimation (Figure 5).
In our previous study with [11C]DASB, MRTM2 BPND estimation was somewhat unstable in the white matter, which required R1-based thresholding of BPND in the white matter to generate cosmetically appealing parametric images (Ichise et al, 2003). However, for [18F]FP-TZTP, MRTM2 V*T parameter estimation was stable everywhere including the white matter. We have shown previously that MRTM2 parameter estimates are nearly identical to those of 1TKA when a correct value of k′2 is used (Ichise et al, 2003). Here, we used substantially biased values of k′2. Yet, the noise magnitude of the parametric images of V*T and R1 by MRTM2 were nearly identical to those of VT and K1 by 1TKA, respectively (Figure 2). In addition, although the use of the biased k′2 resulted in biased V*T, MRTM2 R1 was unbiased and was very similar to 1T R1 as expected from the fact that R1 = K1/K′1 is independent of k′2, as opposed to V*T. R1 or K1 is a linear parameter in the nonlinear 1TKA equation (equation (1)). As was the case with [11C]DASB, this study confirms that R1 estimation is more stable than BPND or V*T. In addition, the parameter estimates from MRTM2 and the nonlinear version of MRTM2, that is, SRTM2 (Wu and Carson, 2002), were nearly identical with the [18F]FP-TZTP PET data (data not shown). The major advantage of the MRTM2 (or SRTM2) over its three-parameter version (MRTM or SRTM) is that there is no noise increases in parametric images for the former compared with 1TKA, as opposed to substantial noise increases in parametric images for the latter (Ichise et al, 2003; Wu and Carson, 2002).
Although R1 may not be a primary parameter of interest, the R1 parametric image can be very useful, for example, for MRI-PET coregistration. In this study, to define ROIs for the MRTM k′2 estimation, we used K1 and MRI images, because K1 images were available in this study. However, the fact that MRTM2 allows generation of accurate, low-noise R1 parametric images even when MRTM k′2 is biased suggests that we could perform MRTM2 parametric imaging in two steps. In the first step, ROIs (cerebellum and thalamus) are drawn on the summed PET raw images. These ROIs are then applied to dynamic PET data. Then a preliminary k′2 value is obtained by MRTM fitting of these ROI TACs. This initial k′2 allows generation of preliminary R1 images by MRTM2. In the second step, these preliminary R1 images in conjunction with MRI can be used to define more accurate ROIs (cerebellum, thalamus, and striatum). Then, the MRTM k′2 estimation and MRTM2 procedures are repeated to generate final V*T and R1 images. Although this strategy requires two steps, computation time for MRTM2 parametric imaging is quite small.
Finally, this V*T method was applied to a 1T tracer, [18F]FP-TZTP, in this study. MRTM2, however, is also applicable to 2T tracers that have appropriate receptor-free reference tissue to estimate BPND, by analyzing TAC data from a time point (t*) beyond which the operational equation (equation (3)) becomes linear. From equation (3), it is theoretically feasible to define V*T for tracers with 2T kinetics so long as the input region has 1T kinetics. However, the accuracy and precision of this method for 2T tracers need to be evaluated in the future.
Conclusions
The normalized distribution volume, V*T, defined as distribution volume VT normalized by the tracer delivery of an input region (K′1) containing receptors, can be estimated by MRTM2 without a receptor-free reference region and arterial blood. V*T can be used to identify group differences in receptor binding. However, V*T may require a larger sample size to identify the group differences in receptor binding with the same statistical significance as VT. This noninvasive MRTM2 V*T estimation method, which also allows estimation of relative tracer delivery (R1) can be a useful data analysis tool for receptor-binding tracers such as [18F]FP-TZTP with no receptor-free reference region.
Footnotes
Acknowledgements
We thank Dr Cyrill Burger for implementing the multilinear reference models in PMOD, Dr Jeih-San Liow for the technical assistance in data transfer, and Dr Robert B Innis for general assistance.
Appendix A
To evaluate the effects of a slight discrepancy of the data from the 1T model on the MRTM k′2 estimation, another tissue compartment in parallel with the original 1T compartment was added such that the total VT and K1 were kept constant according to the following equation:
where α and β are constants that determine the degree of deviation of the model from the 1T model.
Figures 5A shows a perfect 1T TAC (α = 0 and β = 0, solid line) and a slightly discrepant 1T TAC (α = 0.01 and β = 5, solid circle) simulated according to equation (4) using the parameter values for thalamus in Table 2. This magnitude of deviation from an ideal model is commonly seen in neuroimaging data. Figures 5B and 5C show the bias and variability of k′2, respectively, at target region noise of 1.5% in the k2/k′2 parameter space when α = 0.01 and β = 5. In contrast to the case with the data simulated by the perfect IT model (Figure 4), MRTM k′2 was significantly biased, where the bias increased with increasing values of α and β (data not shown). We set α = 0.01 and β = 5 for further simulations, because the MRTM k′2 bias was then 21%, which was close to the k′2 bias (24%) for the [18F]FP-TZTP data. The MRTM k′2 bias for the slightly discrepant 1T data was dependent on both the k2/k′2 ratio and the magnitude of k′2 (Figure 5B). The k′2 bias increased asymptotically as k2/k′2 approached unity (Figure 5B). Conversely, the k′2 bias decreased as k2/k′2 noted further away from unity. For example, with k′2 = 0.011, the k′2 bias was 3.5, 21.0, and 320% when k2/k′2 was 4.0, 1.6, and 1.0, respectively. The k′2 bias also decreased progressively as the k′2 value increased (Figure 5B). For example, with k′2 = 0.023, the bias was 1.0, 7.6, and 210% when k2/k′2 was 4.0, 1.6, and 1.0, respectively. Finally, the MRTM k′2 variability profile in the k2/k′2 space for the slightly discrepant 1T data (Figure 5C) was very similar to that for the unperturbed 1T data (![]() ). These simulation analyses thus showed that the slight discrepancies between the [18F]FP-TZTP data and the 1T model could cause significantly biased MRTM k′2 estimation and that both the bias and variability of MRTM k′2 estimation could be significantly reduced if k2/k′2 was far away from unity.
). These simulation analyses thus showed that the slight discrepancies between the [18F]FP-TZTP data and the 1T model could cause significantly biased MRTM k′2 estimation and that both the bias and variability of MRTM k′2 estimation could be significantly reduced if k2/k′2 was far away from unity.