
Abstract
Inflammation in Alzheimer's disease (AD) may be assessed using (R)-[11C]PK11195 and positron emission tomography. Data can be analyzed using the simplified reference tissue model, provided a suitable reference region is available. This study evaluates various reference regions for analyzing (R)-[11C]PK11195 scans in patients with mild cognitive impairment (MCI) and probable AD. Healthy subjects (n = 10, 30 ± 10 years and n = 10, 70 ± 6 years) and patients with MCI (n = 10, 74 ± 6 years) and probable AD (n = 9, 71 ± 6 years) were included. Subjects underwent a dynamic three-dimensional (R)-[11C]PK11195 scan including arterial sampling. Gray matter, white matter, total cerebellum and cerebrum, and cluster analysis were evaluated as reference regions. Both plasma input binding potentials of these reference regions (BPPLASMA) and corresponding reference region input binding potentials of a target region (BPSRTM) were evaluated. Simulations were performed to assess cluster analysis performance at 5% to 15% coefficient of variation noise levels. Reasonable correlations for BPPLASMA (R2 = 0.52 to 0.94) and BPSRTM (R2 = 0.59 to 0.76) were observed between results using anatomic regions and cluster analysis. For cerebellum white matter, cerebrum white matter, and total cerebrum a considerable number of unrealistic BPSRTM values were observed. Cluster analysis did not extract a valid reference region in 10% of the scans. Simulations showed that potentially cluster analysis suffers from negative bias in BPPLASMA. Most anatomic regions outperformed cluster analysis in terms of absence of both scan rejection and bias. Total cerebellum is the optimal reference region in this patient category.
Keywords
Introduction
Alzheimer's disease (AD) is a neurodegenerative disease associated with activation of normally dormant microglia cells (Cagnin et al, 2001a). These microglia cells are the brain's intrinsic macrophages (Kreutzberg, 1996). Activated microglia express the peripheral benzodiazepine receptor, but expression of this receptor on other constituents of the brain is low (Banati et al, 2000). Thus compounds that bind to the peripheral benzodiazepine receptor can be used to image-activated microglia.
PK11195 is a specific ligand for the peripheral benzodiazepine receptor, which has been used to investigate microglia activation using either positron emission tomography (PET) or single photon emission computed tomography. Unfortunately, analysis of (R)-[11C]PK11195 PET scans has proven to be difficult because of its low specific to nonspecific binding ratio and its very low extraction fraction (Kropholler et al, 2005). Consequently, attention should be paid toward optimizing methods for extracting the specific signal. Currently, more promising peripheral benzodiazepine receptor tracers are under investigation, such as DAA1106 (Maeda et al, 2004; Ikoma et al, 2007) and vinpocetine (Gulyas et al, 2002a, b, c, 2005).
Several (R)-[11C]PK11195 studies investigating AD have been undertaken. Two studies used PET (Groom et al, 1995; Cagnin et al, 2001a) and one single photon emission computed tomography (Versijpt et al, 2003). Only Cagnin et al, (2001a) used the pure (R)-enantiomer, which has higher binding than the (S)-enantiomer (Shah et al, 1994), whereas the other studies used a racemic mixture. To determine the degree of binding in the regions of interest (ROI), all three studies used a tracer kinetic model depending on a reference region either by using the simplified reference tissue model (SRTM) (Lammertsma and Hume, 1996) or by normalizing activities. Two groups (Groom et al, 1995; Versijpt et al, 2003) used cerebellum as reference region, whereas a different group used a cluster analysis method to derive the reference region (Ashburner et al, 1996; Cagnin et al, 2001a). This cluster analysis approach is commonly used to analyze (R)-[11C]PK11195 scans (Banati et al, 2000, 2001; Cagnin et al, 2004, 2001b; Gerhard et al, 2003; Turner et al, 2004, 2005; Henkel et al, 2004). Recently, a comparison of parametric methods for analysis of (R)-[11C]PK11195 was published by our group (Schuitemaker et al, 2007).
For analysis of (R)-[11C]PK11195 PET scans in AD and mild cognitive impairment (MCI), it has been argued that the cerebellum may be inadequate as a reference region, as activated microglia could be present (Braak and Braak, 1991). Therefore, cluster analysis, which defines groups of voxels with a ‘normal’ (R)-[11C]PK11195 binding, could be an alternative method, as this method does not depend on predefined regions. However, this method has not been fully validated yet. It is of interest to note that the two PET studies of Groom (Groom et al, 1995) and Cagnin et al (2001a) produced conflicting results. It is likely that these different results are, at least in part, because of differences in methodology. Clearly, there is a need to evaluate which method is optimal for defining a reference region for (R)-[11C]PK11195 studies in AD. This is especially important for multicentre studies on MCI.
The purpose of this study was to compare various reference region definitions and to evaluate their applicability for analysing differences in microglia activation in MCI and AD subjects. Moreover, simulations were performed to evaluate the performance of the cluster analysis approach under the influence of varying blood volume fractions (Vb) and number of extracted clusters.
Materials and methods
Clinical Evaluation
Subjects: Four groups were included, namely younger healthy subjects (n = 10, 7 male subjects, age 30 ± 10 years), elderly healthy subjects (n = 10, 6 male subjects, age 70 ± 6 years), patients diagnosed with amnestic MCI (n = 10, 6 male subjects, age 74 ± 6 years) according to Petersen criteria (Petersen et al, 1999) and subjects diagnosed with probable AD (n = 9, 6 male subjects, age 71 ± 6 years), meeting NINCDS-ADRDA criteria (McKhann et al, 1984). Average (± s.d.) mini mental state examination scores (Folstein et al, 1975) were 29 ± 1 for elderly healthy subjects, 26 ± 1 for MCI patients and 22 ± 3 for AD patients, respectively. Control subjects had a normal physical and neurologic examination, including screening laboratory assessments, and had a normal magnetic resonance imaging (MRI) scan, which was evaluated by a neuroradiologist. The study was approved by the medical ethics committee of the VU University Medical Centre and all experiments were performed in line with the recommendations of the Helsinki declaration. All subjects gave written informed consent before inclusion. Data were only used for comparison of methods. Clinical results are beyond the scope of the present study and will be reported elsewhere.
Scanning Protocol: All subjects underwent a 1-h dynamic brain scan in three-dimensional mode performed on a Siemens/CTI ECAT EXACT HR + scanner (CTI/Siemens, Knoxville, TN, USA). Characteristics of this scanner have been reported elsewhere (Brix et al, 1997; Adam et al, 1997). Frame durations of the scan were, in order, 1 × 15, 1 × 5, 1 × 10, 2 × 15, 2 × 30, 3 × 60, 4 × 150, 5 × 300, and 2 × 600 secs. A bolus of 400 × 60 MBq of (R)-[11C]PK11195 with a specific activity of 65 × 32 GBq/μmol at time of injection was injected at the start of the scan. A neuro-insert (CTI, Knoxville, TN, USA) was used to decrease scatter from outside the field of view. Before tracer injection, a two-dimensional transmission scan was performed, which was used to correct the subsequent emission scan for attenuation. Arterial blood was withdrawn continuously using a blood-sampling device described previously (Boellaard et al, 2001). At set times (3, 5, 10, 20, 30, 40, and 60 mins after injection), continuous blood sampling was interrupted briefly for withdrawal of manual samples followed by flushing of the arterial line with heparinized saline. Radioactivity concentrations of (R)-[11C]PK11195 in plasma and whole blood of the manual samples were measured using a cross-calibrated well counter, and metabolites in plasma using high-pressure liquid chromatography analysis, as described previously (Greuter et al, 2005).
In addition, all subjects underwent a T1 weighted MRI scan on a 1T IMPACT scanner (Siemens Medical Solutions, Erlangen, Germany). This scan was used for gray/white matter segmentation and for ROI definition.
Image Reconstruction: All emission scans were normalized and corrected for attenuation, randoms, dead time, scatter (Watson, 2004), and decay. Emission scans were reconstructed using filtered back projection with a Hanning filter with cutoff at 0.5 times the Nyquist frequency. A zoom factor of 2 and a matrix size of 256 × 256 × 63 were used, resulting in a voxel size of 1.2 × 1.2 × 2.4 mm and a reconstructed spatial resolution of approximately 7 mm full-width at half-maximum at the center of the field of view.
Region of Interest Definition and Extraction of Time-Activity Curves: The skull was removed from the MRI scans using a brain extraction tool (Smith, 2002), which is part of the FMRIB software library (www.fmrib.ox.ac.uk/fsl, Image analysis group, Oxford, UK). Deskulled brain and corresponding PET scans were aligned using a mutual information algorithm included in the image registration package MIRIT (Maes et al, 1997; West et al, 1997). Correct alignment was checked visually. Both total cerebellum and cerebrum ROI were drawn manually on the coregistered MRI scans.
The MRI was segmented into gray and white matter (Zhang et al, 2001) and separate gray and white matter cerebellum and cerebrum ROI were defined. The software used for this segmentation was also part of the FMRIB software library. To evaluate performance of the various reference regions, parametric binding potential (BP) images (Ichise et al, 1996) were used to draw a data-driven (target) ROI around the thalamus. In agreement with a previous observation in elderly healthy subjects and AD patients (Cagnin et al, 2001a), highest binding was observed in this region. In addition, by including young healthy subjects, the thalamus ROI provided the largest range of possible BP values for the present comparison of reference regions. The cluster region was extracted as described elsewhere (Banati et al, 2000). This region represents a group of voxels with similar kinetics and does not correspond to an actual ‘anatomic’ reference region, such as cerebellum or pons. Nevertheless, as the corresponding time-activity curve (TAC) and those of cerebellum and cerebrum were compared as input curves in SRTM, the term reference region will also be used for the cluster region. Software to perform this clustering, written in Matlab (The Mathworks, Natick, MA, USA), was kindly provided by the MRC Clinical Sciences Centre (Faculty of Medicine, Imperial College, London, UK). To produce results comparable with previous studies, where no plasma input was used, the cluster with visually the lowest BP was selected as reference region. Because at several occasions clustered regions did not correspond to anatomic structures, they were evaluated visually to ensure that tissue was selected. Ten clusters were extracted from each scan (Banati et al, 2000).
Kinetic Analyses: Kinetic modeling was performed using dedicated software developed within Matlab. A metabolite-corrected plasma input function was obtained as follows. Plasma/whole-blood concentration ratios obtained from the manual blood samples were fitted to an exponential function. The whole-blood (online sampler) curve was multiplied with this exponential function to obtain the corresponding (total) plasma curve. The (R)-[11C]PK11195 parent fraction in the plasma samples was fitted to the function f = 1—a((2–exp(−bt)—exp(−ct)), where f is parent fraction and a, b, and c are positive fitted parameters. The plasma curve was multiplied with this function to obtain the metabolite-corrected plasma input function. Delay between arrival of the (R)-[11C]PK11195 bolus in the brain and at the online blood sampler was estimated by fitting a reversible two-tissue compartment model including blood volume and delay to the subjects' whole cortex TAC. Delay was then fixed to this value for all other ROI of the subject.
Reference region BP (i.e., nonspecific binding) was obtained using a reversible two-tissue compartment model (Kropholler et al, 2005), containing a blood volume term with separate inputs for metabolite-corrected plasma (input to tissue) and whole blood (fractional blood volume) and is denoted as BPPLASMA. To allow equal comparison between reference regions the K1/k2 ratio was not fixed. Binding potential in a target region was derived using SRTM (Lammertsma and Hume, 1996) and is denoted as BPSRTM. This BPSRTM was also corrected for nonspecific binding by multiplying it with 1 + BPPLASMA (Kropholler et al, 2006), which is then denoted as BPSRTM_CORR
Simulations
Simulations were performed to evaluate the ability of the cluster analysis algorithm to separate voxels with high and low BP. Because (R)-[11C]PK11195 uptake in brain is very low (K1 ∼ 0.05 ml/min ml) and the concentration in blood decreases rather slowly (50% parent fraction after 1 h), the shape of (R)-[11C]PK11195 TAC are, to a large extent, determined by the radioactivity concentration in blood. Therefore, the sensitivity of cluster analysis BPPLASMA to physiologic variation in Vb was also determined. Volumes with simulated TAC and either 5%, 10%, or 15% coefficient of variation (COV) noise level were generated and grouped into clusters. Normal tissue was simulated using a two-tissue reversible compartment model and kinetic parameters reported previously (Kropholler et al, 2005), namely K1 = 0.05 ml/min ml, k2 = 0.15 min−1, k4 = 0.04 min−1, BP =1.5, and Vb = 0.06. In the subject population, a variation in BP of 0.7 and in Vb of 0.03 was found. Volumes containing both an ROI with increased BP (2.2) and an ROI with increased Vb (Vb = 0.09) were simulated. Simulated volume size was 32 × 32 × 15 voxels. Regions of interest with different kinetics were 9 × 9 × 9 voxels large. In clinical studies, 10 clusters were used to represent structures such as tissue, blood vessels, skull and ventricles. In the simulations only three regions with different characteristics were present. To account for this smaller number two, three, or four clusters were extracted from the simulated volumes, representing a lower, the same or a higher number of clusters than present in the data. The extracted cluster ROI with lowest BPPLASMA was used as reference region cluster. BPSRTM using the cluster analysis ROI as reference region and BPPLASMA of the cluster analysis ROI were evaluated. A noiseless TAC with the same kinetic parameters as the high BP ROI was used as target ROI and the effects of noise level and number of clusters on BPSRTM values were evaluated.
Results
Clinical Evaluation
The clustering algorithm resulted in a rough separation between gray and white matter, blood vessels, and cerebrospinal fluid (Figure 1A and B). In total, 10 clusters were extracted and the TAC with the lowest BPPLASMA was used as reference region TAC. For four out of 39 subjects clustering did not result in physiologically meaningful clusters (Figure 1C). Results from these subjects were not included in the comparative analyses. No correlation was observed between unidentifiable clusters and injected dose. The distribution of voxels over the 10 clusters decreased from 27 ± 4% of voxels in the largest cluster to 20 ± 4% in the second largest and 1 ± 0.3% in the smallest cluster. The cluster containing the largest number of voxels (partially) represented skull in more than 80% of the cases. For several subjects fitting a plasma input model to the cluster TAC provided poor results (very high BP or high COV associated with fitted BP). The BPPLASMA values were excluded from analysis when COV was larger than 60% or when BPPLASMA itself was >5. One subject was rejected because of inconsistent BPPLASMA results between ROI, which was not observed for the other subjects. Rejection of fits was assessed independently for different kinetic models, that is subjects that gave unrealistic results for one model were included when analyzing other models. The number of excluded scans is reported in Table 1. It can be seen that a substantial number of fits were rejected, with the highest number for BPSRTM (and consequently also BPSRTM_CORR) using cerebrum white matter as reference region input. This high rejection rate indicates that this white matter region is not a suitable reference tissue input for the gray matter thalamus region. For most reference regions, the rejection rate of BPSRTM fits was < 10%. The rejection rate of BPSRTM_CORR was higher, as this analysis also required an acceptable plasma input fit of the reference region itself. Often the same fit is rejected for several reference regions. Rejection of a fit for several reference regions results in only one scan excluded in the total comparison, because it is the same subject for which several TACs result in rejected fits.
Number of rejected fits. Number of rejected subjects for a specific ROI and model can be higher than the total number of rejected subjects as not all ROI were included in all comparisons
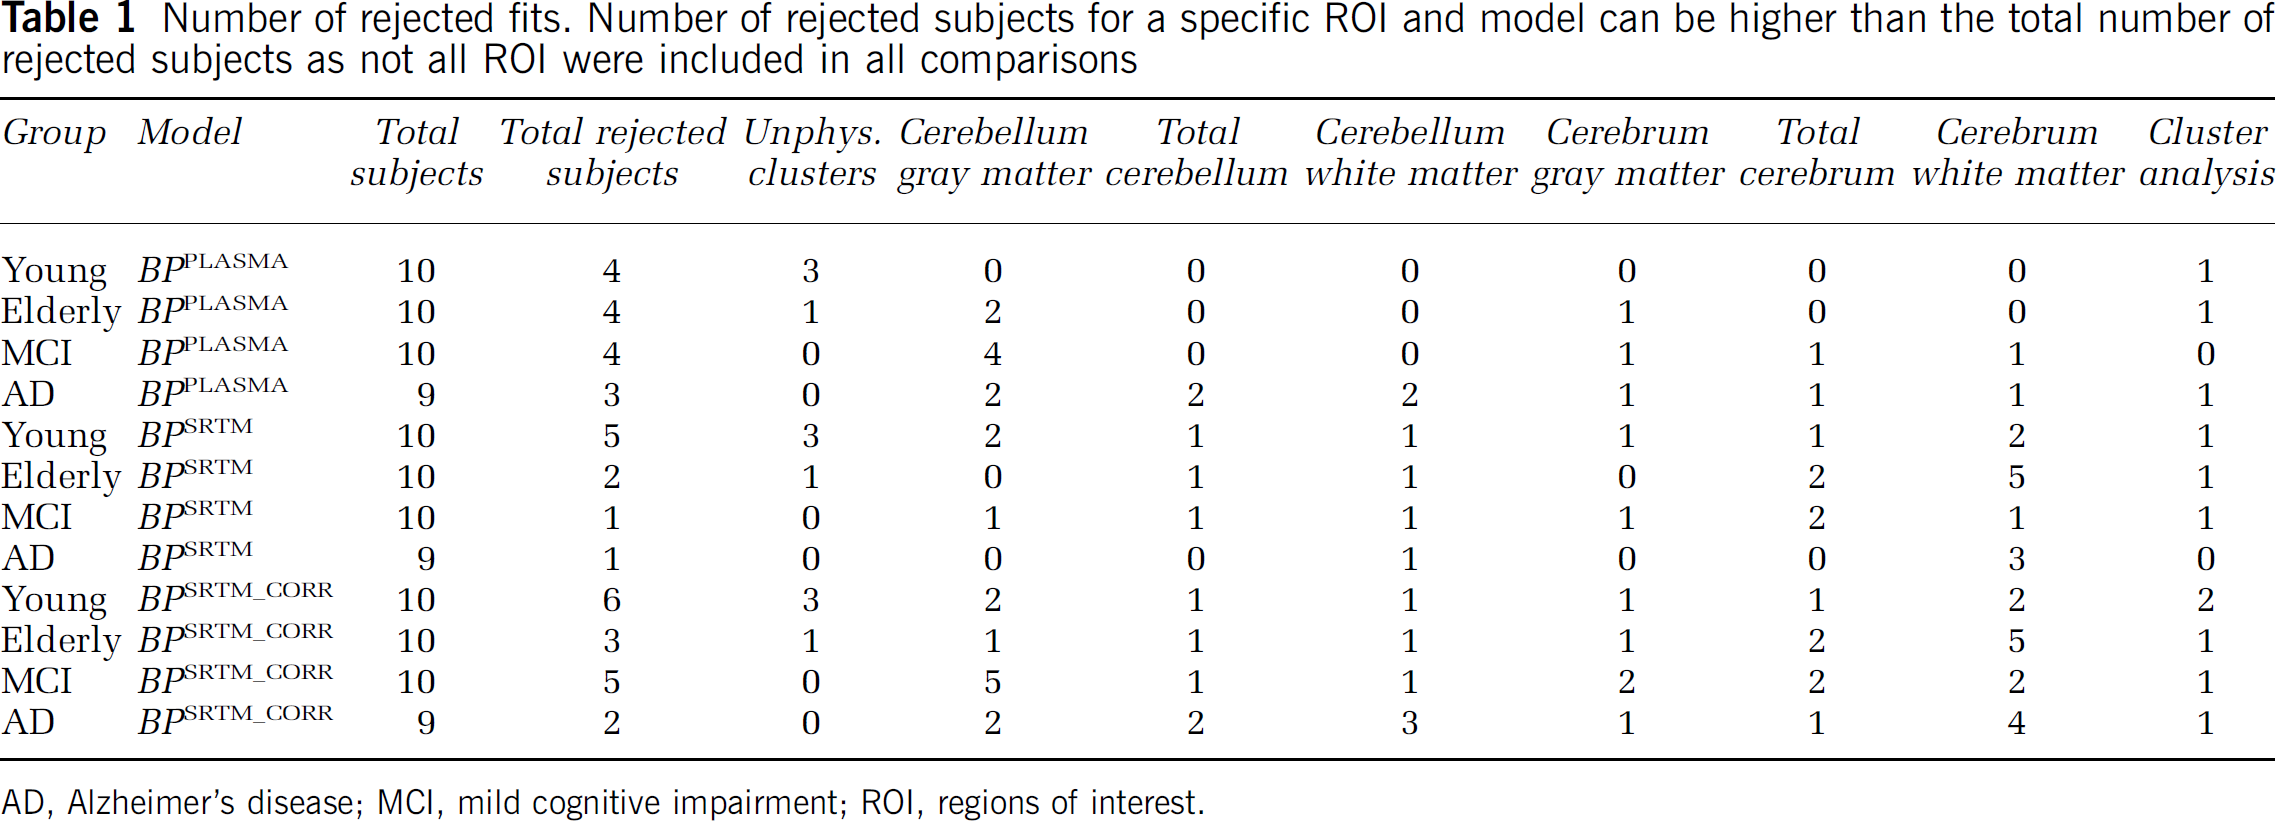
AD, Alzheimer's disease; MCI, mild cognitive impairment; ROI, regions of interest.
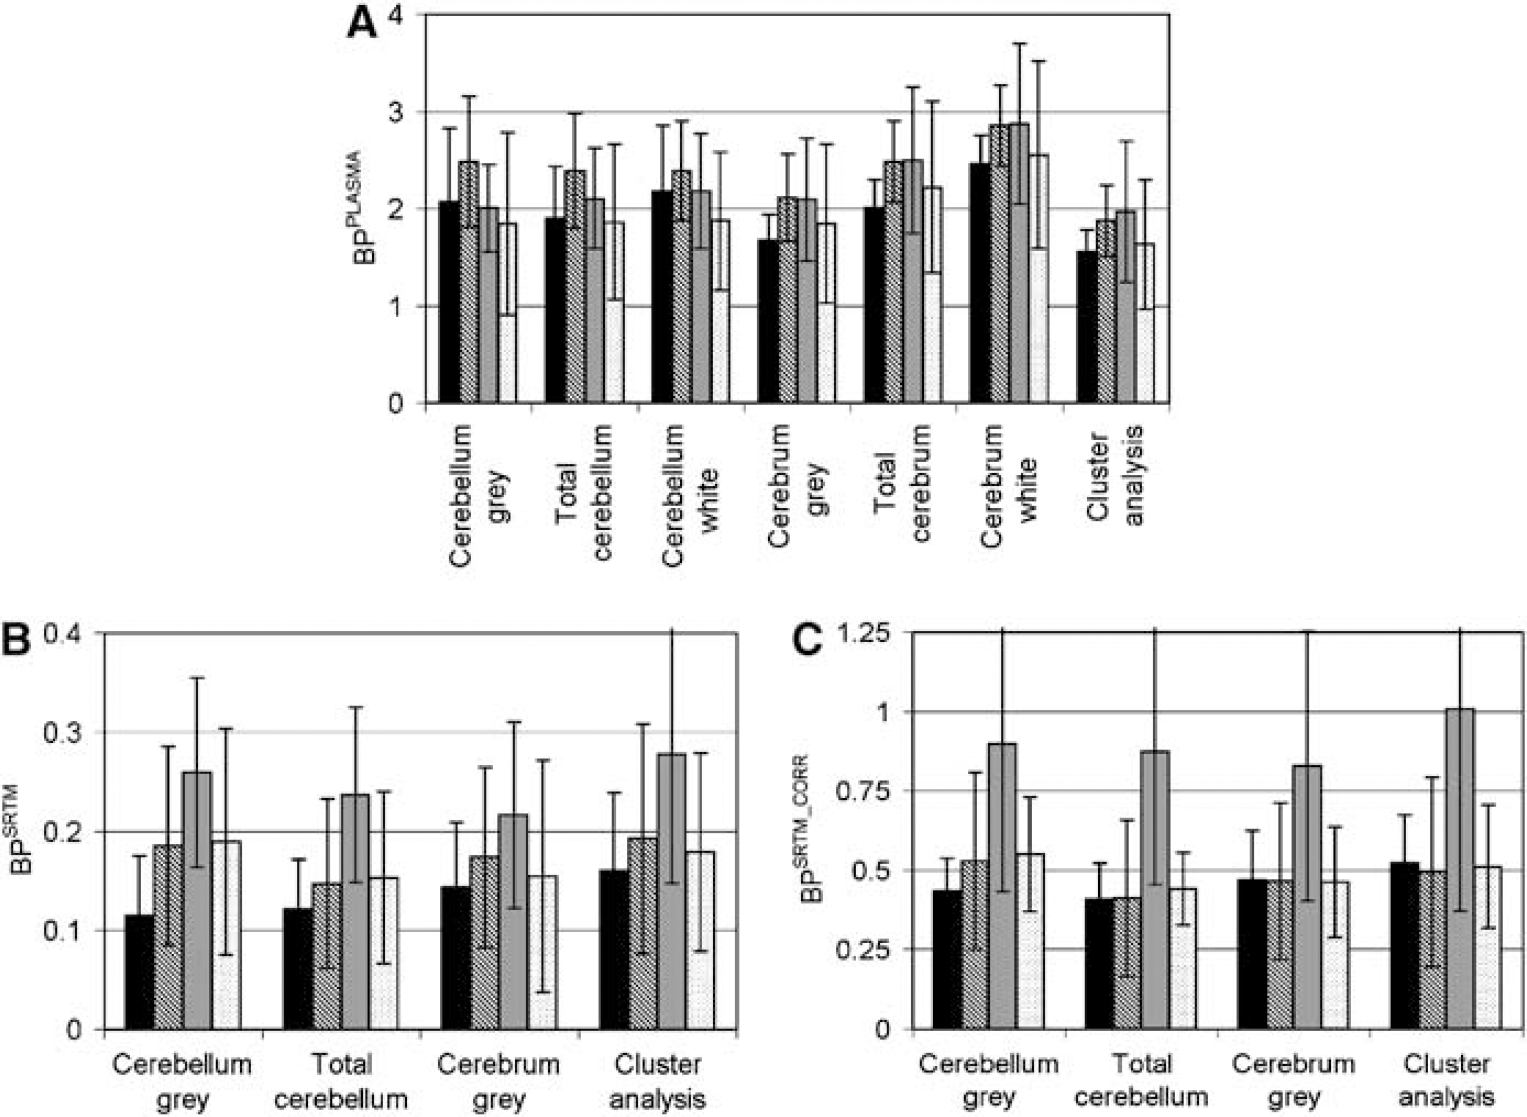
Reasonable correlations were observed between total binding of anatomic and cluster ROI obtained using a plasma input model (BPPLASMA). Scatter plots between total cerebellum and cluster analysis BPPLASMA and between cerebrum gray matter and cluster analysis BPPLASMA are shown in Figures 2A and B. Correlations were highest between BPPLASMA from cerebrum and cluster analysis (R2 = 0.93, 0.92, and 0.94 for cerebrum gray matter, white matter, and total cerebrum, respectively) and considerably lower between cerebellum and cluster analysis (R2 = 0.52, 0.68, and 0.69, respectively). Measured BPPLASMA values for the different subject groups are shown in Figure 3A. No statistical significant differences were observed between groups.
The BPSRTM values were rejected if COV of the fitted BP was larger than 70% or when BP itself was either larger than 1 or smaller than O. A high number of unrealistic BPSRTM results were observed when cerebellum white matter, total cerebrum, or cerebrum white matter was used as reference region (6, 6, and 13, respectively; Table 1). This suggests that these ROI are not suitable as reference regions. To increase statistical power, these ROI were excluded from BPSRTM analysis. Correlations were observed between target BPSRTM calculated using the various ROI as reference region. Correlation was calculated between target BPSRTM values using total cerebellum and cluster analysis as reference region (Figure 2C, R2 = 0.76). Lower correlations were observed between the use of cluster analysis reference region and cerebrum gray matter (Figure 2D, R2 = 0.71) and between the use of cluster analysis reference region and cerebellum gray matter (R2 = 0.59). Measured BPSRTM values for the different subject groups are shown in Figure 3B. No statistically significant differences were observed between groups. Little variation was observed in the COV between ROI or between subject groups.
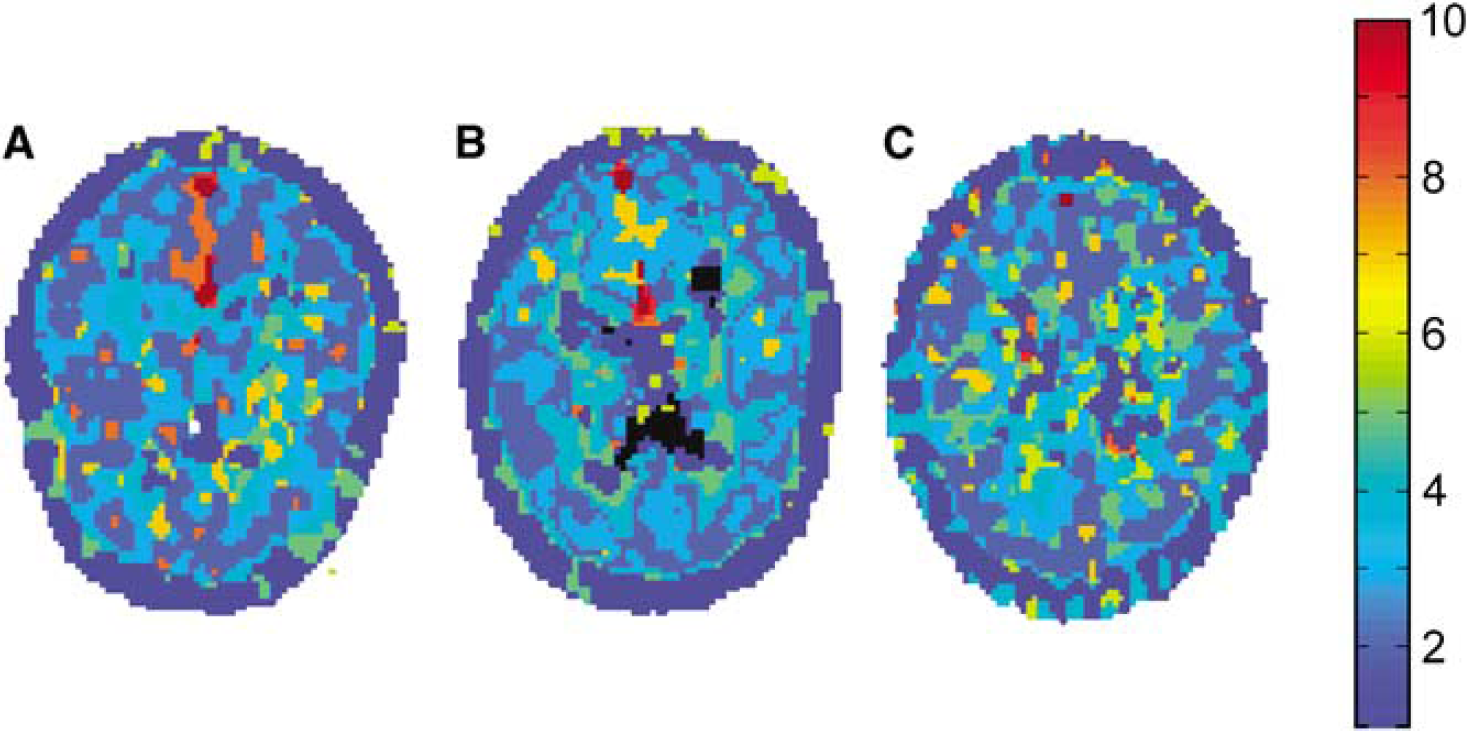
Cluster images of (
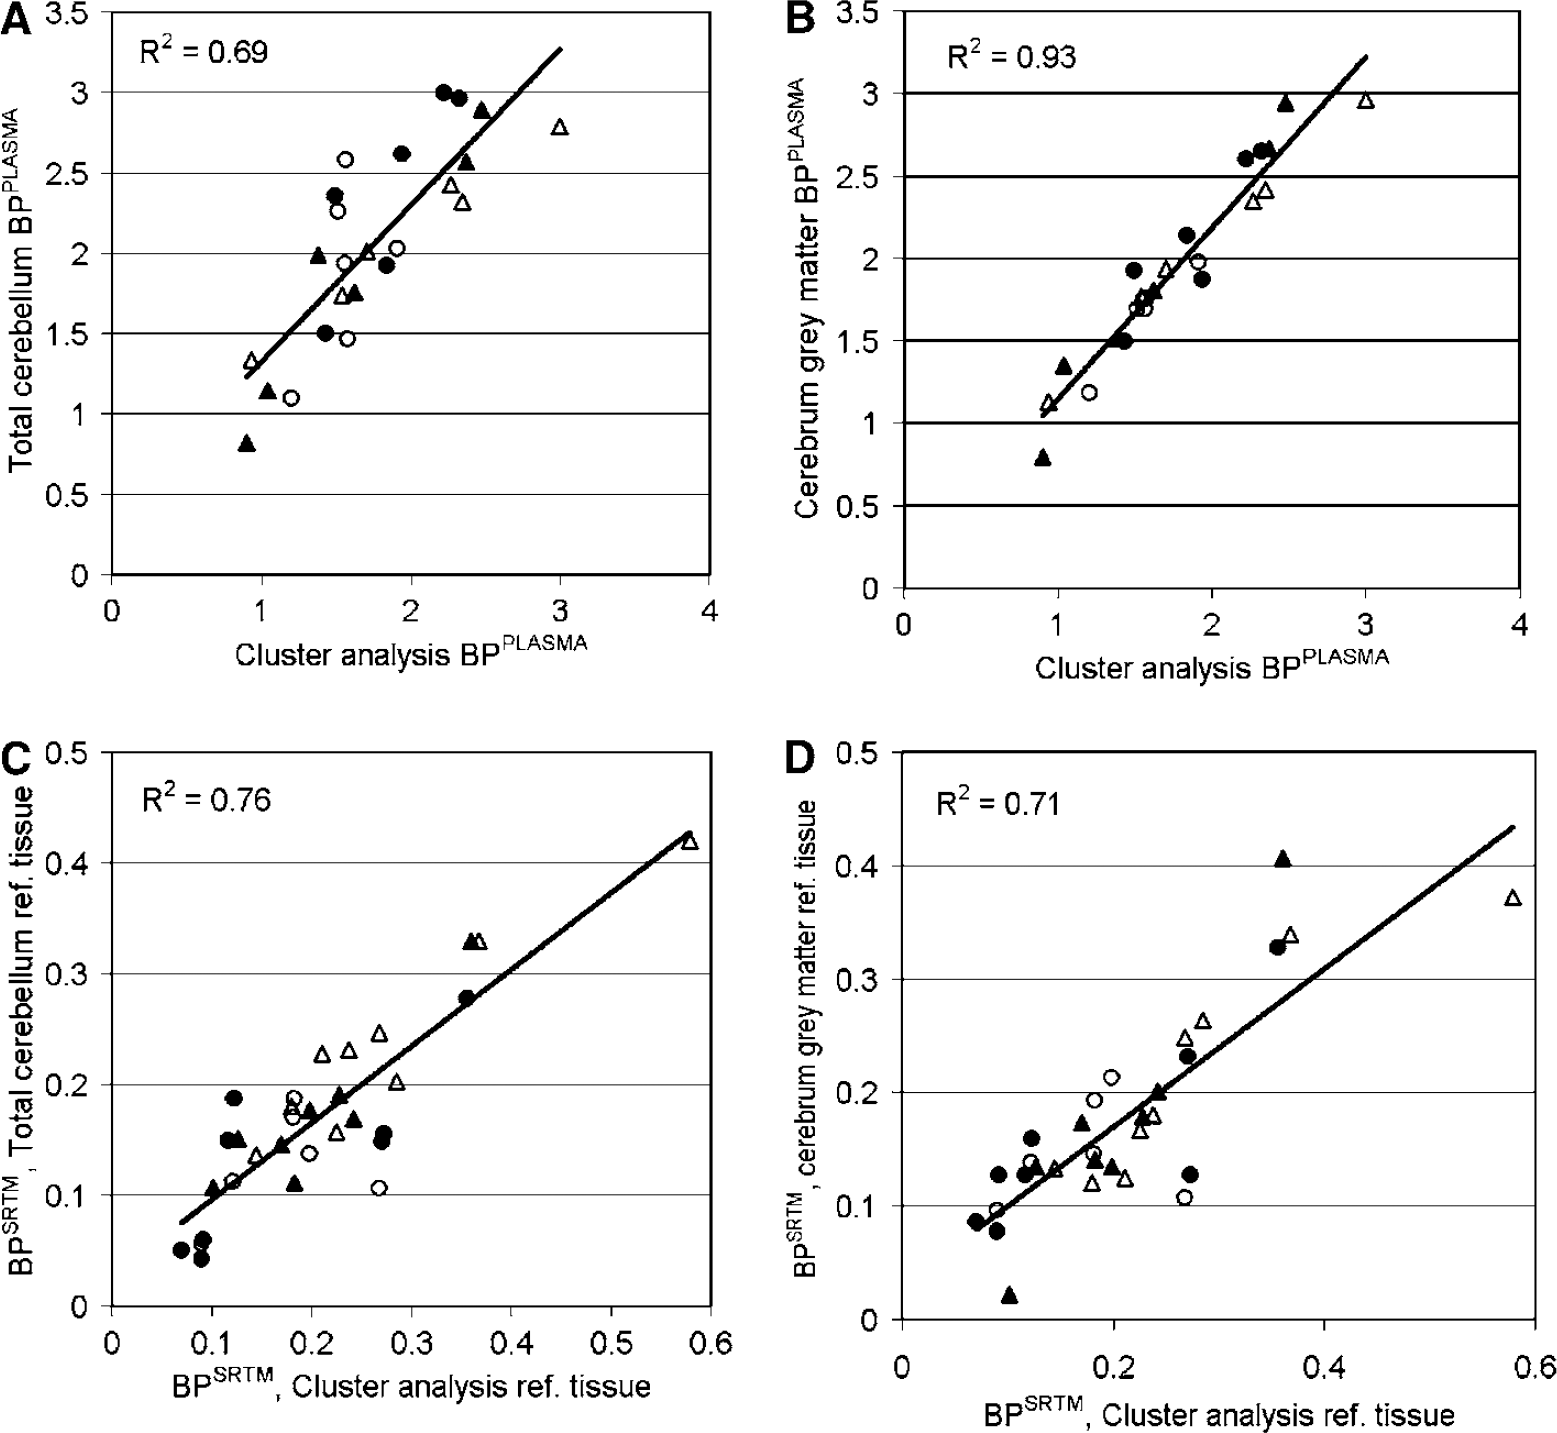
Scatter plots of BPPLASMA (
High correlations were observed between BPSRTM-CORR values (i.e. BPSRTM corrected for nonspecific binding) of the target region measured using the various reference region methods. Correlation coefficients between the use of cluster analysis as reference region and the use of either cerebellum gray matter, total cerebellum, or cerebrum gray matter were R2 = 0.86, 0.86, and 0.83, respectively. Measured BPSRTM-CORR values for the different subject groups are shown in Figure 3C. No statistically significant differences were observed between groups.
(
To investigate possible effects of intravascular activity on extracted cluster TAC, the correlation between cluster analysis BPPLASMA and Vb was investigated. In contrast to other results, all extracted clusters, except those representing tissue or cerebral spinal fluid, were included in this analysis. A scatter plot of cluster analysis BPPLASMA versus Vb is shown in Figure 4. A large number of clusters (201 out of 390) were excluded because they resulted in unrealistic or unreliable BP or Vb values (BPPLASMA > 15 or its COV > 70%; Vb < 0, Vb > 0.12 or its COV > 70%).
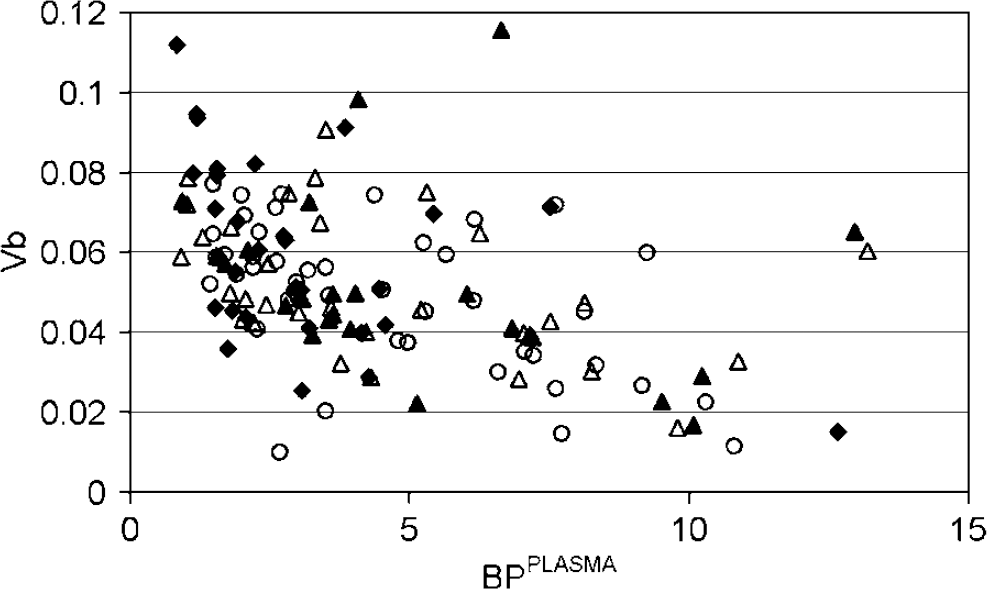
Scatter plot of cluster analysis BPPLASMA and Vb. Results are shown for all extracted clusters and for eight young (○), nine elderly (•), 10 MCI (▵), and eight AD subjects (▴).
Cluster TAC with low BPPLASMA tended to have high Vb and cluster TAC with high BPPLASMA tended to have low Vb.
Simulations
Cluster analysis resulted in separation of areas with different BP and Vb (Figure 5A–F). The algorithm was more sensitive to BP than to Vb changes (Figure 5A). When the number of clusters used was higher than the number of areas with different kinetics, the simulated area with the lowest BP was separated into more than one cluster (Figure 5C and F). Similar ROI were extracted independent of noise level.
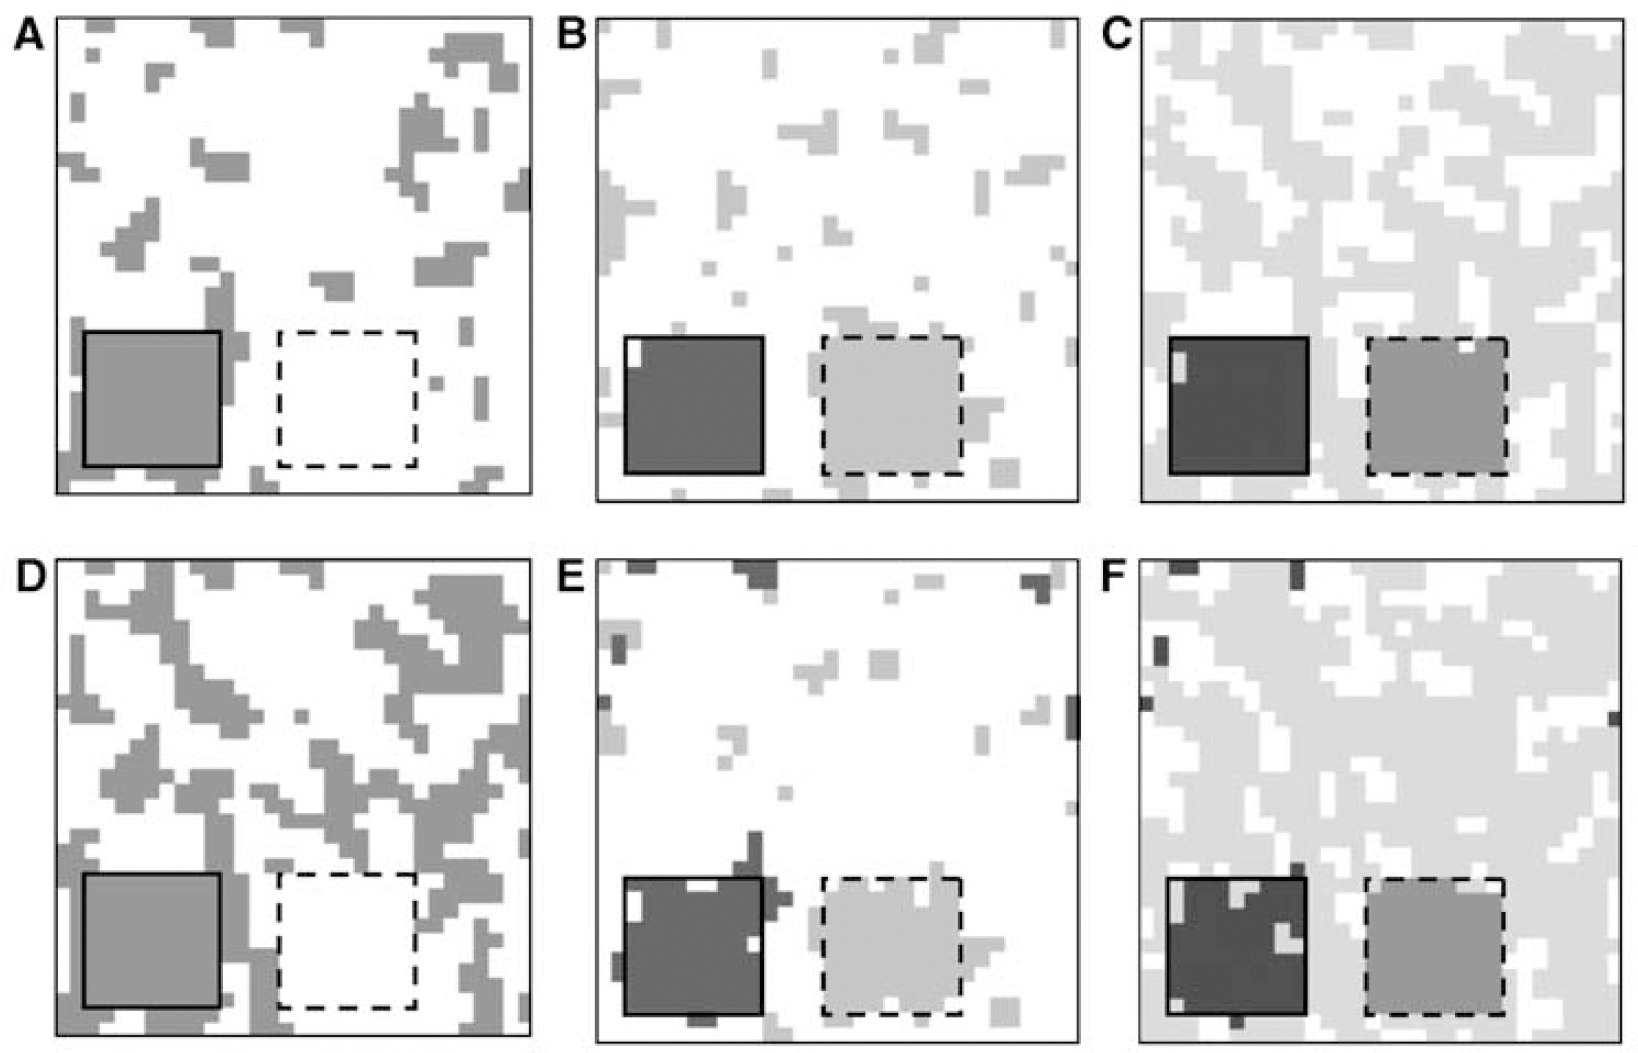
Images of various clustered simulated volumes containing a region with increased BP (2.2, left inserted square) and a region with increased Vb (0.09, right inserted square) in a homogeneous background (BP = 1.5; Vb = 0.06). Images are shown for data with 10 (
Extraction of the volume into two clusters resulted in the background cluster (i.e., the volume without the high BP and Vb region) corresponding to the cluster ROI with the lowest BPPLASMA.
When the volume was clustered into three clusters, the reference region cluster corresponded to the simulated ROI containing the high Vb voxels. When the volume was extracted into four clusters, the smallest cluster in the background, which did not contain the high BP or high Vb voxels, was the cluster with lowest BPPLASMA.
Because of nonspecific binding (BPPLASMA ∼ 1.5), all BPSRTM values were scaled down by a factor of approximately 2.5. Considerable variation was observed in BPSRTM depending on the number of extracted clusters (Figure 6A). BPSRTM appeared to be nearly independent of noise level when the number of extracted clusters was correct or too low, but variation up to 40% was observed when the number of extracted clusters was higher than the number of different structures in the scan. BPSRTM was approximately 40% lower when three clusters were extracted instead of two. The BPPLASMA results showed a more consistent trend, with increasing negative bias as the number of extracted clusters and the noise level increased (Figure 6B).
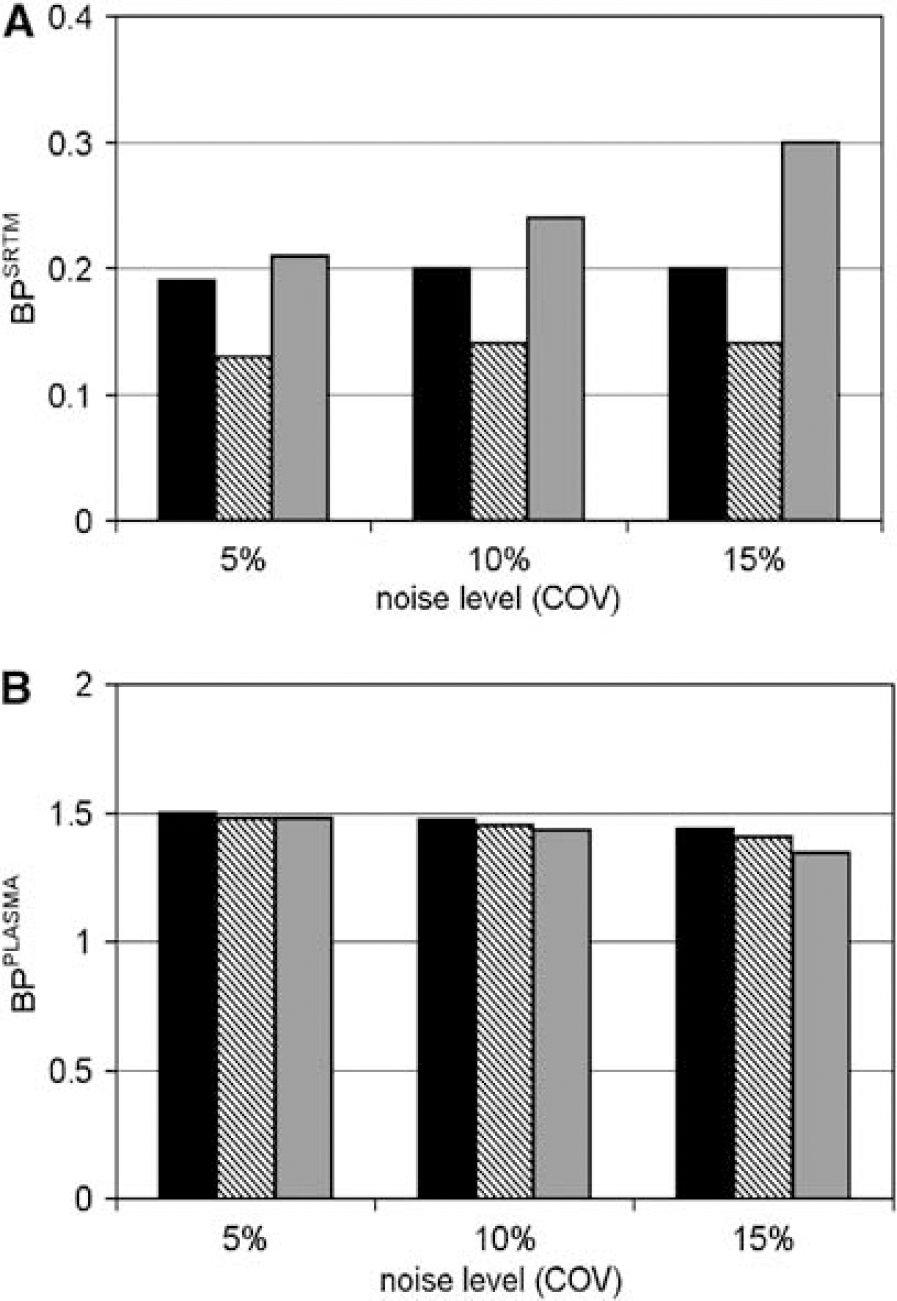
Results from simulations showing target ROI BPSRTM using the cluster analysis ROI as reference region (
Discussion
The most important finding of this study is that BPSRTM and BPSRTM_CORR obtained with anatomic reference regions are linearly related to BPSRTM (R2 = 0.59 to 0.76) and BPSRTM_CORR (R2 = 0.83 to 0.86) obtained with the reference region defined by cluster analysis in controls and patients with MCI and AD (Figure 2). On the basis of these relationships, the validity of using anatomic ROI and cluster analysis as reference region is similar, although performance differences exist which are reflected in different correlation coefficients for observed BPPLASMA and BPSRTM values (Figures 2 and 3). These results confirm those of Cagnin et al, (2001b), who found high BPSRTM correlations (R2 = 0.94 to 0.96) when using either total cerebellum or cluster analysis as reference region in a healthy subject and a subject suffering from herpes encephalitis.
Correlation coefficients observed between cluster analysis and cerebrum ROI BPPLASMA were high (R2 = 0.92 to 0.94) compared with those obtained between cluster analysis and cerebellum ROI BPPLASMA (R2 = 0.52 to 0.68). Because all evaluated ROI were relatively large, differences in noise level are not responsible for this observed difference. Because the cluster analysis ROI will have more voxels in common with cerebrum ROI than with cerebellum ROI, their TAC shapes will be more similar and therefore the higher correlation with cerebrum BPPLASMA is logical. This increased correlation, however, does not imply increased accuracy or precision.
Differences in COV of BPPLASMA, BPSRTM, and BPSRTM_CORR for the various reference regions were small. Because noise levels in TAC of all reference regions evaluated were also low, no distinction between ROI could be made in terms of precision. Better precision of BPSRTM was observed by Turkheimer et al (2007), who showed that use of anatomically defined reference regions resulted in better test-retest variabilities of BPSRTM in target areas than those based on cluster analysis, even when using a cluster analysis with improved precision at the cost of decreased accuracy.
Observed BPSRTM results using simulated clusters as reference region resulted in lower BPSRTM values for three clusters than for either two or four clusters. For three clusters, the extracted reference region cluster represented voxels with high Vb, which resulted in a negative bias in BPSRTM values (simulations, data not shown). Selection of voxels on the basis of Vb differences may occur, which can lead to a cluster analysis reference region with biased BP, also because a correlation was observed between Vb and BP (Figure 4).
The cluster analysis resulted in rejection of 10% of the scans evaluated. Banati and coworkers (Banati et al, 2000; Cagnin et al, 2001a) used comparison of extracted cluster TAC with a database of normal cluster TAC and rejected TAC according to dissimilarity. It is not clear whether this criterion would have selected the same scans for rejection. Unfortunately, Banati and coworkers did not mention the number of rejected scans. Furthermore, the distribution of voxels over the various clusters in the present study was significantly different from that previously reported. Banati and coworkers (Banati et al, 2000) found that the two largest clusters contained 90% of the voxels. In the present study, the cluster volume decreased from 27 ± 4% of the voxels toward 1 ± 0.3% of the voxels, with the largest cluster representing skull in most of the cases. These differences may be related to differences in scanner characteristics, reconstruction algorithm, scatter correction, or differences in shielding for out of field of view scatter.
From a physiologic point of view, the cerebellum is affected in a more advanced stage of AD than the cerebrum and should therefore be preferred (Braak and Braak, 1991). In general (R)-[11C]PK11195 binding is assumed to be absent in normal brain (Banati et al, 2000), except in the thalamus of healthy elderly controls (Cagnin et al, 2001a). In addition, it is assumed that increased BP reflects activation of microglia. Clearly, any dissociation between total (R)-[11C]PK11195 uptake and binding to activated microglia between regions and/or subject groups would complicate physiologic interpretation of BP results. This is, however, unlikely a histologic study (Banati et al, 2000) has shown that (R)-[11C]PK11195 binds to activated microglia and not to other cells. Finally, it is assumed that labelled metabolites do not cross the blood-brain barrier. At least for mice this has been confirmed (Dumont et al, 1999).
In summary, apart from the high number of unrealistic BPSRTM results using the cerebellum white matter, total cerebellum, or cerebrum white matter as reference region, only small differences in reference region performance were observed. Total cerebellum, however, is the best choice, as it correlates well with other reference region BP, results in low numbers of unrealistic BPSRTM values, and is likely to have specific binding only in a late state of the disease process. In addition, in contrast to cluster analysis, it does not have noise-induced bias and rejection of 10% of the scans.
At present there is increasing interest in in vivo imaging of inflammatory processes. A number of alternative ligands for the peripheral benzodiazepine receptor are under investigation, such as DAA1106 (Maeda et al, 2004; Ikoma et al, 2007) and vinpocetine (Gulyas et al, 2002a, b and c , 2005). Although initial results are promising in that uptake of these ligands in brain is higher than that of (R)-[11C]PK11195, there is a need for full quantitative comparative studies. It is likely that results of the present study are also relevant for these new ligands, as they target the same receptor.
Conclusion
BP values of (R)-[11C]PK11195 scans in normal subjects and MCI and AD patients are similar when total cerebellum or cluster analysis are used as reference regions. Total cerebellum is the reference region of choice, because cluster analysis fails in approximately 10% of cases.
Footnotes
Acknowledgements
The authors thank personnel of the BV Cyclotron VU for the production of [11C]CO2 and staff of the Department of Nuclear Medicine & PET Research for the production of (R)-[11C]PK11195, data acquisition, and blood metabolite analysis. In addition, Dr P Pouwels (Department of Radiology, VU University Medical Centre, The Netherlands) is acknowledged for help with the MRI sequences, Dr FE Turkheimer (MRC Clinical Sciences Centre, Faculty of Medicine, Imperial College, Hammersmith Hospital, United Kingdom) for useful discussions and exchange of data, Dr R Gunn (previously MRC Clinical Sciences Centre, Faculty of Medicine, Imperial College, Hammersmith Hospital, UK, currently Translational Medicine and Genetics, GlaxoSmithKline, Greenford, UK) for providing the cluster analysis software, and FHP. van Velden, MSc, for critical reading of the manuscript. This work was made possible by research grants from the European Union (NCI-MCI project, number QLK6-CT-2000-00502), the Netherlands Organisation for Scientific Research (NOW VIDI grant 016.066.309), and from the Dutch Brain Foundation (number 9F01.21). This study was funded by the VU University Medical Centre.