
Abstract
The purpose of this study was to compare different kinetic and semi-quantitative methods for analysing human [18F]FP-β-CIT studies: plasma input models, simplified (SRTM) and full (FRTM) reference tissue models, standard uptake values (SUV) and SUV ratios (SUVr). Both simulations and clinical evaluations were performed to determine the effects of noise, scan duration and blood volume on Akaike model selection, and on precision and accuracy of estimated parameters. For typical noise levels (COV ∼ 2.5%) and scan durations (< 90 mins), simulations provided poor fits (Akaike criterion) in case of reversible plasma input models showing a relatively high number of outliers compared with the two-tissue irreversible model. Reference tissue models provided more reliable fits, which were nearly independent of noise and scan duration. For clinical data, two tissue irreversible and reversible plasma input models fitted striatum curves equally well (Akaike criterion). BP with plasma input models were less precise and contained more outliers than BP obtained with SRTM or FRTM. Among all methods tested, SRTM showed the highest contrast between patients and controls. When differentiating between patients and controls, SUVr performed almost equally well as SRTM, although contrast between striatum and background was lower. In conclusion, SRTM provided BP estimates with the highest precision and accuracy. Moreover, SRTM provided good contrast between patients and controls, and between striatum and background. SRTM is therefore the method of choice for quantitative [18F]FP-β-CIT studies. SUVr might be an alternative for larger clinical trials.
Introduction
The dopamine reuptake transporter (DAT) is frequently used to assess the integrity of dopamine neurons. Indeed, reduced uptake of DAT ligands has consistently been demonstrated in the striatum of patients with Parkinson's disease (PD), where degeneration of dopamine neurons is known to occur (Tissingh et al, 1998; Ichise et al, 1999; Kim et al, 1999; Benamer et al, 2000; Ma et al, 2002). DAT abnormalities might also be present in other disorders, such as obsessive-compulsive disorder (Hesse et al, 2005), attention deficit disorder (Volkow et al, 2005) and schizophrenia (Hsiao et al, 2003).
The most common DAT ligand is β-CIT, a cocaine analogue, which has been labelled with radionuclides for both PET (124I; Coenen et al, 1995) and SPECT, (123I; Neumeyer et al, 1991; Laruelle et al, 1994; Coenen et al, 1995; Marshall and Grosset, 2003). Especially SPECT tracers often have been used for clinical purposes. In these studies, quantification of specific binding has been performed with both kinetic and equilibrium methods and close agreement between the results was found (Laruelle et al, 1994; Coenen et al, 1995). However, kinetics of this tracer, are extremely slow, taking up to ∼ 24 h to reach maximum uptake in the striatum, thus making an equilibrium analysis problematic (scan needs to take place 1 day after injection; Coenen et al, 1995).
Therefore, other analogues of β-CIT have been developed as DAT tracers, for example FP-β-CIT and FE-β-CIT (Halldin et al, 1996), with much faster kinetics in striatum (Abi-Dargham et al, 1996). For both these tracers only a limited number of studies have been performed. In case of FP-β-CIT studies, results have been reported for in vitro autoradiography examinations, plasma metabolites and clinical PET scans (Neumeyer et al, 1996; Lundkvist et al, 1995, 1997; Ma et al, 2002). Results indicated high specific and reversible binding in striatum in contrast with low non-displaceable uptake in cerebellum.
To date, FP-β-CIT studies with PET have only been analysed using simple radioactivity ratios at a fixed time interval after bolus injection (Lundkvist et al, 1995, 1997; Ma et al, 2002), or using plasma and reference tissue input Logan based linearized methods (Kazumata et al, 1998; Logan et al, 1990, 1996). Although more comprehensive tracer kinetic models are available (Gunn et al, 2001), they have not been evaluated for quantification of FP-β-CIT data. Clearly, this type of evaluation is particularly important when accurate quantification of DAT is essential, for example when monitoring disease progression or when evaluating the effects of (neuro-protective) treatment strategies.
The purpose of the present study was to identify which tracer kinetic model should be used for quantitative analysis of [18F]FP-β-CIT studies. To this end both simulated and clinical [18F]FP-β-CIT data were used. The data were analysed using various compartmental models based on plasma (Gunn et al, 2001) or reference tissue (Hume et al, 1992; Lammertsma et al, 1996a; Lammertsma and Hume, 1996b) input data. In addition, for comparison, standard uptake values (SUV) and regional SUV to cerebellum SUV ratios (SUVr) at set times were investigated because of their frequent use in clinical diagnostic studies.
Methods
Scanning Protocol
Clinical data were derived from ongoing patient studies, approved by the medical ethics committee of the VU University Medical Centre, and consisted of 12 subjects (five healthy male controls, one healthy female control, two female and four male PD patients, Hoehn & Yahr 2 to 3) with age ranging from 55 to 71 years (PD = 64 ± 7.6 and healthy controls 65 ± 3.7). Each subject gave written informed consent before inclusion in the study protocol. Clinical results are beyond the scope of the present study and will be reported elsewhere.
As part of the study protocol, each subject first underwent a T1-weighted MRI scan using a 1T IMPACT scanner (Siemens Medical Solutions, Erlangen, Germany). This scan was performed to exclude anatomical abnormalities and for co-registration and segmentation purposes.
PET studies were performed using an ECAT EXACT HR + scanner (CTI/Siemens, Knoxville, USA). The characteristics of this scanner have been described previously (Adam et al, 1997; Brix et al, 1997). First, a 10 mins transmission scan in 2D acquisition mode was performed, which was used to correct the subsequent emission scan for tissue attenuation. Next, a dynamic emission scan in 3D acquisition mode was performed following bolus injection of 185 MBq [18F]FP-β-CIT (Klok et al, 2006). The dynamic emission scans consisted of 23 frames (1 × 15, 3 × 5, 3 × 10, 2 × 30, 3 × 60, 2 × 150, 2 × 300, 7 × 600 secs) with a total scan duration of 90 mins. These frames were reconstructed using FORE + 2D filtered back projection (Defrise et al, 1997) and a Hanning filter with a cutoff of 0.5 times the Nyquist frequency. Reconstructions included all usual corrections, such as normalization, decay, dead time, attenuation, randoms and scatter (Watson, 2000) corrections.
The protocol also included continuous arterial sampling, starting 2 mins before injection and continuing throughout the entire emission scan, using a dedicated online detection system (Boellaard et al, 2001). In addition, at set times (5, 10, 20, 40, 60, 75 and 90 mins post–injection), arterial sampling was interrupted briefly for the withdrawal of discrete arterial samples. After each sample, this arterial line was flushed with heparinised saline in order to avoid clotting of blood within the line. An arterial whole blood curve was obtained by correcting the on-line sampler curve for decay, removing the flushing periods, and finally calibrating against the discrete blood sample data, measured in a cross-calibrated well counter (Greuter et al, 2004). Finally, a metabolite corrected plasma curve was derived from the whole blood curve using the plasma to whole blood ratios and metabolite fractions obtained from the manual blood samples. Arterial blood sampling failed in four subjects because of technical problems. Data from these subjects were only used for investigating the reference tissue models.
Image Analysis
The de-sculled T1-weighted MRI scans (Smith, 2002) were co-registered (Maes et al, 1997; West et al, 1997) with a summed PET image (frames 3 to 12: 25 secs to 5 mins postinjection, thereby resembling a flow image, which is useful for maximizing cortical information). Time radioactivity curves (TACs) were then generated, by using MR-based automatic delineation of regions of interest (ROI, Svarer et al, 2005). For the purpose of the present study only grey matter TACs for cerebellum, cortical grey matter, caudate, putamen and striatum regions were analysed.
Kinetic Analysis
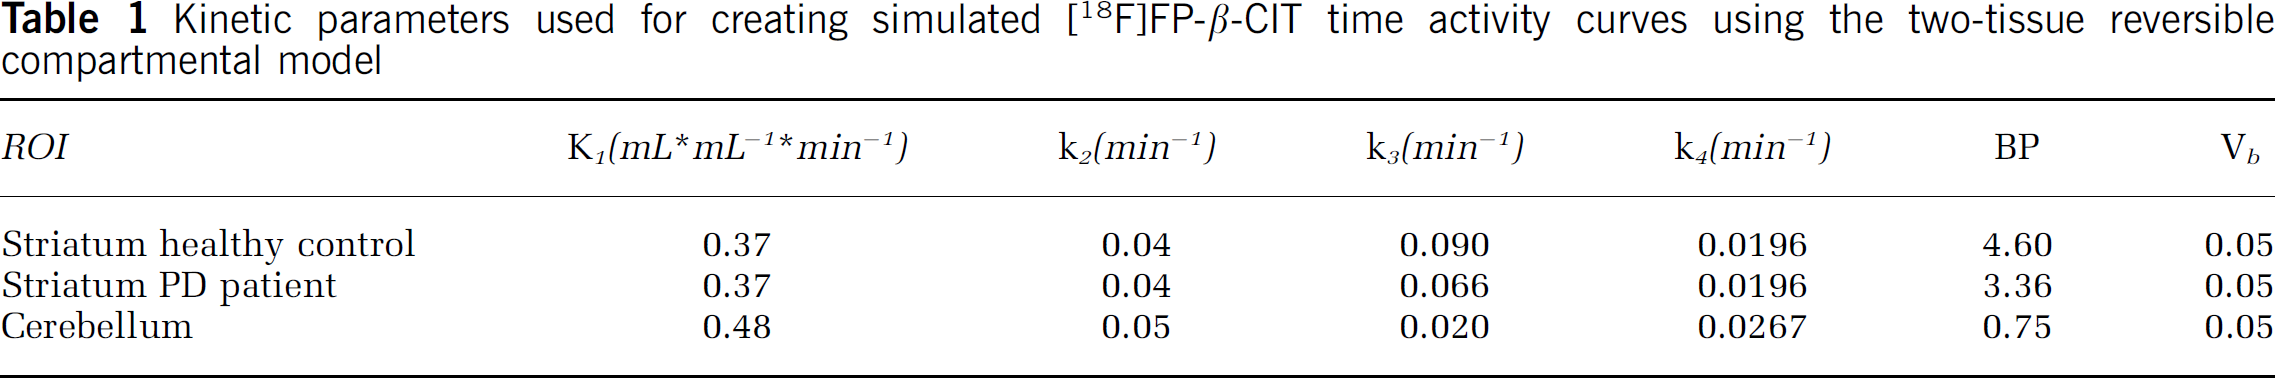
Simulations: Simulated [18F]FP-β-CIT data were used to assess accuracy and precision of various compartmental models in a controlled fashion. Simulated TACs were generated for cerebellum and striatum using a typical [18F]FP-β-CIT input function and reversible two-tissue compartmental model parameters based on healthy control and PD patient data (Table 1). Additionally, three entities were varied during simulation and hundred TACs were generated at each different parameter combination: fractional blood volume (Vb = 0, 0.02, 0.04, 0.06 and 0.08), TAC noise levels (coefficient of variation COV = 0%, 2.5% and 5%) and scan duration (60, 90 and 120 mins). Simulated noise was based on total scanner true counts, frame lengths and decay correction factors (Yaqub et al, 2006).
Kinetic parameters used for creating simulated [18F]FP-β-CIT time activity curves using the two-tissue reversible compartmental model
Data were analysed using five different compartmental models: single-tissue plasma input (1T-2k), two-tissue reversible plasma input (2T-4k), two-tissue irreversible plasma input (2T-3k), simplified reference tissue (SRTM; Lammertsma and Hume, 1996b) and full reference tissue model (FRTM; Hume et al, 1992; Lammertsma et al, 1996a). Plasma input models contained one further fit parameter for blood volume. For reference tissue models (SRTM and FRTM) the cerebellum was used as reference tissue. For all models the kinetic parameters were constrained to positive values and multiple initial parameter estimates were used during the non-linear least squares fitting procedure (Yaqub et al, 2006).
Simulation data were evaluated in two ways: (1) by determining the preferred model according to the Akaike criterion (Akaike, 1969) and (2) by comparing bias and COV of estimated binding potential (BP) for the various models after removing physiologically extreme outliers. For the Akaike comparison, plasma input and reference tissue models were evaluated separately. BP was calculated both directly (BP2T-4k, BPSRTM and BPFRTM model), and indirectly using volume of distribution ratios (BP1T-2ki and BP2T-4ki, Lammertsma et al, 1996a):
BPSRTM = BP obtained using SRTM,
BPFRTM = BP obtained using FRTM.
Theoretically, the fitted BP is dependent on the model used: for plasma input models the directly fitted BP (BP2T–4k) = BPns + BPsp; and for reference models (including the indirect plasma input methods using Vd) the fitted BP = BPsp/(1 + BPns). In these formulas BP is the fitted binding potential for the target region, BPsp corresponds to specific binding and BPns corresponds to slow kinetic non-specific binding. Note that non-specific binding with fast kinetics (high rate constants) cannot be assessed with PET and are ‘seen’ as part of the compartment representing free tracer in tissue.
Clinical data: Clinical [18F]FP-β-CIT data were evaluated using a number of techniques. First, Akaike values were calculated for all models and compared. Second, where possible, BP values were estimated and compared. These two comparisons were based on the following models:
SRTM, providing BPSRTM,
FRTM, providing BPFRTM,
1T-2k, providing BP1T-2ki indirectly from Vd's as described above,
2T-3k; this irreversible model does not provide a direct parameter of interest that can be compared with the other models and was only used for Akaike assessment,
2T-4k, providing both BP2T-4k and BP2T-4ki as described above.
In addition, specific binding potential (BPsp) was assessed using BP obtained from a two-tissue reversible model fit to the cerebellum (
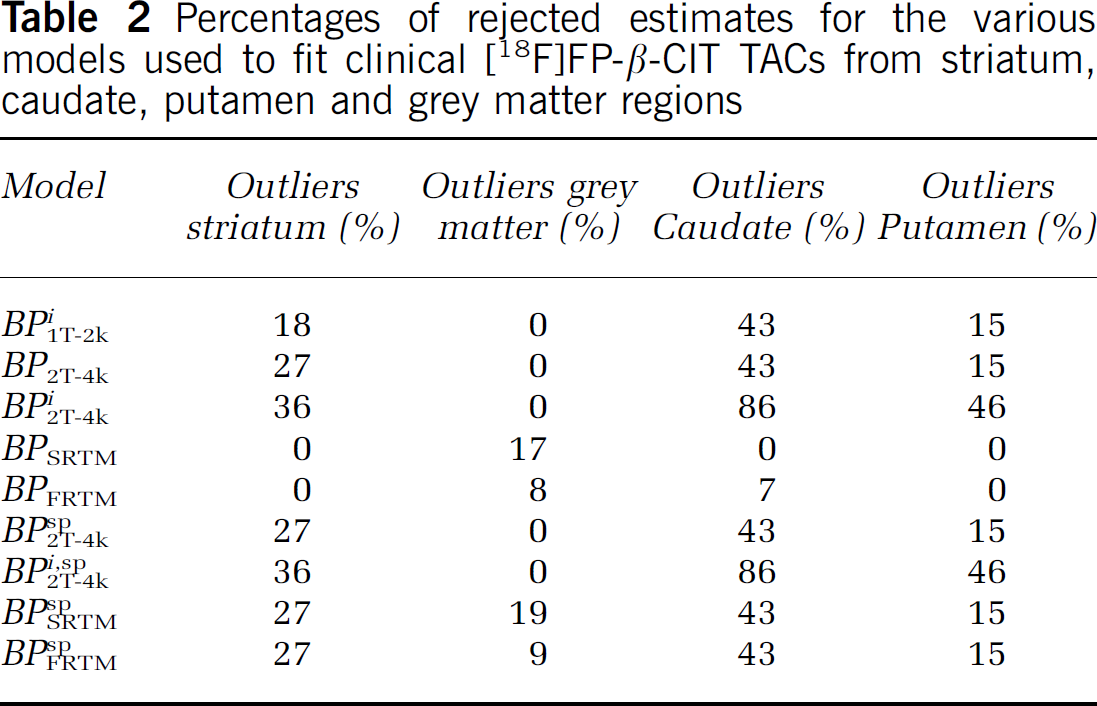
Comparison of BP values was performed after discarding all spurious data. First, scans with incomplete plasma and metabolite data were not used to evaluate plasma input models (two scans). Second, in an attempt to avoid the use of data compromised by patient motion, TACs with abnormal shapes because of (partial) movement were removed before kinetic analysis. Finally, physiologically incorrect BP estimates, obtained from kinetic analyses for each applied model, were discarded. The physiological boundaries were derived by visually inspecting histograms of the BP distribution and the boundary was set to exclude fits that fell outside the range of normally distributed values. The maximum BP values were set to 16 and 14 for the direct BP (2T-4k) and the reference tissue models, respectively (indirect, SRTM and FRTM). The number of physiologically incorrect BP estimates were used to estimate the capability of a model to overcome fit inaccuracies because of noise and short scan durations (see Table 2).
Percentages of rejected estimates for the various models used to fit clinical [18F]FP-β-CIT TACs from striatum, caudate, putamen and grey matter regions
In addition to BP values also standard uptake value (SUV) ratios (SUVr, striatum to cerebellum SUV ratio over 40 to 60, 60 to 90 and 80 to 90 mins) were investigated as they have been used routinely in clinical studies. These SUV ratios were compared with BPSRTM. Finally, average BP, SUV and SUVr for patients and controls were calculated to assess discriminative power of the various methods.
Results
Time Activity Curves
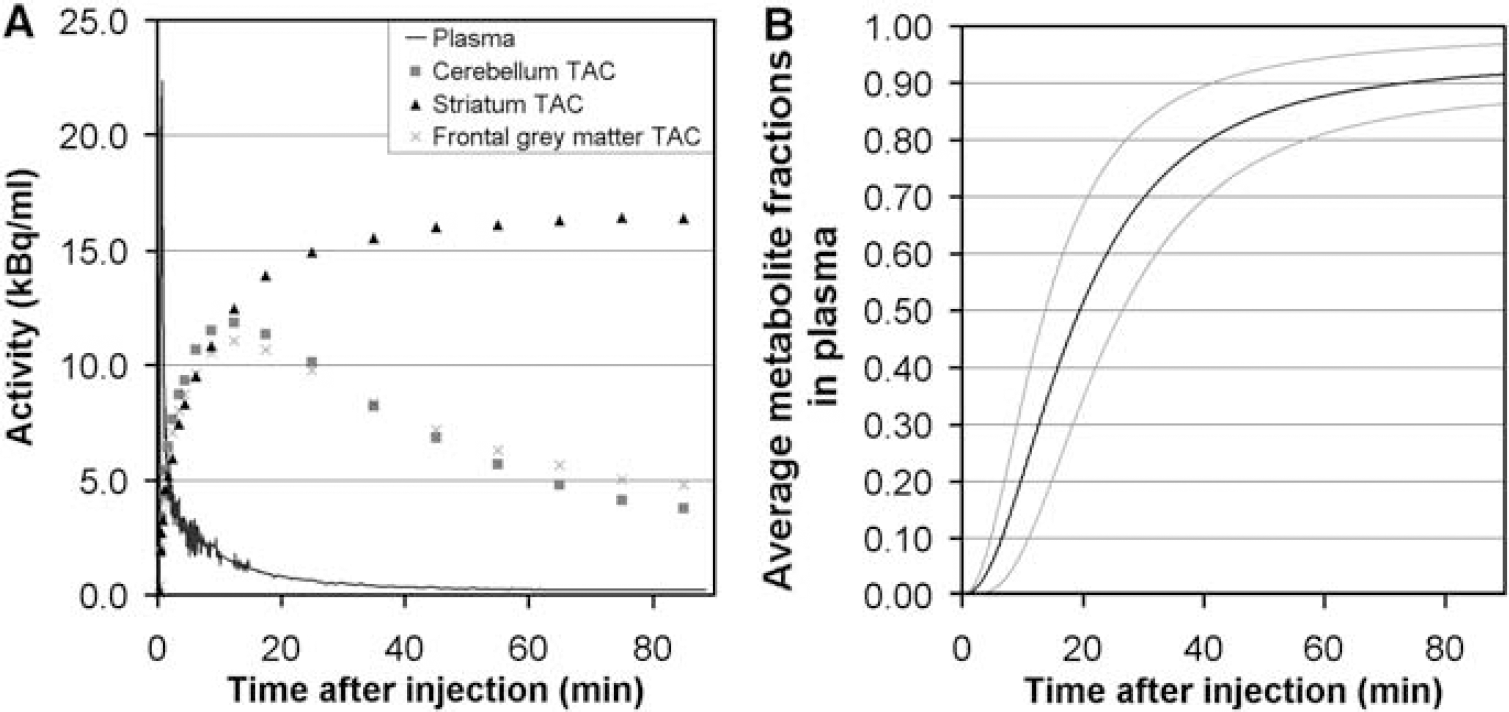
Typical TACs of [18F]FP-β-CIT in striatum, cerebellum and a grey matter (positioned in the frontal cortex) ROI are shown in Figure 1A, together with the metabolite-corrected plasma curve. The fractions of [18F]-labelled metabolites in plasma as function of time for 8 subjects are shown in Figure 1B.
(
Simulations
In general, low numbers of outliers (2% to 4%) in the outcome parameters were found for all simulations. In addition, both Akaike criterion and kinetic analyses indicated similar model preferences for both healthy control and PD patient data. Therefore, here, only results for simulated healthy control data are presented.
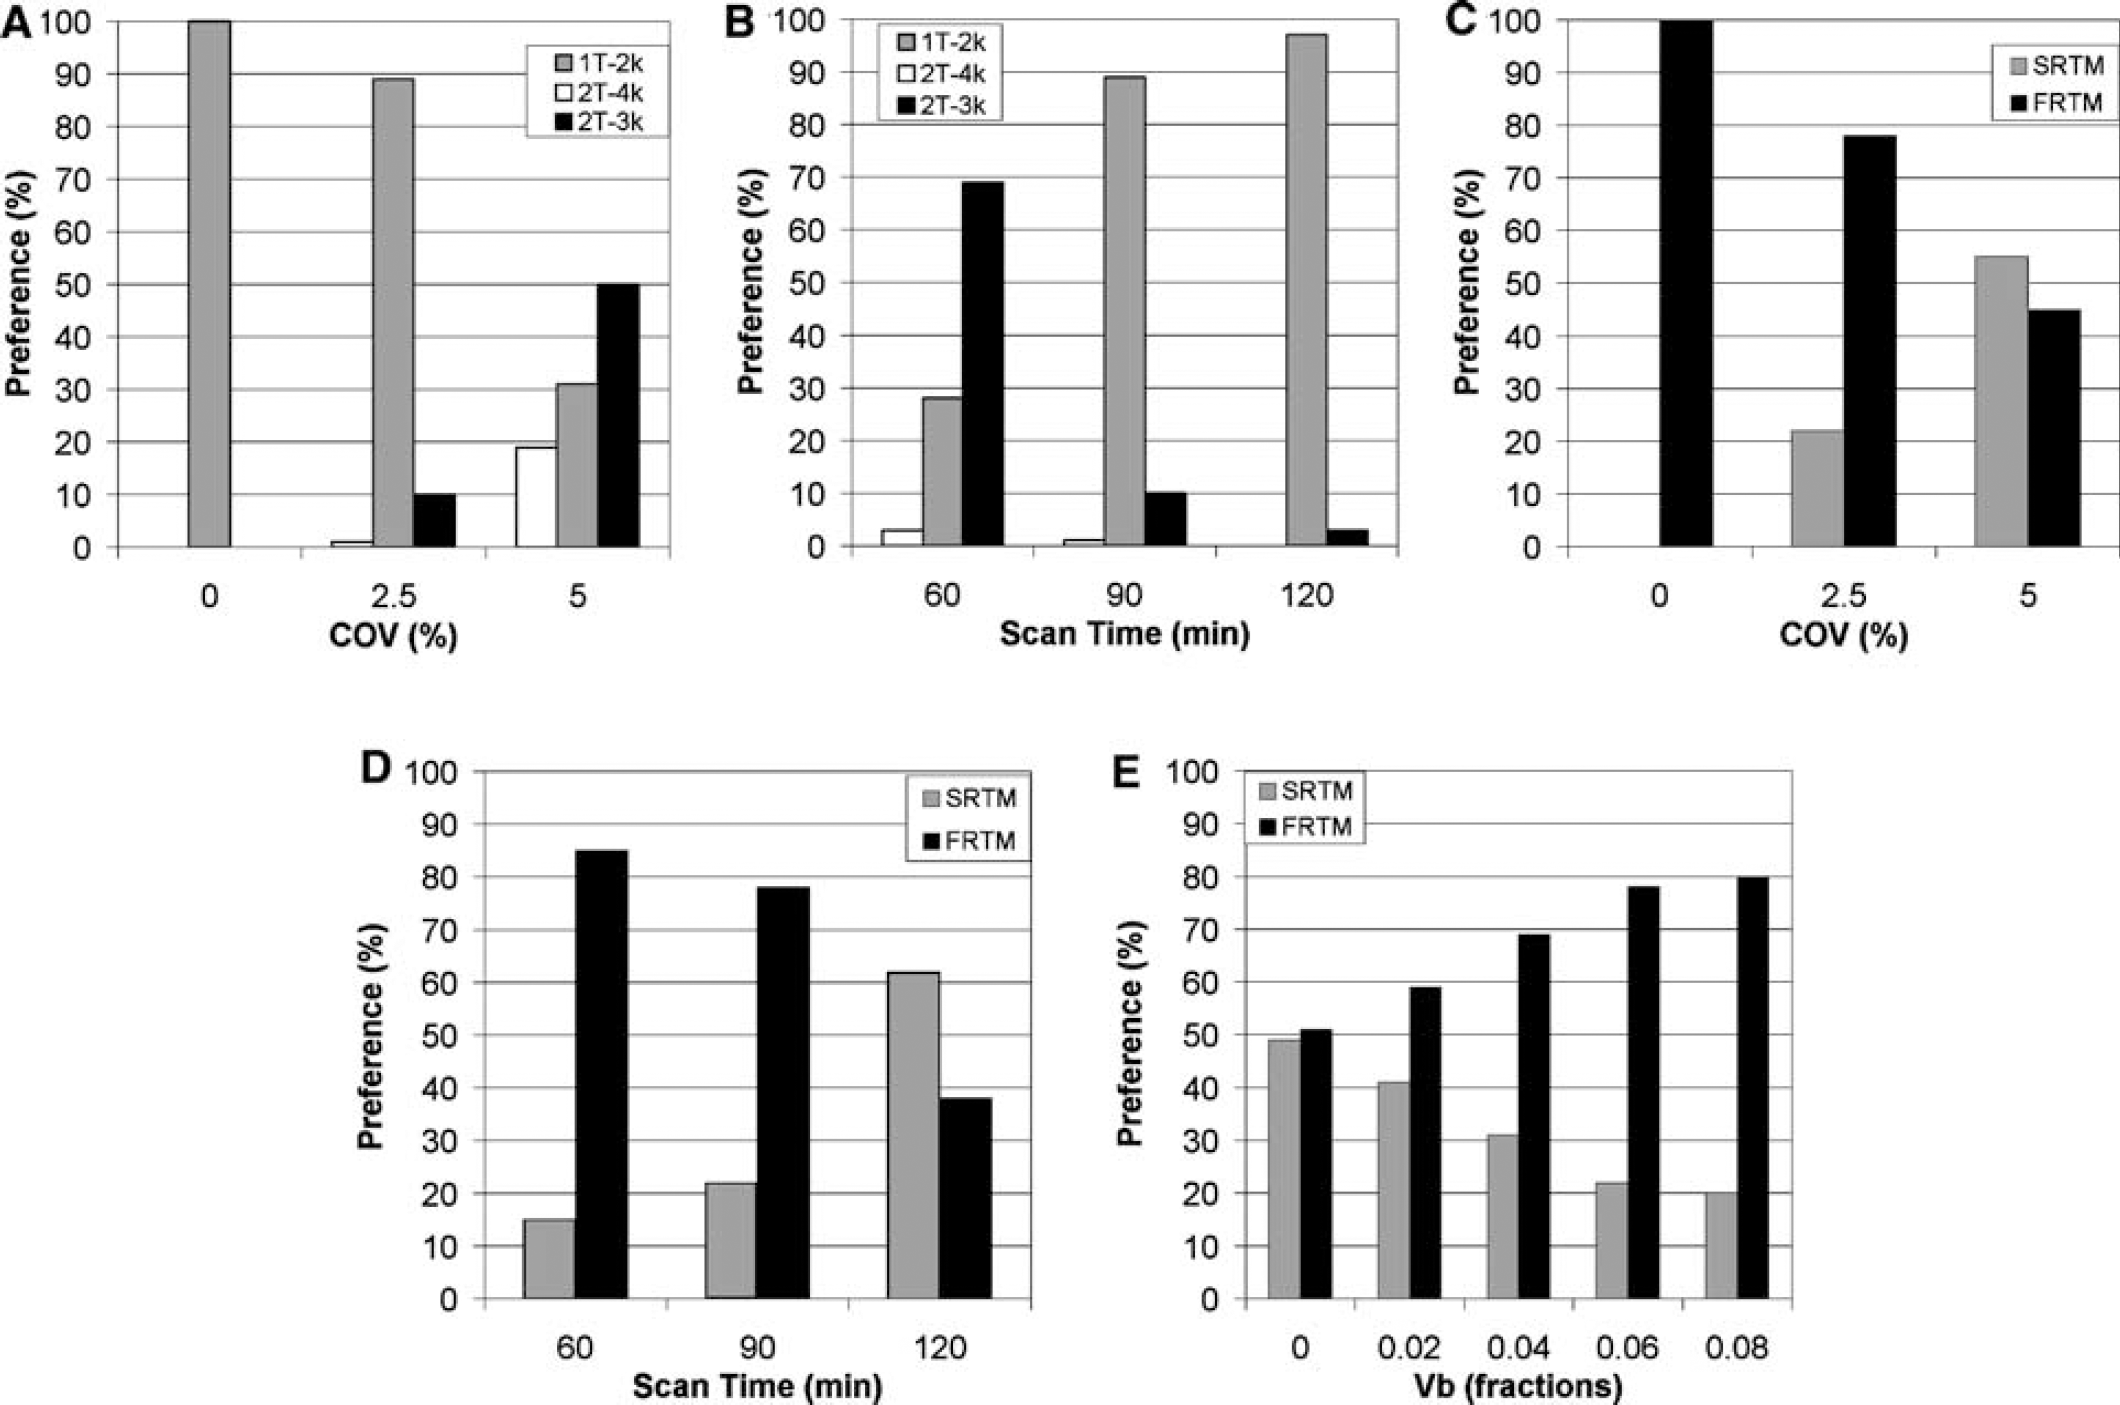
Fit accuracy: Akaike analyses of plasma input models indicated that both increasing TAC noise level (from COV = 0% to 5%, Figure 2A) and decreasing total scan time (from 120 to 60 mins, Figure 2B) resulted in increasing preference for the irreversible model (2T-3k) at the cost of the reversible model (2T-4k). Changing Vb (from 0 to 0.08) did not have a noticeable effect on these Akaike results of any plasma input model.
Preferred compartment model according to Akaike criterion for simulated [18F]FP-β-CIT data at default settings (Vb = 0.06, scan time = 90 mins and COV = 2.5%) with different TAC noise levels (
Akaike analyses of the reference tissue models indicated that an increase in TAC noise level (from COV = 0% to 5%, Figure 2C) shifted the preference from FRTM to SRTM. Decreasing scan duration (from 120 to 60 mins, Figure 2D), however, showed the reverse pattern. Finally, SRTM was more affected by increasing Vb (from 0 to 0.08) than FRTM (Figure 2E).
Bias and precision of outcome parameter: Although the two tissue reversible model (BP2T-4k) was used to simulate data, direct estimates of total binding potential using this model only provided the lowest bias and highest precision for TACs without any noise (COV = 0%, Figure 3A). Increasing scan duration also improved bias and accuracy of this model (Figure 3B). BP2T-4k, however, rapidly deteriorated compared with other methods if simulations were performed at noise levels seen in clinical practice (COV ≥ 2.5%, Figure 3A). In addition, for increasing Vb (from 0 to 0.08) some changes in uncertainty and bias of the direct BP estimate were visible (BP2T-4k: bias increasing from 1.15 ± 0.32 to 1.31 ± 0.51). In contrast, for all other models tested (indirect plasma input models, SRTM and FRTM) no noticeable differences in BP estimates were seen over a range of simulated Vb values (Bias: BP1T-2ki, 0.60 ± 0.03; BP2T-4ki, 0.59 ± 0.05; BPSRTM, 0.40 ± 0.01;BPFRTM, 0.38 ± 0.02).
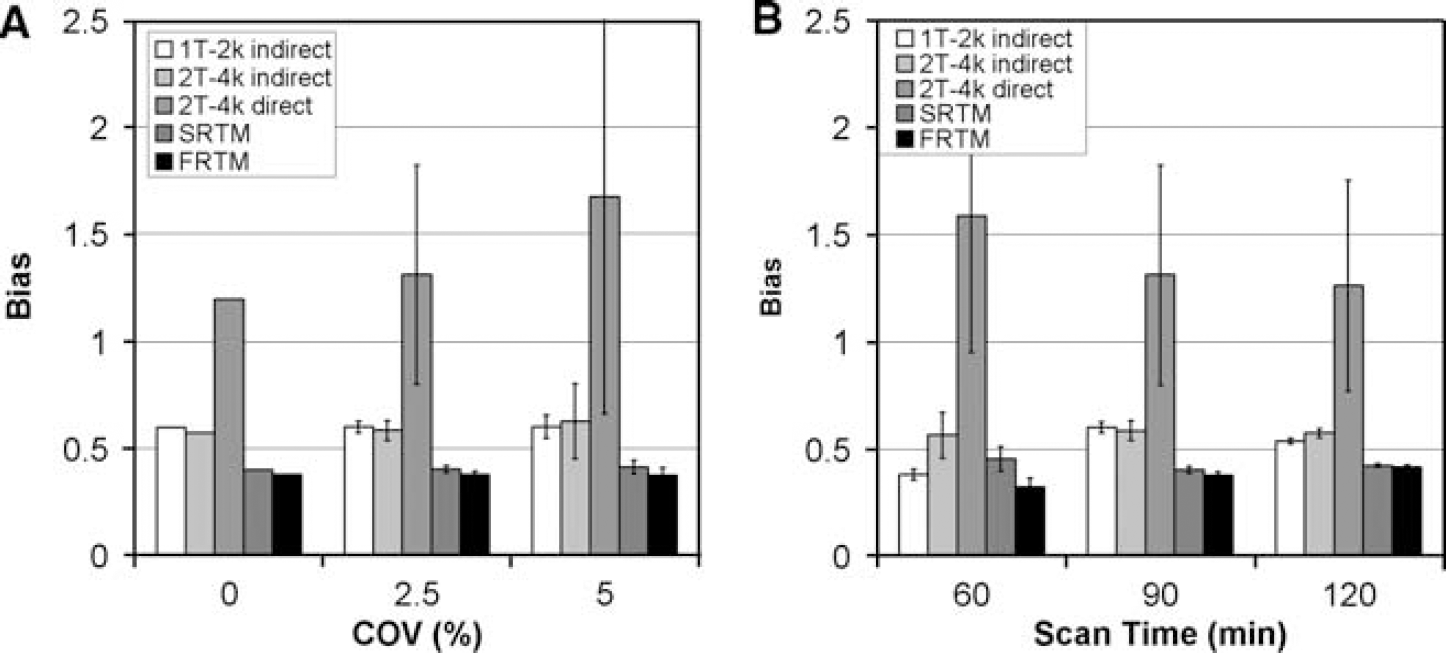
Bias and precision of BP estimated with different compartment models for simulated [18F]FP-β-CIT data at default settings (Vb = 0.06, scan time = 90 mins and COV = 2.5%) with different TAC noise levels (
BP estimates from reference tissue models (for both BPSRTM and BPFRTM bias average of 0.40 ± 0.02) showed bias, even at Vb = 0, but this bias was almost constant with low standard errors of the estimates for various noise levels, different Vb fractions and intermediate to large scan durations (> 60 mins).
Indirect BP estimates using Vd from 2T-4k fits of striatum and reference regions (BP2T-4ki) had lower bias than both BPSRTM and BPFRTM, probably because of the fact that a two tissue reversible model was used to simulate the cerebellum. Furthermore, standard errors of BP2T-4ki estimates were much lower than those of total BP2T-4k (Figures 3A and 3B). Indirect BP values using Vd from 1T-2k fits of striatum and reference regions (BP1T-2ki) were similar to those of BP2T-4ki for longer scan durations (≥ 90 mins, Figure 3B). Surprisingly, indirect BP measures using the 1T-2k method (BP1T-2ki) also showed less bias than SRTM and FRTM. The 1T-2k plasma input model was, however, not able to correctly fit striatum nor cerebellum TACs and therefore provided a systematic bias in Vd for both striatum and cerebellum. When using these Vd in the indirect approaches these biases might have partially cancelled out.
Clinical Data
Fit accuracy: The two-tissue irreversible model yielded slightly better fits for striatum, caudate and putamen than the two-tissue reversible model, according to the Akaike criterion (Figure 4A). In addition, the 2T-4k model clearly was the preferred model for fitting cortical grey matter TACs (Figure 4A). The Akaike criterion indicated higher preference for the simplified (SRTM) than for the full reference tissue model (FRTM) for striatum, caudate, putamen and cortical grey matter (Figure 4B). BP estimates: BP estimates for caudate, putamen and striatum based on plasma input models contained a large number of outliers (for striatum 1T-2k = 18% and 2T-4k = 27%, Table 2) especially for the caudate region (1T-2k = 43% and 2T-4k = 43%, Table 2). In contrast, SRTM and FRTM showed no outliers for striatum and putamen. BP estimates for a cortical grey matter region contained no outliers for conventional plasma input models, and in this case the number of outliers were somewhat higher for reference tissue models (SRTM = 17% and FRTM = 8%, Table 2).
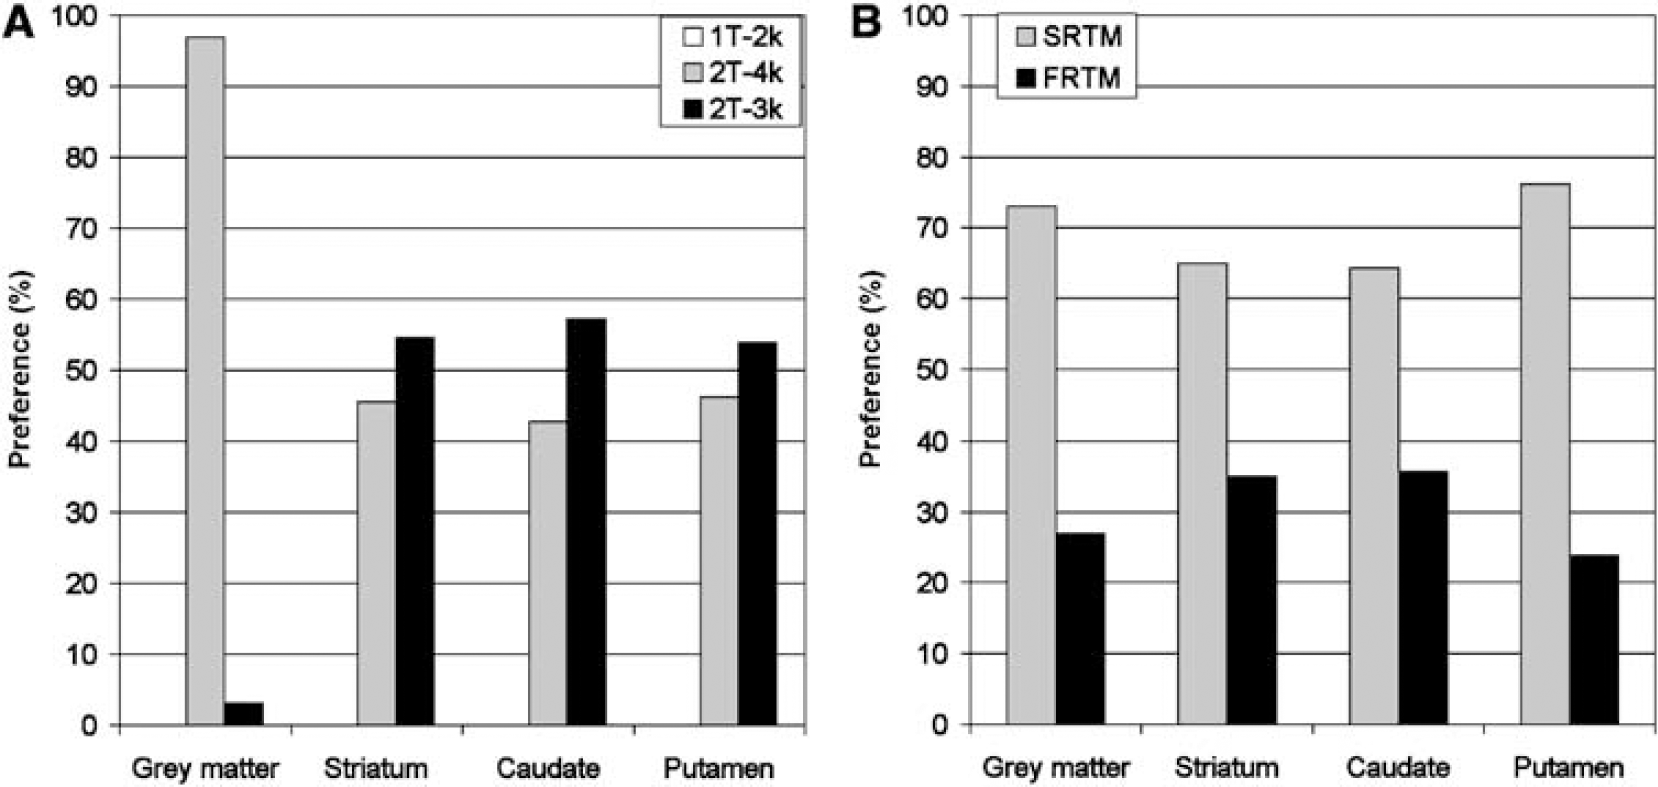
Average compartmental model preferences according to the Akaike criterion for clinical [18F]FP-β-CIT data of striatum, caudate, putamen and frontal grey matter. Plasma input (1T-2k, 2T-4k and 2T-3k;
The reference tissue models yielded the most stable results for striatum fits, in terms of numbers of outliers and accuracy of the model outcome. Therefore, other model outcomes were compared with those of SRTM. Table 3 summarises linear regression parameters obtained from correlation plots of different BP estimation approaches versus the BP estimate obtained with SRTM (for striatum). In striatum (and for caudate and putamen) the best correlation with BPSRTM was found for BPFRTM (R2 = 0.97, striatum, Table 3), which could be expected, as they both are reference tissue models. The next best correlation with BPSRTM was found for the indirect single-tissue model and corrected BPSRTMsp (both R2 = 0.91, striatum, Table 3). The results from the direct two-tissue reversible model (R2 = 0.08, striatum, Table 3) yielded very poor correlations with BPSRTM. Similar trends were found for caudate and putamen.
Linear regression parameters (slope, intercept and the Pearson product moment correlation coefficient R2) for BP of striatum, caudate and putamen using different approaches versus BPSRTM
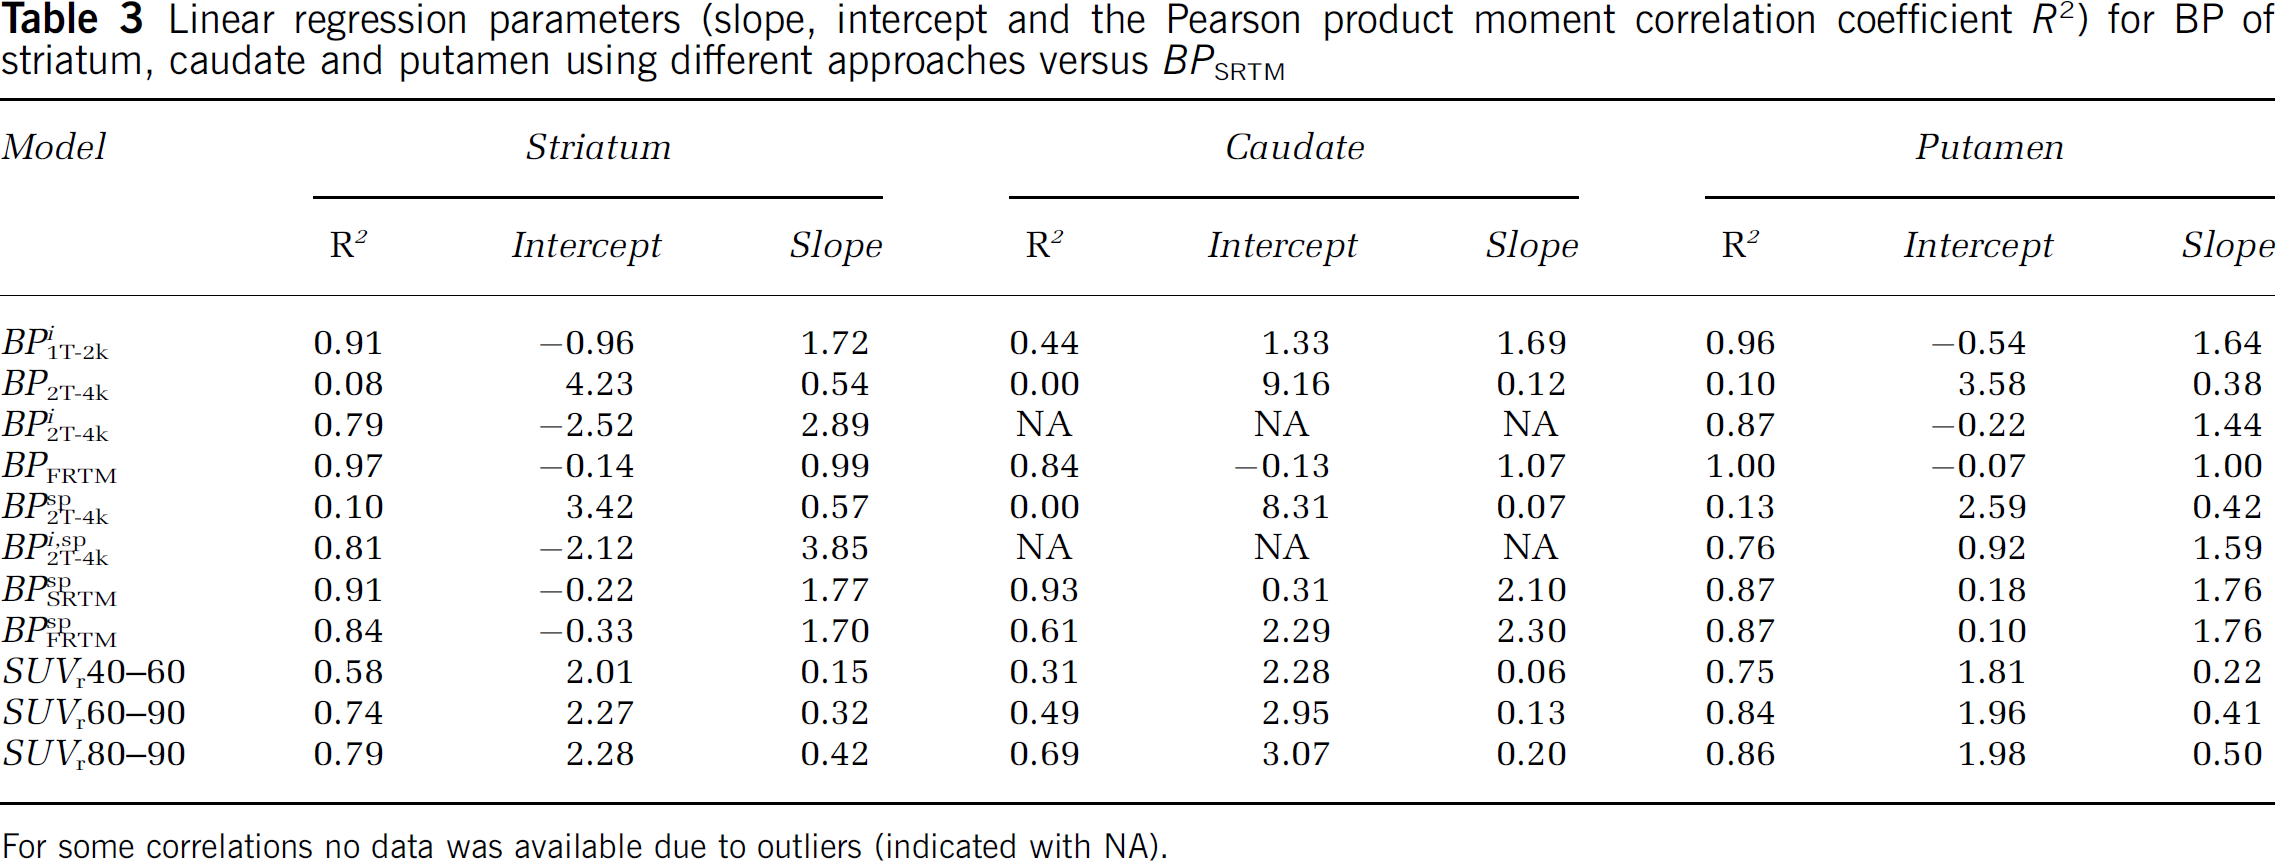
For some correlations no data was available due to outliers (indicated with NA).
SUV and SUV ratios: The correlation of SUVr (over 60 to 90 and 80 to 90 mins) with BPSRTM for striatum showed good agreement between both methods (R2 = 0.74 and R2 = 0.79 respectively, Table 3). SUV values themselves showed a much lower correlation with SRTM for both striatum (SUV over 80 to 90 mins: R2 = 0.15) and other grey matter regions (R2 = 0.58). Trends were similar for striatum, caudate and putamen showing that SUVr80 to 90 show best correlation with SRTM compared with other SUVr studied.
Discrimination between patients and normal controls: Figure 5 depicts rescaled averages of patient and control BP estimates. Rescaling was performed such that striatum values of controls were equal to 1. The model averages of ‘striatum patients’, ‘grey matter patients’ and ‘grey matter controls’ are thus normalized to average striatum value of the controls. SUV and SUVr showed a similar pattern as most other methods, with only the direct two-tissue reversible model showing a different pattern. The largest difference between patients and control subjects was achieved using the indirect two-tissue reversible model (Figure 5B). However, this method resulted in a large number of outliers (Table 2), making its clinical use not feasible.
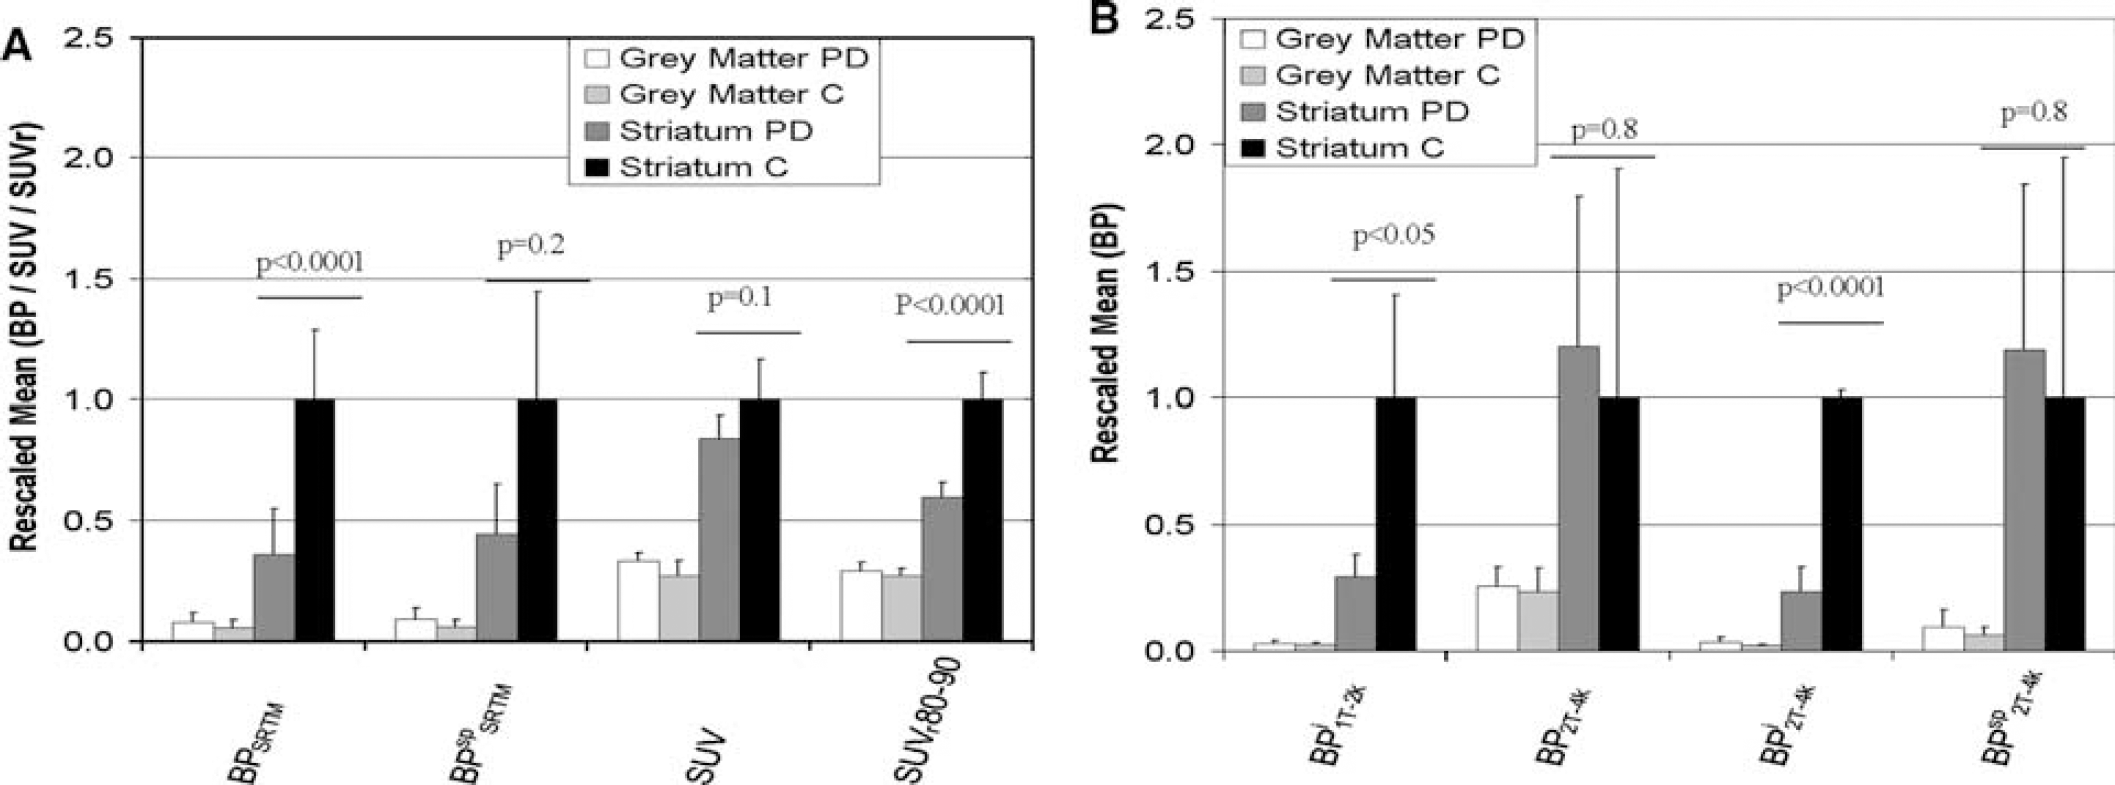
Clinical [18F]FP-β-CIT averages of SUV, SUVr = ROI-to-cerebellum ratio (ROI = striatum or frontal grey matter), binding potential (BP) estimates from simplified reference tissue model (SUV80–90, SUVr80–90, BPSRTM and BPSRTMsp
Discussion
Simulations
As expected, for perfect data, the two-tissue reversible model provided optimal fits, as this model was used to simulate the data. As soon as data contained noise (>2.5% COV) in combination with shorter scan durations (< 120 mins), better fits were obtained with the two-tissue irreversible model according to the Akaike criterion. This indicates that information on reversible kinetics is rapidly lost in the noise, especially for shorter scan durations.
For reference tissue models, FRTM provided the best fits at both increasing fractional blood volumes (Vb = 0 to 0.08) and at decreasing scan durations (< 120 mins, Figure 2D). FRTM fitted the TAC from 0 to 60 slightly better than SRTM, while both FRTM and SRTM provided similar accurate fits over 90 to 120 mins. Average residual sum of squared differences between simulated and fitted data with FRTM was 22% lower (better) than that of SRTM for scans of 60 mins, while this difference decreased to 7% for scans of 120 mins. This decreasing difference between FRTM and SRTM at increasing scan durations consequently increases the Akaike preference for SRTM at longer scan durations (Figure 2D), i.e. preference for models with less parameters. SRTM, however, was the preferred model for higher variance levels (< 2.5%). In general, FRTM performed only slightly better than SRTM, according to the Akaike simulations.
Direct BP estimates using the two-tissue reversible plasma input model (BP2T-4k) showed the highest level of bias and the largest errors, indicating relatively high dependency on scan statistics and duration. Although reference tissue models (SRTM and FRTM) resulted in biased BP estimates (because of e.g. non-specific binding), they showed the lowest standard errors at higher noise levels and at shorter scan durations. Moreover, bias obtained with reference tissue models seemed to be relatively independent of noise and scan duration.
Clinical Data
According to the Akaike criterion, irreversible models fitted the striatal (putamen and caudate) TACs only slightly better than reversible models, which is in agreement with the simulations for short scan duration (< 90 mins) and average variance level (∼2.5%).
Large numbers of outliers in BP estimates obtained with plasma input models needed to be excluded (Table 2). The large numbers of outliers are explained by the short scan time (90 mins) relative to the slow clearance of [18F]-FP-β-CIT. This is in agreement with the simulations, where scan durations of at least 120 mins were required to obtain reliable fits using plasma input models. For striatum regions there is no clear preference for reversible versus irreversible models (Figure 4A) because of high binding and ‘slow’ kinetics. Consequently, fitting a TAC showing irreversible kinetics using a reversible model will result in an unrealistic high BP, as the model tries to set k4 equal to 0 and thus BP to very high values (Table 2). Similarly, TAC showing reversible kinetics will be fit poorly using the irreversible model. Cortical areas show much less binding, so that in all cases a reversible model was able to fit the data (Figure 4A). The poorer results of the reference tissue models for the cortical areas are, in this case, caused by the low binding (Table 2). In general SRTM and FRTM provide less stable fit results when a TAC contains low binding.
SRTM and FRTM performed equally well with results that were highly correlated, as expected from the simulations. Therefore, further evaluations were confined to the SRTM model because of the lower number of fit parameters. SRTM yielded better BP estimates than direct estimates of BP using plasma input models in terms of parameter sensitivity and standard errors. However, BP estimates obtained from plasma input based volume of distribution ratios had high correlation with SRTM. The difference between the direct and the indirect methods is probably because of the high uncertainty in the direct estimate of BP in which it is difficult to separate specific from non-specific binding (in addition to the high correlation between fit parameters).
General Considerations
In both simulations and clinical evaluations, the most reliable results with relatively high precision were found with reference tissue models as opposed to other (plasma input) kinetic methods. In addition, plasma input models were unable to determine the kinetics correctly, because data could be described equally well by reversible and irreversible plasma input models for clinical scans of 90 mins duration. Furthermore, reference tissue models provided a clear distinction between patients and healthy controls and they are less invasive because no arterial sampling is required. SUV striatum-to-cerebellum ratios also provided good distinction between patients and healthy controls. In fact, the difference between both subject groups using SUVr (over 80 to 90 mins) was smaller, but with higher precision than SRTM. Therefore both SUVr and reference tissue models are suitable methods for analysing [18F]-FP-β-CIT studies. An obvious drawback of using SRTM is the need for a dynamic scan with a duration of at least 90 and preferably 120 mins. This results in reduced patient comfort, increased scanner occupation and thus lower patient throughput. SRTM, however, does provide higher contrast between striatum and cortical ROI. SUV and SUVr can be biased by the uncertainty in the exact scan time, flow differences and pathological TAC differences. Further clinical evaluations are needed to assess if these potential drawbacks would hamper the use of SUVr for clinical [18F]-FP-β-CIT studies.
Conclusion
Simulations showed that reference tissue models outperformed plasma input models about precision and accuracy under clinically relevant conditions. For scan durations of 90 mins or less, plasma input models were unable to determine whether kinetics in striatum were reversible or irreversible. Similar observations were made using clinical [18F]FP-β-CIT striatum (caudate and putamen) data. SUV ratios performed almost equally well as SRTM in distinguishing between patients and controls. SRTM, however, provided better contrast between striatum and cortical regions than the SUV based methods.
In summary, SRTM with a minimum scan duration of 90 mins is the method of choice for quantitative analysis of [18F]FP-β-CIT studies. For diagnostic studies SUVr could be an interesting alternative, but further studies are required to investigate its behaviour under abnormal flow conditions.
Footnotes
Acknowledgements
We thank the personnel of the Department of Nuclear Medicine & PET Research for tracer production and data acquisition and Janssen Research Foundation (Belgium) for kindly donating 2β-carbomethoxy-3β-(4-iodophenyl)nortropane.