
Abstract
The positron emission tomography (PET) ligand [11C]DASB is currently the most widely used imaging agent for quantitative studies of the serotonin transporter (SERT) in human brain. The aim of this work was to assess the effects of an intravenous infusion of 10 mg citalopram, a selective serotonin reuptake inhibitor (SSRI), before the PET scan on the kinetics of [11C]DASB in arterial plasma and in selected brain regions. Four healthy male volunteers underwent two PET scans with a mean of 523 MBq injected activity after either placebo or Citalopram infusion in a randomised design. The Citalopram infusion led to a substantial increase of the area under the curve of the metabolite-corrected arterial plasma input function. Total volumes of distribution
Keywords
Introduction
Serotonin (5-hydroxytryptamine, 5-HT) is a neurotransmitter that plays a pivotal role in the pathophysiology of mood disorders and in the regulation of emotion. In the central nervous system, the serotonin transporter (SERT) or serotonin reuptake site is located on the presynaptic nerve endings and plays a key role in the regulation of the serotonin levels in the synaptic cleft. Selective serotonin reuptake inhibitors (SSRIs) provide the means to increase the serotonin concentrations in the synapse and to augment serotonergic neurotransmission. They are widely used in the treatment of mood and anxiety disorders, such as major depressive disorder, obsessive—compulsive disorder, and generalised anxiety disorder.
Underscoring its central position in the regulation of serotonergic function, a number of attempts have been made to perform
Various tracer kinetic modelling approaches for human [11C]DASB studies making use of a plasma input function or of a reference tissue input function were compared (Ginovart et al, 2001; Frankle et al, 2006; Ogden et al, 2007). Furthermore, methods for the fast generation of parametric maps using a cerebellar time—activity curve (TAC) as the input function were presented (Ichise et al, 2003; Kim et al, 2006).
In general, the quantification of the specific binding in brain PET studies is based on two assumptions regarding the use of a reference region (Cunningham and Lammertsma, 1995).
The reference region should effectively be devoid of specific binding. The free and nonspecific binding of the radioligand should be uniform across the entire brain such that the binding estimate in the reference region can be used as a measure of the free and nonspecific binding in the other parts of the brain.
Specifically in studies of PET radioligand binding to the SERT, a growing amount of evidence suggests that these assumptions may not be fully met. Four examples may serve here as a cross-section through these findings.
Szabo et al (2002) observed changes of [11C](+) McN5652 binding and of [11C]DASB binding in the cerebellum of baboons after lesioning with MDMA (methylenedioxymethamphetamine) or treatment with the SSPI paroxetine. Ikoma et al (2002) developed a dual scan paradigm based on administering of both stereo-isomers of [11C]McN5652, the nonspecifically binding [11C](−)McN5652, and the SERT selective [11C](+)McN5652 (Suehiro et al, 1993), to obtain estimates of the regionally variable free and nonspecific binding of [11C](+)McN5652. Kish et al (2005) found in postmortem brain of normal adult subjects a SERT concentration in cerebellar cortex and white matter of approximately 20% of the concentration in cerebral cortex or 5% of the concentration in striatum. Parsey et al 2006a) reported a 33% reduction of the [11C]DASB distribution volume in cerebellar grey matter after daily oral sertraline treatment in healthy volunteers.
The changes of radioligand binding to the SERT in the cerebellum observed by, for example, Szabo et al (2002), Kent et al (2002), and Parsey et al (2006a) were all greater than what can be expected from
Therefore, the aim of this study was to assess the effects of a single bolus infusion of 10 mg of the SSRI Citalopram on the [11C]DASB kinetics in the plasma and in the brain of healthy humans.
Although Citalopram infusion has been used as a neuropharmacologic probe of serotonergic function (Lotrich et al, 2005), only one functional imaging study with PET after parenteral Citalopram has been published so far describing local changes in cerebral glucose metabolism (Smith et al, 2002). However, brain SERT occupancy measured with PET after oral Citalopram administration were reported (Meyer et al, 2001; Meyer et al, 2004). Our aim, therefore, was to
Materials and methods
Subjects and Medication
Four healthy male control subjects (aged 49, 37, 57, and 42 years) gave written informed consent to be included in the study. Subjects were randomised to receive either a slow intravenous infusion of Citalopram 10 mg or placebo for more than 30 mins starting 45 mins before injection of the radioligand. The dose and timing of the injection were based on previous studies showing robust and sustained effects of this dose of Citalopram on anterior pituitary hormones—a putative marker of serotonergic system integrity (Attenburrow et al, 2001; Bhagwagar et al, 2002). As published by Lotrich et al (2005) (Figure 3), this schedule leads in healthy control subjects to a fairly stable Citalopram plasma concentration of about 10 ng/mL between 45 and 150 mins after the start of the infusion with little between-subject variability.
Subjects were studied at least a week apart for both experiments, mean interval 9 ± 3.4 days. All subjects were screened using the Structured Clinical Interview for DSM-IV Disorders (First et al, 1997) to exclude any current or lifetime history of Axis I disorders. None of them had any first-degree relative with any major psychiatric illness. Exclusion criterion included current or past serious medical or neurological illness, alcohol or illicit substance dependence, and recent use (not less than three months) of any centrally acting medication. The Research Ethics Committee of the Hammersmith Hospitals Trust and the Administration of Radioactive Substances Advisory Committee (ARSAC) of the United Kingdom approved the study.
All PET studies were performed in the early morning or late afternoon within a time window of approximately 3 h. Subjects arrived at least 2 h before the PET scan and had a cannula placed in the radial artery and a venous cannula inserted in the contralateral antecubital vein.
Positron Emission Tomography Scans
The radiotracer [11C]DASB was synthesised as previously described (Wilson et al, 2000) by reaction of [11C]methyl-iodide with the desmethyl precursor. The standard DASB and the precursor desmethyl DASB were obtained from Target Molecules Ltd (Southampton, UK). [11C]DASB was injected by hand into an antecubital vein as a smooth bolus for more than 30 secs. The injected radioactivity dose was between 487 and 547 MBq (mean: 523 MBq, s.d.: 24 MBq). The radiochemical purity of the injected [11C]DASB was high and ranged from 97% to 100% with a mean of 98% and an s.d. of 1.2%. The injected mass of cold DASB varied between 1.07 and 7.05 μg with a mean value of 2.4 μg
All PET scans were performed on the high-sensitivity Siemens/CTI scanner ECAT EXACT3D with an axial field of view of 23.4 cm and 95 reconstructed transaxial image planes (Spinks et al, 2000). To reduce the effect of activity outside the direct field of view in brain scans, the tomograph was equipped with annular side shielding (Spinks et al, 1998). A 5-mins transmission scan using a 137Cs point source was performed before each study for subsequent attenuation correction and scatter correction (Watson et al, 1996). The 90-mins three-dimensional dynamic emission scan was acquired in list mode. In the post-acquisition frame rebinning, 28 time frames of increasing length were generated (30 secs background frame before the injection, then one 15 secs frame, one 5 secs frame, one 10 secs frame, three 30 secs frames, three 60 secs frames, three 120 secs frames, three 180 secs frames, eight 300 secs frames, and four 450 secs frames). The spatial resolution of the images reconstructed using the reprojection algorithm with the ramp and Colsher filters set to Nyquist frequency is close to isotropic: 5.1 mm full width at half maximum transaxially and 5.9 mm full width at half maximum axially averaged over a radius of 10 cm from the centre of the field of view (Spinks et al, 2000). Positron emission tomography data were not corrected for head motion. On the basis of visual inspection of the tissue TACs, it was ensured that all PET scans were free of detectable head motion.
Arterial whole blood activity was monitored continuously for the first 28 mins of the scan with a bismuth germanate coincidence detector (Ranicar et al, 1991). For the initial 10 mins during which the peak of radioactivity in the blood occurs and fine temporal sampling of the signal is required, the blood flow rate through the detector system was set to 5 mL/mins. Thereafter, the blood pump rate was reduced to 2.5 mL/mins. Ten discrete arterial blood samples were taken at 3, 9, 15, 21, 28, 35, 42, 50, 70, and 90 mins into heparinised syringes. The activity concentration of the whole blood and the plasma were measured.
Eight plasma samples per scan (at 3, 9, 15, 21, 35, 50, 70, and 90 mins) were analysed for metabolites using a semiautomated system with online solid-phase extraction followed by reverse-phase chromatography with online radioactivity and UV detectors and integration system (Luthra et al, 1993). The plasma samples were loaded onto the solid-phase extraction column and eluted with di-ammoniumhydrogen phosphate (0.01 mol/L) and further analysed using reverse-phase column (μ-Bondapak C18 column, 30 × 0.78 cm internal diameter) eluted with a mixture of ammonium formate (10 mmol/L) and methanol (35:65 v/v) at a flow rate of 3 mL/mins. The eluate was monitored for UV absorbance at 254 nm and radioactivity and subsequent data captured on a PC-based integrator. The overall recovery was calculated from the collected radioactivity coming off the HPLC column and from the measurement of the radioactivity of the aqueous phase relative to the total radioactivity loaded onto the solid-phase extraction column. The amount of [11C]DASB and its radioactive metabolites at a given time point was calculated from the decay-corrected integrated radiochromatogram and the levels of radioactivity in the solid-phase extraction eluate and expressed as a percentage of total plasma sample injected.
Magnetic Resonance Scans and Definition of Volumes of Interest
All volunteers had a structural T1 magnetic resonance (MR) scan performed on either 0.5 or 1.5 T MR scanners (GE Signa scanner; GE Medical Systems, Milwaukee, WI, USA). All structural scans were inspected by an independent clinical neuroradiologist and found to be normal. Magnetic resonance images (MRIs) were resliced to a voxel size of 1 × 1 × 1 mm3, centred on anterior commissure and aligned to the AC-PC line.
Magnetic resonance images were coregistered to the individual PET images summed from 9 mins after injection until the end of the PET scan using SPM2 (Functional Imaging Laboratory, London, UK), which adopts a rigid body transformation using normalised mutual information method. Volumes of interest (VOIs) were defined on the coregistered MRI with the help of a probabilistic brain atlas template (Hammers et al, 2002; Hammers et al, 2003). The standard MNI T1 template (available in the SPM2) was normalised to the coregistered individual MRI and the deformation parameters were applied to the probabilistic atlas. This normalised brain atlas was resliced to PET space and segmented with SPM2 (Ashburner and Friston, 1997) to obtain data from grey matter only. The following seven VOIs were chosen for the analysis.
SERT moderate to rich regions: brainstem, thalamus, amygdala, putamen, and caudate, a region with moderate SERT density: hippocampus, a region with very low concentration of SERT: cerebellum. We obtained data from posterior cerebellar grey matter up to 5 to 8 slices carefully avoiding spill over from occipital cortex or venous sinuses by placing the volume of interest well within the cerebellar cortex area leaving a margin of several millimetres around to the outer borders of the cerebellum as defined in Hammers et al (2003), page 240.
The dynamic PET scans were then sampled by applying the individual VOI object maps to create regional tissue TACs.
Generation of the Plasma Input Function
For the generation of the plasma input functions, the time course of the plasma-to-blood ratio, obtained from the first five discrete arterial samples at 3, 9, 15, 21, and 28 mins scan time, was first fitted to a sigmoidal.
Then, the measurement of the arterial whole blood activity obtained from the continuous detector system (Ranicar et al, 1991) was multiplied with that ratio to obtain a total plasma activity curve for the first 28 mins of the scan. This curve was then combined with the discrete plasma activity concentration measurements at 35, 42, 50, 70, and 90 mins to an input function describing the total plasma activity concentration for the entire scan.
The input function of the activity concentration due to unmetabolised [11C]DASB in plasma was then created by multiplying the total plasma activity input function with the function obtained from the fit of the model for the parent fraction in plasma to the eight measurements of the parent compound during the scan. Finally, the time delay of the arrival of the radioactivity bolus at the peripheral sampling site relative to the brain was determined (Hinz and Turkheimer, 2006).
All calculations were performed using Matlab® (The MathWorks Inc., Natick, MA, USA) on Sun Ultra™ 10 workstations (Sun Microsystems Inc., Santa Clara, CA, USA).
Quantification of the Ligand Binding in Tissue
For the quantitation of the [11C]DASB binding in brain tissue, different previously used approaches were considered (Ginovart et al, 2001; Frankle et al, 2006; Ogden et al, 2007), with the aim of expressing the radioligand binding in tissue relative to the radioligand concentration in the arterial plasma to be able to assess the properties of the reference region.
Estimates of compartmental model parameters were obtained from weighted fits of the regional TACs. Details of this procedure were described in a previous study (Hinz et al, 2007). As a second method, the graphical analysis of reversible radioligand binding using the plasma input function (Logan et al, 1990) was applied to obtain regional estimates of the total volume of distribution
The binding potential of the nondisplaceable binding

and the binding potential of the specifically bound radioligand relative to the parent radioligand in plasma

The occupancy was expressed as the percentage reduction of the binding potential between baseline and blocked condition

where
Results
Input Function
In Figure 1, the observed time courses of the ratio of plasma activity concentration over whole blood activity concentration are plotted for the two different scanning conditions. Under baseline condition after placebo infusion, the plasma-over-whole blood activity concentration ratio (POB ratio) was smaller than one, which means that the radioactivity concentration in whole blood was higher than in plasma. Owing to similarities in the properties of the membranes of red blood cells with the properties of the blood—brain barrier (BBB), the higher concentration of a lipophilic radiotracer such as [11C]DASB, which is thought to cross the BBB by passive diffusion, in the red cell fraction than in the plasma fraction can be expected. During the time course of the PET scans, the POB ratios were continually increasing. This is consistent with the fact that the radiolabelled metabolites of [11C]DASB were reported to be more polar than the parent compound [11C]DASB (Wilson et al, 2000) and as such are expected to preferentially accumulate in the plasma fraction rather than the red cell fraction.
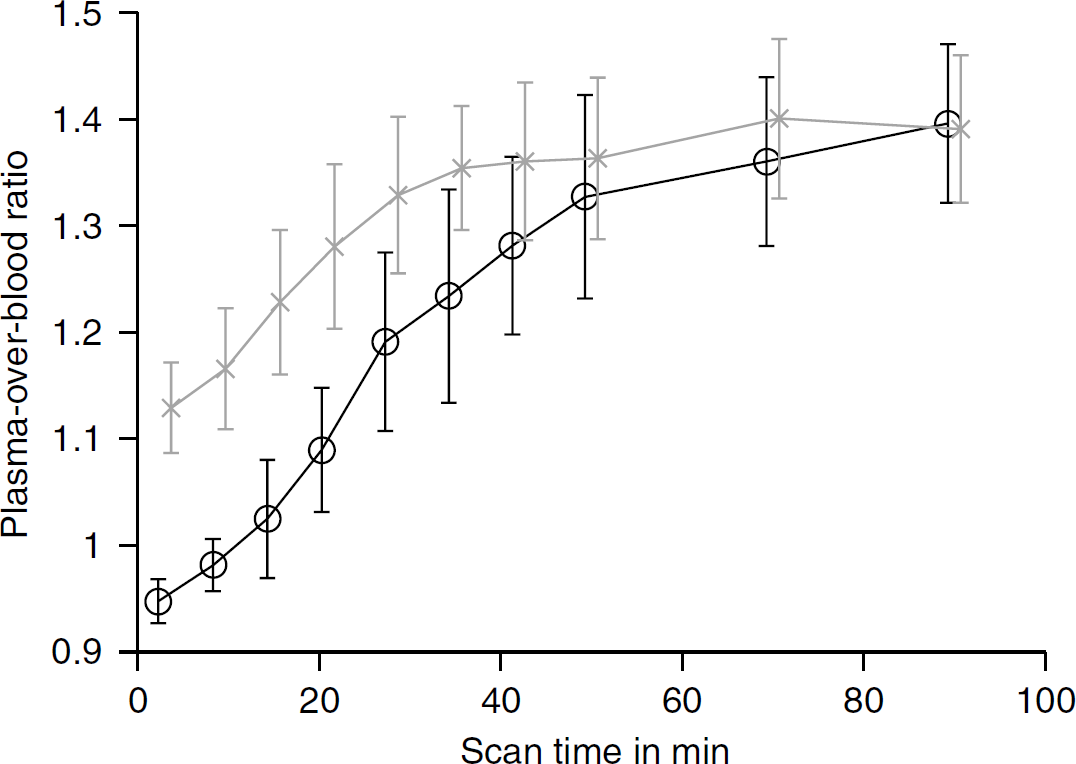
Ratio of plasma activity concentration over whole blood activity concentration after placebo infusion (circles) or Citalopram infusion (crosses). The mean values with their standard deviations are given for each of the 10 discrete arterial blood samples.
In the initial phase of the scans performed after Citalopram infusion, the POB ratios were significantly higher than under baseline condition. As the scans progressed, this difference became gradually smaller, such that at the end of the scans at 90 mins, the POB ratios were no different between baseline and blocked condition. The initially higher POB ratio is likely because of Citalopram blocking the SERT-binding sites on the platelets, which are part of the red cell fraction when the blood samples are centrifuged. As a consequence, the concentration of [11C]DASB in plasma is higher than in the red cell fraction. Because more and more radioactivity in the blood is represented by radiolabelled metabolites than by the unmetabolised [11C]DASB and because the Citalopram concentration in blood is also going down, the partition of the radioactivity between plasma and the red cell fraction approaches that observed after placebo infusion.
In Figure 2, the time course of the fraction of the radioactivity in plasma that is because of the unmetabolised parent compound [11C]DASB is depicted for the two conditions. Despite the fact that the radiochemical purity of the injected dose was at least 97%, the parent fraction measured in the 3-mins sample was well below 90% (after Citalopram infusion) or below 80% (after placebo infusion). A similar low parent fraction of the first arterial sample, followed by a higher parent fraction in the second samples has been reported by Parsey et al (2006b). Dynamic acquisitions of the activity distributions in humans, baboons, and rhesus monkeys have shown that for the first 5 mins or so more than 50% of the total injected [11C]DASB activity are concentrated in the lungs (Lu et al, 2004; Bélanger et al, 2004; Tipre et al, 2004). As the lungs have been described as an organ of high metabolic activity and with a high concentration of serotonin reuptake sites, the intravenous infusion of Citalopram before the [11C]DASB administration and the subsequent blockade of the SERT-binding sites in the periphery by Citalopram are consistent with the observed increase of the parent fraction at the onset of the PET scan. As the scan progressed, the differences between the measured parent fractions under baseline and blocked condition are no longer significant (Figure 2). As with the POB ratio, at the end of the PET scan at 90 mins, there is no difference between the two conditions in the parent fraction. The statistical uncertainty of the late parent fraction measurements was in the order of 5% to 10% as the entire late scan time chromatograms had only a few thousand counts acquired over an HPLC run time of 12 mins, and the parent fraction peak then represented about 10% of the total plasma radioactivity.
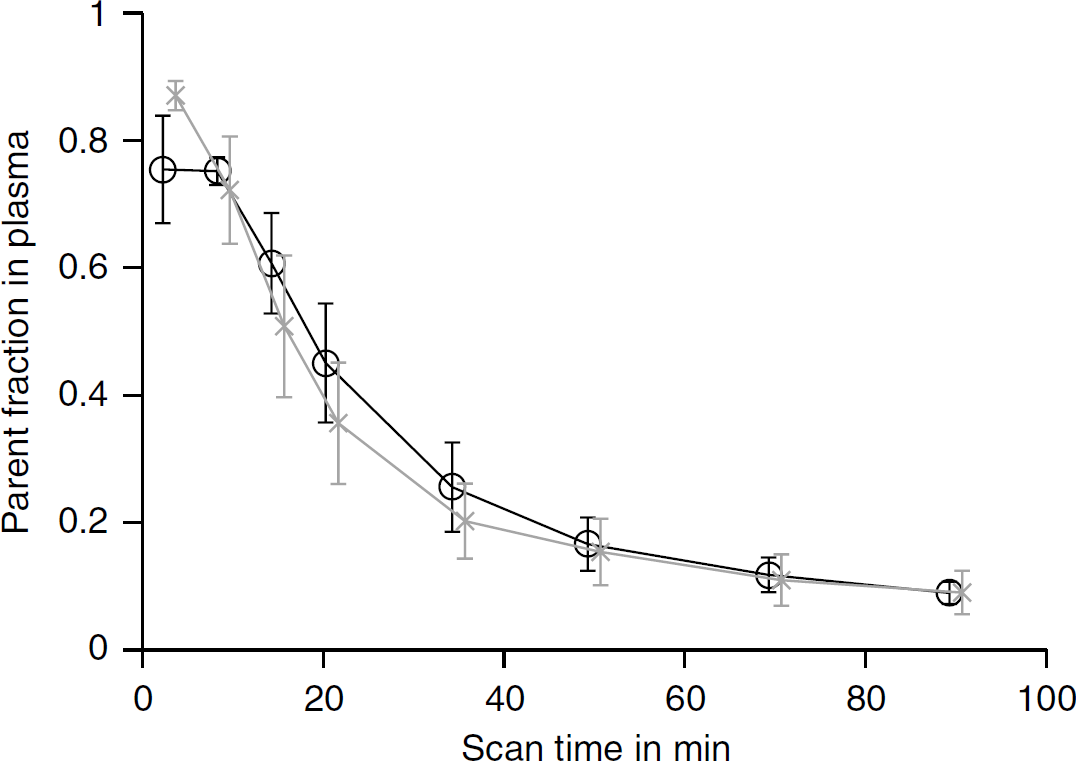
Fraction of unmetabolised parent compound in arterial plasma. The plotted bars represent mean values and standard deviations from the four scans under each condition (baseline scans marked by circles and blocked scans marked by crosses).
To be able to account for this qualitative difference in the measured time course of the parent fraction, two different mathematical functions were used. The first model function is a sigmoidal
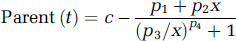
where
For the measurements of the parent fraction in plasma obtained in subjects 2 and 3 after placebo infusion where the measured parent fractions at 9 mins were greater than those at 3 mins, the following model function with five free parameters was used to allow for a local maximum

with all
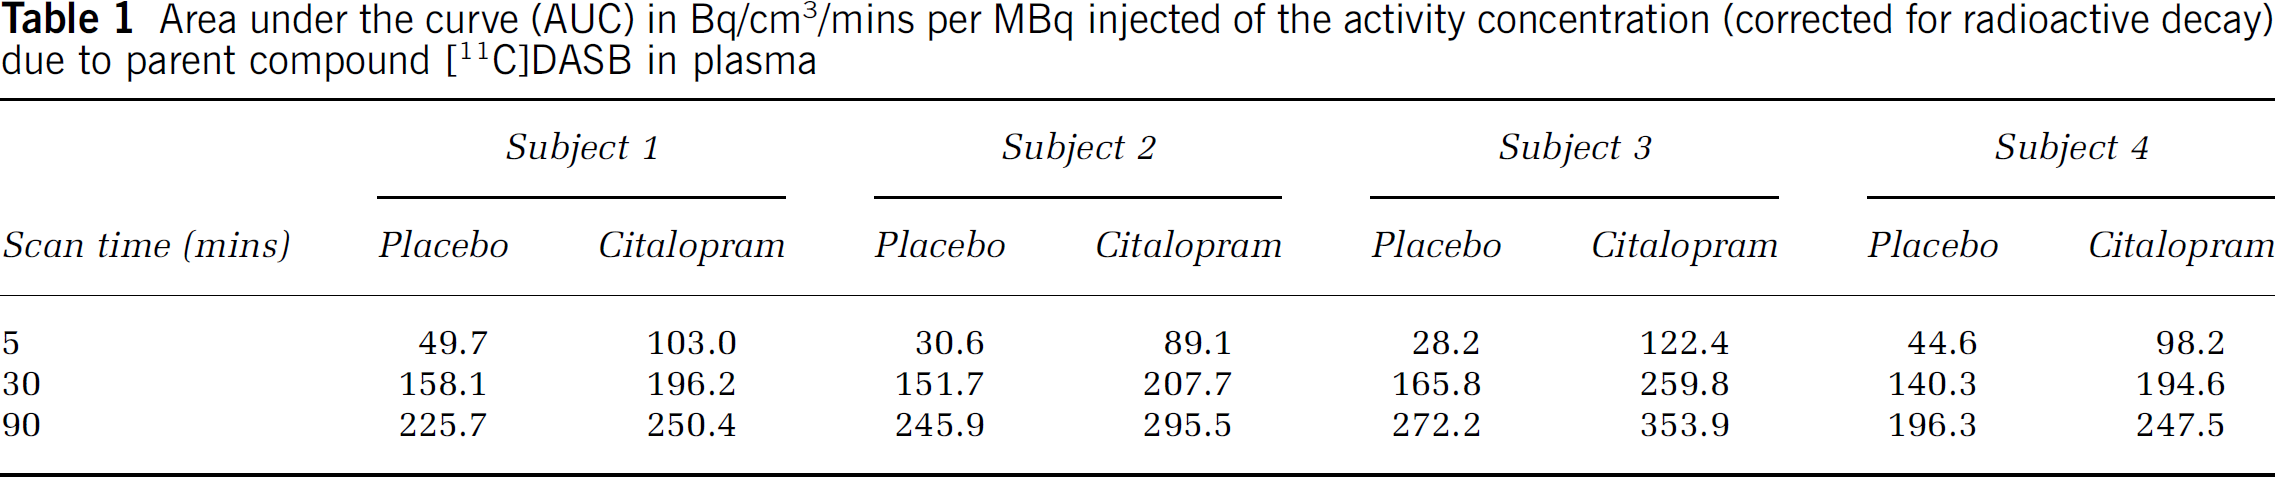
The overall impact of the Citalopram infusion on the [11C]DASB arterial plasma input functions is expressed as the AUC (area under the curve) for all four subjects in Table 1. After 5 mins, the AUC after Citalopram infusion was by a factor of two to three more than after placebo infusion. This relative increase of the bioavailability of [11C]DASB after SSRI administration continued throughout the scan, although to a lesser extent such that at 90 mins, the AUCs were, on average, 24% increased in comparison with the placebo scans.
Area under the curve (AUC) in Bq/cm3/mins per MBq injected of the activity concentration (corrected for radioactive decay) due to parent compound [11C]DASB in plasma
Tissue Response
In correspondence with the known distribution of the SERT in human brain and as previously reported (Houle et al, 2000), high uptake of [11C]DASB was observed in thalamus, midbrain, and hypothalamus, moderate uptake in hippocampus and basal ganglia, and relatively low uptake in the cerebellum. Figure 3 shows tissue TACs from five selected regions of one subject after placebo infusion and after Citalopram infusion, respectively. Under baseline condition and consistent with the observations by Frankle et al (2004), the local maxima of the TACs occurred, dependent on the speed of the regional kinetics, between 20 and 60 mins. After Citalopram infusion, the peak times of the regional TACs were reached earlier (between 10 and 30 mins); thus, the kinetics were accelerated in comparison with the baseline condition. The peak activity concentration in the cerebellum was—as a consequence of the increased availability of [11C]DASB in plasma—higher after Citalopram infusion than it was after placebo infusion (Figure 3).
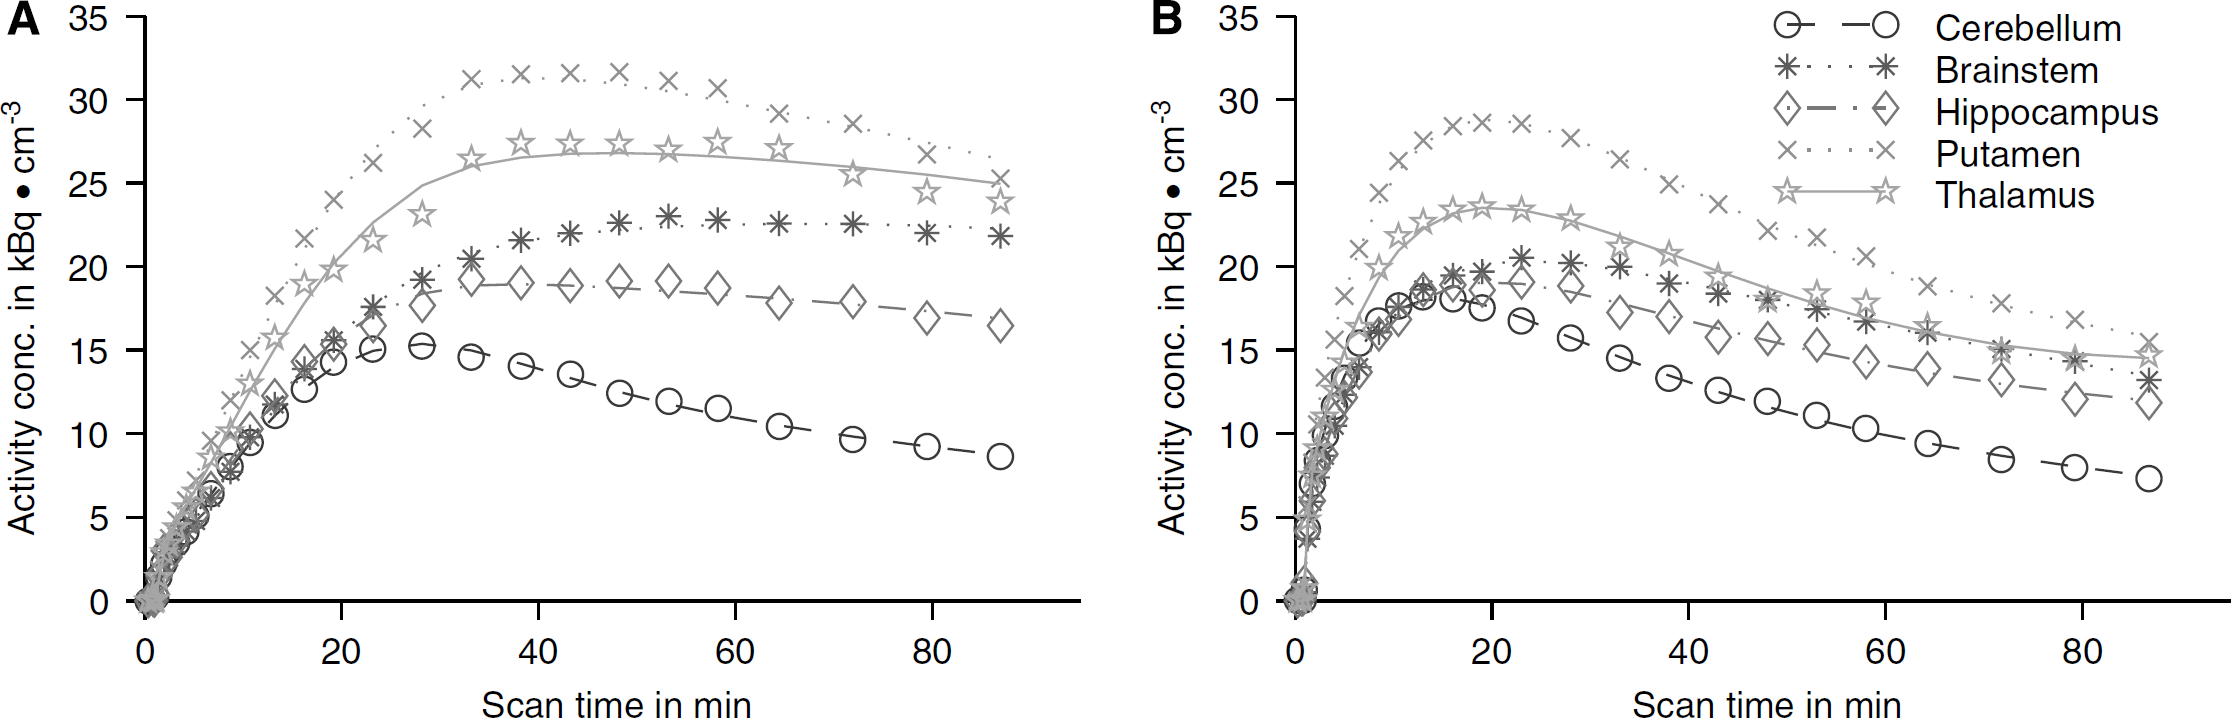
Five selected regional tissue TACs from one subject after placebo infusion (
The regional TACs were initially fitted to the reversible two-tissue compartment, four rate constants model with a free blood volume term without constraints, details of the procedure were described previously (Hinz et al, 2007). However, in several instances, difficulties with the convergence of the minimisation algorithms were encountered, and negative estimates of the rate constant
Therefore, the graphical analysis of reversible binding (Logan et al, 1990) was used to obtain estimates of the total volumes of distribution
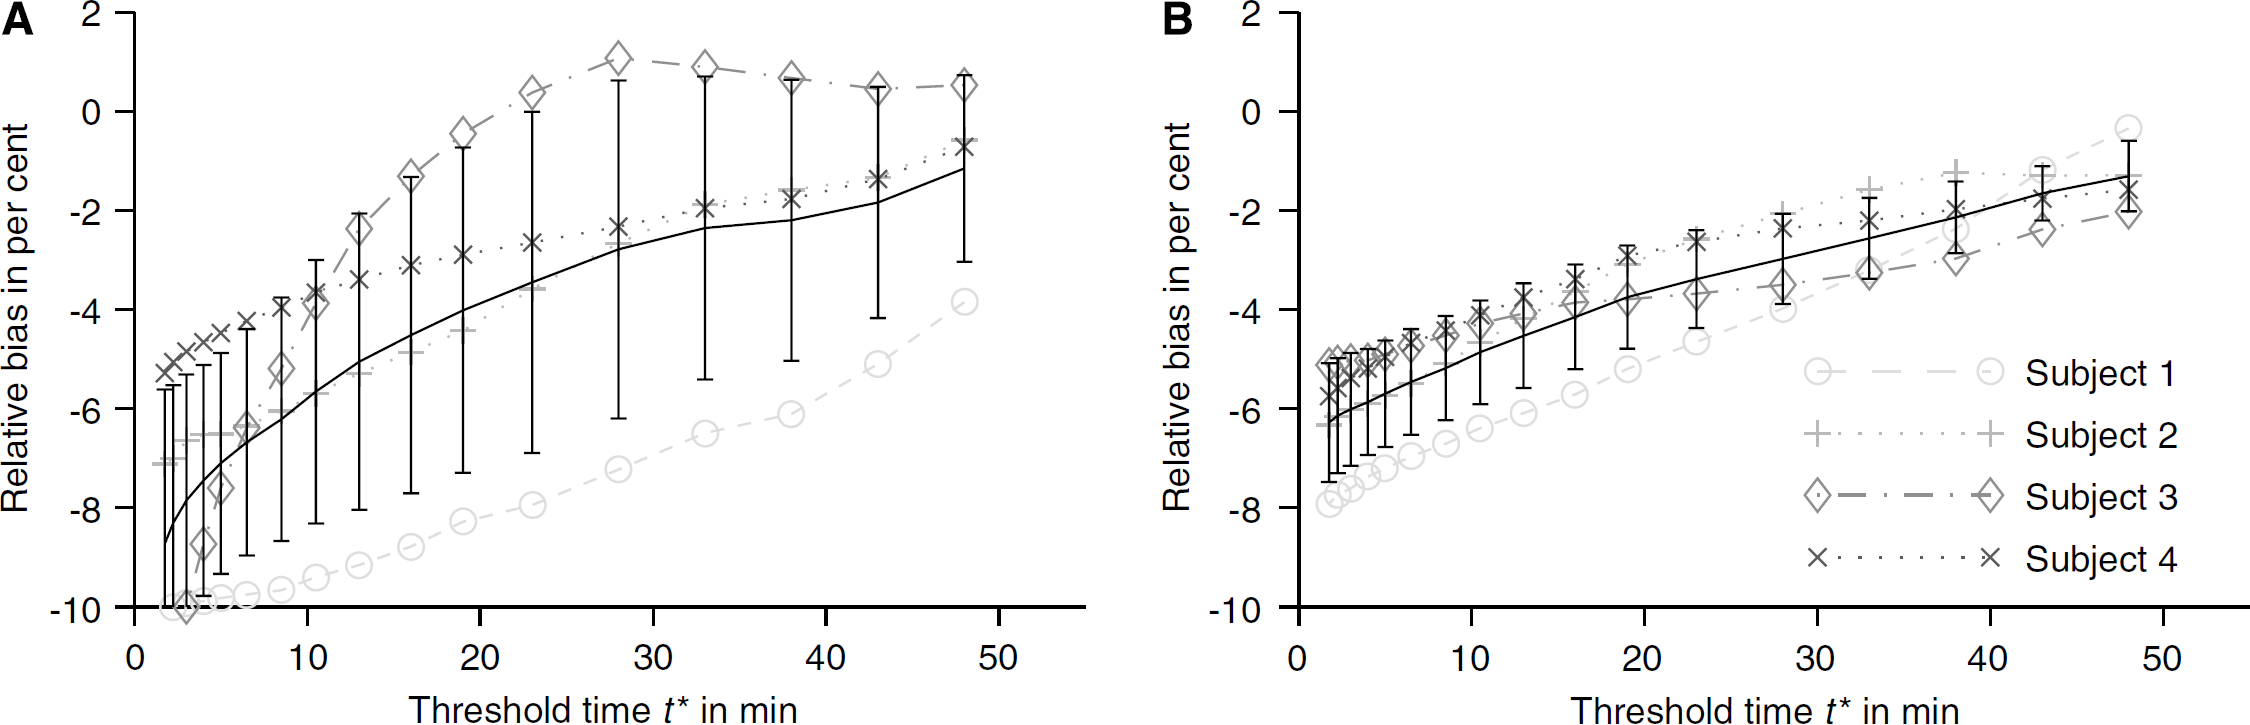
Relative bias of the estimated slopes from the Logan plot analysis as a function of the threshold time
Theoretically, two data points would be sufficient for a straight line. However, such fits with zero degrees of freedom would provide only parameter estimates, which are extremely sensitive to the noise in these two measurements that is a particular problem when these two points are obtained from the low count data of the last two frames of a 90–mins PET scan with a 11C-labelled compound. To calculate the relative bias of the estimated slope, the ‘true’ value of the Logan plot slope needs to be known, which means this value has, at the same time, to be an unbiased and low variance estimate of the slope. For the purpose of the calculations presented in Figure 4, the ‘true' Logan plot slope was obtained from the mean value of the slopes estimated from the last four, five, and six frames of the dynamic study, that is, fits with two, three, and four degrees of freedom as the model function has the two free parameters slope and intercept. This ‘true’ slope value corresponds to a 0% relative bias in Figure 4.
The underestimation of the slope is less severe under the blocked condition (Figure 4B) than under the baseline condition (Figure 4A). As the tracer kinetics in blood and tissue were faster after Citalopram infusion, the steady-state conditions required to achieve linearity of the Logan plot (Logan et al, 1990) were approached faster than after placebo infusion. In Figure 4, the Citalopram infusion also appears to have resulted in a reduction of the between-subject variability. The mean rate of change of the slope estimate with increasing threshold time
The results from all four subjects are given in Table 2. A negative bias of parameter estimates obtained with the Logan plot has been shown by Slifstein and Laruelle (2000); however, previous investigators reported that the Logan analysis estimates obtained from [11C]DASB regional tissue TACs, that is, data sets of good statistical quality in comparison with the voxel level, appeared to be largely unbiased (Ginovart et al, 2001; Frankle et al, 2006).
Parameter estimates from the graphical analysis of reversible binding of the regional tissue time—activity curves
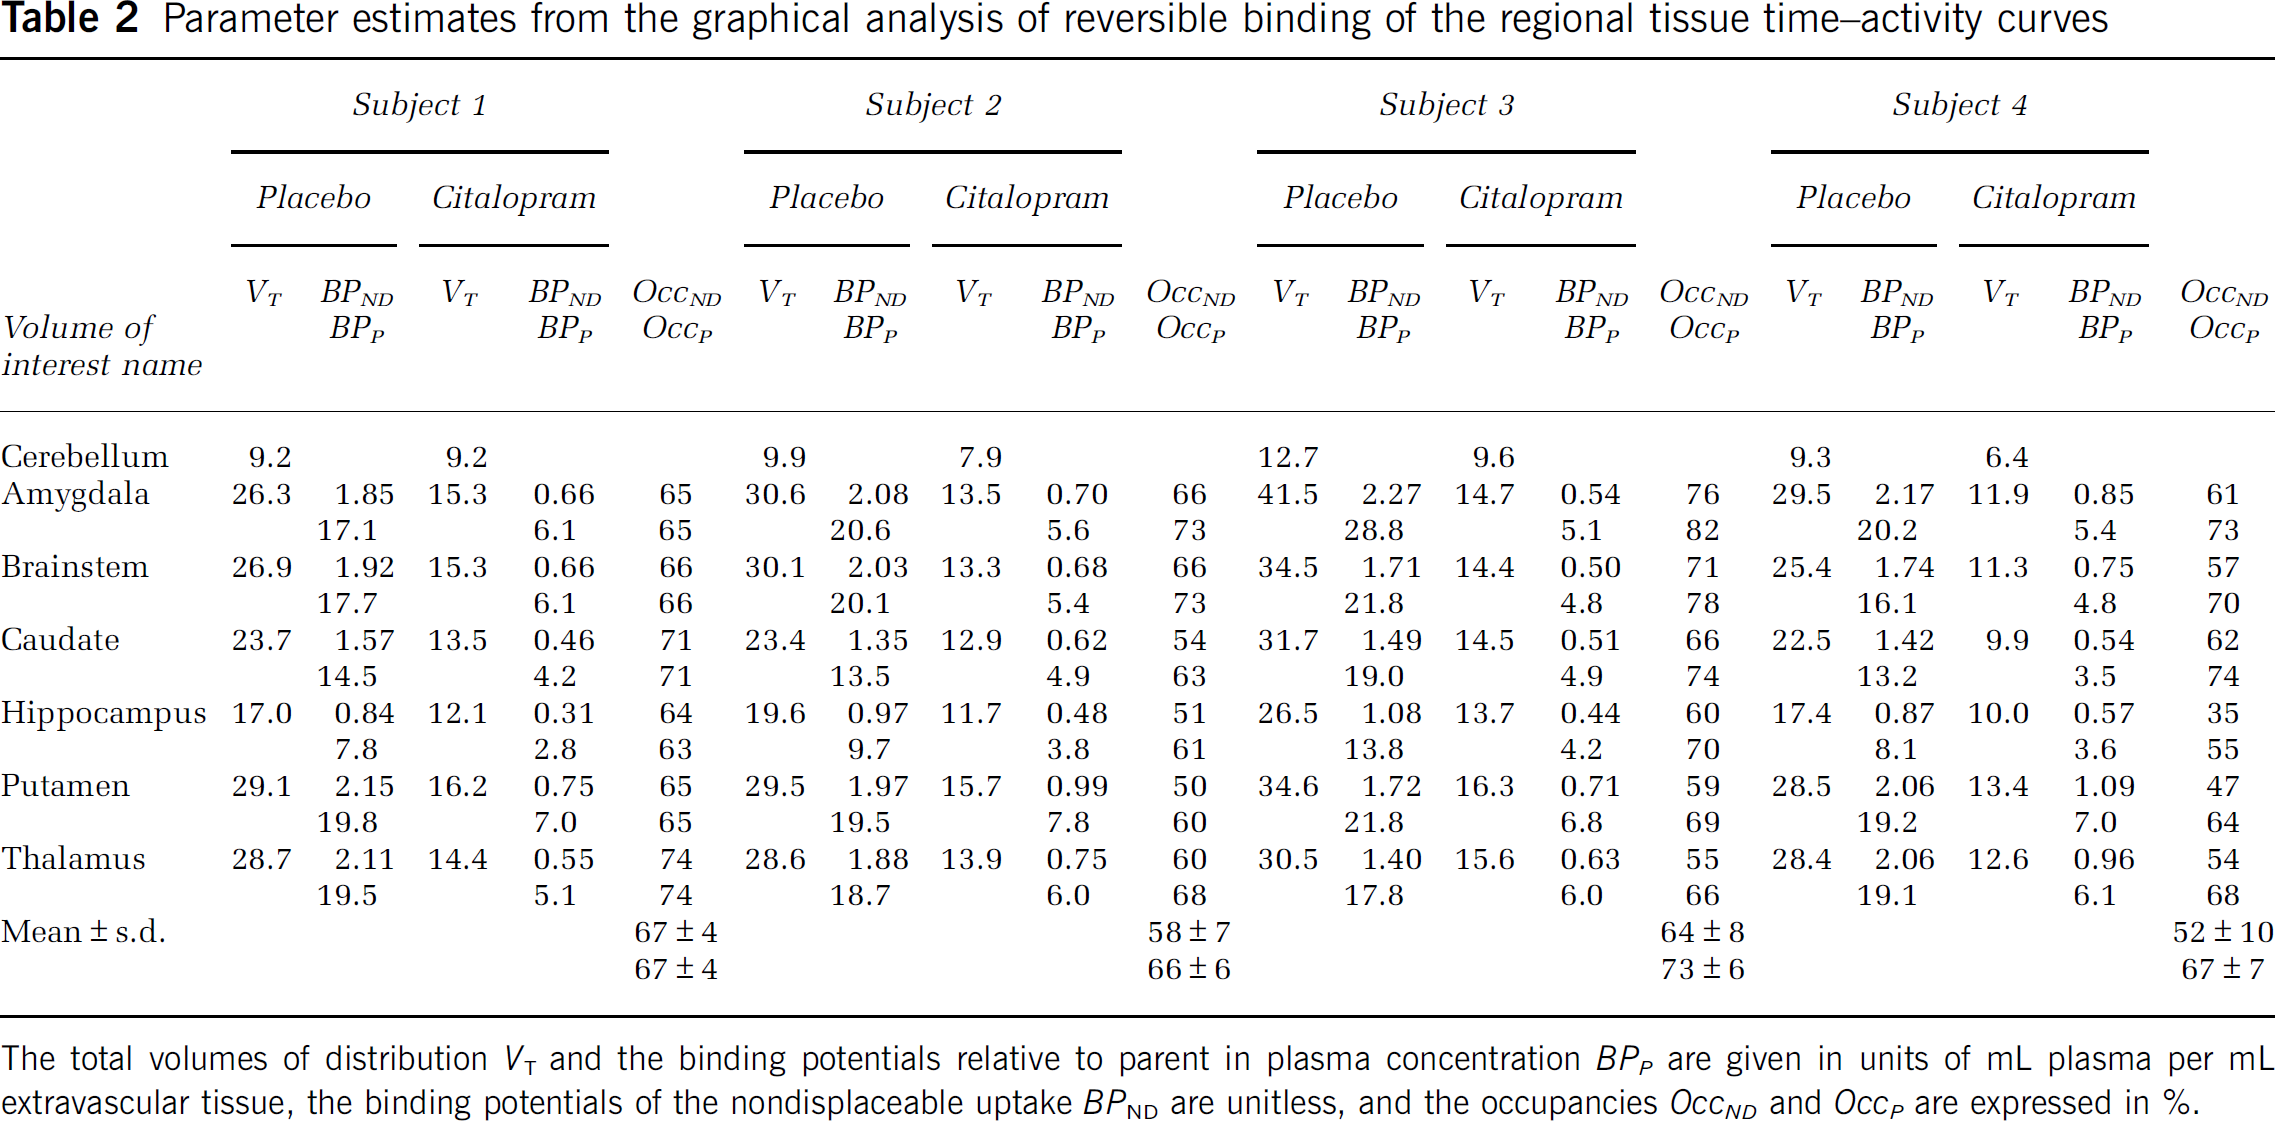
The total volumes of distribution VT and the binding potentials relative to parent in plasma concentration BPP are given in units of mL plasma per mL extravascular tissue, the binding potentials of the nondisplaceable uptake
The reduction of the cerebellar
The intrasubject variability of the occupancy
Two parametric images of the total volume of distribution
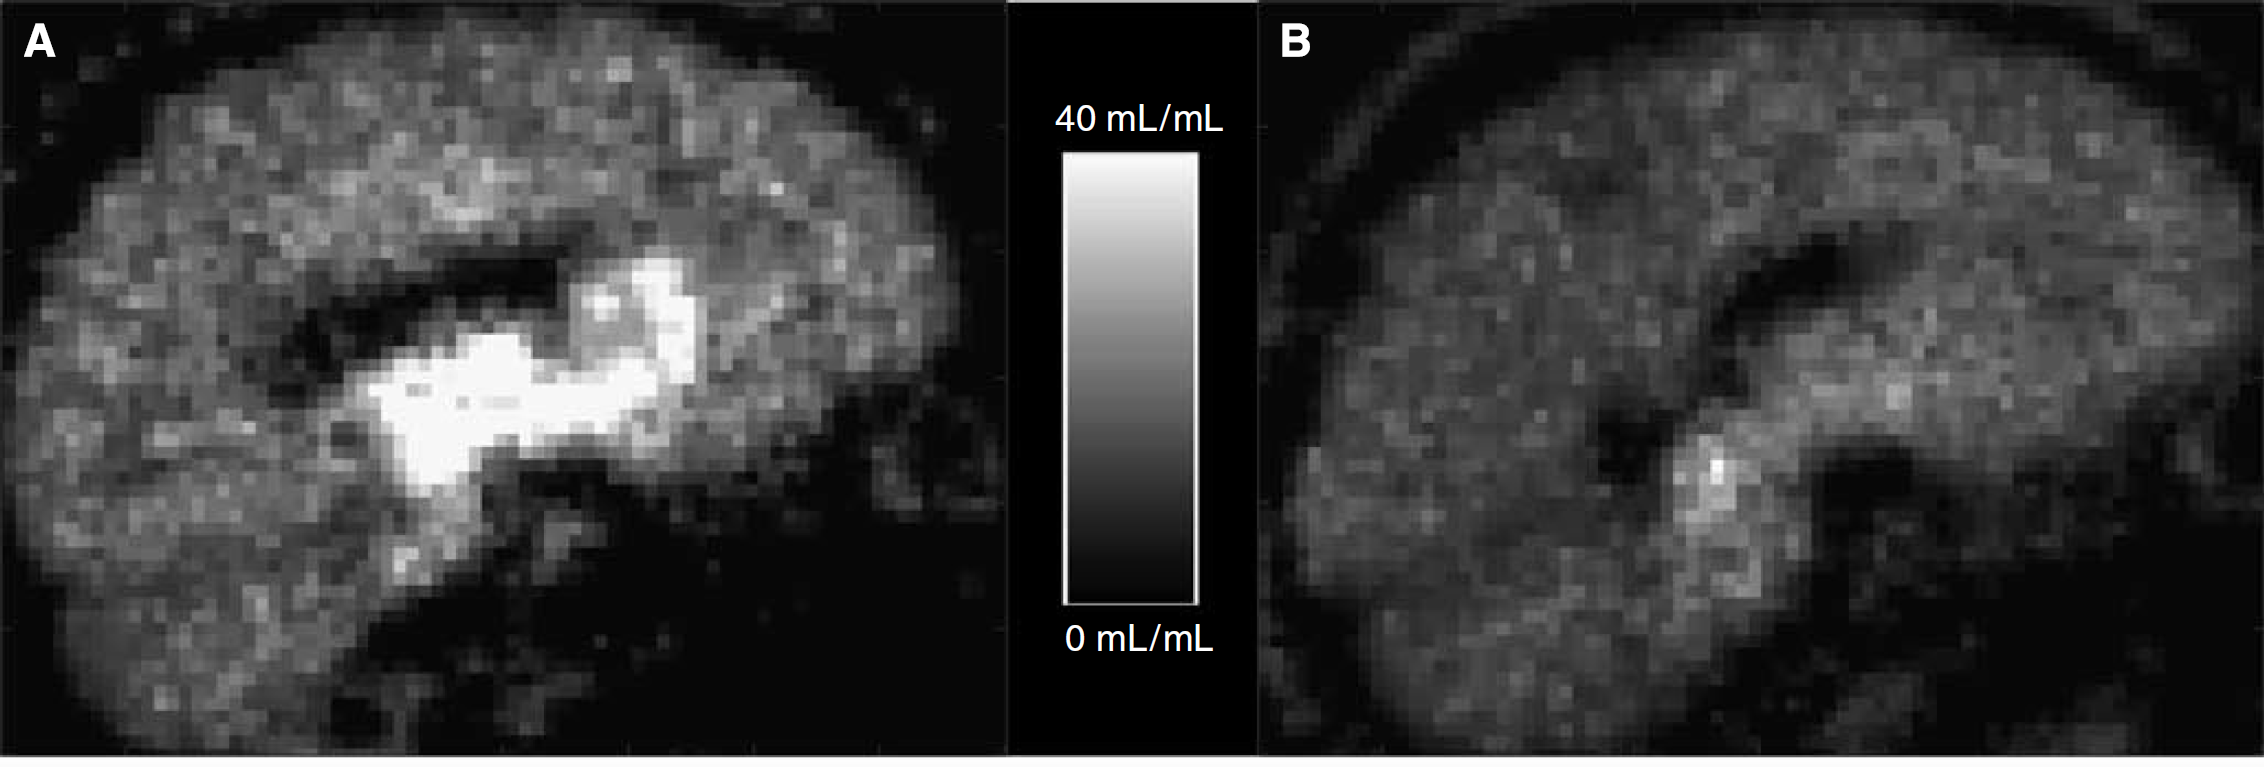
Oblique slice through parametric images of the total volume of distribution
Parameter estimates from sampling the parametric maps of
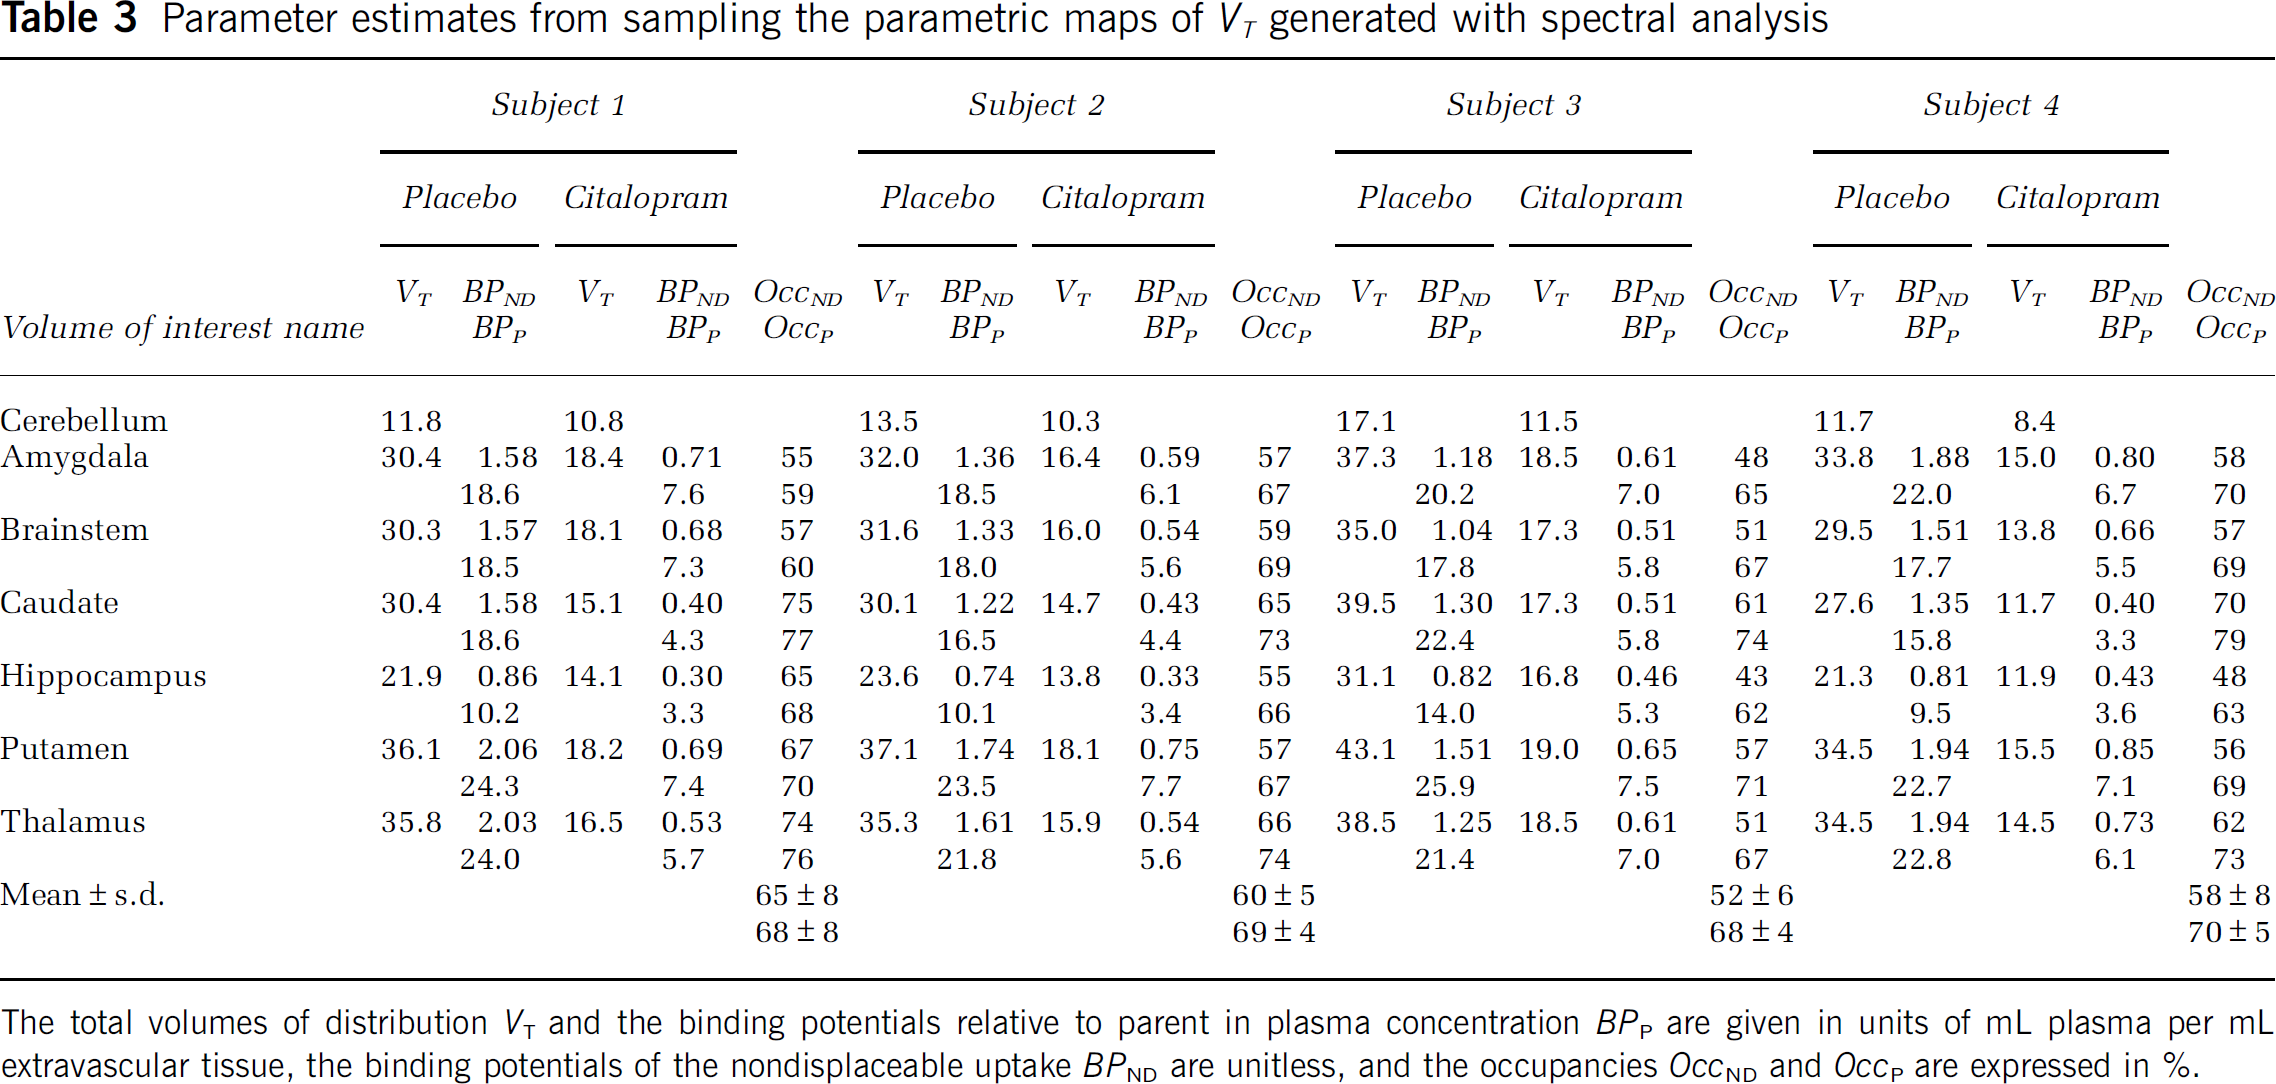
The total volumes of distribution
The mean occupancy
Discussion
A single intravenous infusion of 10 mg Citalopram 45 mins before administering an intravenous [11C]DASB bolus led to a substantial increase of the concentration of [11C]DASB in arterial plasma compared with a similar paradigm that employed a saline placebo infusion before the [11C]DASB PET scan. This appears to be a consequence of the blockade of the peripheral SERT-binding sites, for instance, in the lungs, the organ that was shown to have the highest uptake of [11C]DASB in the early phase of the PET scan (Lu et al, 2004; Bélanger et al, 2004; Tipre et al, 2004).
As a consequence of these quite dramatic changes to the time course of the [11C]DASB concentration in the plasma, the kinetics of the [11C]DASB binding in brain tissue was also affected in the sense that the peak activity of the regional TACs occurred earlier during the scanning period than in baseline condition. The total volumes of distribution
Despite these changes of the
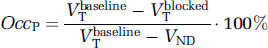
is identical with the equation provided by Lassen et al (1995) (equation 11) for the calculation of occupancy in studies without a receptor-free reference region.
In agreement with previous reports (Frankle et al, 2004; Frankle et al, 2006), VOIs with low SERT density (e.g., cortical areas) could not be reliably quantified with [11C]DASB (data not shown). Furthermore, the same two reports described difficulties in obtaining ‘good’ fits of the regional tissue TACs with reversible compartmental models (with either one tissue compartment/two rate constants or two tissue compartments/four rate constants) as indicated by a nonrandom distribution of the residuals (Frankle et al, 2004). Similar problems were also encountered in this study. A possible reason may be the violation of the assumption that the rate constants of the compartmental models are constant over time. The experimental paradigm of infusing Citalopram 45 mins before commencing the PET scan probably results in kinetic parameters changing with time. This is consistent with the observation that the rate constants
Malizia et al (1997) suggested investigating whether the prior blockade of the SERT sites in peripheral organs might be a useful strategy to increase the amount of radiotracer available for binding to the SERT sites in the brain, and, hence, improve the signal in brain imaging studies without administering more radioactivity. Selective serotonin reuptake inhibitors that are unable to cross the BBB appear to be the most promising candidates for such investigations.
The past years have seen continued efforts to develop radioligands that would enable quantification of the binding to the SERT in brain regions with low SERT density, which cannot be reliably assessed with [11C](+)McN5652 or [11C]DASB. As for other neuroreceptor systems, for instance the dopaminergic system where the quantification of the binding to extrastriatal D2/D3 receptors was enabled by the introduction of high-affinity radioligands such as [11C]FLB 457 (Asselin et al, 2007), the efforts appear to be directed towards an increase of the affinity of the putative radioligands for the SERT. However, the abundance of the SERT in many parts of the body outside the brain may prevent the success of these efforts to achieve reliable quantification of SERT binding in low SERT brain areas with high-affinity radioligands if they are not combined with measures to reduce, at the same time, the binding of the radioligands to peripheral SERT sites.
In summary, the mean SERT occupancy in the cohort of four subjects was estimated at 60% when calculated from binding potential estimates of the nondisplaceable binding
Footnotes
Acknowledgements
We gratefully acknowledge the excellent work of Safiye Osman with the bioanalysis and quality control teams. We thank Leonhard Schnorr and Debbie Richards for their expert technical support. Andy Blythe, Hope McDevitt, Stella Ahier, Andreanna Williams, and Ann Peers receive our thanks for their assistance in making the scans possible. Sabrina Fancy provided invaluable help in recruiting volunteers. We express our thanks to Dr Federico Turkheimer for his advice on statistical tests. A special thank goes to Dr Marie-Claude Asselin for her inspiration to develop the ![]() on the effect of specific binding in the reference region on the calculation of the occupancy.
on the effect of specific binding in the reference region on the calculation of the occupancy.
The authors have no conflict of interest and nothing to disclose in relation to the work presented here.
Appendix
In Asselin et al (2007), a mathematical derivation of the effect of specific binding in the reference tissue on the calculation of the occupancy was given. It showed that in this case, the apparent occupancy
where
Here, the effect of specific binding in the reference tissue on the calculation of the occupancy is derived when the occupancy
Expressing the binding potentials in terms of the total volume of distribution
again assuming that the volumes of distribution of the nondisplaceable uptake are the same between regions and conditions, that is,
If now the total volume of distribution in the reference region
Expanding nominator and denominator with
Now replacing
Again making use of the assumption that the occupancy in all brain regions including the reference region is the same, that is,
gives the following relationship between apparent and true occupancy
This means that if the occupancy is derived from the binding potentials relative to the parent in plasma concentration