
Abstract
[11C](R)-PK11195 is a marker of activated microglia, which can be used to measure inflammation in neurologic disorders. The purpose of the present study was to define the optimal reference tissue model based on a comparison with a validated plasma input model and using clinical studies and Monte Carlo simulations. Accuracy and reproducibility of reference tissue models were evaluated using Monte Carlo simulations. The effects of noise and variation in specific binding, nonspecific binding and blood volume were evaluated. Dynamic positron emission tomography scans were performed on 13 subjects, and radioactivity in arterial blood was monitored online. In addition, blood samples were taken to generate a metabolite corrected plasma input function. Both a (validated) two-tissue reversible compartment model with K1/k2 fixed to whole cortex and various reference tissue models were fitted to the data. Finally, a simplified reference tissue model (SRTM) corrected for nonspecific binding using plasma input data (SRTMpl_corr) was investigated. Correlations between reference tissue models (including SRTMpl_corr) and the plasma input model were calculated. Monte Carlo simulations indicated that low-specific binding results in decreased accuracy and reproducibility. In this respect, the SRTM and SRTMpl_corr performed relatively well. Varying blood volume had no effect on performance. In the clinical evaluation, SRTMpl_corr and SRTM had the highest correlations with the plasma input model (R2 = 0.82 and 0.78, respectively). SRTMpl_corr is optimal when an arterial plasma input curve is available. Simplified reference tissue model is the best alternative when no plasma input is available.
Keywords
Introduction
Carbon-11 labeled (R)-PK11195 ((R)-1-(2-chlorophenyl)-N-[11C]methyl-N-(1-methylpropyl)-3-isoquinoline carboxamide) is a ligand for the peripheral benzodiazepine receptor. In the brain, this receptor is mainly expressed on activated microglia (Banati et al, 1997). Both [11C](R)-PK11195 and [11C]PK11195 have been used as positron emmision tomography (PET) tracers to study activated microglia in various neurologic disorders. It has been used to study stroke (Ramsay et al, 1992; Pappata et al, 2000; Gerhard et al, 2000, 2005a), Alzheimer's disease (Groom et al, 1995; Cagnin et al, 2001a; Versijpt et al, 2003), multiple sclerosis (Banati et al, 2000; Debruyne et al, 2002, 2003; Versijpt et al, 2005) and various other diseases (Pappata et al, 1991; Banati et al, 1999, 2001; Goerres et al, 2001; Cagnin et al, 2001b, 2004; Cicchetti et al, 2002; Gerhard et al, 2003, 2004, 2005b; Turner et al, 2004, 2005; Venneti et al, 2004; Henkel et al, 2004; Ouchi et al, 2005). Most studies have used a reference tissue approach to quantify binding, either by applying the simplified reference tissue model (SRTM) (Lammertsma and Hume, 1996) or by using uptake normalized to a reference region. The use of a reference tissue approach, however, has not been validated for [11C](R)-PK11195. This validation requires comparison with a plasma input model. Recently, we have shown that a two-tissue reversible model with fixed K1/k2 is optimal for [11C](R)-PK11195 studies using a plasma input function (Kropholler et al, 2005).
The purpose of the present study was to determine the optimal reference tissue model by comparing various reference tissue models with this plasma input model.
Materials and methods
Overview of Kinetic Models
In total, nine models, in which a reference tissue was used, were evaluated. The main characteristics of the models are shown in Table 1. A more detailed description of these models is given in Appendix A. Five of these models were true reference tissue models, in that the reference tissue curve was used as the input function. These models were:
Overview of the various reference tissue models
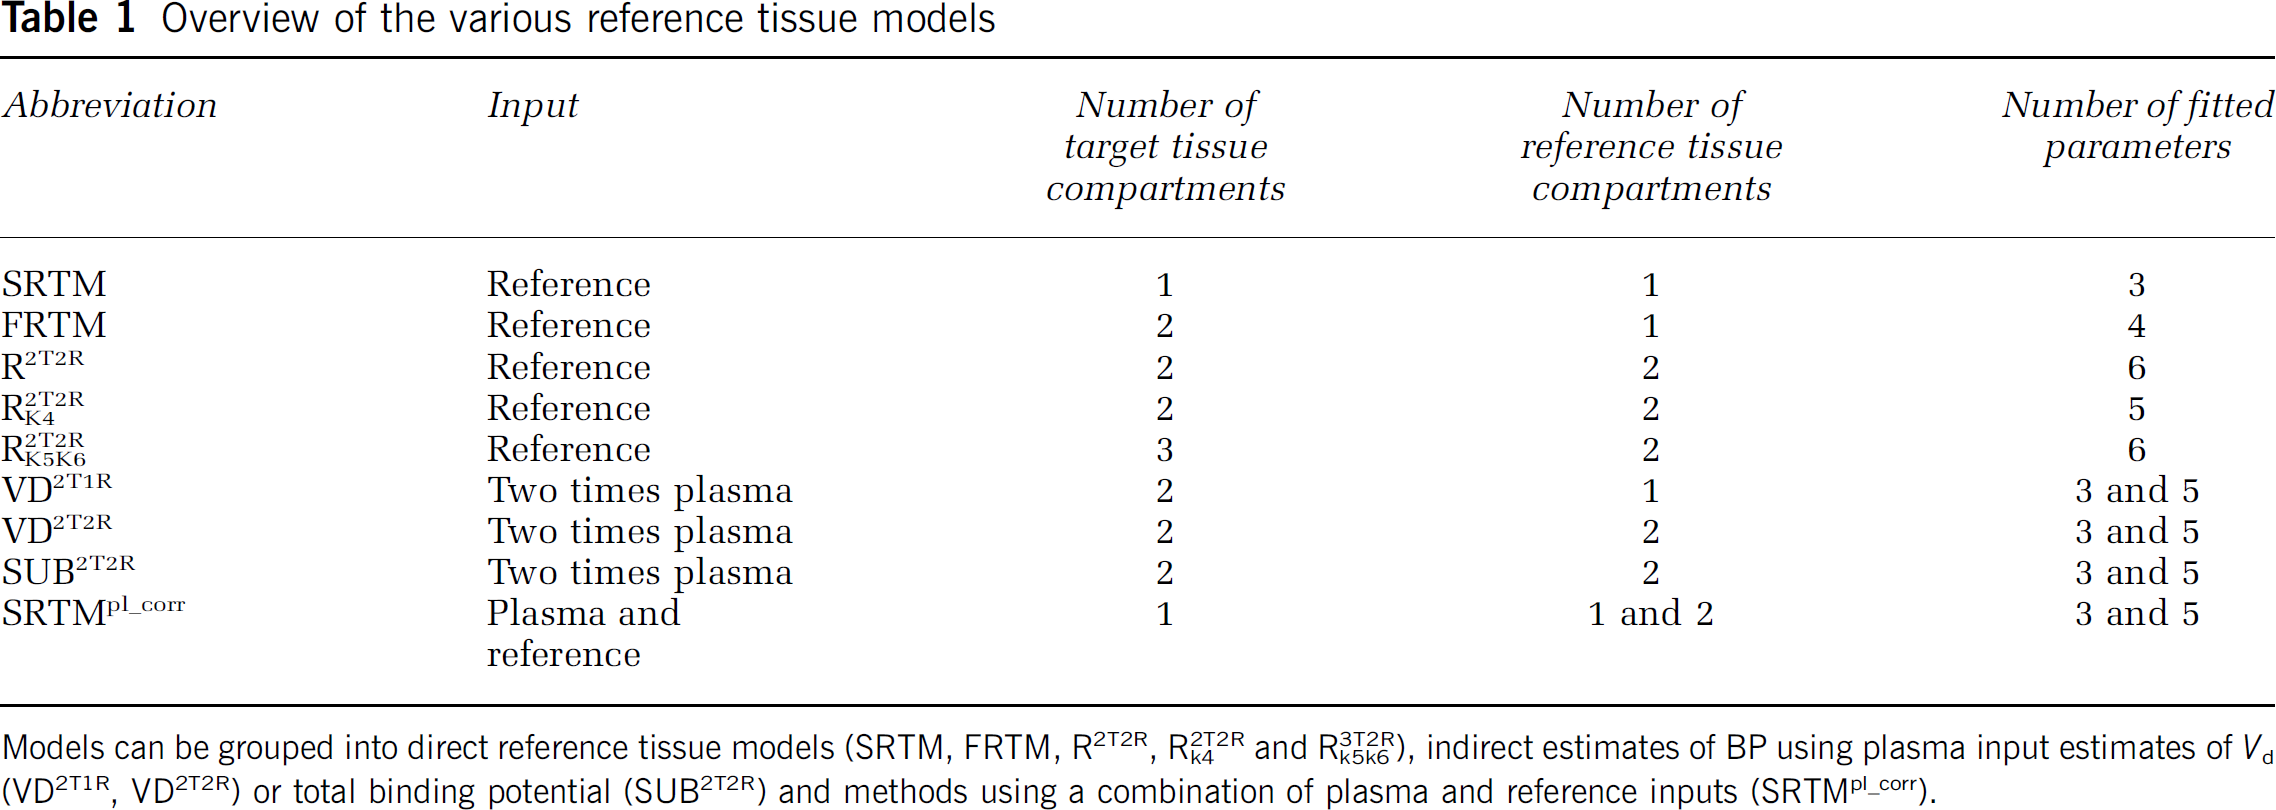
Models can be grouped into direct reference tissue models (SRTM, FRTM, R2T2R, R2T2Rk4 and R3T2Rk5k6), indirect estimates of BP using plasma input estimates of Vd (VD2T1R, VD2T2R) or total binding potential (SUB2T2R) and methods using a combination of plasma and reference inputs (SRTMpl_corr).
SRTM (Lammertsma and Hume, 1996).
Full reference tissue model (FRTM) (Hume et al, 1992).
Reference tissue model with two target and two reference tissue compartments (R2T2R).
As R2T2R, but with the same k4 for target and reference tissues, that is, k4 = k'4 (R2T2Rk4).
Reference tissue model with three target and two reference tissue compartments, and with the same k5 and k6 for both tissues, that is, k5 = k'5 and k6 = k'6 (R3T2Rk5k6)
In two models (specific) binding potential (BPsp) was obtained indirectly through BPsp = (Vd-Vd)/V'd, in which the volumes of distribution for target (Vd) and reference (V'd) tissues were obtained from plasma input fits:
Indirect plasma input model with two target and one reference tissue compartments (VD2T1R).
Indirect plasma input model with two target and two reference tissue compartments (VD2T2R) (Lammertsma et al, 1996a).
In one model BPsp was obtained by subtracting total binding potential of the reference (nonspecific) from that of the target (specific + nonspecific) tissue. These total binding potentials were obtained from plasma input fits:
Plasma input model with two target and two reference tissue compartments using subtraction of binding potentials (SUB2T2R).
In the final model BPsp as obtained from SRTM (BPSRTM) was corrected for the contribution of nonspecific binding potential (BPns), according to BPsp = BPSRTM (1 + BPns). Here, BPns was obtained from a plasma input fit of the reference tissue:
Simplified reference tissue model corrected for nonspecific binding using a plasma input model with two compartments for the reference tissue (SRTMp1_corr).
Two plasma input models were used in this study. One model was used for comparison with the reference tissue models. This model was a two-tissue reversible compartment model with the K1/k2 ratio fixed to the value obtained for whole cortex. In a previous study, it was demonstrated that this is the optimal plasma input model for [11C](R)-PK11195 studies (Kropholler et al, 2005). The other plasma input model was a three-tissue compartment model with different compartments for specific and nonspecific binding (Gunn et al, 2001) and was used to generate tissue time-activity curves (TACs) for the Monte Carlo simulations.
Monte Carlo Simulations
A typical plasma [11C](R)-PK11195 TAC was used as input function for the Monte Carlo simulations. Tissue TACs were generated using the three-tissue compartment model. Values for the various model parameters were based on clinical data: K1 = 0.05 mlmins−1ml−1, k2 = 0.15 mins−1 k4 = 0.2 mins−1 BPsp = 0.5, k6 = 0.04 mins−1, BPns = 1.5 and blood volume Vb = 7%. Uniform Gaussian noise was used with a coefficient of variation (COV) of 7.5%. Simulations were performed with parameters fixed at the correct value and with parameters varied over a physiologic range. Specific binding potential (BPsp) was varied between 0 and the maximum value of 1 observed in clinical data. Ranges for BPns and Vb were set at ± 10% and ± 16%, respectively, based on previously published subject data (Kropholler et al, 2005). Noise was varied between 0% and 10% COV. When BPsp, BPns or Vb was varied, each reported result was based on 500 simulations. When parameters were fixed at the correct value, 3000 simulations were performed.
Accuracy and reproducibility of BPsp were calculated with accuracy expressed as percentage bias and reproducibility as the COV.
Clinical Evaluation
Subjects: Five subjects with traumatic brain injury (five males, mean age±s.d. = 39 ±17 years), scanned 28±2 weeks after trauma, and eight elderly healthy subjects (eight males, age 67±8 years) were included in the study. These two subject groups were selected in order to be able to evaluate the various models over the full range of microglia activation seen in clinical practice. The study was approved by the medical ethics committee of the VU University Medical Centre. All subjects gave informed consent before inclusion. In the present study, clinical data were used only for model comparison. Clinical interpretation of the results in these subjects is beyond the scope of the present study and will be reported elsewhere.
Scanning protocol: Studies were performed in 3D acquisition mode using an ECAT Exact HR+ scanner (CTI/Siemens, Knoxville, TN, USA). Characteristics of this scanner have been described elsewhere (Brix et al, 1997; Adam et al, 1997). Before tracer administration, a 10 mins transmission scan was performed, which was used to correct the subsequent emission scans for attenuation. First, a [15O]H2O emission scan was performed, but this scan was not used in the present study. Next, A 1-h dynamic [11C](R)-PK11195 emission scan was performed. Time frames used for the [11C](R)-PK11195 scan were 1 × 30, 1 × 15,1 × 5,1 × 10, 2 × 15, 2 × 30, 3 × 60, 4 × 150, 5 × 300 and 2 × 600secs. The first frame was used to correct for possible background radioactivity resulting from the previous [15O]H2O scan. 328±95 MBq [11C](R)-PK11195 with a specific activity of 83±23 GBq/μmol at end of synthesis was administered as a bolus simultaneously with the start of the second frame. A neuro-insert (CTI/Siemens, Knoxville, TN, USA) was used to reduce the contribution of scattered photons. Arterial blood was withdrawn continuously using an online blood-sampling device described previously (Boellaard et al, 2001). At 3, 5, 10, 20, 30, 40 and 60 mins after tracer injection blood sampling was interrupted briefly for withdrawal of manual samples, followed by flushing of the arterial line with heparinised saline. Plasma and whole-blood activity were measured and metabolite levels in plasma were determined using HPLC as described previously (Greuter et al, 2004).
In addition, T1 weighted magnetic resonance imaging (MRI) scans were acquired using a 1 T IMPACT scanner (Siemens Medical Solutions, Erlangen, Germany).
Image reconstructions: All emission scans were normalized and corrected for attenuation, randoms, dead time, scatter and decay. Emission scans were reconstructed using filtered backprojection and a Hanning filter with a cutoff of 0.5 times the Nyquist frequency, resulting in a spatial resolution of approximately 7 mm full-width at half-maximum at the center of the field of view. A zoom factor of two and a matrix size of 256 × 256 × 63 were used resulting in a voxel size of 1.2 × 1.2 × 2.4 mm3.
Image analysis: The skull was removed from the MRI scans using a brain extraction tool (Smith, 2002), which is part of the FMRIB software library (www.fmrib.ox.ac.uk/fsl, Image analysis group, Oxford, UK). Deskulled brain and corresponding PET scans were aligned using a mutual information algorithm included in the image registration package MIRIT (Maes et al, 1997; West et al, 1997). Correct alignment was checked visually.
For trauma patients, a voxel-by-voxel Logan plot (Logan, 2000) was performed to obtain an initial overview of regions with high and low binding. Next, these Vd images were used to draw regions of interest (ROIs). The thalamus was found to have high Vd and was used as target ROI. In this group, a large cortical region with low Vd was used as a reference tissue ROI. For patients suffering from neurotrauma activation of microglia and thus elevated [11C](R)-PK11195 binding might have been present in the cerebellum as well. By defining a ROI on initial estimates of [11C](R)-PK11195 binding it was attempted to obtain a reference tissue curve with minimal or no increased [11C](R)-PK11195 binding. Moreover, patient head motion during scanning could not be avoided for this specific patient group and by defining a large cortical ROI with low uptake, the effects of patient motion on the quality of the reference tissue TAC was further minimized. Note that even with this strategy, it is not guaranteed that the reference tissue was free of activated microglia, but binding in these reference tissues turned out to be sufficiently low to study relative increases of [11C](R)-PK11195 binding in the thalamus and it did not systematically effect the (inter-)comparison of reference tissue models against plasma input data.
For the control group of healthy elderly subjects, there is increased microglia activation in the thalamus (Cagnin et al, 2001a). This region has been drawn as target ROI. The cerebellum was used as a reference tissue region for elderly subjects, assuming low or no specific binding in this area, as was also performed by other investigators (Gerhard et al, 2005a), although use of the cerebellum as reference is still a matter of debate.
Kinetic analysis: Kinetic modeling was performed using dedicated software developed within matlab 5.3 (The Mathworks, Natick, MA, USA). A metabolite corrected plasma input function was generated as described previously (Kropholler et al, 2005). Separate input functions for whole blood (to estimate Vb) and metabolite corrected plasma concentrations were used in all (plasma input) fits. Delay between injection and arrival of the [11C](R)-PK11195 bolus was estimated by fitting a reversible two-tissue compartment model, including Vb and delay to the subjects' whole-cortex TAC. Delay was then fixed to this value for all other ROIs.
Target ROIs were fitted to the various reference tissue based models. In addition, ROIs were fitted to the two-tissue reversible plasma input compartment model with K1/k2 fixed to the cortical value. Correlations between this plasma input model and the various reference tissue based models were evaluated.
Results
Monte Carlo Simulations
Biases of the reference tissue models, when all parameters were set to the true values and at 0% noise level, are shown in Table 2. In addition, bias and COV for 10% noise level are given. Several models showed considerable bias, notably SRTM, FRTM and VD2T2R, and for the 10% noise level R2T2R and R3T2Rk5k6. Coefficient of variation was very high for models R2T2R, VD2T2R and SUB2T2R.
Bias and coefficient of variation (COV) for the various models at 0 and 10% (COV) noise levels
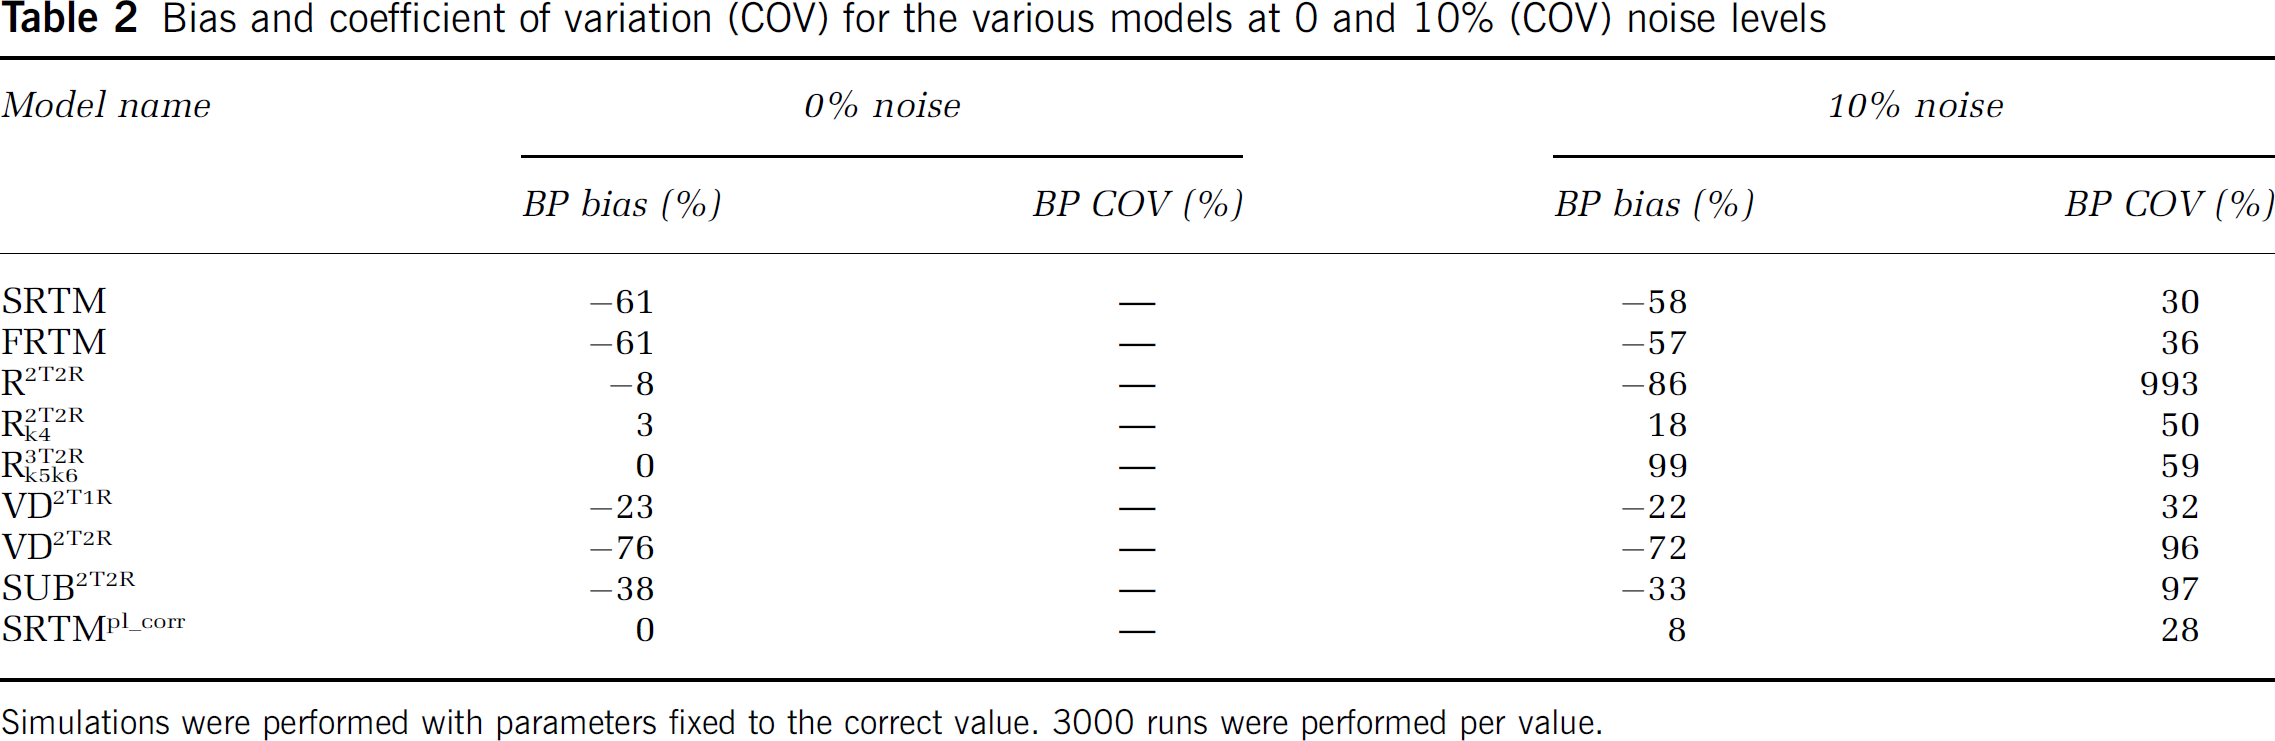
Simulations were performed with parameters fixed to the correct value. 3000 runs were performed per value.
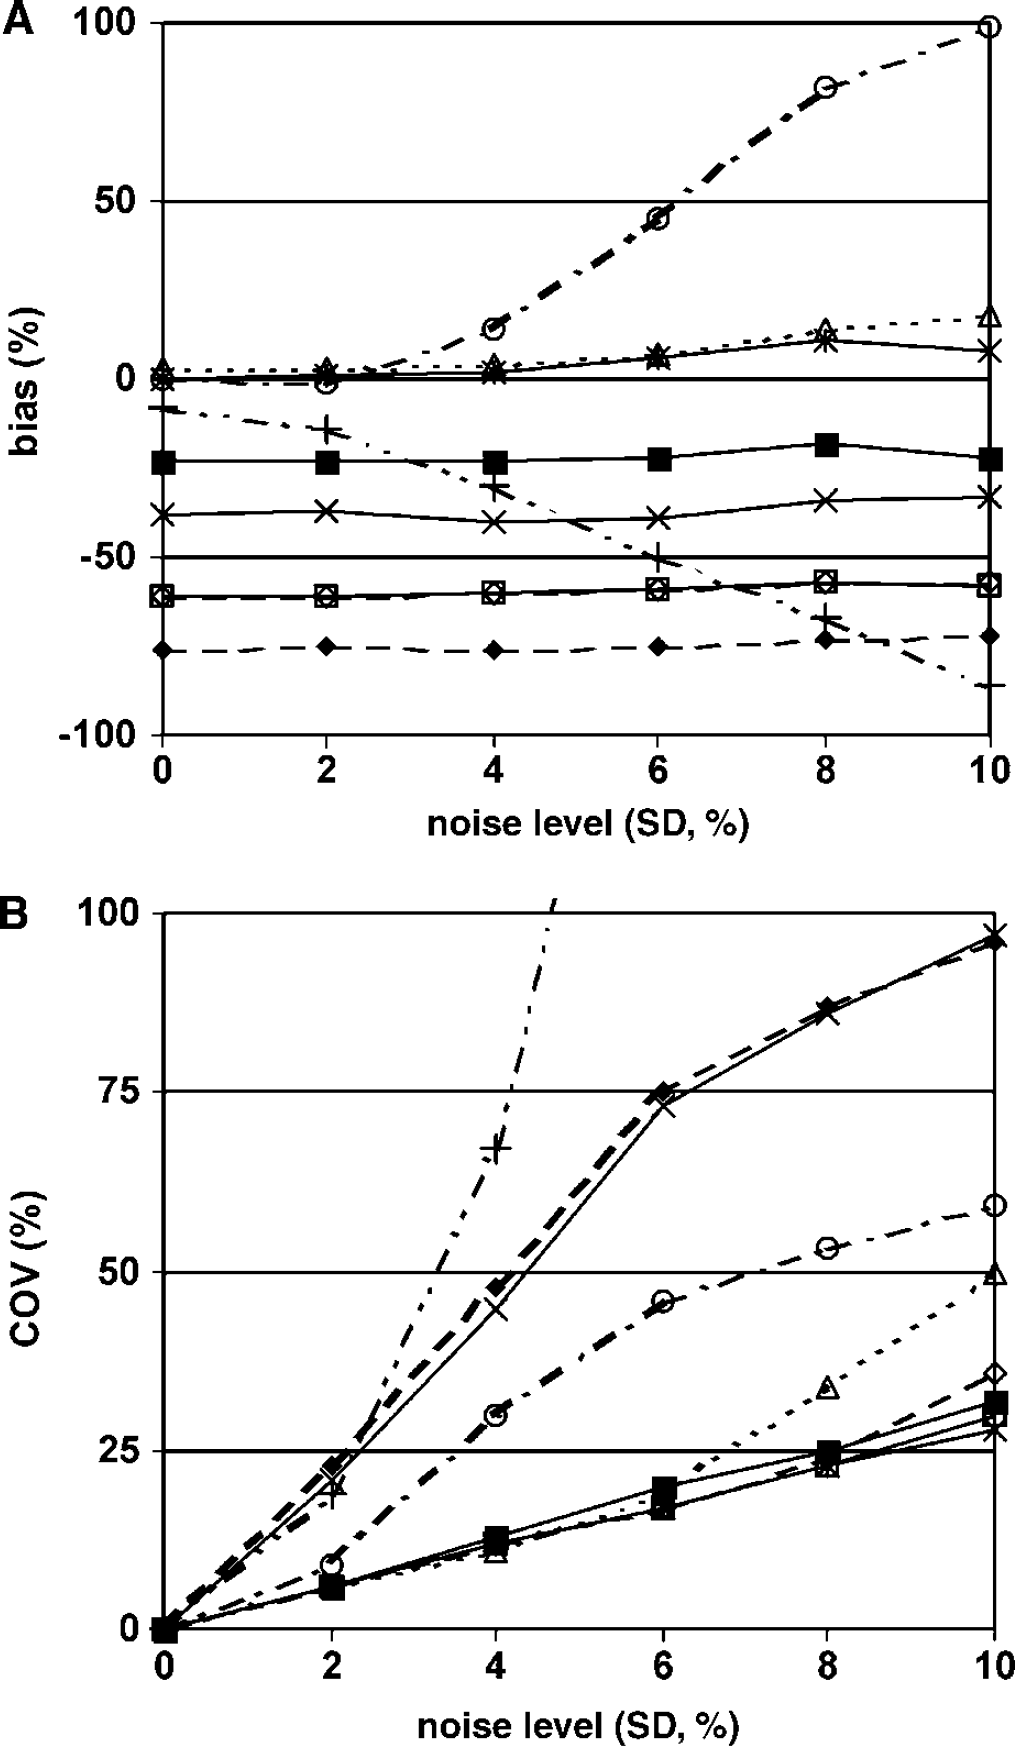
All models showed relatively constant BPsp with varying noise levels, except for R2T2R and R3T2Rk2k6, which both showed large (~ 100%) variation in bias (Figure 1A). Coefficient of variation increased with increasing noise level, especially for models R2T2R, VD2T2R and SUB2T2R (Figure 1B). Models SRTM, FRTM, R2T2Rk4, SRTMp1_corr all performed well with a maximum COV between 25 and 30%.
Bias (
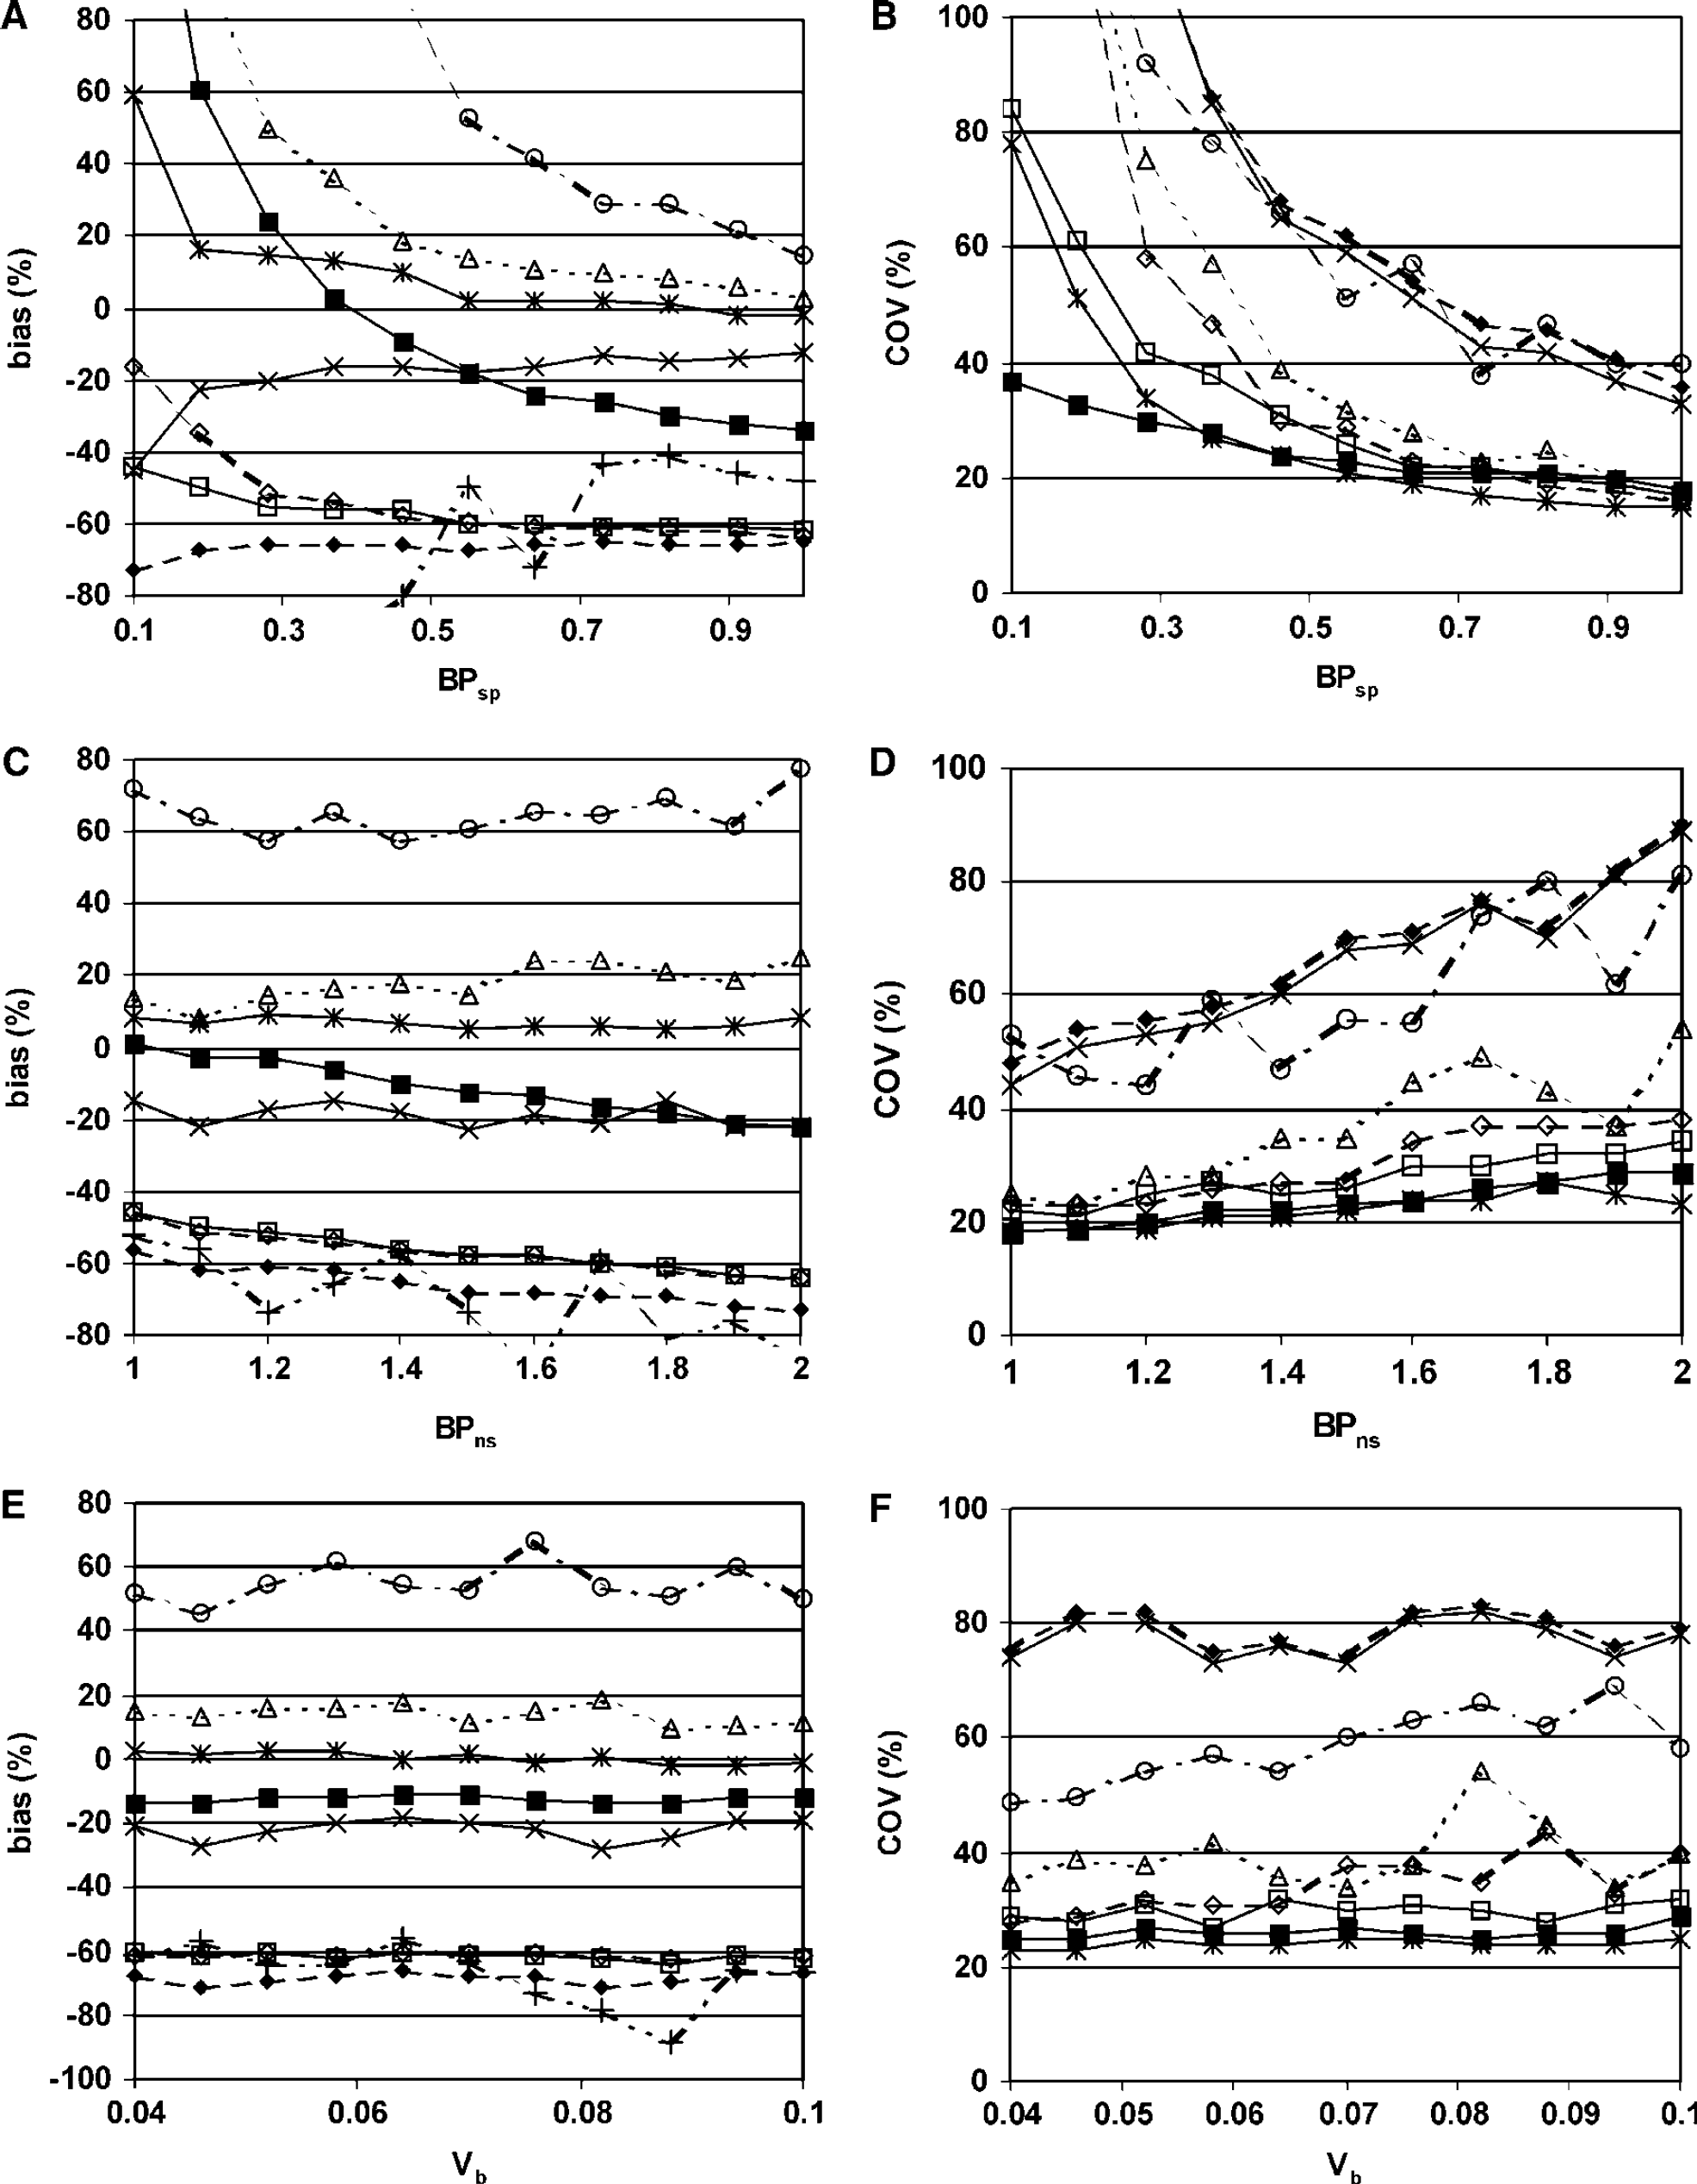
All models except SRTM and VD2T2R showed large variations in bias when BPsp became small (Figure 2A). This was especially the case for R3T2Rk5k6, R2T2Rk5k6 and VD2T1R with biases larger than 100%. Coefficient of variation also became large in the case of small BPsp (Figure 2B). Here, VD2T1R performed best with a COV of 37% at low BPsp, while COV became approximately 80% for SRTM and SRTMpl_corr. For all other models, COV became much larger than 100%. Coefficient of variation for R3T2Rk5k6 is outside the scale and therefore not visible in Figure 2B.
Effects of variation in specific binding (
Models R2T2Rk4, SUB2T2R and SRTMpl_corr had little or no bias with varying BPns (Figure 2C). All other models showed considerable bias. For all models, COV increases with increasing BPns (Figure 2D). The increase was especially large for R2T2R (not visible, COV > 100%), R3T2Rk5k6, VD2T2R and SUB2T2R and smallest for SRTMpl_corr.
Varying Vb did not change bias of the models (Figure 2E). In addition, increasing Vb did not result in a change in observed COV, except for R3T2Rk5k6 (Figure 2F).
Clinical Evaluation
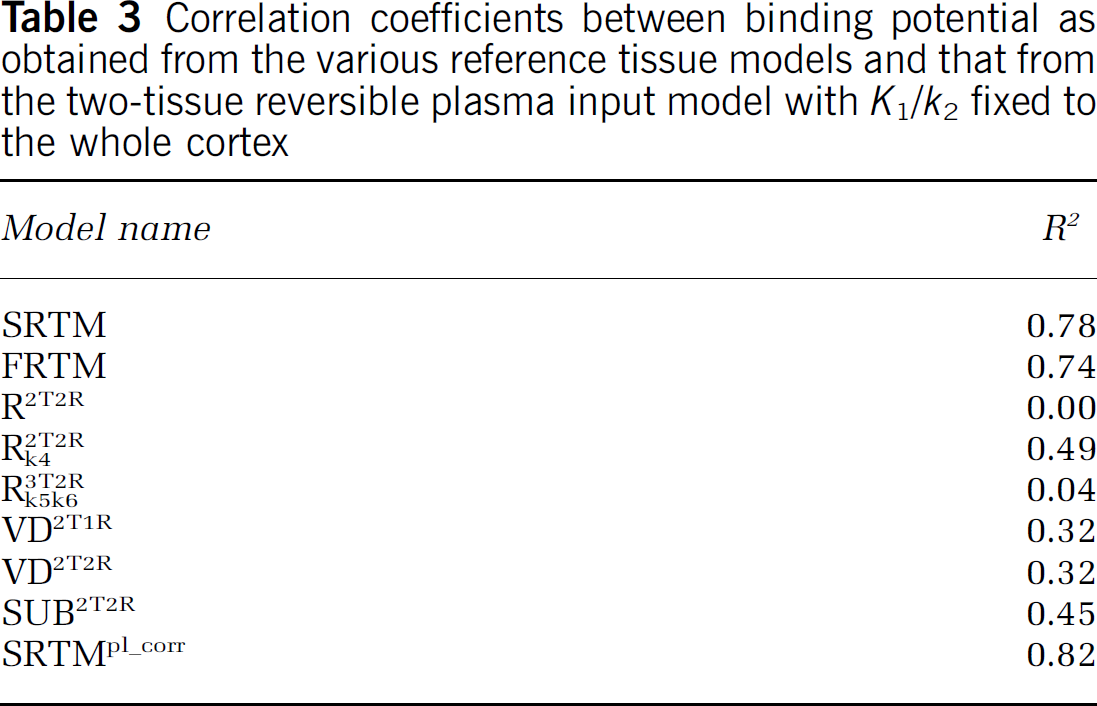
Occasionally, some of the reference tissue models provided unrealistic BPsp. These poor fits mainly occurred for models with high number of fit parameters. These results were excluded from the analysis. For reference models with a low number of fit parameters, such as SRTM and SRTMpl_corr, no poor fits were observed. Correlation coefficients of the regressions between the two-tissue reversible plasma input model with K1/k2 fixed to whole cortex and the reference tissue models are shown in Table 3. Scatter plots between plasma input and reference tissue BP for the best reference tissue models are shown in Figure 3. Note that the errors in SRTMpl_corr were calculated assuming no correlation between BPsp and BPns, which is strictly not valid. The SRTMpl_corr model performs best, followed by SRTM and FRTM. The indirect methods (VD2T1R and VD2T2R) and especially the direct reference tissue models R3T2Rk5k6 and R2T2R did not perform very well.
Correlation coefficients between binding potential as obtained from the various reference tissue models and that from the two-tissue reversible plasma input model with K1/k2 fixed to the whole cortex
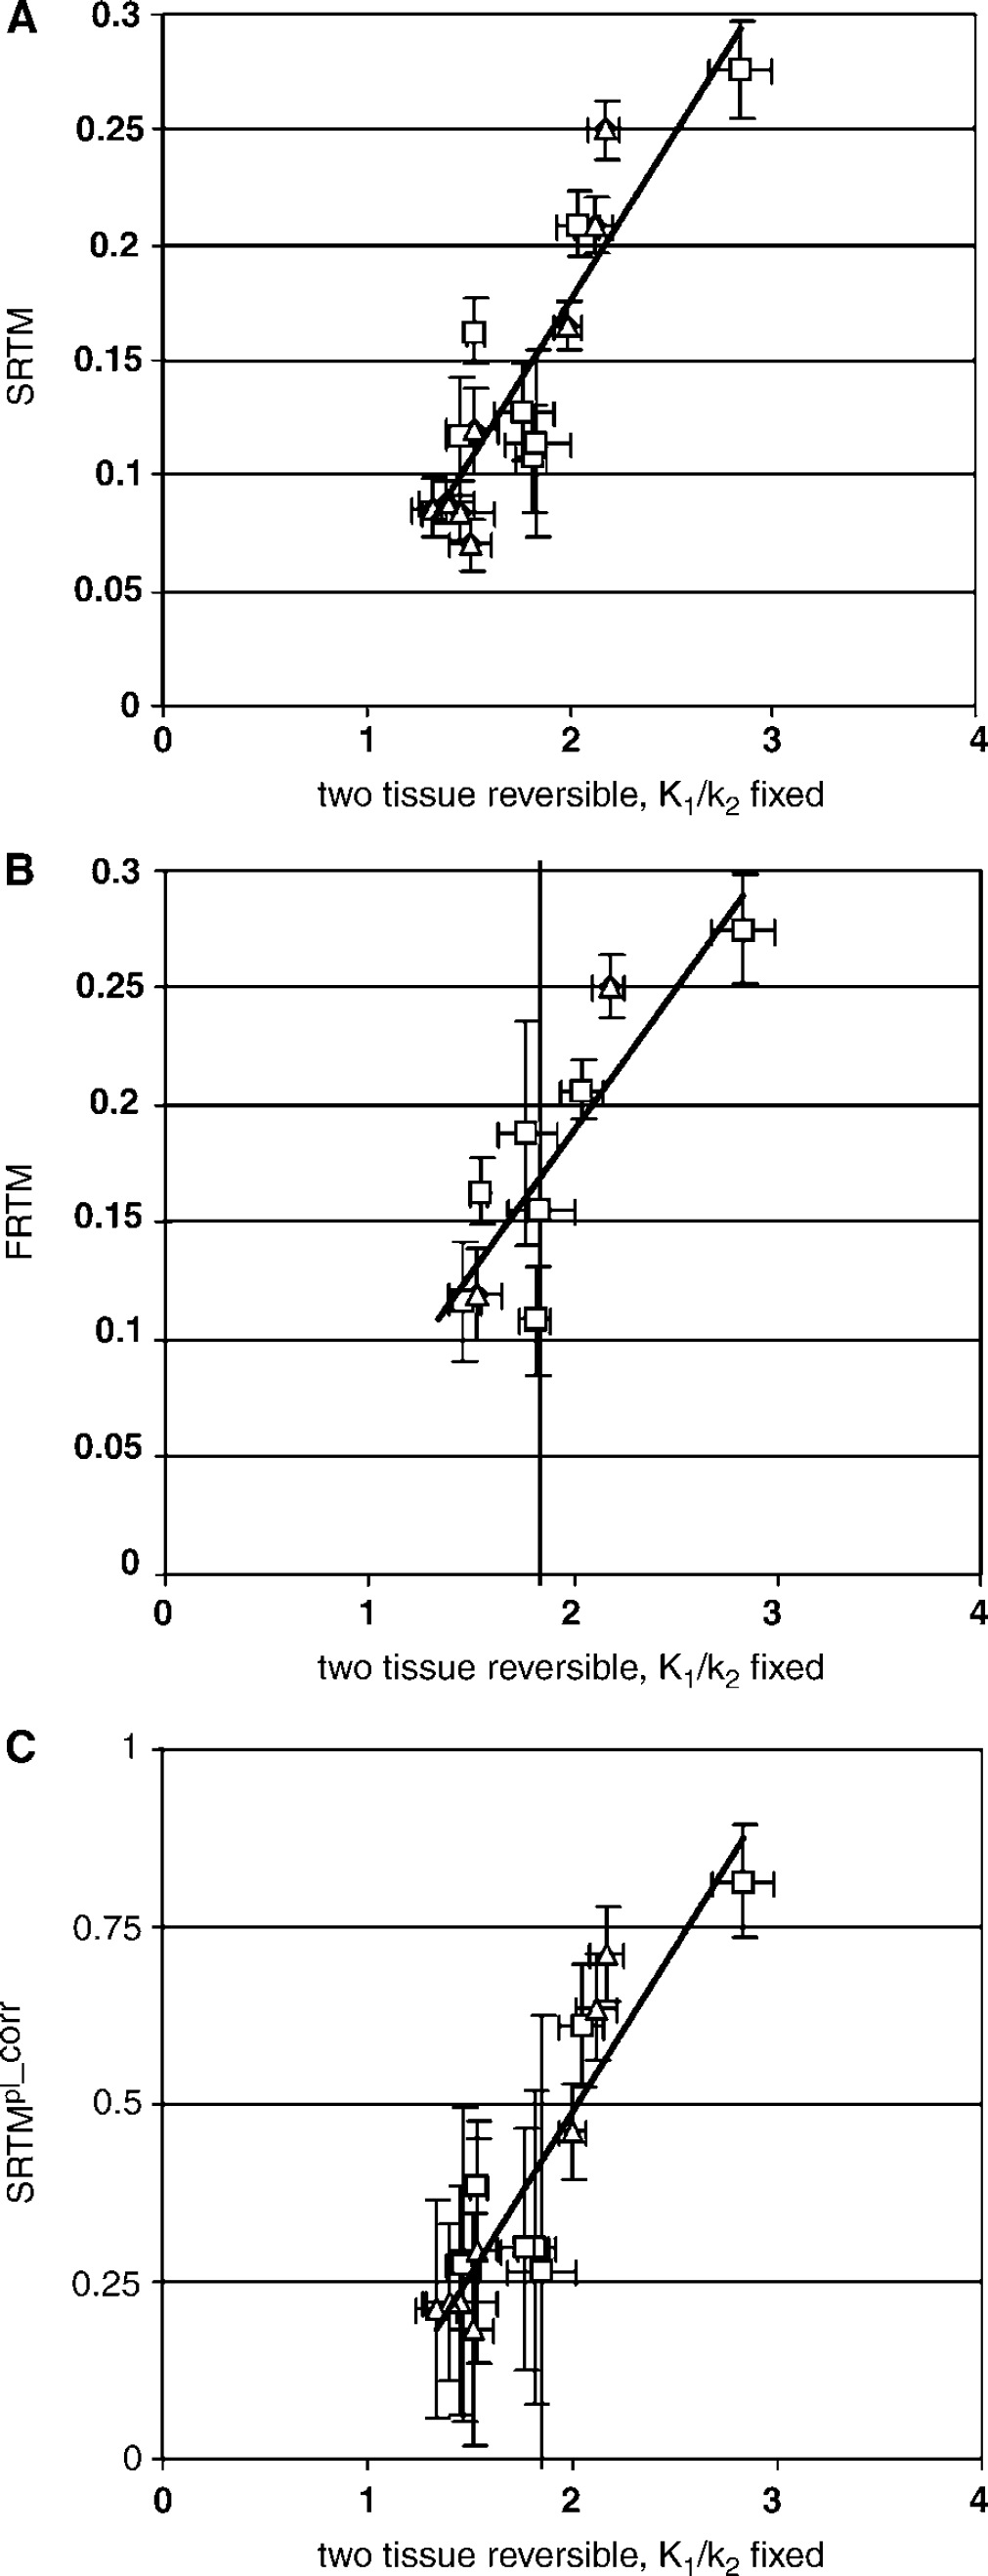
Correlations between binding potential calculated using various reference tissue models and the two-tissue reversible plasma input model with K1/k2 fixed to the whole cortex value. Results are shown from neurotrauma subjects (¡) and from elderly normal controls (Δ). Only results for models with a correlation coefficient of more than 0.7 are shown.
Discussion
Monte Carlo Simulations
When evaluating the results from the simulations, SRTM performed equally well or better than FRTM in all aspects.
When the correct parameter values were used in the simulations, all models show bias at the 10% noise level (Table 2). For SRTM (and FRTM), a bias of approximately 1/(1 + BPns) is expected because of the nonspecific binding. Bias, however, is acceptable if it remains relatively constant under physiologic variation between region and subjects. In contrast, large COV, as observed in R2T2R, VD2T2R and SUB2T2R (~ 100% or more), seriously limits applicability.
As noise levels vary and, to a large degree, are unknown, bias for a good reference tissue model should be insensitive to changes in noise level. Models R2T2R and R3T2Rk5k6 showed biases that were very dependent on noise level (Figure 1A), limiting their applicability in clinical studies.
Measuring small BPsp with high accuracy and reproducibility proved to be difficult (Figures 2A and 2B). This is expected as it is difficult to distinguish a small specific signal from the much larger nonspecific signal. Both SRTM and SRTMpl_corr performed relatively well here, although increase in bias for SRTMpl_corr was substantial. The results for small BPsp seriously limit the applicability of models VD2T2R and SUB2T2R (high COV), VD2T1R (high bias), and R2T2R, R2T2Rk4 and R3T2Rk5k6 (high bias and COV).
For several models (SRTM, R2T2R, R2T2Rk4, VD2T1R and VD2T2R), the change in bias because of variations in BPns was smaller (Figure 2C) than the change caused by variation in BPsp, and therefore less important in model evaluation. Increased COV with increasing BPns (Figure 2D) for R3T2Rk5k6, VD2T2R and SUB2T2R is a serious limitation of these models.
Varying Vb had little effect on bias and COV. For R3T2Rk5k6, increasing Vb resulted in a substantial, but acceptable increase in COV.
Clinical Evaluation
In general, correlations between reference tissue model BPs and plasma input BPs were low due to both high noise levels in [11C](R)-PK11195 studies (low uptake and high nonspecific binding) and different effects of nonspecific binding on plasma input and reference tissue models.
Only correlations for SRTMpl_corr, SRTM and FRTM were acceptable. The poor performance of R2T2R, R3T2Rk4 and to a lesser degree R3T2Rk5k6 is probably due to the increased number of fitting parameters. The model SUB2T2R suffers from an increase in COV because BPsp is calculated by subtracting two fitted parameters (of similar magnitude) with resulting error propagation. Similarly, models VD2T2R and VD2T1R also calculated BPsp by combining two Vd values of similar magnitude resulting in unfavorable error propagation, explaining the poor correlations for these models (Table 2).
The results indicate that SRTM BPsp correlate well with plasma input BPs. From a theoretical point of view, a perfect correlation is not expected because the plasma input model measures the sum of BPsp and BPns while SRTM measures specific BP alone. Since nonspecific binding is high (for subjects with neurotraumatic injury, plasma input BPs are in the order of ~2 while SRTM BPs are ~0.5), the plasma input model cannot be treated as the golden standard. The influence of BPns on the calculated BPsp using reference tissue models will further decrease the reproducibility of measured BPsp (due to the bias of 1/(1 + BPns)in BPsp) and to a lesser extend for SRTMpl_corr. Therefore, SRTMpl_corr is an improvement over SRTM. However, by including a correction for nonspecific binding, systematic and statistical errors in metabolite corrections might result in errors and increased uncertainties in observed specific binding using SRTMpl_corr.
Limitations
The reference tissues used in this study were cerebellum for the elderly healthy subjects and an (apparently) unaffected cortical region for neurotrauma patients. The cerebellum has been used previously (Groom et al, 1995; Banati et al, 1999; Versijpt et al, 2003; Gerhard et al, 2005a), while an unaffected region was chosen to approximate those areas that would be found by cluster analysis as used in several reports (Banati et al, 2000, 2001; Cagnin et al, 2001a, b; Gerhard et al, 2003; Turner et al, 2004). Both these reference regions might, however, not be ‘perfect’ as reference tissue, because increased specific binding in these structures cannot be excluded. Increased specific binding in the reference tissue would results in an underestimation of specific binding in the target areas. As in all models, the same reference region was used, possible presence of (a small degree of) specific binding in the reference region will only have a small effect on the comparisons based on the clinical data. For clinical data, the observed correlations between plasma input and reference tissue models could be reduced because of specific binding in the reference tissue, but it should affect all reference tissue models to a similar extent. Therefore, it should still be possible to identify the optimal reference tissue model.
The present study was not concerned with identifying the ‘best’ reference tissue. Further studies are required to identify optimal reference tissues for different clinical conditions (stroke, Alzheimer, neurotrauma, etc). In addition, further studies are needed to assess methods that enable automatic extraction of reference tissue curves (e.g. cluster analysis).
General Conclusion
In this study, several reference tissue models were evaluated using both Monte Carlo simulations and clinical data. Among these models, SRTMpl_corr and SRTM performed best both in Monte Carlo simulations and in a clinical evaluation. Simplified reference tissue model does not require a metabolite corrected plasma input curve, and is therefore recommended for studies when only a reference tissue input is available. SRTMpl_corr, in which a correction for bias due to nonspecific binding is performed, performs better than SRTM, especially when measuring low BPsp. It has the advantage over the two-tissue reversible compartment model with K1/k2 fixed to whole cortex that it measures BPsp instead of the sum of BPsp and BPns which is very relevant for [11C](R)-PK11195 as it is a tracer with large BPns. Therefore, SRTMpl_corr is recommended for analyzing [11C](R)-PK11195 studies when a metabolite corrected plasma input curve is available, while SRTM is recommended when only a reference tissue input can be used.
Footnotes
Acknowledgements
The authors thank the personnel of the BV Cyclotron VU for the production of [11C]CO2, staff of the Department of Nuclear Medicine & PET Research for the production of [11C](R)-PK11195, data acquisition and blood metabolite analysis and Dr P Pauwels for help with the MRI sequences. We would like to thank R Kloet for help with data processing. Helpful comments by Dr AD Windhorst are gratefully acknowledged. This work was made possible by a research grant from the European Union and a research grant from the Dutch Brain Foundation provided to BNM van Berckel.
Appendix A Overview of new reference tissue models
In the present study, eight reference tissue models and one model with both plasma and reference input were evaluated. Not all of these models are in common use. Therefore, in this appendix, the most general of these reference tissue models, that is, the model with three target tissue and two reference tissue compartments (R3T2R, Figure A1) will be described in more detail and its operational equation will be derived. The operational equations for the other models can easily be derived from that of R3T2R by setting appropriate parameters to zero.
The general solution for a reversible plasma input compartment model, when neglecting blood volume, is
where Ct is the target ROI concentration, Cp the metabolite corrected plasma input concentration and H(t) the impulse response function of the system. For an n-compartment reversible plasma input model, H(t) has the form (Gunn et al, 2001):
The transfer function of the system is its Laplace transform ~T(s) and is given by
The corresponding equations for a reference tissue model with m reversible target and n reversible reference tissue compartments are
In these equations, R1=K1/K'1 and Cr(t) the concentration in the reference tissue. The various Φi and θi are functions of the kinetic parameters. If the plasma input transfer functions for the target and reference regions are ~TTP(s) and ~TTP(s), respectively, then the plasma input transfer function for the reference tissue model ĤTTP(s) is (Gunn et al, 2001)
As the target tissue contains three compartments and the reference tissue two, the final reference tissue model has five compartments. Substituting the transfer functions for the two tissues into the equation above results in
Next, ΦTRi and ΘTRi, iϕ{1, 2, 3,4}, will be expressed as a function of ΦTRi, ΦTPj and ΦTRk and ΘTRk of the original plasma input models. Both the left- and right-hand side of the equation above must have poles at s = - ΘTRi, iϕ{1,2, 3,4}. If all poles are unique, then it can be assumed without loss of generality that
Both expressions for ~TTR(s) must be equal in neighborhoods of s = - ΘTRi, iϕ{1, 2,3,4}, and thus it can be directly seen that
Taking the limit of s → - ΘTR4 results in
In the vicinity of s → -ΘTR4, where ~TTR(s) → ∞, the lower order terms on the left-hand side can be ignored. Rearranging terms on the right-hand side results in
Which can be rearranged into
and thus
and
The expressions of ΦTPi, ΦTPi, ΦRPi and ΦRPi are (Gun: et al, 2001):
and
Models R2T2R, R2T2Rk4 and R3T2Rk5k6, derived from R3T2R, assume a constant K1/k2 ratio between target and reference tissues (i.e. K'2 = K2 · K'1/K2 = K2/R1). Model R3T2Rk5k6 also assumes that the kinetics of nonspecific binding are the same in reference and target regions. Expressions for R3T2Rk5k6 can be derived by substituting K'2 by K2/R1, k5 by k5 and k'6 by k6. The fitted parameters for this model are R1, k2, BPsp, k4, BPns and k6. Model R2T2R can be derived by reducing the target tissue with one compartment and again by assuming a constant K1/k2 ratio for target and reference tissues. The fitted parameters for this model are R1, k2, BPsp, k4, BPns and k'6. BPns equals k'5/k6 and BPsp equals k3/k4-k'5/k'6. The equations for R2T2R can be derived by substituting k'2 by k2/R1, by setting k5 to zero and by neglecting k6. Model R2T2Rk4 can be derived from R2T2R by renaming k'5 to k'3, k'6 to k'4 and by fitting k'4 and k4 by a common parameter. The fitted parameters for this model are R1, k2, BPsp, BPns and k4. The equations for this model can be derived by replacing k6 by k4 in the model R2T2R.
Model VD2T2R uses a two-tissue reversible compartment model for both target and reference regions. Like all other plasma input models used in the present study, it includes a blood compartment and uses different time activity curves for blood and (metabolite corrected) plasma concentrations. The standard two-tissue reversible compartment model was used for the reference region. A modified two-tissue reversible compartment model with the K1/k2 ratio fixed to the ratio of the reference tissue was used for the target region as described previously (Kropholler et al, 2005). The BPsp is then estimated indirectly using BPsp = Vd/(V'd - V'd), in which Vd is K1/k2 (1 + k3/k4)and Vd is defined correspondingly. The fitted parameters for this model are K1, k2, k4, BP and Vb for the target region and K1, k6, BPand Vb for the reference region. Model VD2T1R uses a one-tissue compartment model for the reference region, a two-tissue reversible compartment model for the target region and the same formula BPsp = Vd/(Vd-Vd). For the one-tissue reference region, Vd = K1/k2. The fitted parameters for this model are K1, k2, k4, BP and Vb for the target region and K1, k2 and Vb for the reference region. The model SUB2T2R uses the same plasma input models as VD2T2R but calculates BPsp by subtracting the estimated BP of the reference region from the BP of the target region.
The simplified reference tissue model corrected for nonspecific binding, SRTMp1_corr, estimates BPns using the two-tissue reversible compartment model with plasma input and BPsp using SRTM (Lammertsma et al, 1996b). The specific binding potential is then corrected for nonspecific binding using the equation BPsp = BPSRTMsp (1 + BPns) where BPSRTMsp is BPsp calculated using SRTM.