
Abstract
A major complication of aneurysmal subarachnoid hemorrhage (SAH) is symptomatic vasospasm, a complex syndrome consisting of neurological deterioration and exclusion of other sources of ischemia. Approximately 30% of SAH patients are affected. Although symptomatic vasospasm is associated with high mortality and poor clinical outcome, it is not possible to identify the individual risk on a molecular level for patients before symptoms have developed. In this study, we hypothesize that protein changes occur in the cerebral microdialysate of patients who later develop symptomatic vasospasm which are not found in matched-pairs control subjects. We searched for changes in protein concentrations in microdialysate sampled from the fronto-temporal brain tissue of five vasospastic and five nonvasospastic SAH patients using proteomics technology based on two-dimensional gel electrophoresis and mass spectrometry. Microdialysate samples were taken at least 1.5 days before the onset of symptomatic vasospasm. Comparing protein expression profiles, we found that the protein concentrations of several isoforms of glyceraldehyde-3-phosphate dehydrogenase (GAPDH) were 1.79-fold ± 1.29 (N = 5, P < 0.05) higher in the group which later developed symptomatic vasospasm, whereas heat—shock cognate 71 kDa protein (HSP7C) isoforms were decreased to 0.50-fold ± 0.19 (N = 5, P < 0.05; all expression data means ± s.d.). The changes in protein concentrations were detected 3.8 ± 1.7 days (N = 5, P < 0.05) before symptomatic vasospasm developed. We conclude that GAPDH and HSP7C may be used as early markers indicating the later development of symptomatic vasospasm after SAH, enabling selective early therapeutic intervention in this high-risk group of patients.
Keywords
Introduction
Subarachnoid hemorrhage (SAH) is a cerebrovascular disease contributing to approximately 6% to 8% of all cerebral stroke events. Subarachnoid hemorrhage is responsible for approximately 22% to 25% deaths of all cerebrovascular diseases. Its main etiology is cerebral aneurysms. For example, in the United States, approximately 1 to 12 million people are affected by cerebral aneurysms, of which approximately 30,000 of whom develop SAH annually. The individual risk for bleeding is approximately 7 to 20 in 100,000 (data for North America and Europe; for review, see Dumont et al, 2003). Subarachnoid hemorrhage is associated with a high mortality and risk of poor outcome owing to initial hemorrhage, recurrent hemorrhage, or symptomatic vasospasm (Hijdra et al, 1987). Besides these complications in the patients' lives and the high cost of the initial intensive care hospitalization, the socioeconomic damage is immense owing to loss of income and early retirement.
The pathogenesis of symptomatic vasospasm is complex and still cannot be explained fully. Current models include calcium signaling and microtubular rearrangement, inflammatory reaction, free hemoglobin, and superoxide free radicals (reviewed in Dumont et al, 2003; Janjua and Mayer, 2003). Of note, the maximum duration of delayed cerebral ischemia is approximately 7 to 14 days after the bleeding, presenting the possibility for earlier diagnostic or therapeutic intervention.
In the past, several risk factors such as distribution and size of blood clots on initial CT scan, neurological grade on admission, preexisting hypertension, cigarette smoking, and other causes were identified as increasing the odds of symptomatic vasospasm (Fisher et al, 1980; Frontera et al, 2006; Qureshi et al, 2001). Currently, no individual risk of developing symptomatic vasospasm can be assigned. It remains unclear why some patients are affected by symptomatic vasospasm after SAH and others are not. If the subgroup which later develops symptomatic vasospasm could be identified before the onset of signs and symptoms, it might help to establish early therapy. The current therapeutic concept is mainly based on calcium antagonists such as nimodipine, mediating its effects most probably through neuroprotection and cerebral vasorelaxation. When symptomatic vasospasm develops, therapeutic strategies such as induced hypertensive hypervolemic hemodilution (therapy) remain symptomatic and bear considerable cardiopulmonary risks.
Brain microdialysis is an in vivo method to collect and monitor extracellular substances such as neurotransmitters and small metabolites in the brain (Ungerstedt, 1991). Recently, we have established a protocol applying proteomic technologies based on two-dimensional gel electrophoresis and mass spectrometry to investigate protein concentrations in brain microdialysate (Maurer et al, 2003), creating a two-dimensional protein map and reference database. In a meta-analysis, several factors associated with the degree of bleeding and general risk factors have been identified (Macdonald et al, 2003), and a number of studies have implemented cerebral microdialysis to monitor symptomatic vasospasm after SAH (Peerdeman et al, 2003; Unterberg et al, 2001). However, no molecular risk factors have been identified on the protein level for early prediction of outcome or complications such as symptomatic vasospasm. However, changes of metabolic parameters such as the lactate/pyruvate ratio in the microdialysate may predict long-term (>12 months) outcome (Sarrafzadeh et al, 2004).
In this study, we combined cerebral microdialysis and two-dimensional gel electrophoresis to detect early proteomic markers, which may help to identify patients at risk up to 6 days before the onset of symptomatic vasospasm. Using this approach, we found an increase in glyceraldehyde-3-phosphate dehydrogenase (GAPDH) and a decrease in heat– shock cognate 71 kDa protein (HSP7C) in the symptomatic vasospasm patients, compared with nonvasospastic SAH patients. We conclude that these changes in protein concentration may allow therapeutic intervention in those SAH patients who are at risk for the later development of symptomatic vasospasm.
Patients and methods
Human Cerebral Microdialysis
The study was performed in accordance with the local medical ethics policies for the study of human subjects, and written informed consent was obtained from the patient or nearest relative. Microdialysis was performed as described (Sarrafzadeh et al, 2003, 2004). Briefly, flexible microdialysis probes (CMA 70 custom probes, CMA Microdialysis, Solna, Sweden) were inserted into the fronto-parietal or temporal parenchyma of 10 patients who suffered from SAH after aneurysmal bleeding according to the location of the aneurysm-bearing vessel. The probes were inserted after surgical intervention on the aneurysm in median 45 h (25th/75th quartile: 24 h/73 h) after the initial bleeding. Microdialysis probes had a formal cut-off level of 20 kDa (membrane diameter 0.65 mm, membrane length 10 mm), that is recovery of larger molecules was 30% or less. Overall, microdialysis monitoring was continued for 204 h (25th/75th quartile: 177 h/239 h).
The patients were assigned to one of the two study groups retrospectively, but before proteome analysis was performed. Both groups were matched for age, sex, Glasgow Coma Scale, and clinical presentation (World Federation of Neurological Surgeons Committee, 1988), as well as for radiological criteria of the Fisher scale (Fisher et al, 1980; Table 1). Of note, both groups were matched pairwise to achieve optimal consistency of clinical and demographical data. All patients were treated surgically by clipping of the ruptured aneurysm in median 33 h (20 h/53 h) after the bleeding and received prophylactic nimodipine treatment. Hemodynamic therapy was not administered before onset of symptomatic vasospasm or before the first proteomic sampling. No differences existed between the groups with regard to prognostic factors such as the site and size of the aneurysm, pharmacological treatment, blood pressure, and intracerebral or intraventricular bleeding at the time of proteomic sampling. The patients who later developed symptomatic vasospasm received hemodynamic therapy after its onset.
Clinical data for patients (N = 10)
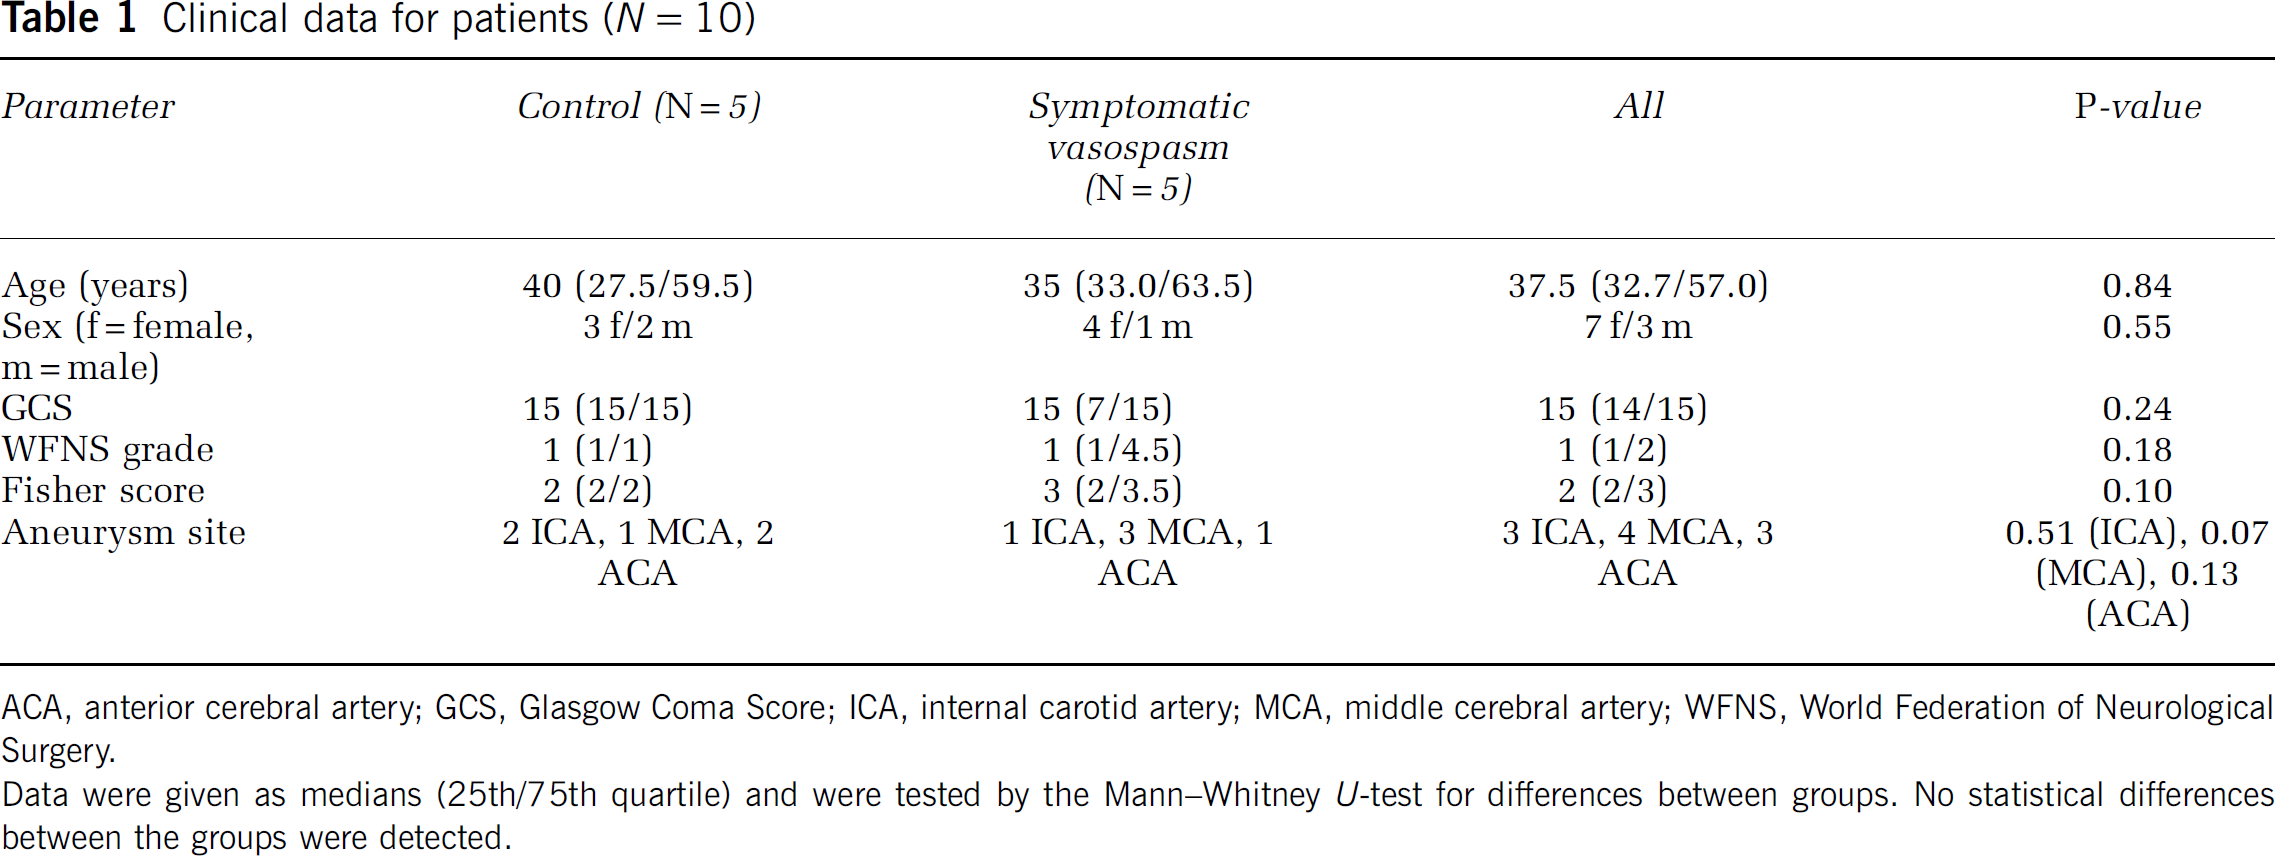
ACA, anterior cerebral artery; GCS, Glasgow Coma Score; ICA, internal carotid artery; MCA, middle cerebral artery; WFNS, World Federation of Neurological Surgery.
Data were given as medians (25th/75th quartile) and were tested by the Mann—Whitney U-test for differences between groups. No statistical differences between the groups were detected.
Symptomatic vasospasm is defined as ‘a complex syndrome consisting of (1) neurological deterioration after SAH where new focal deficits occurred, confusion or disorientation developed, or the rating in the daily assessed Glasgow Coma Scale declined 2 or more points; (2) exclusion of other sources of ischemia, such as rebleeding or hydrocephalus by CT scan, and (3) no other identifiable cause for neurological deterioration (e.g., meningitis and electrolyte disturbances).’ All patients described in this study were assessed daily, and symptomatic vasospasm was defined and diagnosed as described previously(Sarrafzadeh et al, 2004).
Five patients were included in the study who developed symptomatic vasospasm within 6.4 ± 2.2 days after SAH. The other five patients did not show signs of symptomatic vasospasm after SAH and were assigned to the control group. Microdialysis probes were perfused at 0.3 μL/min with a sterile Ringer's solution, and samples were taken within 24 h after the start of cerebral microdialysis.
Proteomic Screening
For two-dimensional gel electrophoresis, microdialysate proteins were separated in the first dimension according to their isoelectric point and in the second dimension according to their molecular weight (Maurer et al, 2003). Briefly, microdialysate samples were centrifuged for 5 mins at maximum speed on a table centrifuge to remove disturbing substances. Five to ten microliters of the microdialysate (corresponding to 1 to 2 μg protein) was suspended in 6 mol/L urea, 2 mol/L thiourea, 2% 3-[(3-cholamidopropyl)-dimethylammonio]-1-propanesulfonate (CHAPS), 0.5% immobilized pH gradient buffer pH 3–10 (GE Healthcare, formerly Amersham Biosciences, Uppsala, Sweden), and a trace of bromophenol blue, resulting in a final volume of 350 μL. Samples were applied to pH 3–10 nonlinear gradient isoelectric focusing gel strips (Immobiline DryStrip pH 3–10 NL, 18 cm) in the IPGphor apparatus (both GE Healthcare, formerly Amersham Biosciences, Uppsala, Sweden) with 12 h of reswelling at 30 V, then 200, 500, and 1000 V for 1 h each. Voltage was increased to 8000 V in 30 mins and kept constant at 8000 V for 12 h, resulting in a total of 100,300 Vh. The gel strips were equilibrated for 20 mins each in 1% dithiothreitol or 2.5% iodoacetamide, respectively, followed by a nongradient, 12.5% polyacrylamide gel electrophoresis in the presence of 0.1% sodium dodecyl sulfate. Gels were run at 30 mA for 30 mins and 100 mA for approximately 4 h in a 20 × 20 cm water-cooled vertical electrophoresis apparatus. For image analysis, gels were silver stained (Blum et al, 1987) and digitized in a desktop scanner. Images were analyzed by the Phoretix 2D Expression software (Nonlinear Dynamics, Newcastle-upon-Tyne, UK), and normalized spot volumes defined as the integral of the optical density over the spot area were compared (Maurer, 2006). Spots of interest were excised and identified by mass spectrometry (Center for Molecular Medicine, ZMMK, University of Cologne, Cologne, Germany) as described in detail in Feldmann et al (2005). Briefly, proteins in the spots were digested with trypsin and subjected to peptide mass fingerprinting using matrix-assisted laser desorption/ionization time-of-flight (MAL-DI-TOF) mass spectrometry. Bioinformatic data mining was performed using the Mascot platform (http://www.matrixscience.com). A Mascot score of more than 63 (P < 0.05) was considered statistically significant. Protein spots containing more than one protein or without unambiguous identification were excluded.
Statistical Evaluation
We compared protein concentrations measured in the two-dimensional gels by densitometry (Maurer et al, 2005). In this context, the protein concentration is correlated to the protein spot volume defined as ‘the integrated optical density over the spot area.’ We used Student's t-test to compare protein groups between the vasospastic and nonvasospastic patients, where a P < 0.05 was considered statistically significant. For multiple testing, Bonferroni's correction has been applied. All data are presented as means ± s.d.
Hierarchical Cluster Analysis
We sorted protein expression profiles using hierarchical clustering to find protein spots with similar expression patterns in both groups (Maurer, 2005). We applied the program EPCLUST, version 0.9.23 beta, from the EMBL-EBI online tool Expression Profiler, which can be found at http://ep.ebi.ac.uk (Vilo et al, 2003). Expression Profiler is a free online set of tools for clustering, analysis, and visualization of gene expression and other genomic data. Data were log2-transformed, and spot volumes were mean-centered for each protein spot. We included data from all gels in the analysis. For clustering, we applied average linkage (average distance, unweighted pair group method with arithmetic mean) clustering based on linear correlation-based distance (Pearson, centered). The dendrogram cutting height was set to 0.5 using the Gardener's algorithm (Maurer, 2005).
Results
Two-Dimensional Gel Electrophoresis
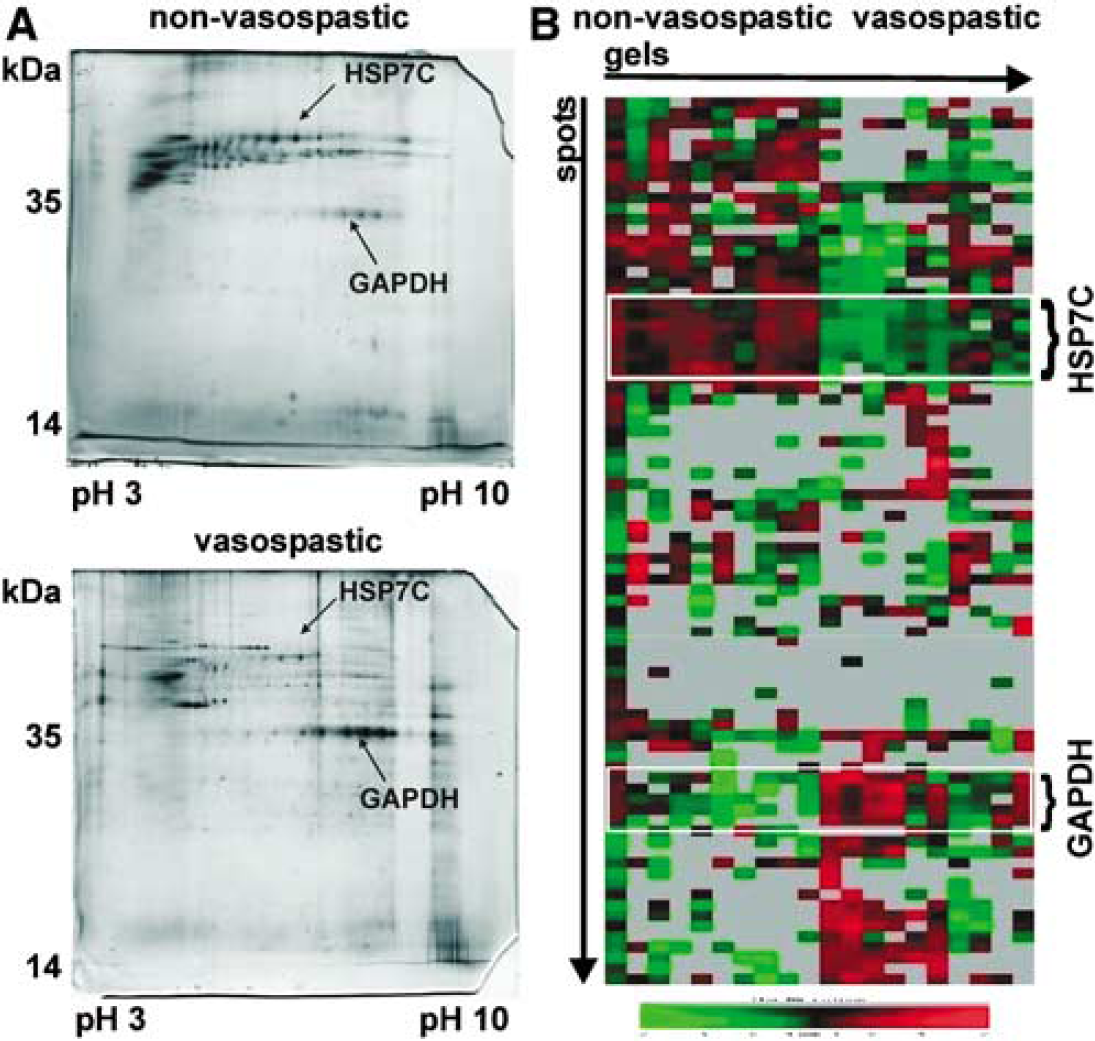
We found an average of 57 ± 22 (s.d.) protein spots in the individual gels (N = 10), ranging from a minimum of 37 to a maximum of 149 spots. Examples for individual gels taken from a vasospastic and a nonvasospastic patient are shown in Figure 1A. Compared to two-dimensional gel electrophoresis experiments of other samples, the number of spots is low in human brain microdialysate. For example, two-dimensional gels of human cerebrospinal fluid contain hundreds of protein spots (Sickmann et al, 2002). Few proteins are most likely explained by the low overall protein concentration in the sample, allowing only highly abundant proteins to be visualized. The low-protein concentration resulted from the ultrafiltrate character of the microdialysate and the molecular cut-off sieve of the dialysis membrane. Despite the low number of spots, differences in the protein expression are apparent between the patients who later developed symptomatic vasospasm and the control patients.
(
We applied hierarchical cluster analysis as an independent tool for data sorting and analysis for differentially expressed groups of proteins at a dendrogram cutting height of 0.5 (Figure 1B). We compared the proteins in the clusters with the proteome reference map and database for human brain microdialysate (Maurer et al, 2003) to identify spots using gel matching and mass spectrometry. Two of the clusters contained isoforms of GAPDH (UniProt database (http://www.uniprot.org) accession number P04406) and HSP7C (UniProt database accession number P11142).
Protein Identification
We compared spot volumes of the identified protein clusters by Student's t-test between the vasospastic and nonvasospastic patients. The spot volume is defined as ‘the integral of the optical density over the spot area.’ We found that GAPDH (four isoforms) was higher by a factor of 1.79 ± 1.29 in the symptomatic vasospasm group (N = 15 spots, means ± s.d., P < 0.05) (Figure 2A). The concentration of HSP7C (two isoforms) was decreased to 0.50 ± 0.19 (N= 4 spots, means ± s.d., P < 0.05) (Figure 2B).
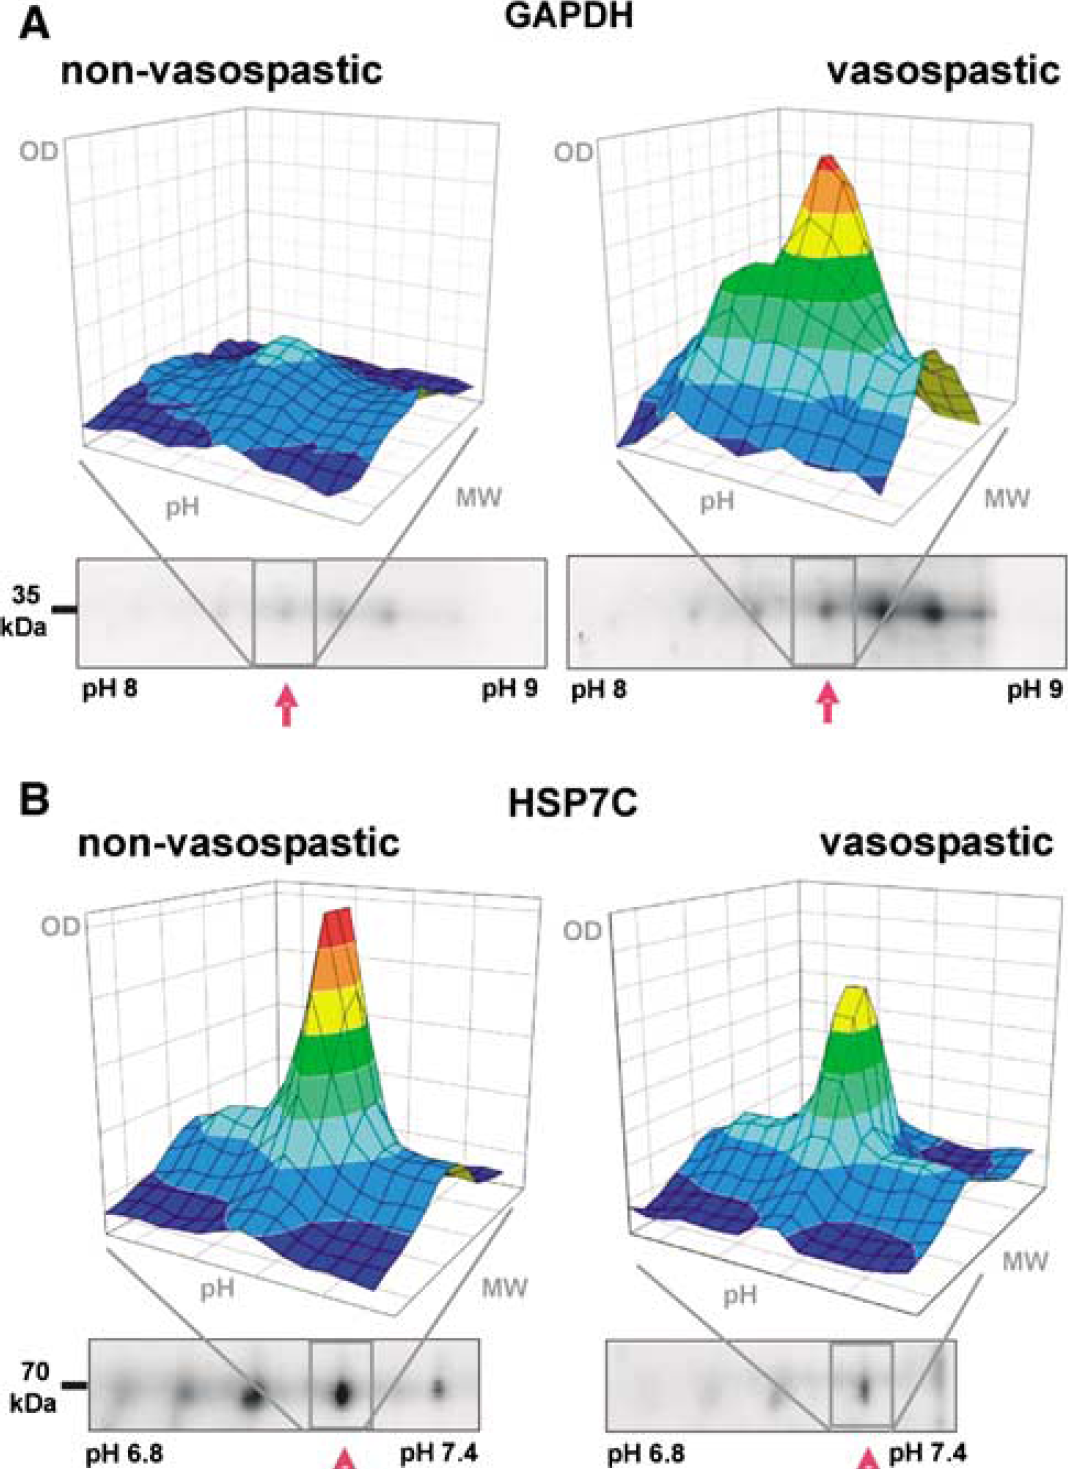
Comparison of protein spot volumes for a nonvasospastic patient (left panels) and a vasospastic patient (right panels). Data taken from the densitometric analysis of two-dimensional gels (lower part) were reconstructed in three dimensions (upper part). The figures show representative spots for (
Temporal Analysis of the Protein Changes
Of note, the changes in protein concentrations occurred even before the onset of the symptomatic vasospasm (Figure 3), indicating that the biochemical changes related to the later development of symptomatic vasospasm can be monitored without the clinical evidence for symptomatic vasospasm being present yet. In this study, the changes in protein concentration occurred 3.8 ± 1.7 days (means ± s.d., N = 4 patients; P < 0.05) before symptomatic vasospasm developed (Figure 4). Matching individual patient's samples with the onset of symptomatic vasospasm, we found that each of the samples showed the early changes in protein concentration, thus providing a tool for individual prognosis.
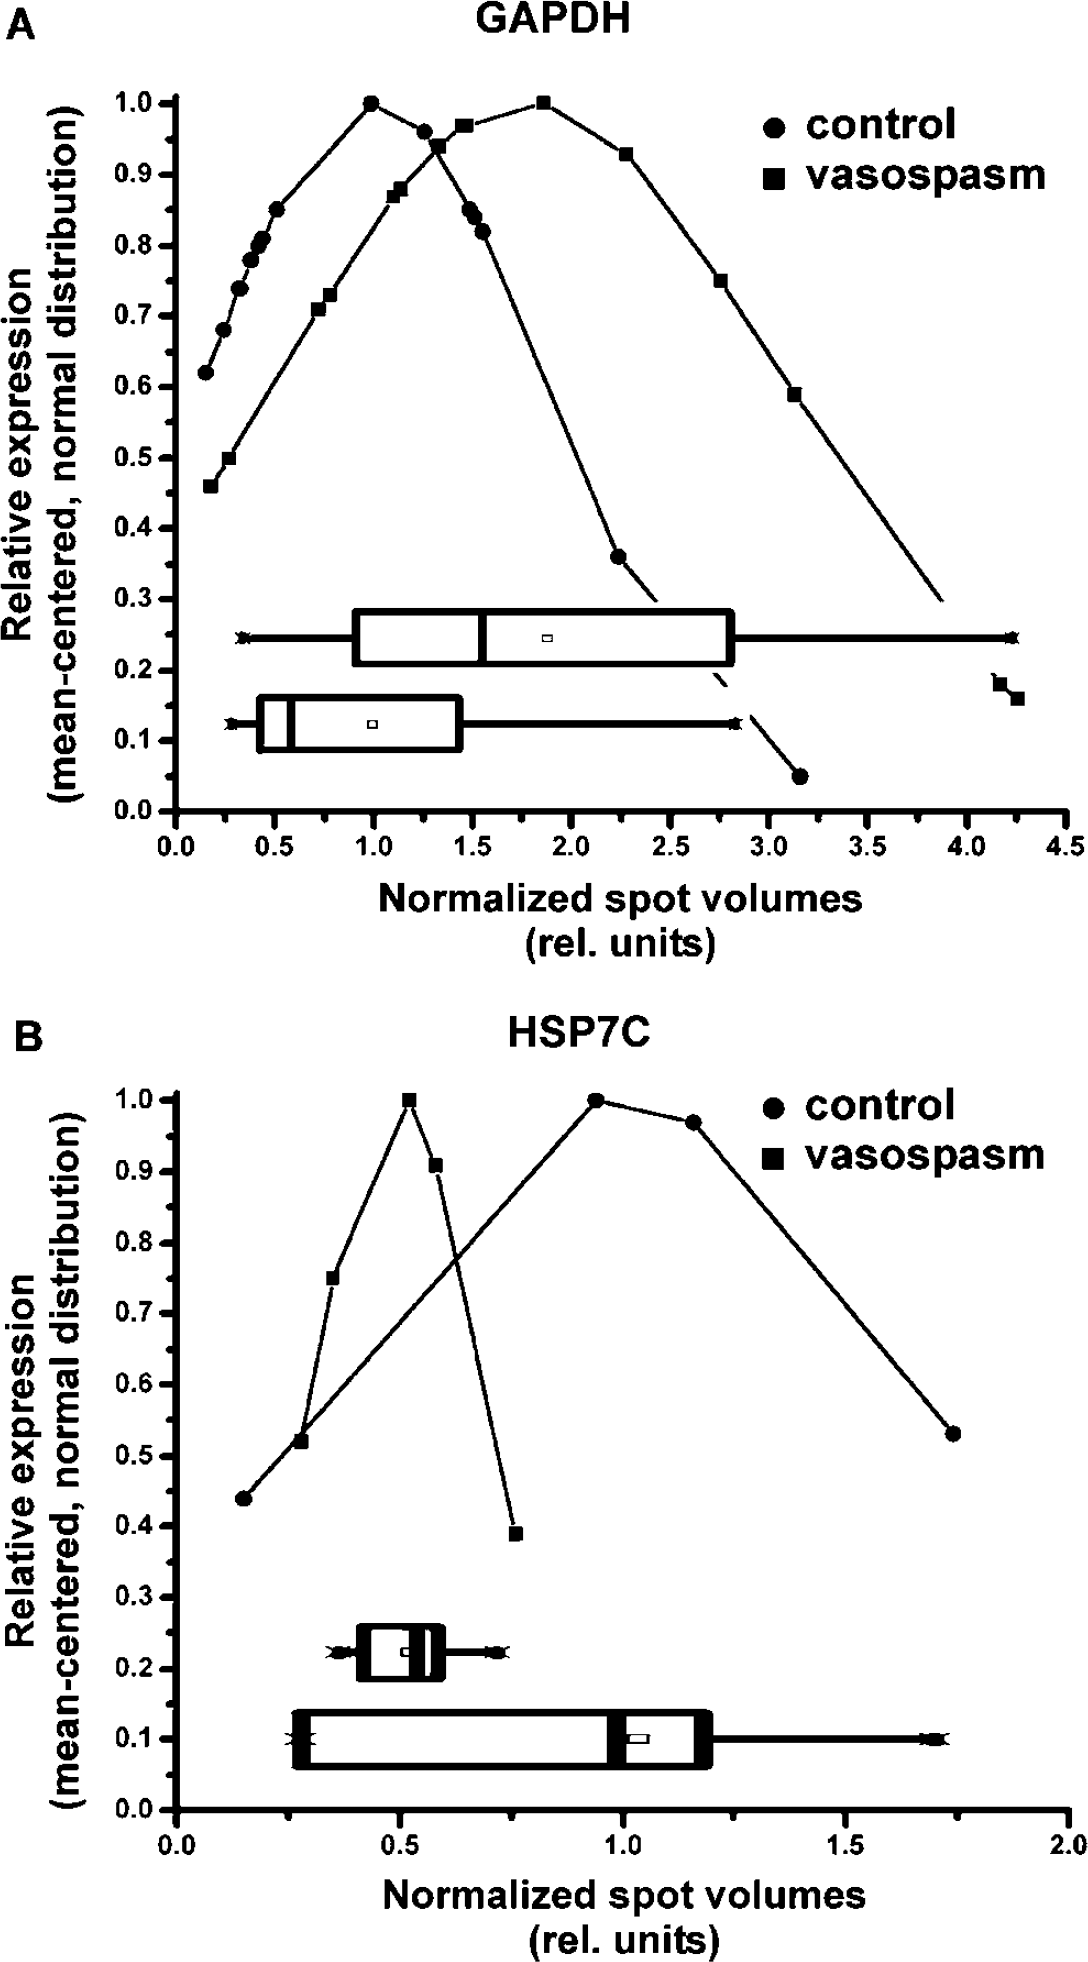
Distribution of the spot volumes for protein isoforms of (
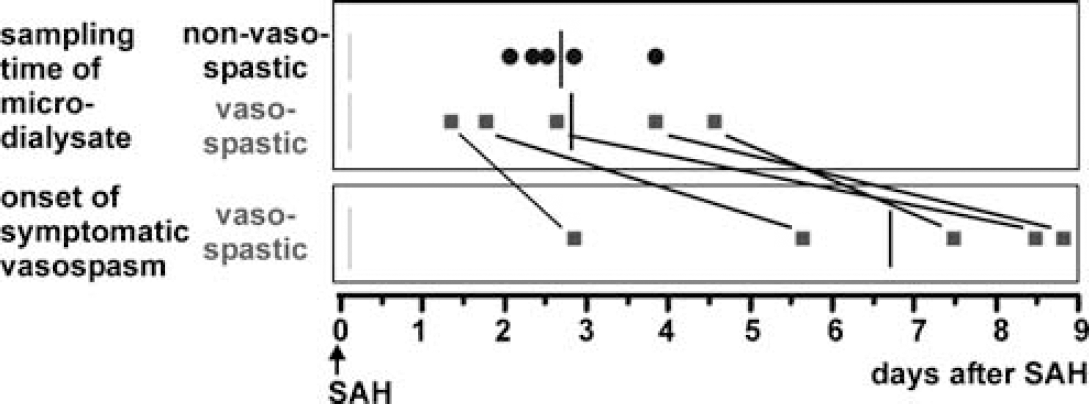
Time course of sampling and occurrence of symptomatic vasospasm. Each symbol depicts data for an individual patient. The bar represents the median. The changes in GAPDH and HSP7C concentration in the microdialysate (upper panel) occurred before the onset of symptomatic vasospasm (lower panel). On average, we found differential protein concentrations 3.82 ± 1.70 days (N= 5 patients of the vasospastic group) before the clinical onset of symptomatic vasospasm.
Discussion
Proteomics of Cerebral Microdialysate is a Tool for the Prediction of Symptomatic Vasospasm
The use of microdialysis to detect symptomatic vasospasm before the onset of symptoms has been a matter of controversy. Some studies were unable to predict symptomatic vasospasm by changes in microdialysis metabolites (Kett-White et al, 2002; Scheufler et al, 2004), whereas others showed changes in the pattern of the observed metabolites only hours before the patient developed delayed ischemic neurological deficit (Nilsson et al, 1999; Skjoth-Rasmussen et al, 2004). Therefore, the main goal of the current study was to find early predictive markers for the occurrence of symptomatic vasospasm after SAH. Currently, consistent risk factors for symptomatic vasospasm include the size of the bleed (Harrod et al, 2005) and the concentration of bilirubin oxidation products (Pyne-Geithman et al, 2005). The new finding in our study is that specific changes in protein concentrations occur approximately 4 days before the onset of symptomatic vasospasm in the microdialysate, thus opening a time window large enough for therapeutic intervention.
Glyceraldehyde-3-Phosphate Dehydrogenase is Associated with Nitric Oxide Metabolism and may Indicate Neuronal Cell Death
The function of glyceraldehyde-3-phosphate dehydrogenase is well described for glucose metabolism, but in recent years research on GAPDH has focused more on its role in cell death and apoptosis, its interaction with nitric oxide (NO), endocytosis, microtubule bundling, phosphotransferase activity, gene expression, including nuclear RNA transport, DNA replication, DNA repair, and translational regulation (Sirover, 1999). The nuclear translocation of GAPDH seems to mediate apoptotic signals which are responsible for neuronal cell death (Sawa et al, 1997). Because GAPDH does not have a nuclear import sequence, the Siah1 protein bound to GAPDH mediates the nuclear translocation (Hara et al, 2005). One prerequisite of the GAPDH—Siah1 complex is the nitrosylation of GAPDH. Of note, NO may also be involved in the pathogenesis of symptomatic vasospasm (see below).
Moreover, the expression of GAPDH is regulated by hypoxia (Graven et al, 1998), indicating a close relationship between metabolic and signaling function. In the cytoplasm, GAPDH is complexed with the TOAD64 protein, enolase-γ, aldolase C, and heat—shock protein 70 kDa (Bulliard et al, 1997). This complex plays a role in membrane fusion and intracellular signaling. Another complex is formed with heat—shock proteins 70 and 90 kDa (Nakamura et al, 2002). Further findings showed that GAPDH expression is stimulated by oxyhemoglobin (Brookes et al, 1997), indicating its close relationship to SAH. In this context, free hemoglobin in the subarachnoid space has been discussed as an underlying pathogenetic mechanism for cerebral symptomatic vasospasm.
Our findings may indicate cellular damage and leakage of GAPDH to the extracellular space, where it is sampled by the microdialysis procedure. Its increased concentration in the symptomatic vasospasm group indicates that its expression is upregulated (e.g., by free hemoglobin (Brookes et al, 1997)) or that its metabolic and signaling functions are stimulated by the novel demands necessary after tissue damage. These novel demands can be interpreted in the direction of either an increased apoptotic signaling or an increased metabolic rate to ensure neuronal survival under adverse conditions.
Several isoforms of the GAPDH enzyme have been identified by isoelectric focusing and two-dimensional gel electrophoresis in human cerebral microdialysate (Maurer et al, 2003). The pH optimum of the enzyme isoforms ranges from pH 7.0 to 9.8, but the functional association of pH optimum and protein isoform is unclear. The GAPDH isoforms are mainly formed by post-translational modifications, such as phosphorylation, rather than alternative splicing. Evidence for the predominant nature of post-translational modifications in the formation of GAPDH isoenzymes is provided by the occurrence of a single 35 kDa molecule in immunoblots and gel electrophoresis under denaturating conditions. We believe that our finding of several GAPDH isoforms may contribute to the hypothesis that the multiple pH optima of this enzyme ensure its functionality during intracellular pH shift or different subcellular localization. On the one hand, the pH shift may be provoked by hypoxia—ischemia, and on the other, nuclear translocation of GAPDH is a paradigm of subcellular translocation of the enzyme (Sawa et al, 1997).
Heat—Shock Cognate 71 kDa Protein Modulates Glyceraldehyde-3-Phosphate Dehydrogenase Function
As a molecular chaperone, HSP7C belongs to the Hsp70 family, this chaperone family is found in the nucleus and cytosol and is involved in chaperoning of nascent polypeptides. These molecules protect against the accumulation of malfolded proteins. Heat-shock cognate 71 kDa protein is found both in neurons and glia and forms a complex with heat—shock protein 90 kDa (HSP90), GAPDH, leucine aminopeptidase, and adenosylhomocysteinase (Nakamura et al, 2002). Oxidative stress owing to hypoxic—ischemic conditions leads to nuclear translocation of HSP7C (Dastoor and Dreyer, 2000) and GAPDH (Sawa et al, 1997), both promoting apoptosis in the affected cells. Moreover, previous studies have found that HSP7C is involved in selective proteolysis of cytosolic proteins via a specific lysosomal pathway (Agarraberes et al, 1997).
It is tempting to speculate that the decrease in HSP7C concentration in the microdialysate of symptomatic vasospasm patients found in this study may be related to a decrease in its protective chaperoning features, leading to tissue damage. Alternatively, the decrease in HSP7C concentration may not be the cause of tissue damage, but a sign thereof. At the present time, not knowing the answer to this question does not diminish its value as an early indicator for the risk of developing symptomatic vasospasm.
Possible Relationship of Heat—Shock Cognate 71 kDa Protein and Glyceraldehyde-3-Phosphate Dehydrogenase to the Pathogenesis of Cerebral Symptomatic Vasospasm
Neither HSP7C nor GAPDH has been associated with cerebral symptomatic vasospasm after SAH, especially with regard to their prognostic value. However, they are known to be closely related to cell death and neurodegeneration (Dastoor and Dreyer, 2000; Sirover, 1999). Thus, it is likely that changes in their protein concentration occur in the microdialysate of patients with severe neuronal death, such as the patients in this study.
The results of the present study suggest that both proteins are also functionally related. Indeed, there is a known functional link between GAPDH and HSP7C, as both are involved in NO metabolism (Borderie et al, 2000; Brüne and Lapetina, 1995). Both proteins seem to be targets for NO signaling, followed by their translocation to the nucleus (Hara et al, 2005), where they are able to bind DNA, or transcription factors, and modify gene expression.
Previous studies indicated that the concentration of NO reaction products (NOx) in the microdialysate is decreased in patients with symptomatic vasospasm as compared with a nonsymptomatic vasospasm control group (Sakowitz et al, 2001). This decrease could be explained by the events after SAH (Figure 5), in which free hemoglobin in the subarachnoid space can act as scavenger for NO, thus decreasing its concentration. In the signaling cascade via cGMP and endothelin-1, this leads to vasoconstriction. Additionally, SAH increased the generation of superoxide free radicals (Janjua and Mayer, 2003), thus provoking vasoconstriction and the generation of bilirubin oxidation products (Pyne-Geithman et al, 2005), which may also act as prognostic factors for the development of symptomatic vasospasm. In this study, we identified two interacting proteins, which are both related to NO metabolism. Therefore, the present findings are in accordance with the role for NO in the pathogenesis of cerebral symptomatic vasospasm.
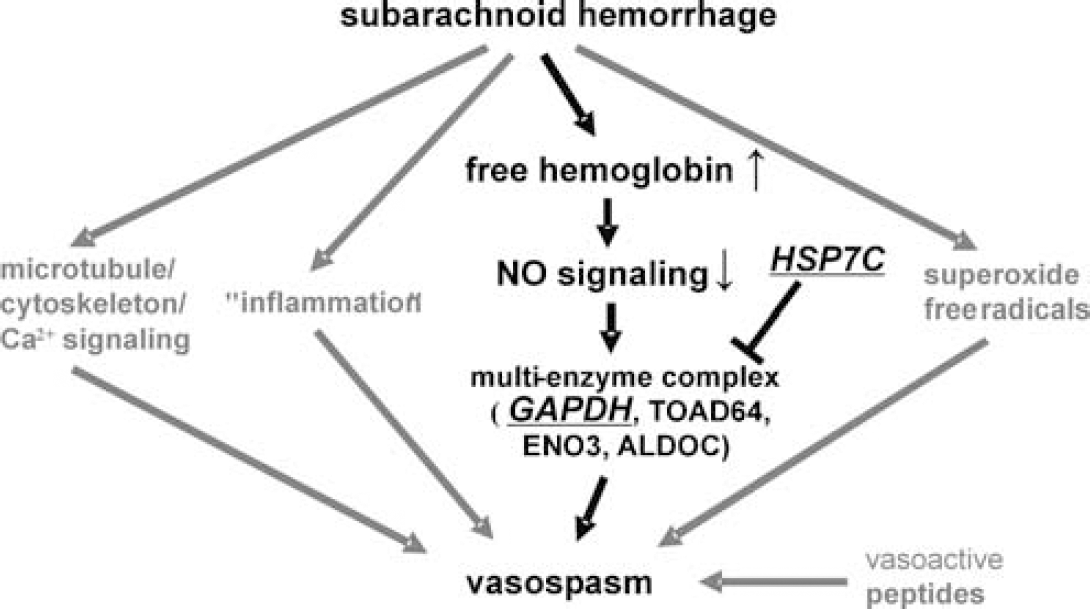
Role of GAPDH and HSP7C in the hypothetical pathogenesis of vasospasm after SAH. In one of the possible pathways integrated in this diagram, our data link SAH via the cascade of increased free hemoglobin to the reduction of NO signaling through scavenging, and the inhibition of vasodilatation by the plasma-membrane linked multienzyme complex of the four proteins GAPDH, Turned-on-after-division (TOAD64), enolase-3 (ENO3), and aldolase-C (ALDOC), resulting in vasospasm. HSP7C is an inhibitor of this protein complex, and thus its decrease results in further vasoconstriction. Data based on Janjua and Mayer (2003) and Sakowitz et al (2001).
Several molecular mechanisms mediating cerebral symptomatic vasospasm after SAH have been discussed, mainly based on the assumed imbalance between vasoconstriction and vasorelaxation. Subarachnoid hemoglobin and secondary inflammation seem to activate a combination of malicious events, including multiple receptor activation, direct hemoglobin toxicity, and damaged neurogenic control of the blood vessels. Pathways involved include protein kinase C, myosin light chain kinase, NO, intracellular Ca2+, and protein tyrosin kinase/mitogen-activated protein kinase signaling. Although this study is in accordance with the involvement of the molecular pathways of GAPDH and HSP7C signaling in neurodegeneration and cell death, we want to point out that the aim of this study was not to add another possible mechanism to the pathophysiology of SAH, but to provide molecular markers during the course of the disease to predict the possibility of symptomatic vasospasm after SAH. This opens a new therapeutic time window for early detection of risk factors or deterioration in these patients.
Conclusions and Outlook
Currently, it is unknown why some patients develop symptomatic vasospasm after SAH, whereas others do not. In this study we used the combination of cerebral microdialysis and proteomics for the screening of a large number of proteins. Using this approach we identified changes in the protein concentration of GAPDH and HSP7C up to 6 days before the onset of symptomatic vasospasm was clinically visible. It is too early to define the two proteins identified in this study as ‘biomarkers’ for clinical use, since the number of patients in this study is still small and the methodological approach is not well suited for everyday clinical use. However, these proteins are promising targets for the development of bedside tests. Possible applications may determine protein concentrations in other body fluids, which are easier to obtain, such as cerebrospinal fluid or blood serum.
Footnotes
Acknowledgements
We thank Mrs Tilly Lorenz and Mrs Maria Harlacher for technical assistance.