
Abstract
Microdialysis continuously monitors the chemistry of a small focal volume of the cerebral extracellular space. Conversely, positron emission tomography (PET) establishes metabolism of the whole brain, but only for the duration of the scan. The objective of this study was to apply both techniques to head-injured patients simultaneously to assess the relation between microdialysis (glucose, lactate, lactate/pyruvate [L/P] ratio, and glutamate) and PET (cerebral blood flow [CBF], cerebral blood volume, oxygen extraction fraction (OEF), and cerebral metabolic rate of oxygen) parameters. Microdialysis catheters were inserted into the frontal cerebral cortex and adipose tissue of the anterior abdominal wall of 17 severely head-injured patients. Microdialysis was performed during PET scans, with regions of interest defined by the location of the microdialysis catheter membrane. An intervention (hyperventilation) was performed in 13 patients. The results showed that combining PET and microdialysis to monitor metabolism in ventilated patients is feasible and safe, although logistically complex. There was a significant relation between the L/P ratio and the OEF (Spearman r = 0.69, P = 0.002). There was no significant relation between CBF and the microdialysis parameters. Moderate short-term hyperventilation appeared to be tolerated in terms of brain chemistry, although no areas were sampled by microdialysis where the OEF exceeded 70%. Hyperventilation causing a reduction of the arterial carbon dioxide tension by 0.9 kPa resulted in a significant elevation of the OEF, in association with a reduction in glucose, but no significant elevation in the L/P ratio or glutamate.
Recent advances in the management of patients with acute brain injury caused by trauma and subarachnoid hemorrhage have included monitoring of cerebral metabolism using microdialysis, and functional imaging of the brain using positron emission tomography (PET). Microdialysis is currently under investigation as a monitor of substrate (glucose) supply and metabolite (lactate and pyruvate) production in patients with head injury, subarachnoid hemorrhage, and epilepsy (Whittle, 1990; Ungerstedt, 1991; Editorial, 1992; Persson and Hillered, 1992; Vespa et al., 1998; Bullock et al., 1998; Goodman et al., 1999; Hutchinson et al., 1999a). The technique also enables the extracellular concentration of amino acids and drugs to be determined. The introduction of bedside analyzers has facilitated the application of microdialysis, enabling the metabolic state of the brain to be followed real-time in intensive care or in the operating theatre. PET scanning provides a comprehensive assessment of cerebral metabolism by providing quantitative data for regional cerebral blood flow (CBF), cerebral blood volume (CBV), oxygen extraction fraction (OEF), and the cerebral metabolic rate of oxygen (CMRO2) (Frackowiak et al. 1980a,c; Baron et al., 1982; Lebrun-Grandie et al., 1983; Sette et al., 1989; Heiss, 1998).
Both microdialysis and PET scanning have limitations. One of the major considerations when interpreting microdialysis results is appreciation of the focal nature of the technique, where monitoring of only a small volume of brain tissue is possible. Consequently, catheter location (e.g., an area of diffuse injury compared to pericontusional tissue) is of prime importance in the interpretation of results. However, microdialysis does provide data continuously over long periods of hours and days. In contrast, PET scanning provides data for the whole brain with the ability to quantify global, regional, or local regions of interest, but only for short periods. By combining the focal but continuous technique of microdialysis with the global but intermittent “snap-shot” images derived from PET, a comprehensive picture of cerebral metabolism can potentially be achieved.
The objectives of this study were to (1) investigate the feasibility of performing microdialysis with sampling during PET scanning; (2) define the relation between microdialysis (glucose, lactate, lactate/pyruvate [L/P] ratio and glutamate) and PET (CBF, CBV, OEF, CMRO2) parameters; (3) to cross-correlate ischemic thresholds for these parameters; and (4) to determine the effects of hyperventilation on PET and microdialysis parameters.
MATERIALS AND METHODS
Patient selection
The study was approved by the Local Cambridge Ethics Committee and UK Radiation Protection Committee. Consent was obtained from the next of kin. Patients older than age 16 years with severe head injury requiring sedation, ventilation, and intracranial pressure monitoring were eligible for the study. Exclusion criteria were deranged coagulation parameters and/or low platelet count preventing the placement of a microdialysis catheter and the presence of certain other injuries. These included unstable spinal injuries contraindicating transfer to the PET scan suite and thoracic complications requiring high (>60%) percentage of inspired oxygen (F
Patients were managed according to standard protocols (Menon, 1999) including sedation with propofol and fentanyl, and paralysis with atracurium. Monitored parameters included electrocardiogram, invasive blood pressure, peripheral oxygen saturation, continuous arterial blood gas analysis (Paratrend 7 sensor, Diametrics, High Wycombe, U.K.), end-tidal carbon dioxide, jugular venous oxygen saturation (Sjv
To compare the PET data from the head injury patients with the uninjured brain, 10 unsedated volunteers were studied with the triple oxygen technique.
Microdialysis technique
Microdialysis catheters (CMA70 10-mm membrane, CMA, Stockholm, Sweden) were inserted into the frontal cerebral parenchyma, in conjunction with an intracranial pressure sensor (Codman, Raynham, MA, U.S.A.) using a specially designed triple-lumen cranial access device (Hutchinson et al., 2000c). This device allows a secure fixation of the catheter. The catheters were inserted to a depth of 30 mm, that is, monitoring predominantly white matter (depth below pia 20 to 30 mm with a 10-mm microdialysis membrane). The cranial access device is inserted via an 8-mm skull hole allowing direct visual and opening of the dura before insertion of the device. The catheters were perfused with Ringer's solution (K+ 4 mmol/L, Na+ 147 mmol/L, Ca2+ 2 mmol/L, Cl- 155 mmol/L) at a rate of 0.3 μL/min using the CMA106 pump. Collecting vials were changed every 20 minutes, thus providing a sample volume of 6 μL sufficient for analysis of four metabolites (glucose, glutamate, lactate, and pyruvate) using the CMA600 bedside microdialysis analyser.
This instrument allows the online analysis of ultrasmall volumes of microdialysis samples on the Intensive Care Unit, with each assay requiring less than 1 μL per analyte and taking 1 to 1.5 minutes. The principle is based on the reaction of the microdialysis sample, with enzyme reagents and the measurement of the product using a single-beam filter photometer with mercury lamp light source. The measurement is performed in a 10-mm (2 μL) capillary flow cell at wavelengths 365 and 546 nm, with the rate of formation of the dye proportional to the substance concentration. The analyzer is controlled by a standard personal computer and calibrates automatically every 6 hours. We have previously validated the analysis of microdialysis samples for glutamate using the CMA600 by comparing measurements obtained using the gold standard of high-performance liquid chromatography (Hutchinson et al., 2000d).
The delay from microdialysis catheter tip to collecting vial is 17 minutes, and this was accounted for when analyzing the results. In addition to the cerebral microdialysis catheter, a subcutaneous microdialysis catheter (CMA60 30-mm membrane) was placed into the adipose tissue of the anterior abdominal wall to monitor peripheral chemistry.
PET technique
The study was performed in the Wolfson Brain Imaging Center adjacent to the neuro-intensive care unit and allows safe imaging of ventilated patients. The PET scans were performed on a GE Advance scanner (General Electric Medical Systems, Milwaukee, WI, U.S.A.) with a 15.3-cm axial field of view. Emission data were acquired after, sequentially, a steady-state infusion of H215O (800 MBq for two frames, each acquired during 5 minutes in 3D mode), a 60-second inhalation of C15O (300 MBq) with data acquired during the subsequent 5-minute period in 3D mode, and a steady-state inhalation of O (7,200 MBq, with data acquired in two 5-minute frames) in 2D mode. The total radiation burden from each set of measurements was 4.18 mSv EDE. Regional CBF, CBV, OEF, and CMRO2 were calculated using simultaneous measurements of arterial tracer activity and standard modeling techniques (Frackowiak et al., 1980b).
During the baseline imaging, the F
Data analysis
After PET, a computed tomography (CT) scan was acquired to determine the location of the monitoring probes, which were not visible on the PET images. The CT scan was coregistered to the least noisy PET image, the summed H215O frame, using the mutual information algorithm developed by Studholme et al., (1996, 1997). This effectively coregistered the CT scan to all the PET images, because patient movement is negligible for these anesthetized and paralyzed patients. A 20-mm diameter region of interest (ROI) was defined on the coregistered CT scan around the probe location (Fig. 1) on two contiguous slices (each 4.5 mm) to represent the volume of brain on PET directly relevant to the volume of brain sampled by the microdialysis catheter (10-mm membrane length). The size of the ROI was determined by the desire to keep the region as focal as possible while limiting parameter variance. By superimposing this ROI over the PET emission scans, tissue concentration values were derived. These values, together with the blood radioactivity concentrations and other blood factors, were used to produce ROI values for CBF, CBV, OEF and CMRO2 using established kinetic models (Frackowiak et al., 1980c; Alpert et al., 1988). The physiologic data (heart rate, F
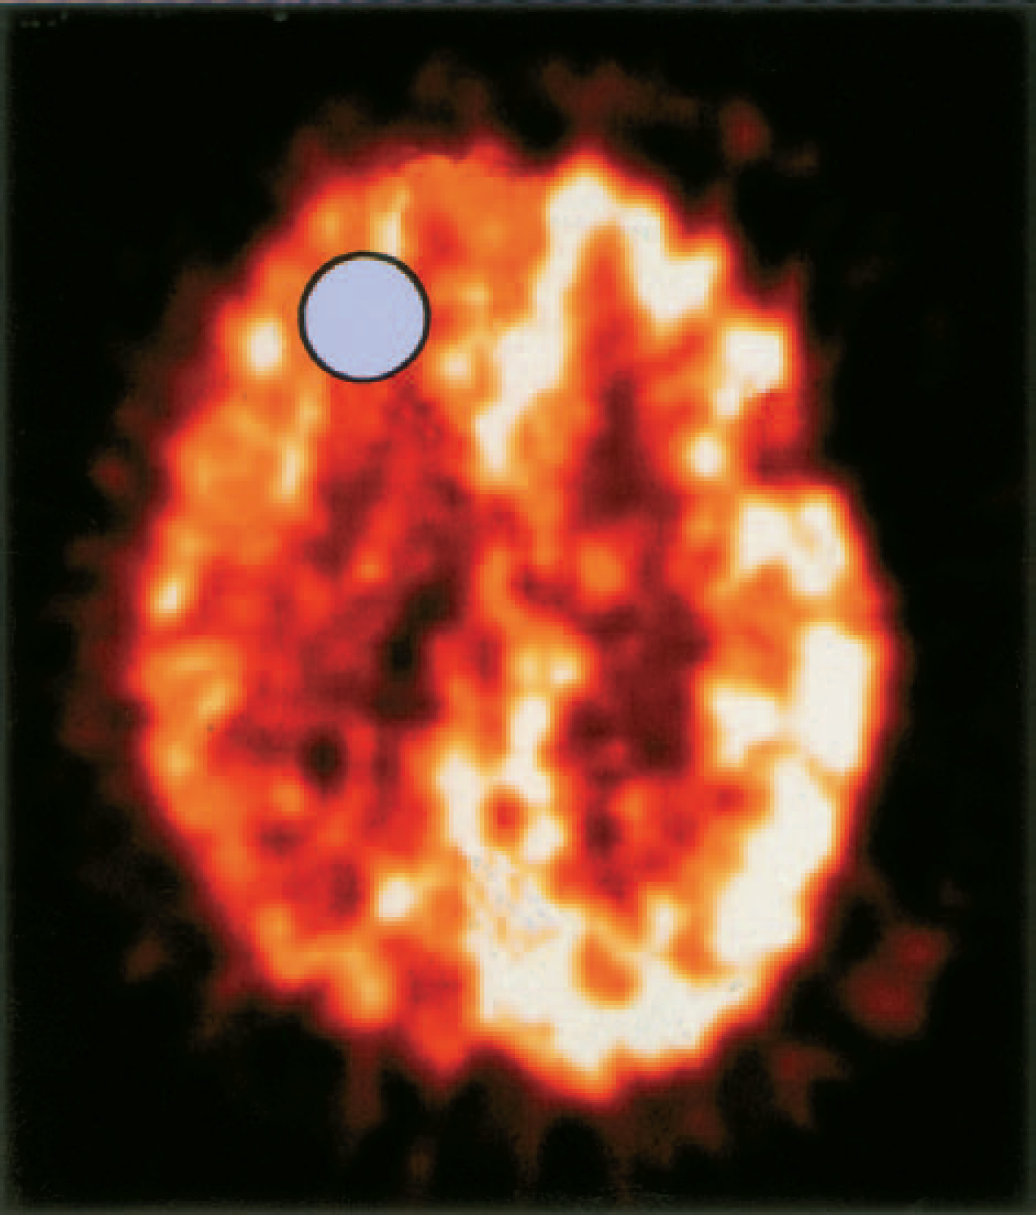
Positron emission tomography coregistration for identification of microdialysis catheter location. The region of interest is shown by the circle.
RESULTS
Demography
Seventeen patients (11 male and 6 female) with severe head injury were studied with microdialysis and PET. The mean (± SDs) age of the patients was 34 (± 15) years (range: 16 to 66 years). The demographic data from the patients are shown in Table 1 and physiologic data are shown in Table 2. Ten volunteers (8 male and 2 female) with mean (± SD) age 45 (± 9) years (range: 29 to 59 years) were studied with PET to provide control data.
Demographic data for each patient at time of positron emission tomography scan, location of microdialysis catheter relative to lesion, time between injury and catheter insertion, time between catheter insertion and scan, and total duration of microdialysis monitoring
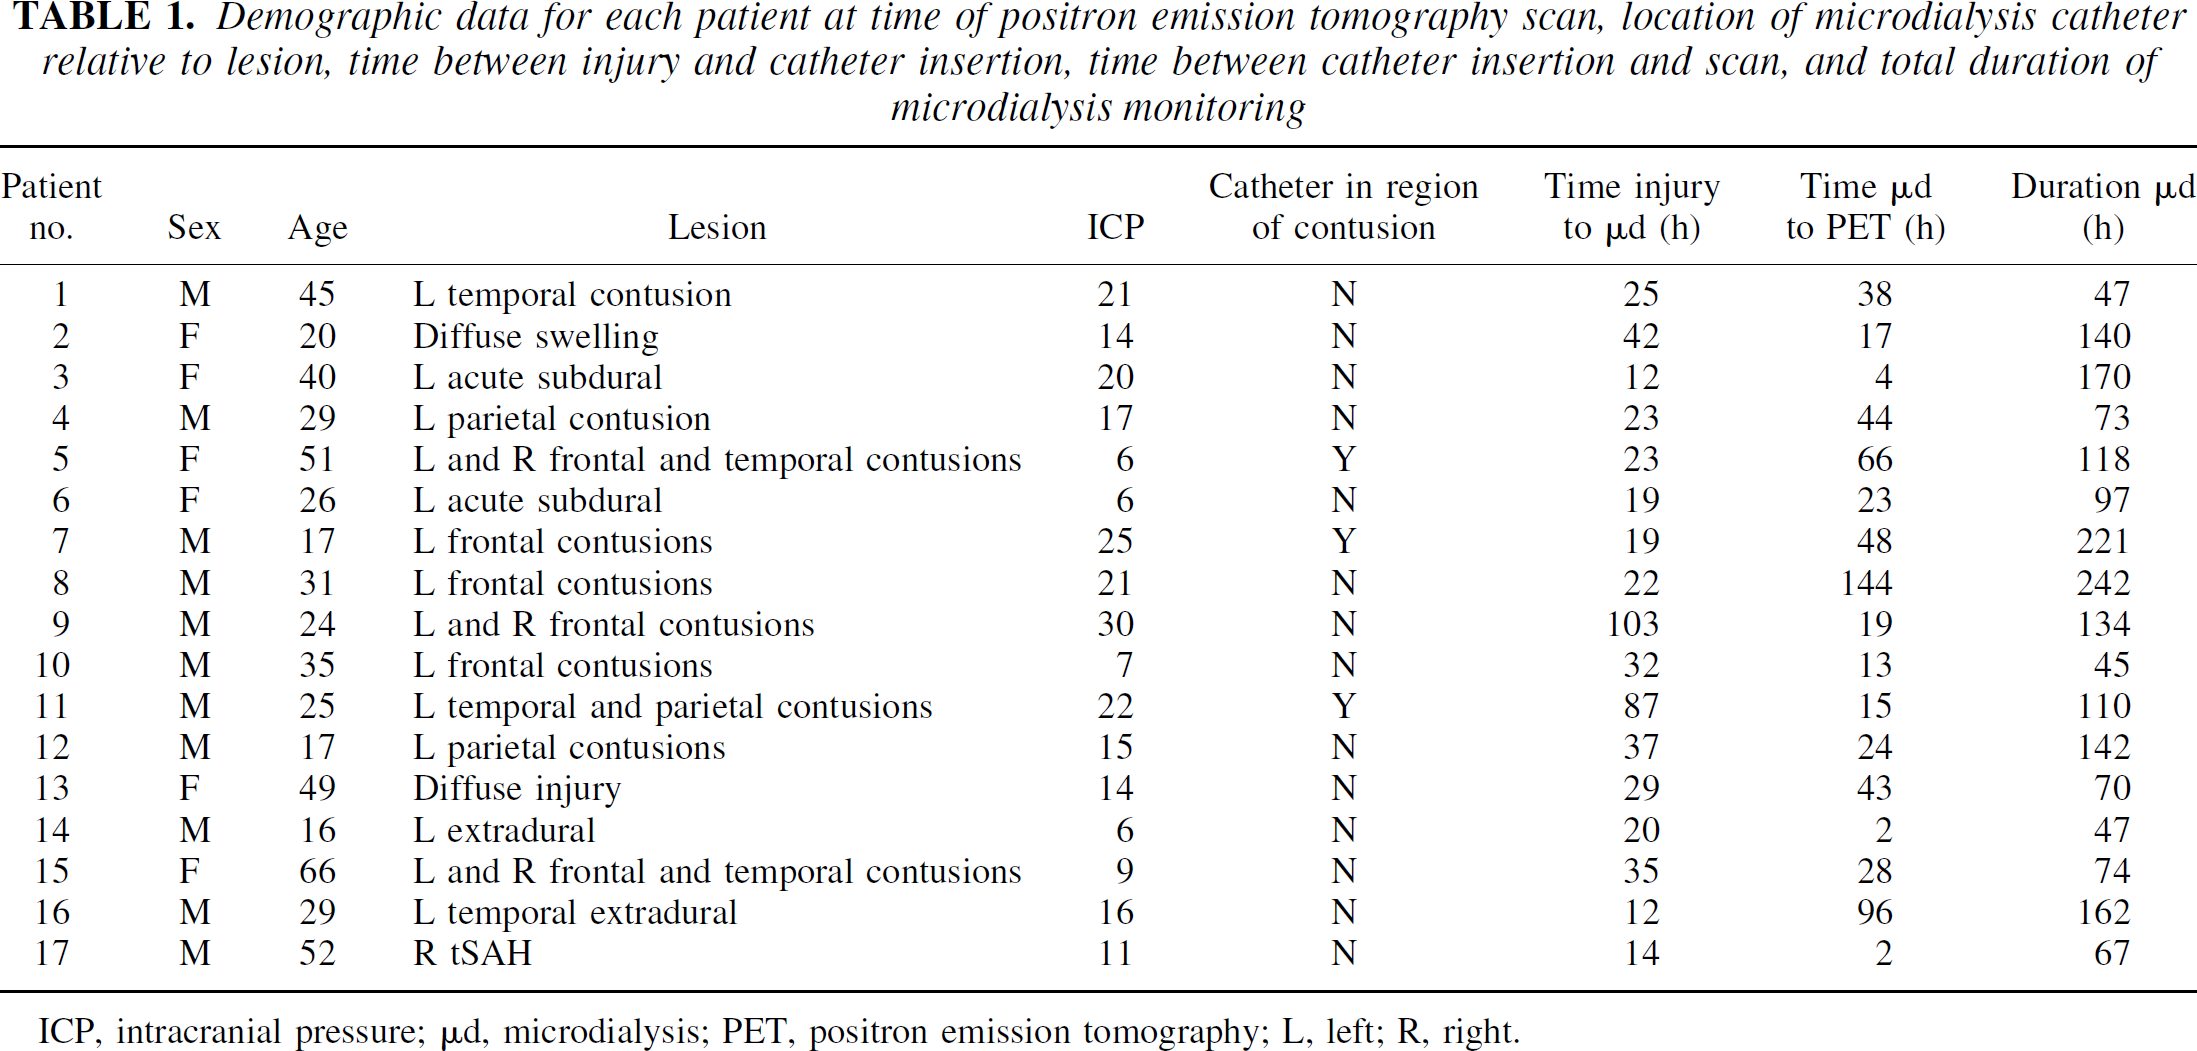
ICP, intracranial pressure; μd, microdialysis; PET, positron emission tomography; L, left; R, right.
Physiologic baseline data (mean and SD) for all patients
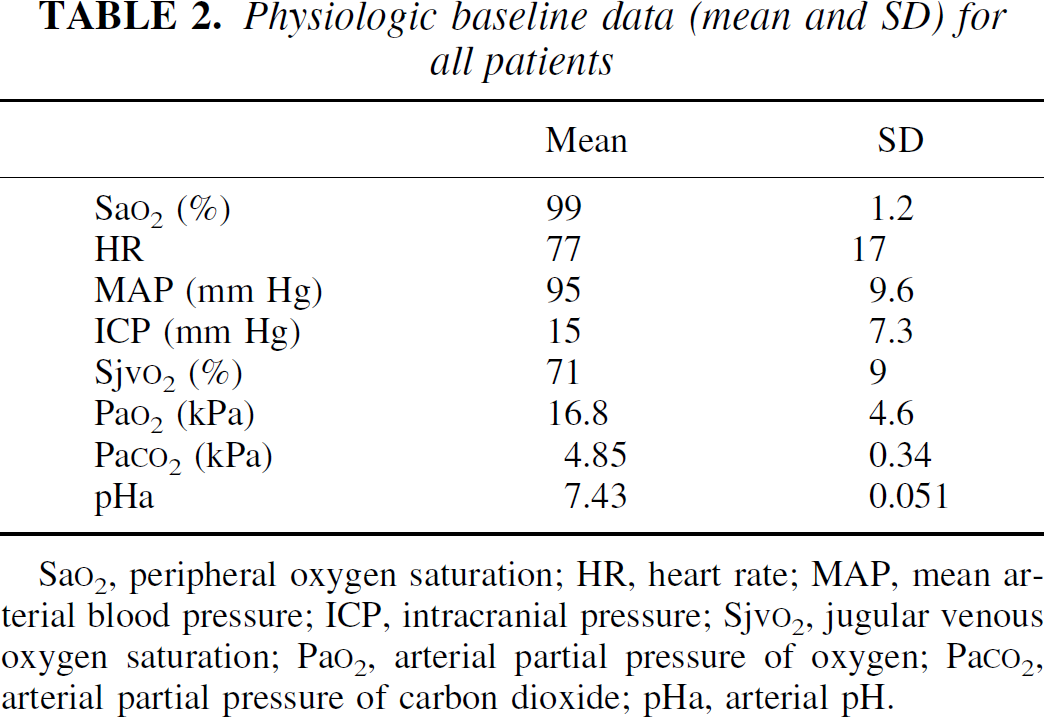
Sa
Microdialysis results
During PET scanning
The results for the cerebral and peripheral catheters showed low cerebral glucose concentrations (mean [± SD] of 1.64 ± 1.04 mmol/L) compared with peripheral glucose concentrations (mean 5.23 ± 2.69 mmol/L), high cerebral lactate concentrations (mean 4.0 ± 1.92 mmol/L) compared with peripheral lactate concentrations (mean 2.52 ± 1.79 mmol/L), high cerebral L/P ratios (mean 26.3 ± 8.1) compared with peripheral L/P ratios (mean 16.5 ± 8.0), and a wide variation in cerebral (mean 13.4 ± 12.8 mmol/L) and peripheral (mean 22.4 ± 33.5 mmol/L) glutamate concentrations.
Comparison of peripheral and cerebral microdialysis parameters revealed a good correlation between peripheral glucose and cerebral glucose (r = 0.69, P = 0.004), but no relation between peripheral lactate and cerebral lactate (r = 0.06, P = 0.84), peripheral pyruvate and cerebral pyruvate (r = −0.14, P = 0.59) and peripheral L/P ratio and cerebral L/P ratio (r = 0.047, P = 0.86).
Comparison of cerebral microdialysis substrates and metabolites showed a good correlation between cerebral lactate and cerebral pyruvate (r = 0.74, P = 0.001), a trend between cerebral glutamate and cerebral L/P ratio (r = 0.42, P = 0.092), and a weak relation between cerebral glutamate and cerebral lactate (r = 0.32, P = 0.22) that did not achieve significance. There was no relation between the other parameters.
Other microdialysis data
The overall microdialysis data monitoring compared with the microdialysis recordings determined during the PET scans are shown in Table 3. Adverse clinical events, notably secondary insults such as hypoxia and intracranial hypertension, were associated with derangements in the microdialysis measurements, with the demonstration of periods of improving (increase in glucose, decrease in L/P ratio, and increase in glutamate) and deteriorating metabolism (decrease in glucose, increase in the L/P ratio and decrease in glutamate).
Microdialysis data for each patient showing overall data for duration of monitoring (mean, min, max) compared with baseline data obtained during positron emission tomography scans
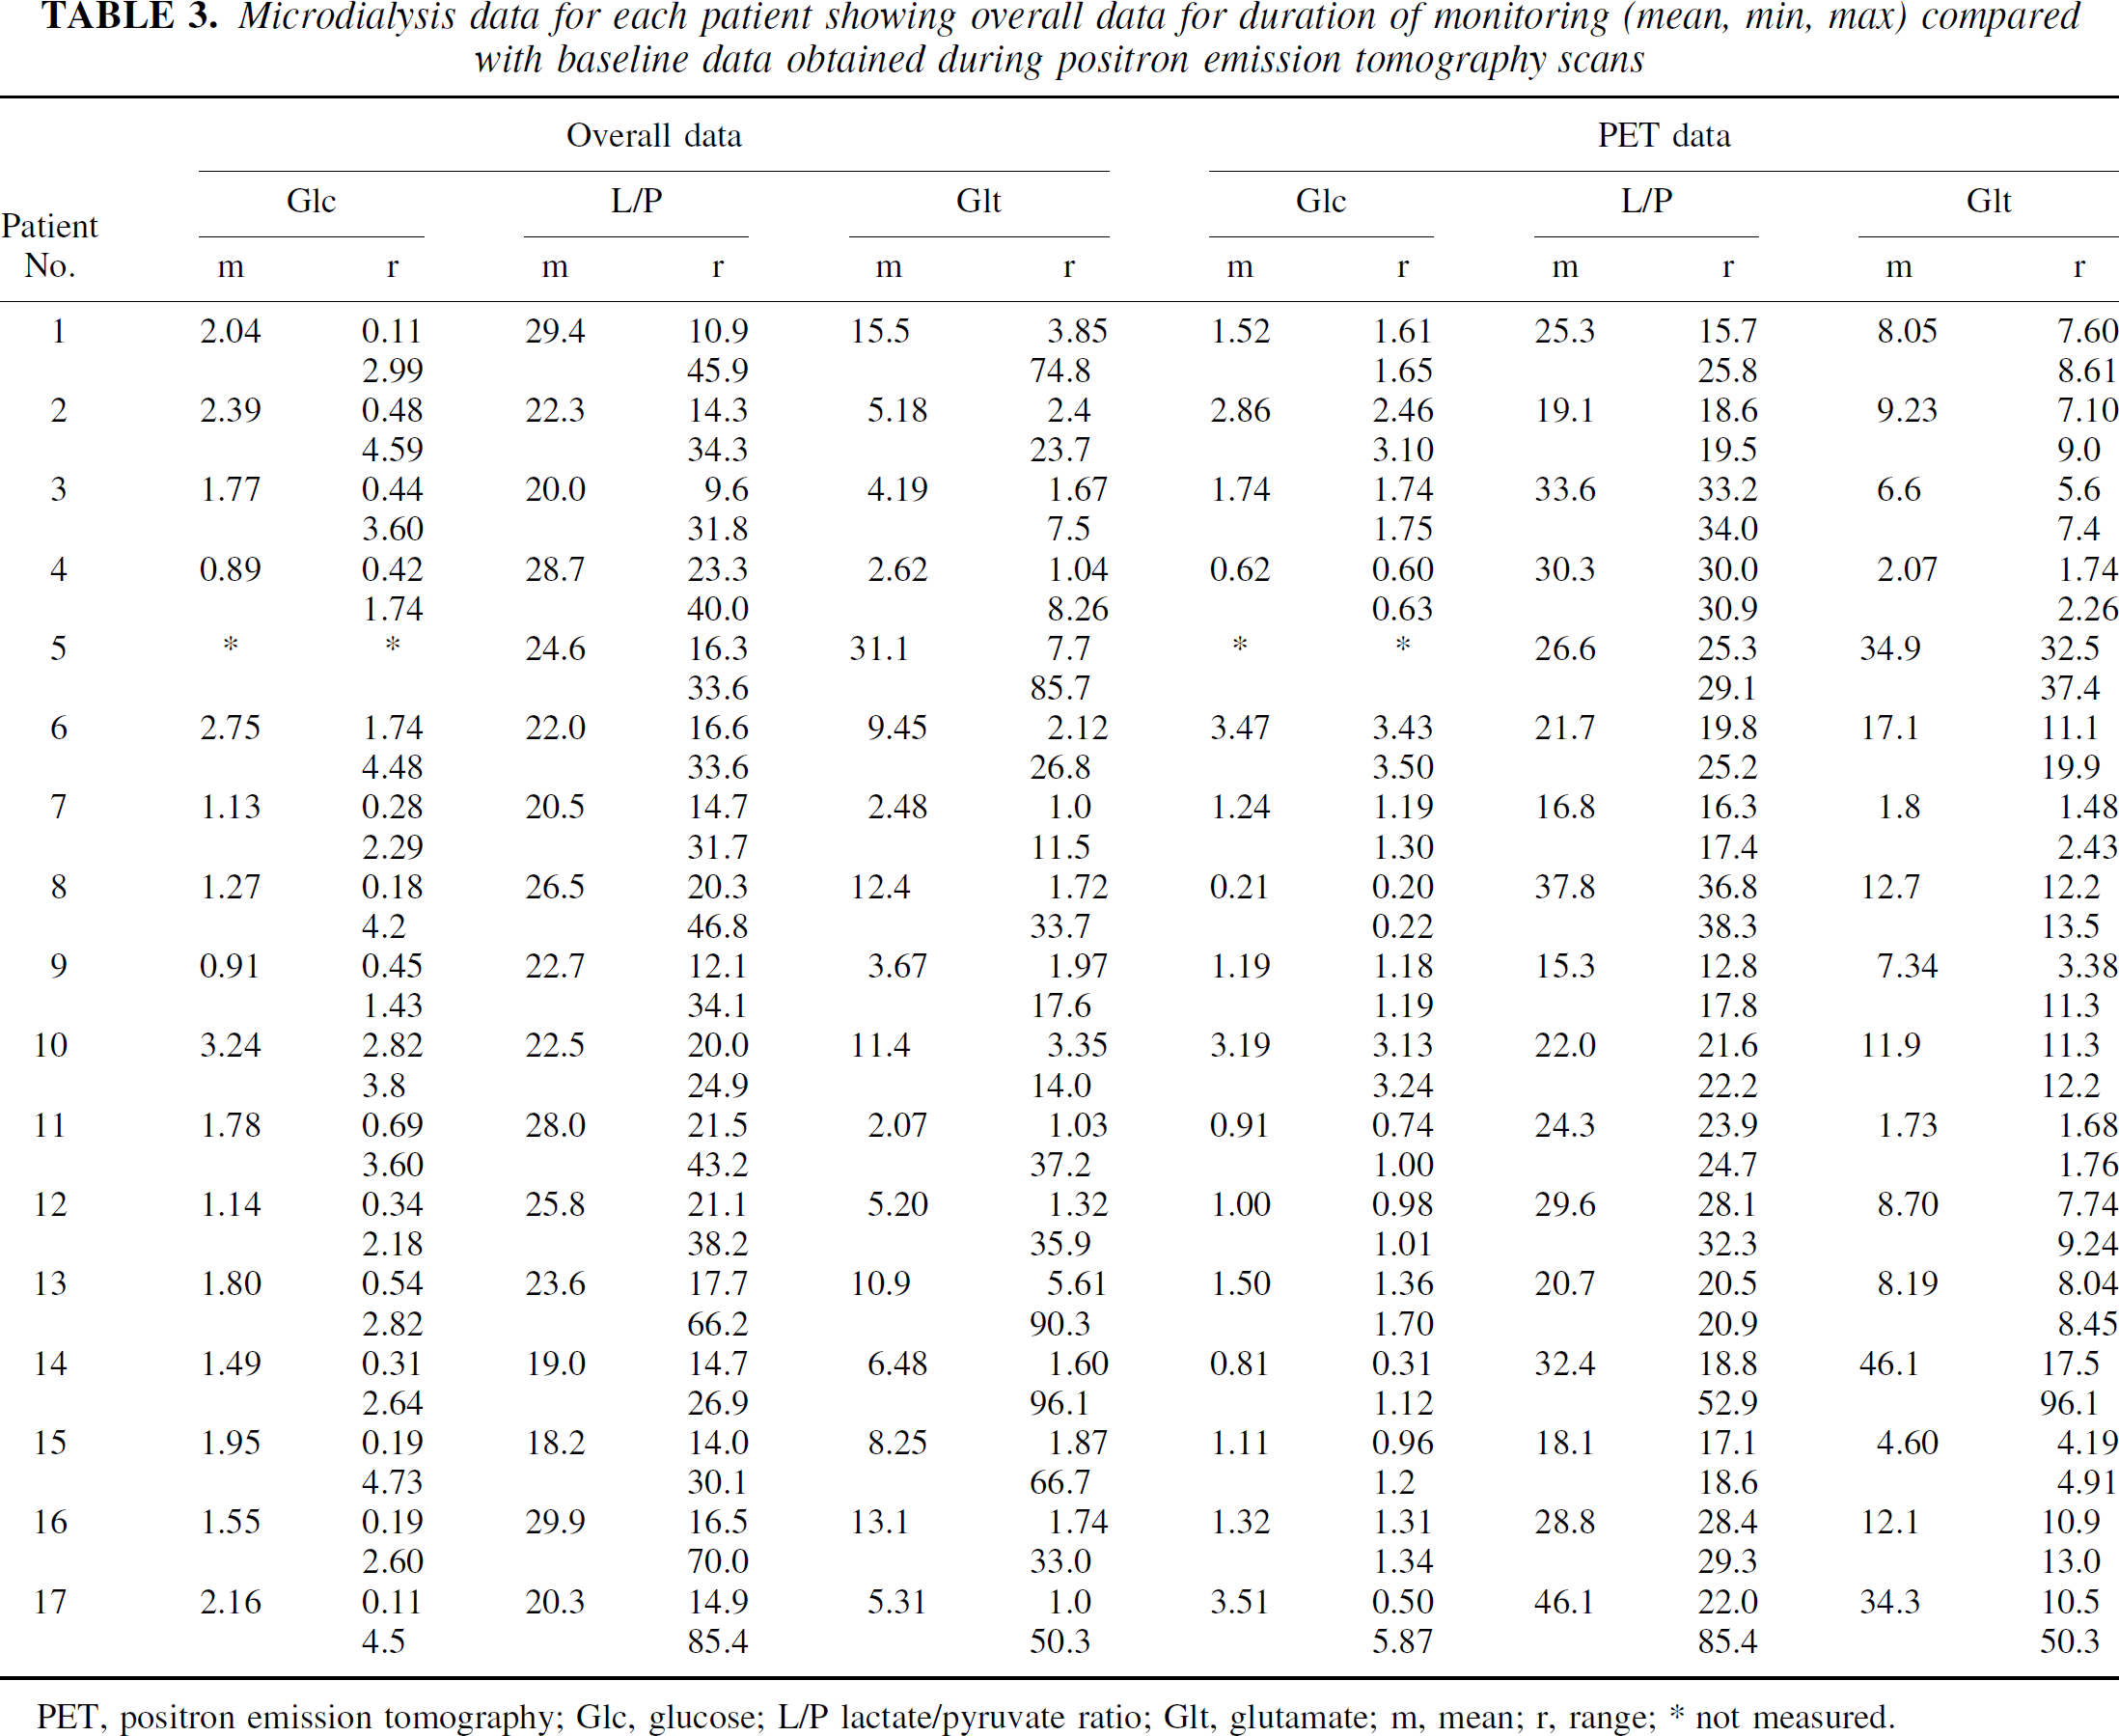
PET, positron emission tomography; Glc, glucose; L/P lactate/pyruvate ratio; Glt, glutamate; m, mean; r, range; * not measured.
PET results
The PET results for the patients showed a mean (± SD) CBF of 27 ± 7.5 mL · 100 g−1 · min−1, CBV of 0.03 ± 0.01, OEF of 0.41 ± 0.10, and CMRO2 of 68 ± 16 μmol · 100 g−1 · min−1. Only 2 patients had CBF less than 18 mL · 100 g−1 · min−1, and no patients had OEF greater than 70%. Using equivalent frontal regions of interest in the controls showed CBF values (mean ± SD) of 27 ± 3.4 mL · 100 g−1 · min−1, CBV of 0.03 ± 0.01, OEF of 0.42 ± 0.03, and CMRO2 of 92 ± 10.5 μmol · 100 g−1 · min.
PET-microdialysis correlation
The baseline PET and microdialysis data were compared to determine whether there was an association between image derived blood flow and metabolic data, and the extracellular chemistry (Table 4). There was a significant relation between the OEF and L/P ratio (r = 0.69, P = 0.002, Bonferroni correction) (Fig. 2). There were no significant relations between CBF, CBV, and CMRO2, and the microdialysis parameters.
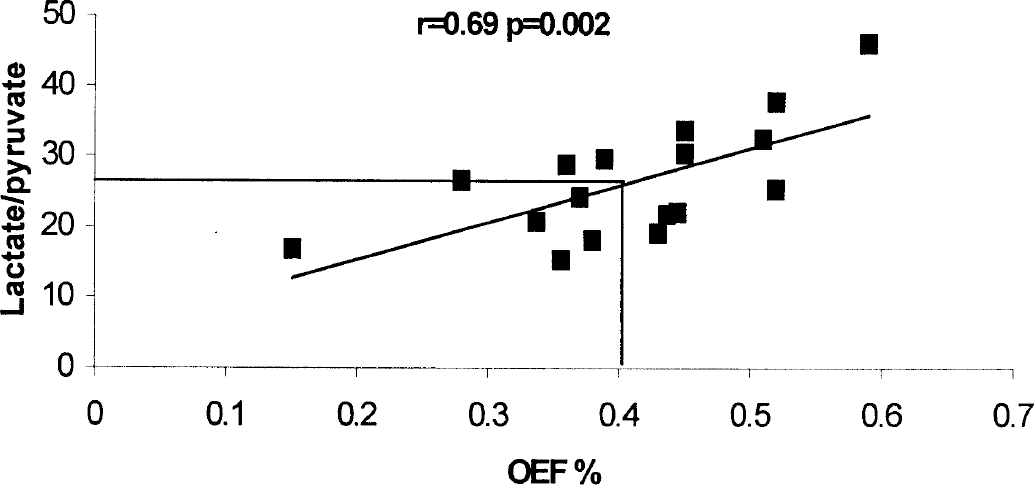
Relation between oxygen extraction fraction (OEF) and cerebral microdialysis parameters in 17 patients. There was a significant correlation between the lactate/pyruvate (L/P) ratio and OEF. Note that an OEF of 0.4 corresponded to a L/P ratio of 26, 25 being regarded as the upper limit of normal. The r value is the Spearman coefficient.
Correlation between positron emission tomography and microdialysis parameters cerebral blood flow, substrate delivery, and metabolism
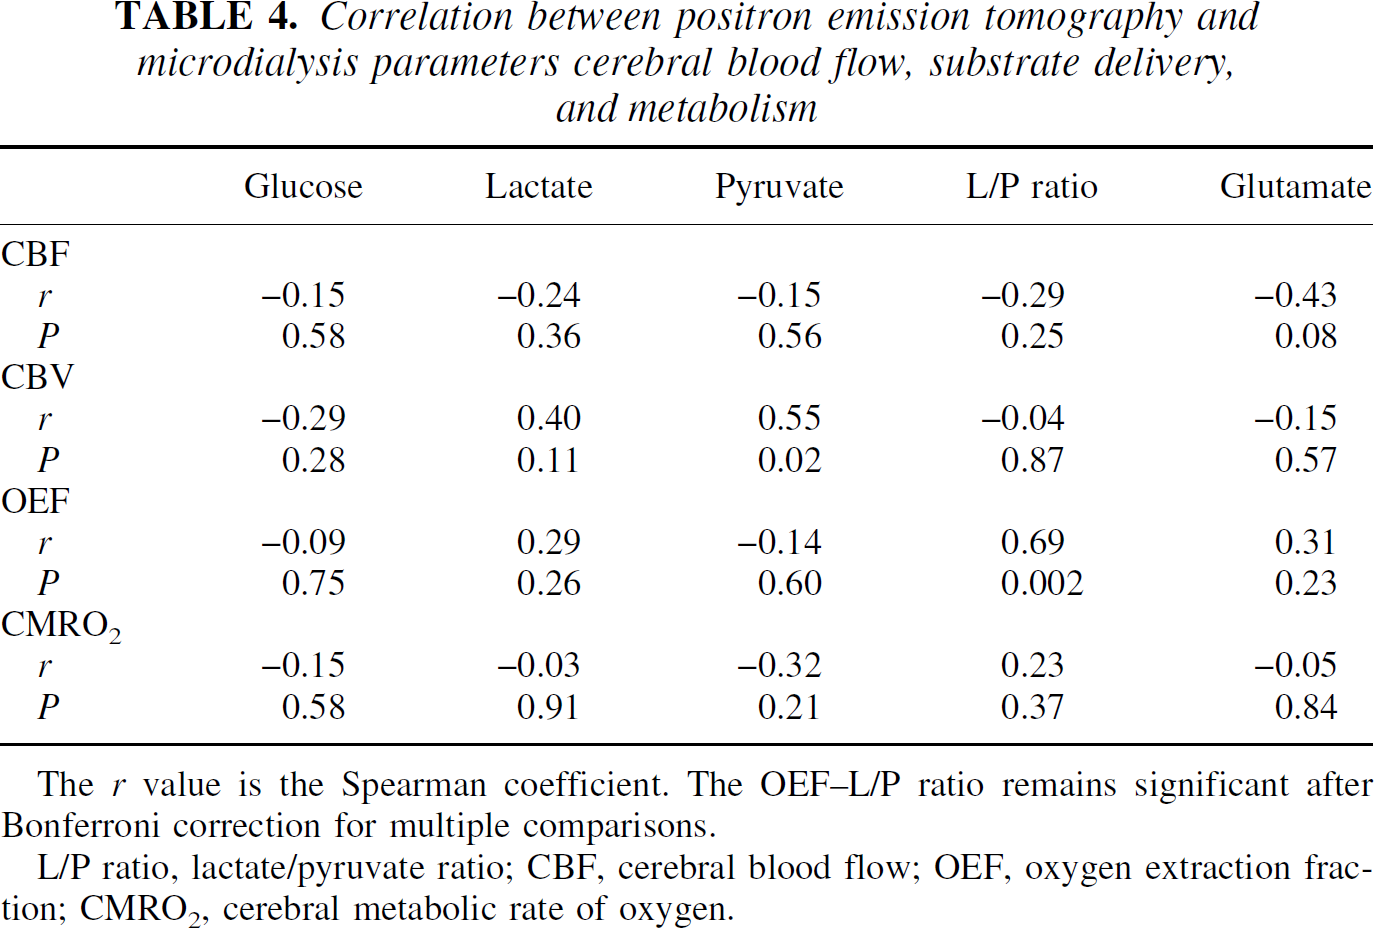
The r value is the Spearman coefficient. The OEF-L/P ratio remains significant after Bonferroni correction for multiple comparisons.
L/P ratio, lactate/pyruvate ratio; CBF, cerebral blood flow; OEF, oxygen extraction fraction; CMRO2, cerebral metabolic rate of oxygen.
Hyperventilation
Hyperventilation was performed in 13 patients and was tolerated in all cases (Sjv
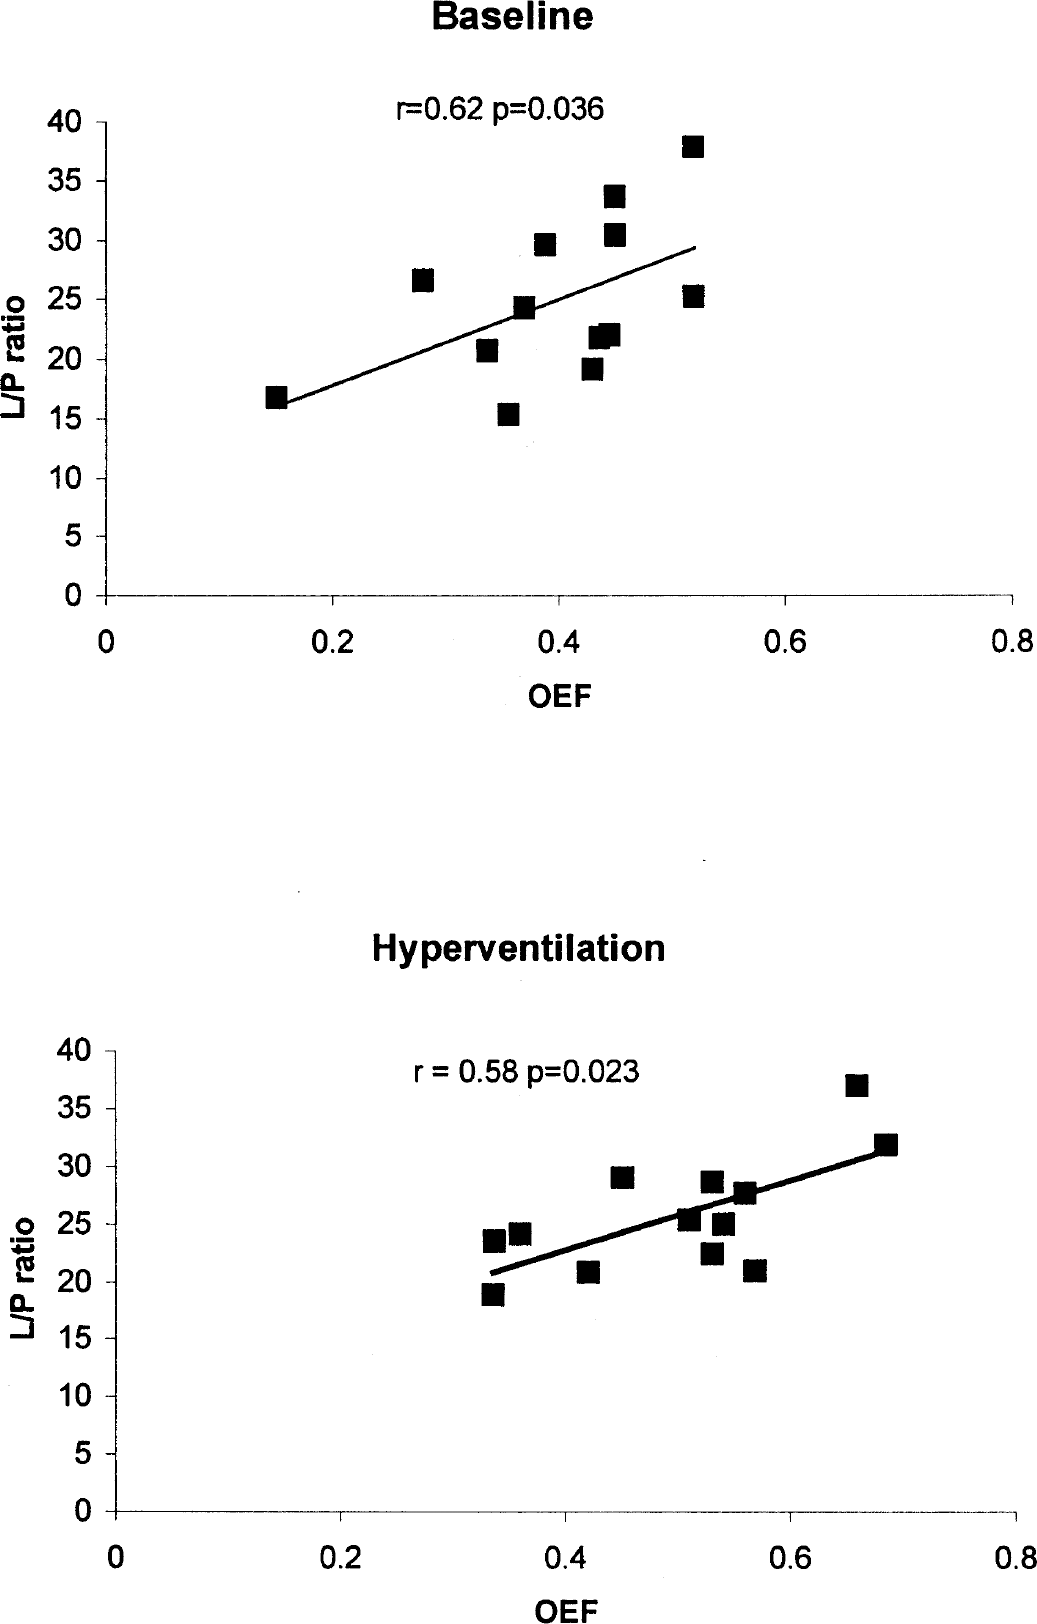
Relation between oxygen extraction fraction (OEF) and lactate/pyruvate (L/P) ratio at baseline and after hyperventilation in 13 patients. The r value is the Spearman coefficient.
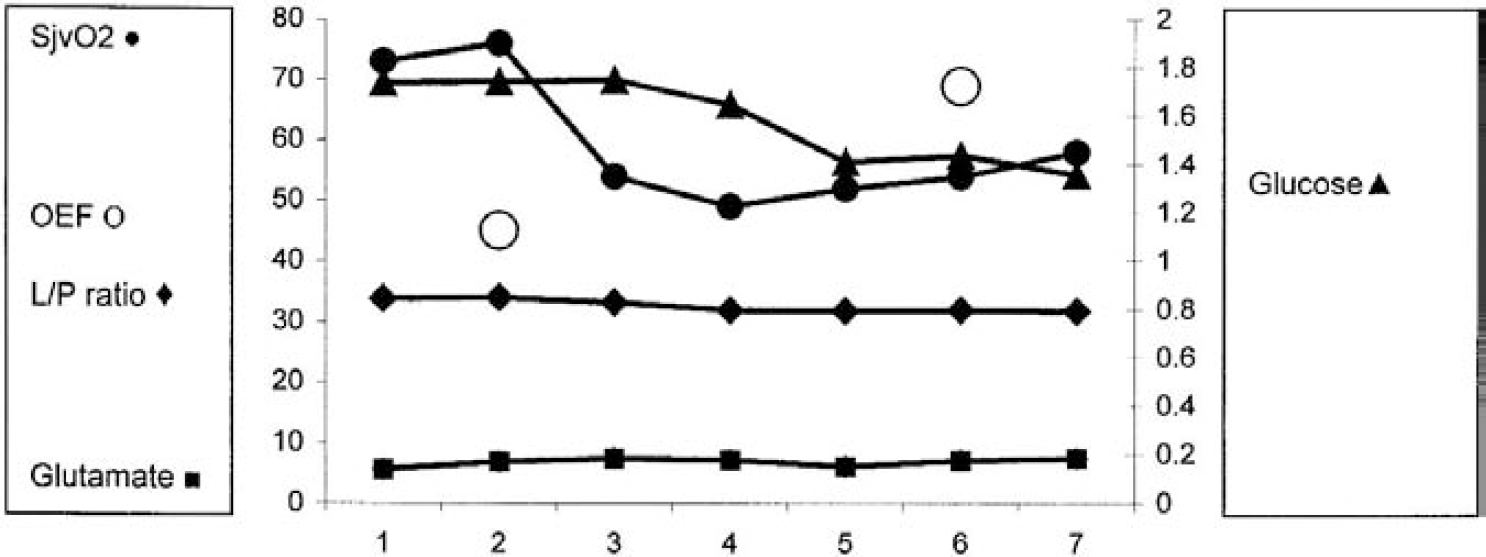
Patient 3. Effect of hyperventilation on microdialysis and positron emission tomography parameters showing increase in oxygen extraction fraction (OEF; %), reduction in jugular venous oxygen saturation (%), reduction in glucose (mmol/L), and no change in the lactate/pyruvate ratio or glutamate (umol/L). Each integer on the horizontal axis (1–7) represents a 20-minute epoch. Hyperventilation was performed at epoch 2. of lactate, suggesting that pyruvate is metabolized to lactate and that anaerobic metabolism is occurring in these patients despite the OEF being within the normal range. All patients with high glutamate levels had high L/P ratios, although the converse was not true.
Effect of hyperventilation (n = 13); results expressed as mean ± SD
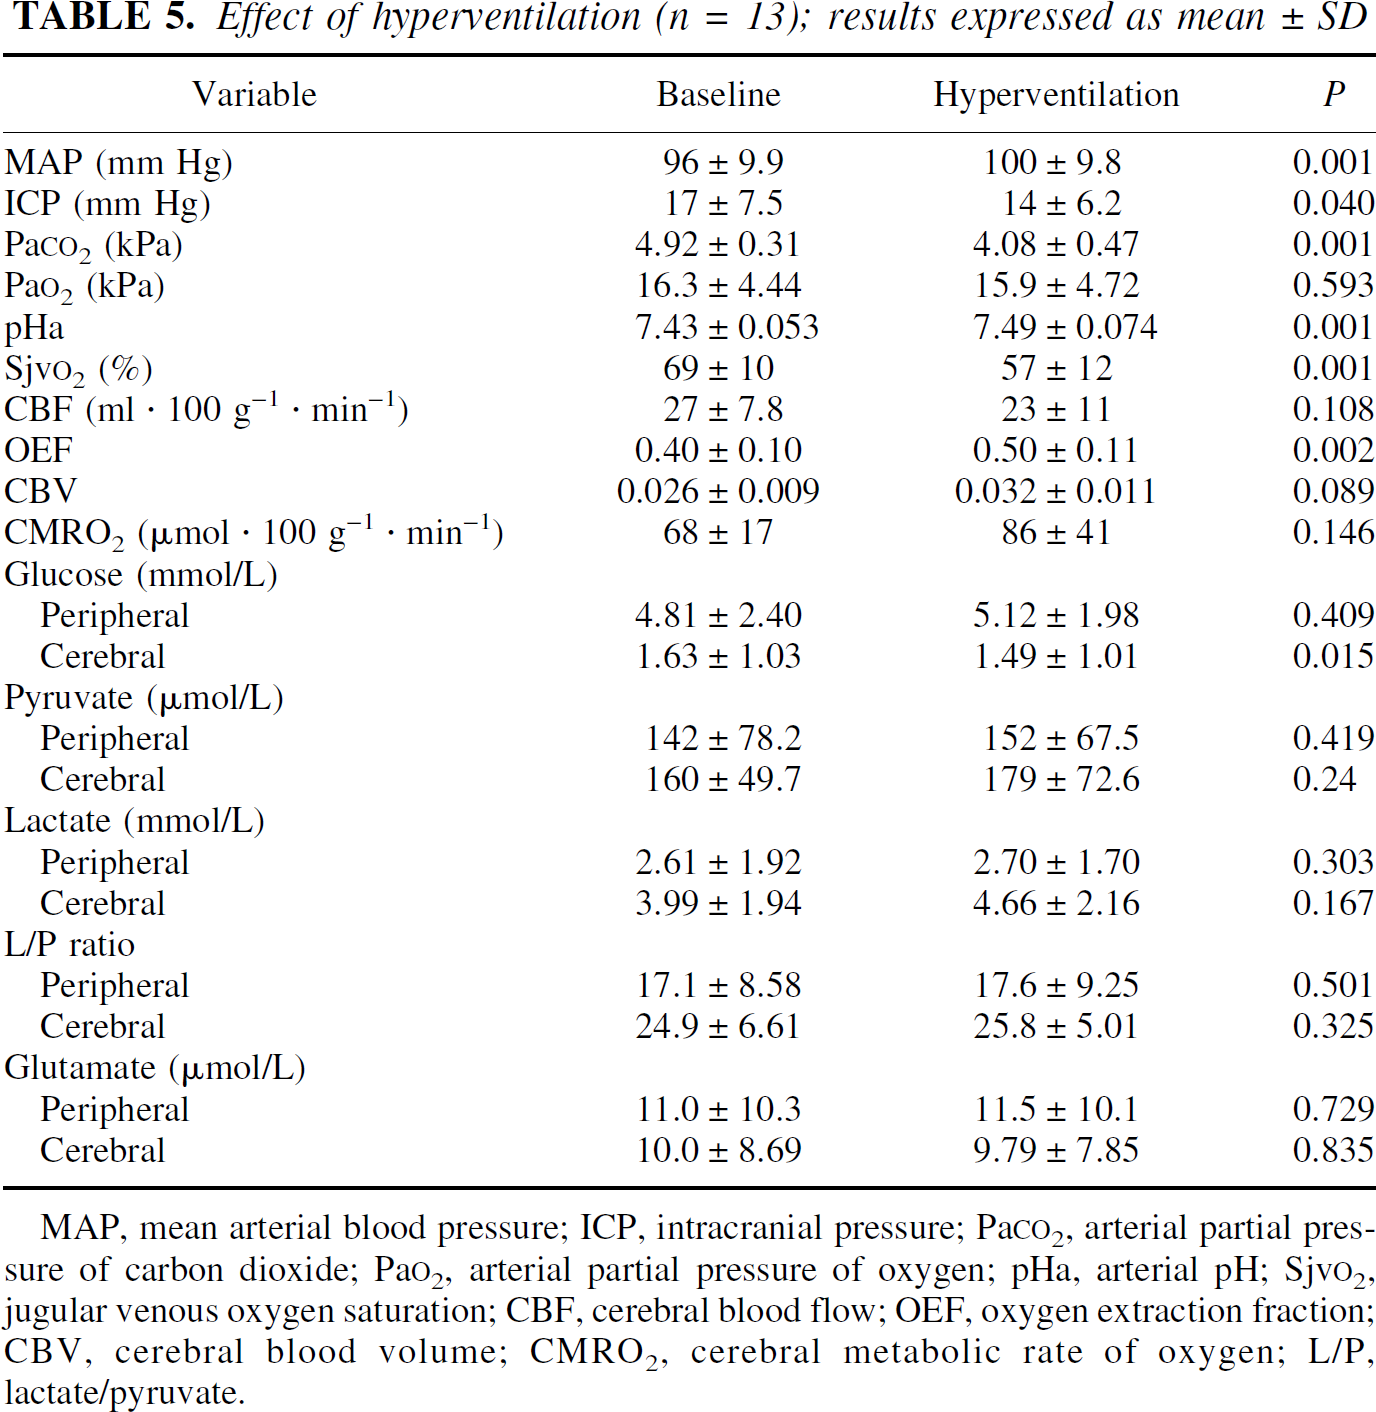
MAP, mean arterial blood pressure; ICP, intracranial pressure; Pa
DISCUSSION
The objective of this study was to investigate the relation between fundamental metabolic parameters (CBF, OEF, glucose, L/P ratio, and glutamate) that relate to the pathophysiology of head injury. The results confirm that combining these techniques is feasible, although logistically complex (Enblad et al., 1996). Continuation of intensive care during PET scanning is possible using the same principles of ventilatory management and hemodynamic monitoring as in the intensive care unit (Menon et al., 1997). The application of small, portable microdialysis pumps and mobile bedside chemical analyzers has enabled microdialysis to continue when patients are transferred from the intensive care unit to the operating theater or scanning suite.
Microdialysis analysis and control data
Microdialysis was performed during the PET imaging using the same perfusion rate (0.3 μL/min) as on the intensive care unit. This enabled the microdialysis recovery rate (i.e., the microdialysis concentration as a percentage of the true extracellular concentration) to remain constant and relatively high. We have previously shown that the recovery rate is approximately 70% for glucose, pyruvate, lactate, and glutamate using this flow rate with 10-mm-length membrane microdialysis catheters (Hutchinson et al., 2000d). The L/P ratio is independent of in vivo recovery (Persson and Hillered, 1996). However, slow flow rates have the disadvantage in that a relatively small volume of dialysate (6 μL at 0.3 μL/min) is obtained during 20-minute sampling. This is sufficient for analysis using the CMA600 analyzer but does not produce enough volume for delayed off-line analysis of other chemicals—for example, other amino acids and urea—which may be used as an internal reference for monitoring of in vivo probe performance (Ronne-Engstrom et al., 2001). Increasing the sampling time to increase the dialysate volume would have resulted in decreased time resolution. Many studies with microdialysis monitoring on intensive care units have used a 1-hour sampling time for logistical reasons. Although overall this is of sufficient resolution to capture events, there is a concern that rapid and brief insults may be missed. To investigate this, we have sampled patients during aneurysm surgery with 10-minute vial changes demonstrating transient biochemical changes (Hutchinson et al., 1999a, 2000b). Other groups are developing microdialysis analysis systems without vials allowing continuous monitoring of glucose and lactate concentrations (Strong et al., 2001).
Concerns regarding damage to the brain caused by microdialysis catheters have been addressed in several studies. Early animal studies demonstrated uncoupling of regional CBF from local brain glucose metabolism for the first 24 hours after probe insertion (Benveniste et al., 1987; Benveniste, 1989) and reticular fiber deposition, and gliosis after several days, which may affect the performance of the catheter (Benveniste and Diemer, 1988). However, this was probably a consequence of the damage caused by the relatively large and nonsterile devices available at the time. Other studies showed that recovery rates of substances stabilize after 30 minutes, with histology demonstrating only occasional microhemorrhages (Benveniste and Diemer, 1988) and the blood brain-barrier remaining intact (Major et al., 1990). In humans, our own data and those from the literature (Hillered et al., 1990; Meyerson et al., 1990) indicate a time from catheter implantation to baseline to be between 20 and 60 minutes, with a tendency for glutamate to take longer to reach baseline than glucose, pyruvate, and lactate. The sterile CMA 70 catheter designed for clinical use has been evaluated by Whittle et al. in sheep brains revealing minimal or no disturbance to the cerebral parenchyma as a result of microdialysis catheter implantation (Whittle et al., 1998). We have examined the brain of a patient at postmortem who died of cardiac complications after a subarachnoid hemorrhage and found no evidence of injury induced by the microdialysis catheter compared with the tract created by an external ventricular drain (Hutchinson et al., 1999b).
One of the other potential problems concerning microdialysis is determining whether the catheter is monitoring gray or white matter. This is influenced by the depth of the catheter (constant across patients using the cranial access device) and the relation of the catheter to sulci. In the present study, we are monitoring predominantly from white matter. Data from the literature indicate that the response to ischemia in gray and white matter are different (Hillered et al., 1990; Dohmen et al., 2001). The development of the CMA gold-tipped microdialysis catheter will assist in determining the exact location of the microdialysis catheter on the CT scan.
The cerebral microdialysis results are similar to those of previous studies in head injury (Persson and Hillered, 1992; Zauner et al., 1997; Goodman et al., 1999; Hutchinson et al., 2000d) demonstrating low cerebral glucose and high cerebral lactate relative to peripheral chemistry and controls (frontal cortex catheters in patients with posterior fossa lesions) (Reinstrup et al., 2000), and a wide variation in glutamate levels (Table 6). The findings are in keeping with the high metabolic activity of the brain of head-injured patients.
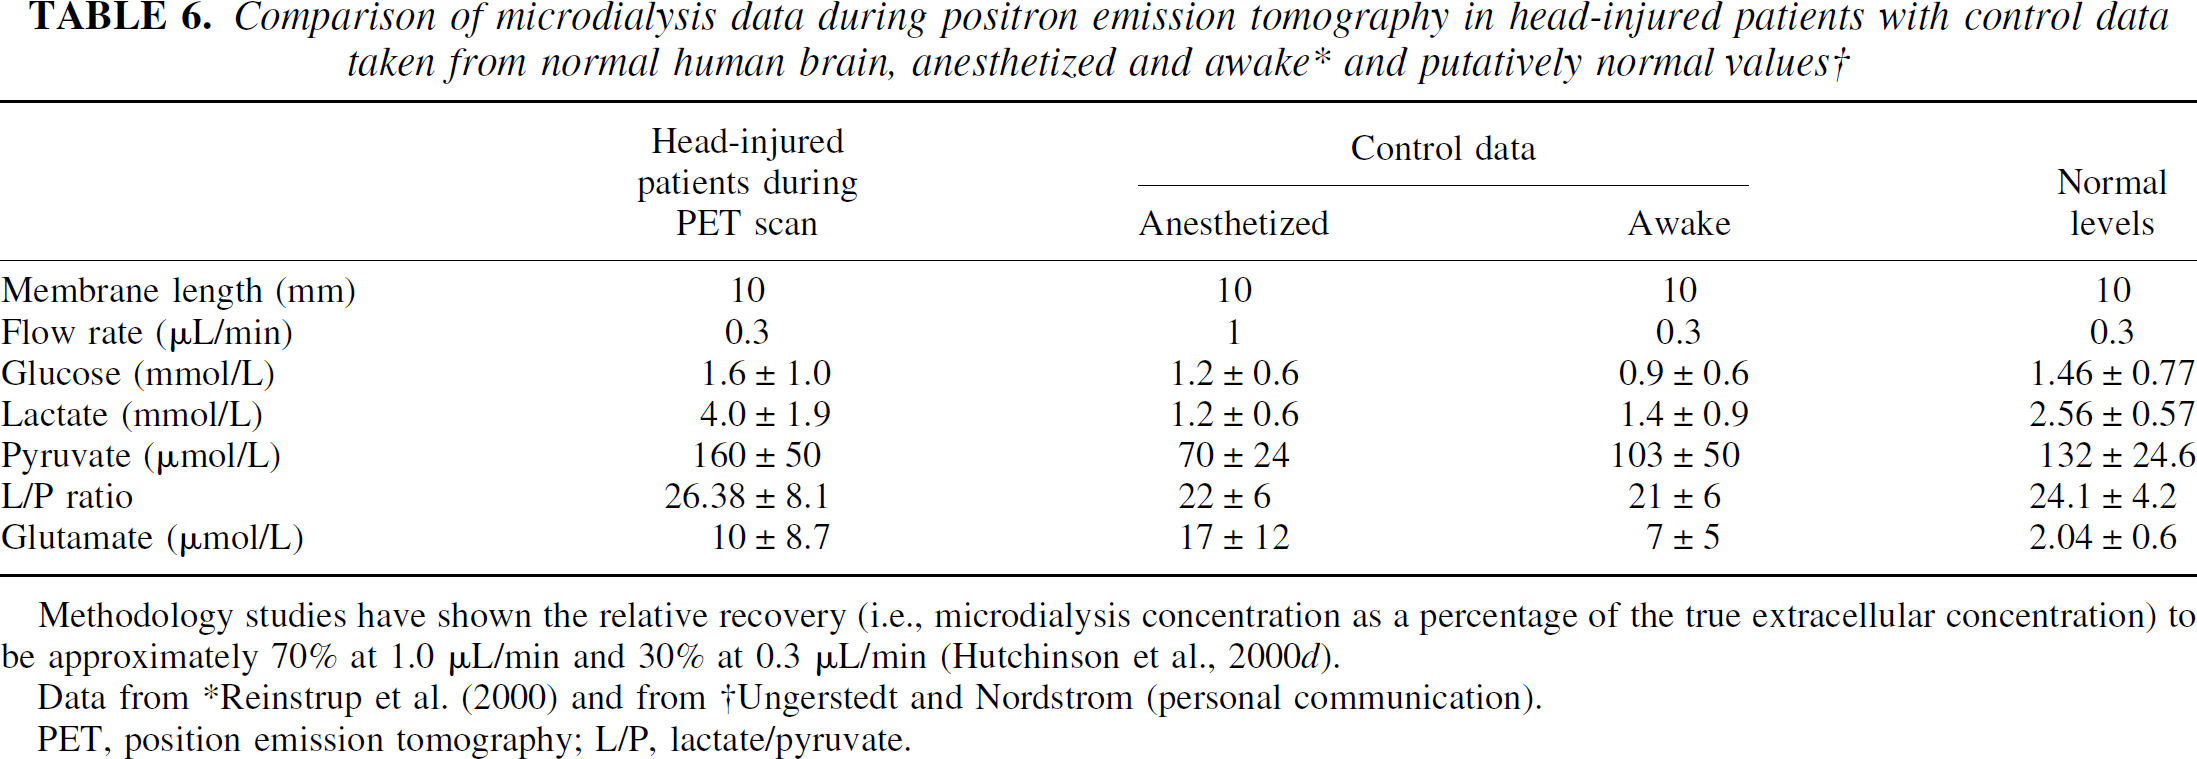
Methodology studies have shown the relative recovery (i.e., microdialysis concentration as a percentage of the true extracellular concentration) to be approximately 70% at 1.0 μL/min and 30% at 0.3 μL/min (Hutchinson et al., 2000d).
Data from *Reinstrup et al. (2000) and from †Ungerstedt and Nordstrom (personal communication).
PET, position emission tomography; L/P, lactate/pyruvate.
In the patients with head injury, there was no relation between peripheral and cerebral chemistry, with the exception of glucose. The results suggest that cerebral extracellular glucose levels are a reflection of systemic levels and the metabolic rate of glucose. Cerebral glucose did not correlate with cerebral lactate and pyruvate. Although microdialysis measures the concentration and not production of substances, the data do indicate that high levels of pyruvate were associated with high levels of lactate, suggesting that pyruvate is metabolized to lactate and that anaerobic metabolism is occurring in these patients despite the OEF being within the normal range. All patients with high glutamate levels had high L/P ratios, although the converse was not true.
Although the main objective of this study was to compare microdialysis with PET measurements during the PET scans, this period of microdialysis monitoring represented only a small proportion of the total microdialysis monitoring for these patients. Comparison of the overall microdialysis data with that during the PET scan demonstrates that wide variations are seen in the concentration of substrates and metabolites. To proceed from the neuro-intensive care unit to PET, patients had to be stable in terms of physiologic parameters, and this is reflected in the microdialysis data. We have demonstrated a relation between microdialysis results and outcome in patients with head injury, demonstrating the importance of the L/P ratio and wide variation in glutamate levels (Hutchinson et al., 2000a). Our studies and those from other centers are currently assessing the ability of microdialysis to assist in the management of individual patients; in particular, the effects of interventions on chemistry are being addressed.
PET control data and effect of sedation
The PET control data (nonsedated) obtained from the volunteer studies using equivalent frontal regions of interest revealed values are similar to those from the head-injury patients. Normal OEFs in our laboratory agree with those of other authors (Leenders et al., 1990) and are defined as approximately 0.4. In a PET-microdialysis primate middle cerebral artery occlusion study from Uppsala, the baseline OEF was determined as 0.48 ± 0.11 (penumbra), severe ischemia and reperfusion (0.55 ± 0.066), and severe ischemia with no reperfusion (0.44 ± 0.033) (Enblad et al., 2001). The effect of sedation on microdialysis and PET results is difficult to determine. The Lund study (Reinstrup et al., 2000) of control microdialysis values indicated that overall there were no significant differences between anesthetized and awake patients with the exception of glutamate (Table 6). In terms of blood flow and metabolic data, propofol has been shown to induce metabolic depression and reduction in CBF (Alkire et al., 1995; Menon, 2001).
Microdialysis-PET correlation
There has been a previous clinical study from Uppsala combining PET with microdialysis (Enblad et al., 1996) showing that the presence of regional ischemia within the region of the microdialysis probe is associated with increased levels of energy-related metabolites and excitatory amino acids derived from microdialysis. The same authors proceeded to examine the effects of middle cerebral artery occlusion and reperfusion on microdialysis and PET parameters in primates (Enblad et al., 2001). This study demonstrated that in catheter regions with severe ischemia (defined as CMRO2 less than 60% that of the contralateral hemisphere), high and broad peaks of L/P ratio, hypoxanthine, and glutamate occurred that persisted in cases of both reperfusion and no reperfusion. In penumbral regions, there were only transient increases during middle cerebral artery occlusion that returned to baseline. We have performed a study comparing PET with a multiparameter sensor (Neurotrend) demonstrating no correlation in absolute values between brain tissue oxygen and PET-derived oxygen concentrations but a good correlation between changes in values induced by hyperventilation (Gupta et al., 2000).
We have attempted to further explore these relations, to determine the cross-correlation of ischemic thresholds and to interpret the results in terms of the pathophysiology of the injured brain. The comparison between PET and microdialysis parameters was made using a 20-mm ROI (by 9-mm thickness). Sampling from microdialysis catheters is within the order of a few millimeters from the membrane. A 20-mm ROI was selected as the optimum balance between restricting the ROI to tissue surrounding the probe while achieving optimal image statistics. As part of a study comparing PET with brain tissue oxygen sensors (Gupta et al., 2002) and in the present study, we attempted to apply ROIs of 10 mm, but because of increased scatter and consequently decreased signal-to-noise ratios, CBF, OEF, CBV, and CMRO2 could not be quantified with accuracy for these small regions.
There was no significant correlation between CBF and glucose, lactate, the L/P ratio, or glutamate. However, the majority (15/17) of patients had CBF values more than the threshold for ischemia (18 mL · 100 mg−1 · min−1) (Yonas et al., 1989), and significant correlations may therefore be seen in patients with critical ischemia.
There was a strong correlation between the OEF and L/P ratio but not with lactate, thus supporting the concept of measuring the L/P ratio in these patients in addition to lactate per se. An OEF of 0.4 corresponded to an L/P ratio of 26, 25 being regarded as the upper limit of normal (Persson et al., 1996; Reinstrup et al., 2000). Previous studies (Enblad et al., 1996) have indicated that in ischemia, increases in the OEF are related to increases in the L/P ratio. Our data indicate that OEF values in the “nonischemic” range (i.e., less than 70%) are also associated with increases in the L/P ratio, which as an indicator of increased glycolysis with anaerobic metabolism suggests that the metabolic needs of the brain are not entirely covered by oxidative phosphorylation.
There was no significant relation between glutamate and OEF, with the majority of patients having normal glutamate despite an elevated OEF. However, in no patients did the OEF in the relevant ROI approach 75%, which is conventionally accepted as indicating ischemic tissue that is at risk of infarction (Sutton et al., 1990; Powers, 1992; Yundt and Diringer, 1997). CMRO2 demonstrated poor correlation with the microdialysis parameters.
In 1994, Pellerin and Magistretti reported that glutamate drives glycolysis in astrocytes, resulting in increased extracellular lactate, which can be used as a substrate for neurons in preference to glucose (Pellerin and Magistretti, 1994). The results of this study (from predominantly nonischemic frontal lobe), demonstrating high metabolic activity of the brain with low cerebral glucose and high cerebral lactate compared with the peripheral adipose tissue, no correlation between cerebral lactate and glucose, correlation between cerebral lactate and pyruvate, and the weak relation between high glutamate and high lactate, are compatible with their conclusion.
Effect of hyperventilation
Moderate short-term hyperventilation (reduction of arterial carbon dioxide from 4.92 ± 0.31 to 4.08 ± 0.47 kPa, increase in arterial pH 7.43 ± 0.053 to 7.49 ± 0.074) with preservation of the jugular venous oxygen saturation more than 50%, produced reduction in CBF and increase in OEF, but this appeared to be tolerated in the ROI. Although there was a reduction in the glucose supply, this was not sufficient to produce significant elevation of the L/P ratio or release of glutamate, and overall produced no deleterious effects on cerebral chemistry. However, no areas were sampled by microdialysis where the OEF exceeded 70%, and hyperventilation was only performed for the short-term duration of the scan. Longer periods and more vigorous hyperventilation may result in adverse chemical changes.
CONCLUSIONS
In conclusion, this study has demonstrated that combining microdialysis with PET in ventilated patients is feasible and safe. Relating chemistry to PET-derived metabolic data revealed a strong relation between the L/P ratio and OEF. The data showed that despite L/P ratios of greater than 25 (indicative of anaerobic metabolism), the OEF remained within the normal range. CBF did not significantly correlate with the microdialysis parameters. Moderate hyperventilation produced a reduction in cerebral glucose, but this did not translate into elevation of the L/P ratio or glutamate levels in patients in whom the Sjv
Further studies are indicated to determine how representative the values recorded from microdialysis catheters are in terms of larger regions (e.g., whole gyri and lobes). Targeting catheters using stereotaxy to abnormal regions defined by functional imaging will enable the pathophysiology of, for example, the progression of contusions to be evaluated.
Footnotes
Acknowledgements
The authors acknowledge the support of members of the Wolfson Brain Imaging Team (S. Downey, J. Jenkins, I. Kendall, L. Maskell, J. Mathews, H. Richards, and C. Turner) and collaboration of Professors U. Ungerstedt and R. Bullock. They thank Dr. R. Tasker for helpful discussion regarding the hyperventilation data and Dr. D. B. A. Hutchinson for supplying the cranial access device. Patents are pending on the design of the device, which is the subject of commercial development by Dr. Hutchinson and the authors (under the company name Technicam).