
Abstract
Activated microglia can be visualised using (R)-[11C]PK11195 (1-[2-chlorophenyl]-N-methyl-N-[1-methyl-propyl]-3-isoquinoline carboxamide) and positron emission tomography (PET). In previous studies, various methods have been used to quantify (R)-[11C]PK11195 binding. The purpose of this study was to determine which parametric method would be best suited for quantifying (R)-[11C]PK11195 binding at the voxel level. Dynamic (R)-[11C]PK11195 scans with arterial blood sampling were performed in 20 healthy and 9 Alzheimer's disease subjects. Parametric images of both volume of distribution (Vd) and binding potential (BP) were obtained using Logan graphical analysis with plasma input. In addition, BP images were generated using two versions of the basis function implementation of the simplified reference tissue model, two versions of Ichise linearisations, and Logan graphical analysis with reference tissue input. Results of the parametric methods were compared with results of full compartmental analysis using nonlinear regression. Simulations were performed to assess accuracy and precision of each method. It was concluded that Logan graphical analysis with arterial input function is an accurate method for generating parametric images of Vd. Basis function methods, one of the Ichise linearisations and Logan graphical analysis with reference tissue input provided reasonably accurate and precise estimates of BP. In pathological conditions with reduced flow rates or large variations in blood volume, the basis function method is preferred because it produces less bias and is more precise.
Introduction
Microglial cells are the resident tissue macrophages of the central nervous system, which become activated at a very early stage (Kreutzberg, 1996) in response to brain injury. Increased levels of activated microglia may also be present in normal ageing and neurodegenerative disorders such as Alzheimer's disease (AD). Activated microglia show increased expression of peripheral benzodiazepine receptors.
(R)-[11C]PK11195 (1-[2-chlorophenyl]-N-methyl-N-[1-methyl-propyl]-3-isoquinoline carboxamide) is a positron emission tomography (PET) ligand for peripheral benzodiazepine receptors, which can be used to assess activated microglia in vivo. Previously it has been used in a variety of disorders, such as multiple sclerosis, Rasmussen's encephalitis, multiple system atrophy, amyotrophic lateral sclerosis, and AD (Banati et al, 1999, 2000; Cagnin et al, 2001a; Gerhard et al, 2003; Turner et al, 2004). In normal ageing, the thalamus showed an age-dependent increase in (R)-[11C]PK11195 binding (Cagnin et al, 2001a).
In all previous studies, (R)-[11C]PK11195 binding was quantified using a reference tissue approach. Both uptake normalised to a reference region (Groom et al, 1995; Versijpt et al, 2003; Debruyne et al, 2003) and the simplified reference tissue model (SRTM) (Lammertsma and Hume, 1996) have been used (Cagnin et al, 2001a; Gerhard et al, 2003, 2004, 2005, 2006; Turner et al, 2004). In some studies, the cerebellum was used as a reference tissue (Groom et al, 1995; Banati et al, 1999; Goerres et al, 2001; Gerhard et al, 2005); in others, a cluster analysis approach was adopted to define the normal reference region (Banati et al, 2000; Cagnin et al, 2001a, c, 2004; Gerhard et al, 2003, 2005, 2006; Turner et al, 2004).
In a recent report, methods to quantify (R)-[11C]PK11195 data using a metabolite-corrected plasma input curve were investigated (Kropholler et al, 2005). A reversible two-tissue compartment model with K1/k2 fixed to the value for whole cortex provided the optimal plasma input model. Subsequently, accuracy and precision of several reference tissue models were evaluated, comparing results with the above-mentioned plasma input model (Kropholler et al, 2006). In both studies, time–activity curves (TAC) were fitted using standard nonlinear regression (NLR) algorithms. These algorithms, however, are not suitable for voxel-by-voxel calculations, as they are time-consuming and have noise amplification. In addition, region-based analyses require manual delineation of regions of interest (ROI), which is time consuming and may experience both inter- and intraobserver variability and partial ROI effects (Boellaard et al, 2006). Therefore, interest has arisen to generate quantitatively accurate parametric images. These images may then be used for statistical parametric mapping analyses to assess (additional) areas with significant changes in PK11195 binding (Schuitemaker et al, 2005), thereby obtaining more accurate localisation of increased PK11195 binding, which might have been missed using ROI-based analysis.
The purpose of this study was to evaluate the performance of various parametric methods for determining (R)-[11C]PK11195 binding, considering both volume of distribution (Vd) and binding potential (BP) as parameters of interest. Binding potential represents the ratio of bound over free tracer in tissue in equilibrium. In the case of (R)-[11C]PK11195, the tracer binds to the peripheral benzodiazepine receptors expressed on activated microglia, analogous to other receptor-binding ligands, although a large fraction of (R)-[11C]PK11195 binds nonspecifically in tissue.
In this study, parametric methods using both arterial plasma and reference tissue inputs were included, such as the Logan plot (Logan et al, 1990), two versions of Ichise's multilinear regression (Ichise et al, 1996, 2003), two versions of receptor parametric mapping (RPM) (Gunn et al, 1997; Wu and Carson, 2002), a basis function implementation of SRTM, and the reference Logan plot (Logan et al, 1996). Performance was evaluated using both simulations and clinical data. (R)-[11C]PK11195 binding (in the thalamus and whole cortex) was derived from parametric images directly and, for comparison, by NLR of corresponding TAC using both SRTM and the optimal plasma input model mentioned above.
Methods
Subjects
Twenty healthy controls (10 young and 10 elderly subjects with mean ± s.d. ages of 23 ± 3 and 71 ± 5 years, respectively) and 9 subjects (age 71 ± 6 years) diagnosed with probable AD, meeting National Institute of Neurological and Communicative Diseases and Stroke/Alzheimer's Disease and Related Disorders Association (NINCDS-ADRDA) criteria (McKhann et al, 1984), were recruited between May 2002 and October 2004. Informed consent was obtained from all subjects. The study protocol was approved by the medical ethics committee of the VU University Medical Centre.
Scanning Procedure
All subjects underwent a structural T1-weighted magnetic resonance imaging (MRI) scan using a Siemens 1.0T IMPACT scanner (Siemens Medical Solutions, Erlangen, Germany). Positron emission tomography scans were performed using an ECAT EXACT HR+ scanner (Siemens/CTI, Knoxville, TN, USA) (Brix et al, 1997). All patients received an indwelling radial artery cannula for arterial sampling. After a 10 mins 2D transmission scan, used to correct the subsequent emission scans for attenuation, a 10 mins 3D dynamic [15O]H2O emission scan was acquired (note that results of this scan will not be presented here, as the focus is on parametric methods for (R)-[11C]PK11195). Next, after an interval of about 5 mins, an (R)-[11C]PK11195 PET scan was performed consisting of 22 frames with progressive increase in frame duration (1 × 30, 1 × 15, 1 × 5, 1 × 10, 2 × 15, 2 × 30, 3 × 60, 5 × 150, 5 × 300, and 2 × 600 secs; total acquisition time 60.5 mins). Head movement during scanning was avoided as much as possible using a head holder. The first frame was used for background correction of (possible) residual [15O]H2O. Background correction was performed by subtracting the measured activity in the background frame from the subsequent frames of the study taking the decay of 15O into account. At the start of the second frame, a bolus of 325 ± 84 MBq with a specific activity of 99 ± 38 GBq/μmol was injected using an injector (Medrad Inc., Indianola, MS, USA). Arterial blood was monitored continuously using an online detection system (Boellaard et al, 2001) with a withdrawal rate of 5 mL/min during the first 10 mins and 2.5 mL/mins thereafter. In addition, at set times (2.5, 5, 10, 20, 30, 40, and 60 mins postinjection), discrete manual samples were taken. These were used for calibrating the (online) blood sampler, for measuring plasma/whole blood ratios, and for determining metabolite fractions (Greuter et al, 2005), enabling the generation of a metabolite-corrected plasma input curve.
Data Analysis
Image analysis: Data were reconstructed using a FORE + 2D-filtered back projection algorithm (Defrise et al, 1997) with a Hanning filter at a cutoff of 0.3 times the Nyquist frequency, resulting in an image resolution of ∼8.5 mm full width at half maximum. This resolution was chosen because in clinical studies parametric images will primarily be used for statistical parametric mapping analyses. Usually, statistical parametric mapping analysis is performed with an image resolution of 8 to 12 mm full width at half maximum and, therefore, the present evaluation was performed at a somewhat lower resolution than presented previously (Kropholler et al, 2006). Note that this lower resolution resulted in (low) image noise levels (< 15%). A zoom factor of 2 and an image matrix size of 256 × 256 were used during reconstruction, yielding voxel sizes of 1.2 × 1.2 × 2.4 mm3. All corrections required for quantification, that is, normalisation, and attenuation, decay, scatter, and random corrections, were applied.
For each subject, PET and magnetic resonance imaging scans were coregistered using a summed (R)-[11C]PK11195 image (frames 3 to 12, i.e., 45 secs to 8 mins) with the software package MIRIT (Maes et al, 1997; West et al, 1997).
Using anatomical criteria, thalamus, whole cortex, and cerebellum ROI were drawn on the coregistered magnetic resonance imaging scan using the 3D software program DISPLAY, developed at MNI (http://www.bic.mni.mcgill.ca/software/Display). The cerebellum region was used as reference tissue. The thalamus region was chosen as it showed increased binding with increasing age (Cagnin et al, 2001b). Moreover, our clinical data showed that variation in binding with age in healthy control subjects was larger than the range of binding seen in other regions (so it covered a clinically relevant range) and it was equal to or larger than the variation of binding seen in patients suffering from AD. Therefore, by using the thalamus region in young, old, and AD subjects, it was possible to validate the methods for clinical TACs with both low and high binding. Whole cortex was chosen to include a region with low binding, but with high-count statistics.
Parametric methods: Parametric images of Vd were generated by means of the Logan plot with plasma input function (Logan et al, 1990). These Vd images were also processed to generate distribution volume ratio (DVR) images using the average Vd of the cerebellum as reference, that is, DVR=Vd images divided by Vd of cerebellum. Next, BP images were derived using BP = DVR-1 (denoted as Logan BP in the remainder of this paper). In addition, BP images were generated using two different linearisations: ICH1 (Ichise et al, 1996) and ICH2. With ICH2, the multilinear expression is rearranged to provide estimates of BP with less bias compared with ICH1, but at the cost of decreased precision (Ichise et al, 2003). Next, BP images were generated using two versions of the basis function implementation of SRTM: RPM1 (Gunn et al, 1997) and RPM2 (Wu and Carson, 2002). In RPM2, the washout rate constant of the reference tissue was first estimated using RPM1. A BP > 0 threshold was used to select voxels from which the reference tissue washout constant was derived. The median washout value was calculated and subsequently its value was fixed for all voxels during a second basis function evaluation. The implementation was performed exactly as described by Wu and Carson (2002). Finally, parametric BP images were created using the modified Logan plot with reference tissue input (reference Logan) (Logan et al, 1996). In Table 1, time interval and, where appropriate, the range of basis functions are listed for all parametric methods. These settings were derived empirically using, for example, the linear part of the Logan plots (these settings were also used for both multilinear methods) or by ‘calibrating’ the basis function range to provide accurate results compared with SRTM. Cerebellum was used as reference tissue for all reference tissue methods. Regions of interest defined for thalamus and whole cortex were projected directly onto above parametric images to obtain Vd and BP.
Settings used for the various parametric methods
Basis function range, range of exponentials of basis functions; time interval, interval used for analysis.
Nonlinear regression: Regions of interest defined for thalamus, whole cortex, and cerebellum were also projected onto the dynamic (R)-[11C]PK11195 scans to generate corresponding (R)-[11C]PK11195 TAC. Lack of patient motion, and thus proper alignment of the ROI for all frames of the PET study, was confirmed visually by overlaying (whole brain) contours over all frames of the study. Patients still showing motion were excluded beforehand. Quantification of (R)-[11C]PK11195 binding was obtained using the reversible two-tissue plasma input compartment model with K1/k2 fixed to the whole cortex value (Kropholler et al, 2005) to obtain regional Vd (a two-tissue compartment model was used to fit both thalamus, whole cortex, and cerebellum TAC) and SRTM (Lammertsma and Hume, 1996) for determination of regional BP (of thalamus and whole cortex region). Moreover, specific binding in the target region was also determined using DVR-1 values based on Vd values obtained with above-mentioned plasma input model.
Clinical evaluation: Parametric imaging methods were evaluated by correlating derived Vd or BP values for the 29 subjects with corresponding DVR-1 and/or BPSRTM data obtained from the relevant NLR method.
Simulation studies: Simulations were performed to assess accuracy and precision of each method as a function of noise. For the Logan plot, a typical metabolite-corrected plasma input function (Kropholler et al, 2006) was used to generate a noiseless normal tissue TAC. To this end, typical (R)-[11C]PK11195 rate constants (K1 = 0.055 min−1, k2 = 0.15 min−1, k3 = 0.08 min−1, and BP = 2.0) were used, together with a blood volume fraction (Vb) of 0.05 or 0.025 (i.e., target region 2 and 6 in Table 2). Noise was added to the noiseless TAC at set levels of 0% to 30% in steps of 2%. Distribution of variance over the frames was derived using the scanner's trues rate and frame durations, and including 11C decay (Yaqub et al, 2006). Noise was defined as the average noise level (%) in the frames from 5 to 60 mins. These noise levels covered the range seen in clinical data. For 8.5 mm full width at half maximum resolution data, as used in this study, image noise levels are generally lower than 15%. At each noise level, 10,000 realisations were generated. All noisy TAC at each noise level were analysed using Logan plots. Accuracy was assessed by comparing average Logan Vd with simulated ‘true’ Vd (Table 2) and precision was defined as the standard deviation (s.d.) of the observed Logan Vd values.
Kinetic parameters used to generate reference and target tissue time activity curves
TAC, time–activity curves; Vb, blood volume fraction; Vd, volume of distribution.
DVR-1 represents BP obtained using DVR (ratio of target over cerebellum Vd). BPSRTM is the BP calculated using SRTM with noiseless TAC. Difference between both BP measures is caused by presence of blood volume fraction in TAC, which is not taken into account with SRTM.
For reference tissue parametric methods (ICH1 and ICH2, RPM1 and RPM2, and reference Logan), target tissue TAC with various levels of increased specific binding were generated using the same input function and the two-tissue compartment model described above. The two-tissue compartment model was used for reference and target region, as only this model provides good fits for both reference and target tissue TACs. Table 2 summarises the various parameter settings used to generate the target tissue TAC. To investigate reduced flow conditions, simulations were also performed using ∼25% and 50% reductions in flow (target tissues 4 and 5). Moreover, effects of differences in blood volume were studied using target tissues 6 to 8 and reference tissue 1 to 3. Similar to the Logan plot simulations, noise was added to noiseless TAC and 10,000 realisations were generated for each noise level. Each noisy TAC was analysed using all reference tissue parametric methods included in this study. Settings of the parametric methods as well as their specific implementations (e.g., determination of washout rate constant for RPM2) were equal to those used for clinical evaluations (Table 1). Average BP values and corresponding s.d.s were calculated for 10,000 simulations. These data were compared with both true DVR-1 values (8th column of Table 2) and BP values obtained for noiseless TAC using SRTM (BPSRTM, 9th column of Table 2). Both these comparisons were performed, as it provides a means to discriminate between errors directly associated with the specific parametric implementation (e.g., linearisation) and those related more generally to the use of a reference tissue method (e.g., owing to intravascular activity) (Gunn et al, 2001).
Results
Parametric Images
Examples of parametric images of (R)-[11C]PK11195 binding using (A) Vd derived from Logan with plasma input, and BP derived from (B) Logan Vd images, (C) ICH1, (D) ICH2, (E) RPM1, (F) RPM2, and (G) reference Logan methods are shown in Figure 1. The display scale includes negative values because for some regions (white matter) a negative BP was observed, which is explained by the different kinetics of (R)-[11C]PK11195 in those region as compared with the reference tissue region. In addition, R1 images obtained with (H) RPM1 and (I) RPM2 are shown in Figure 1.
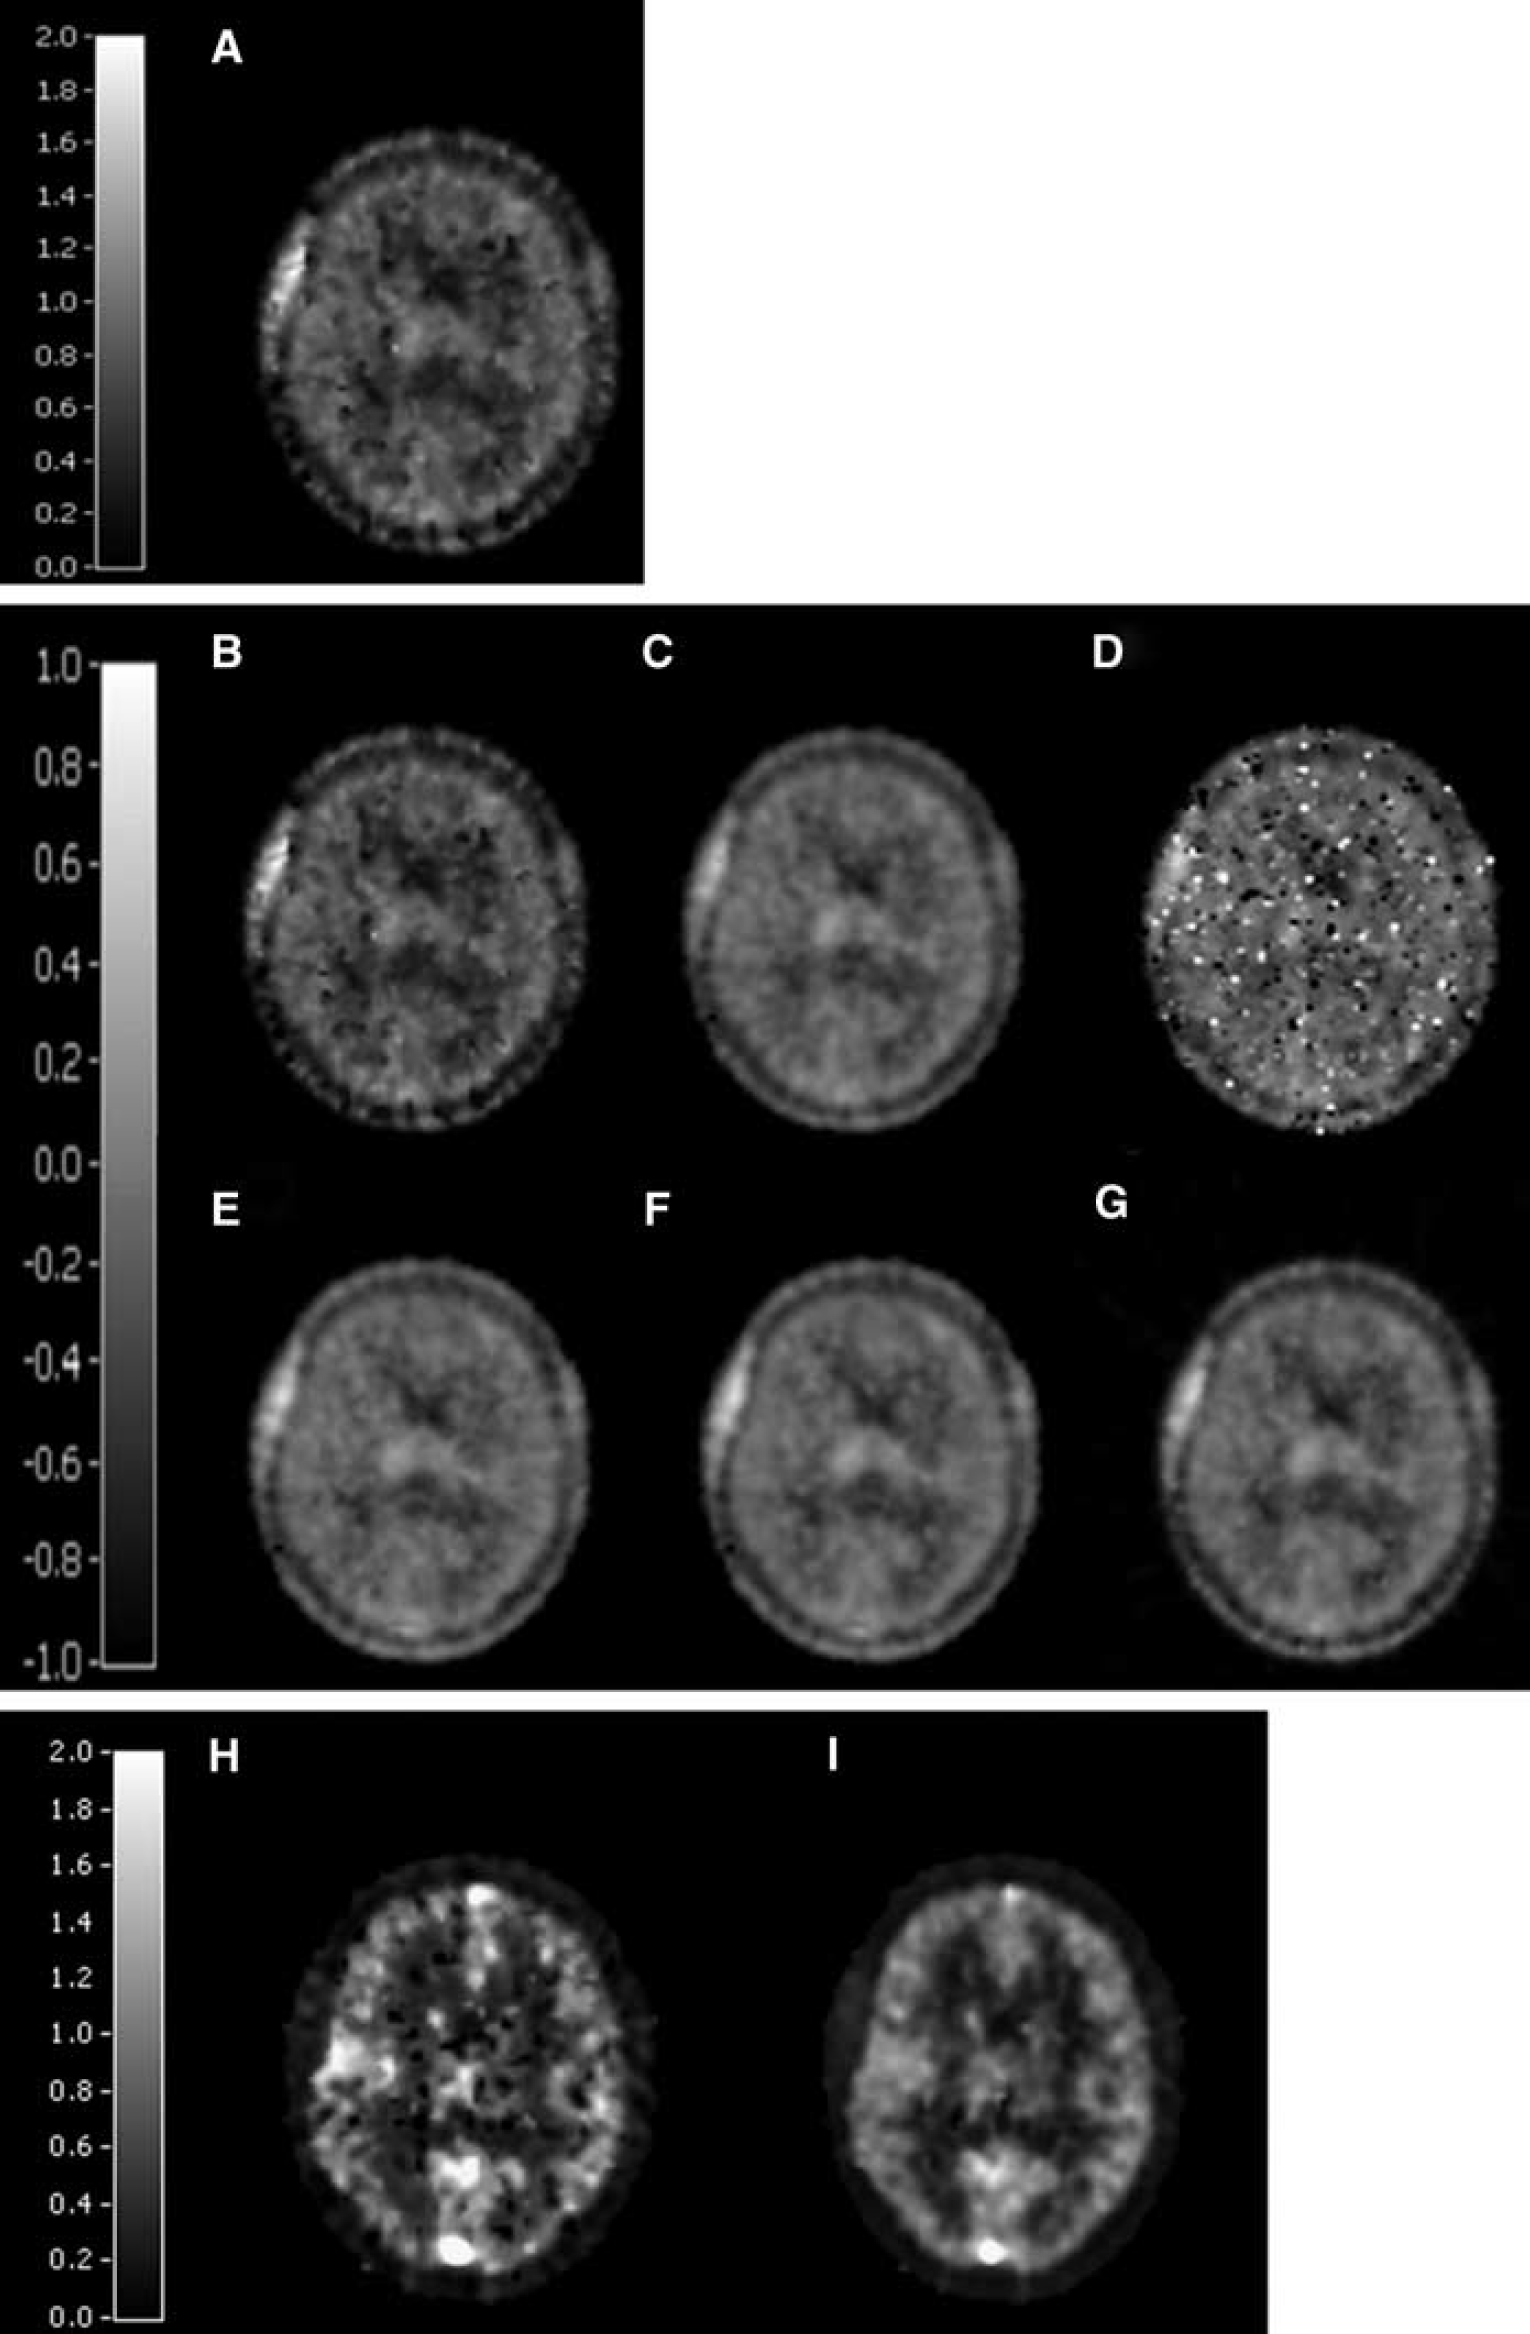
Parametric images of (R)-[11C]PK11195: (
Clinical Evaluation
Figure 2A shows a comparison of Vd from parametric Logan plot images (plasma input) with that from nonlinear fitting of the corresponding TAC. Data are pooled for all subjects and regions, as no difference in performance of the parametric methods was observed among the subject groups tested. This may be deduced from Figure 2, showing that all data points are closely located near the regression line. This indicates a similar performance of the parametric method independent of subject group (healthy or AD), also in the case of reference tissue input (Figure 2B). Clinical interpretation of results obtained for healthy versus AD subjects is, however, beyond the scope of this paper and will be presented elsewhere.
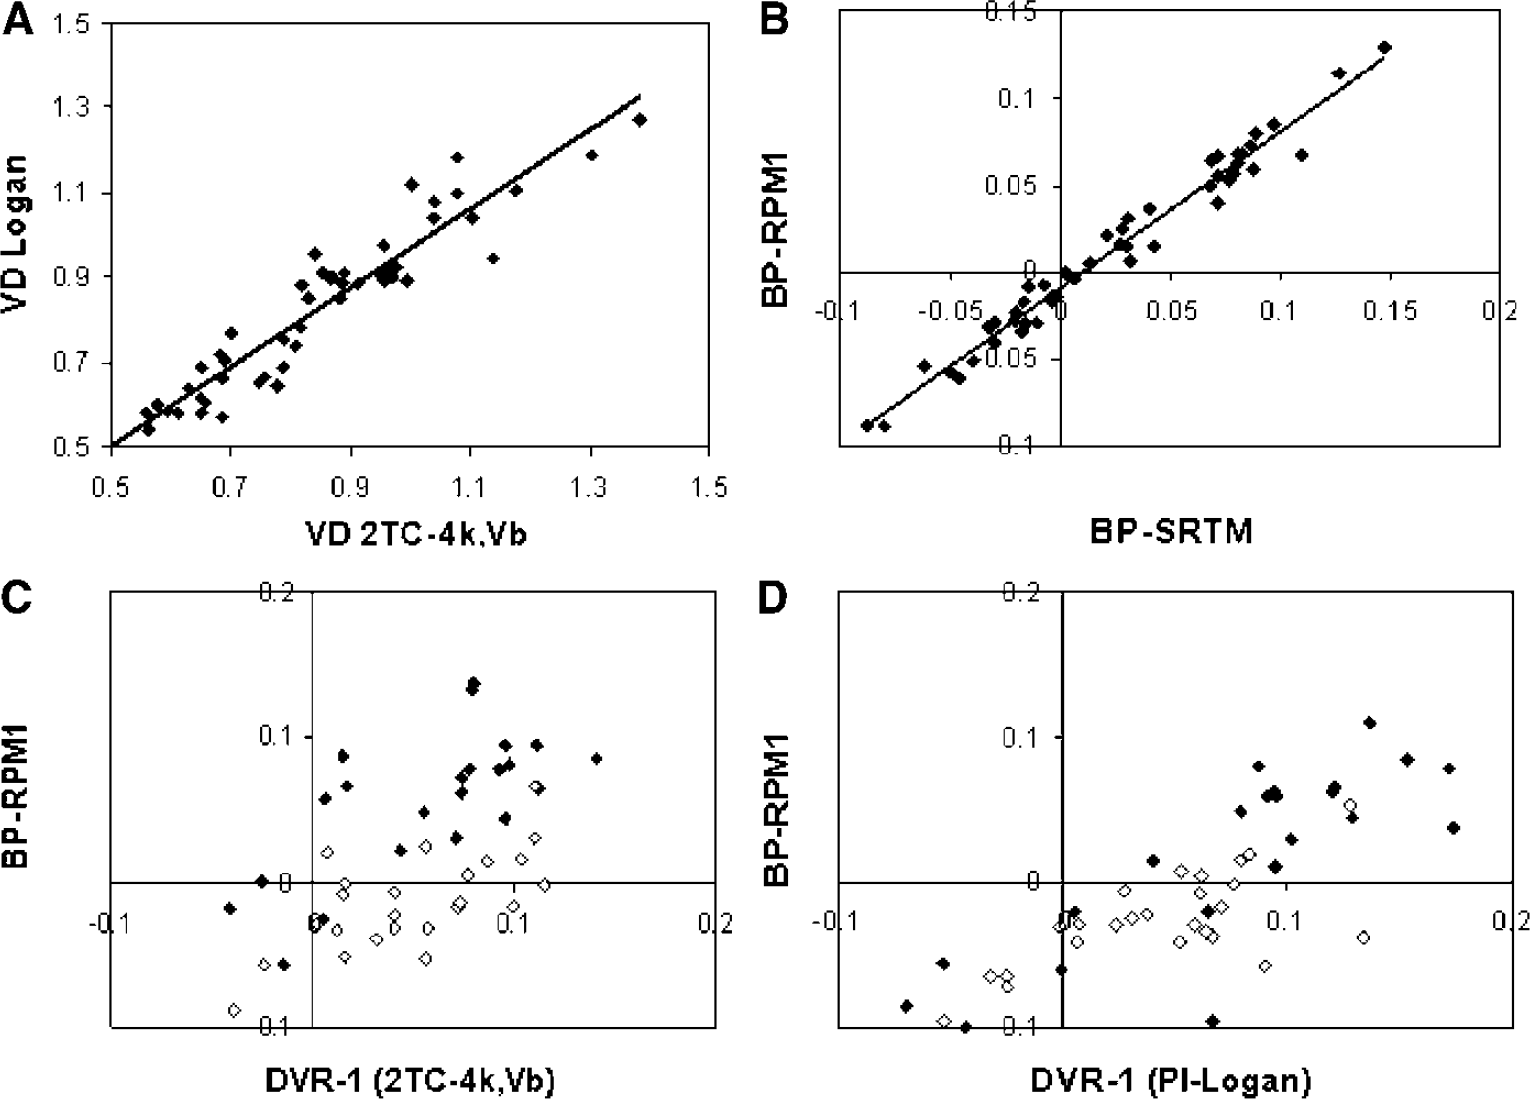
Correlation plots of Vd and BP from parametric methods (Y-axis) versus those from NLR of corresponding TAC (X-axis): (
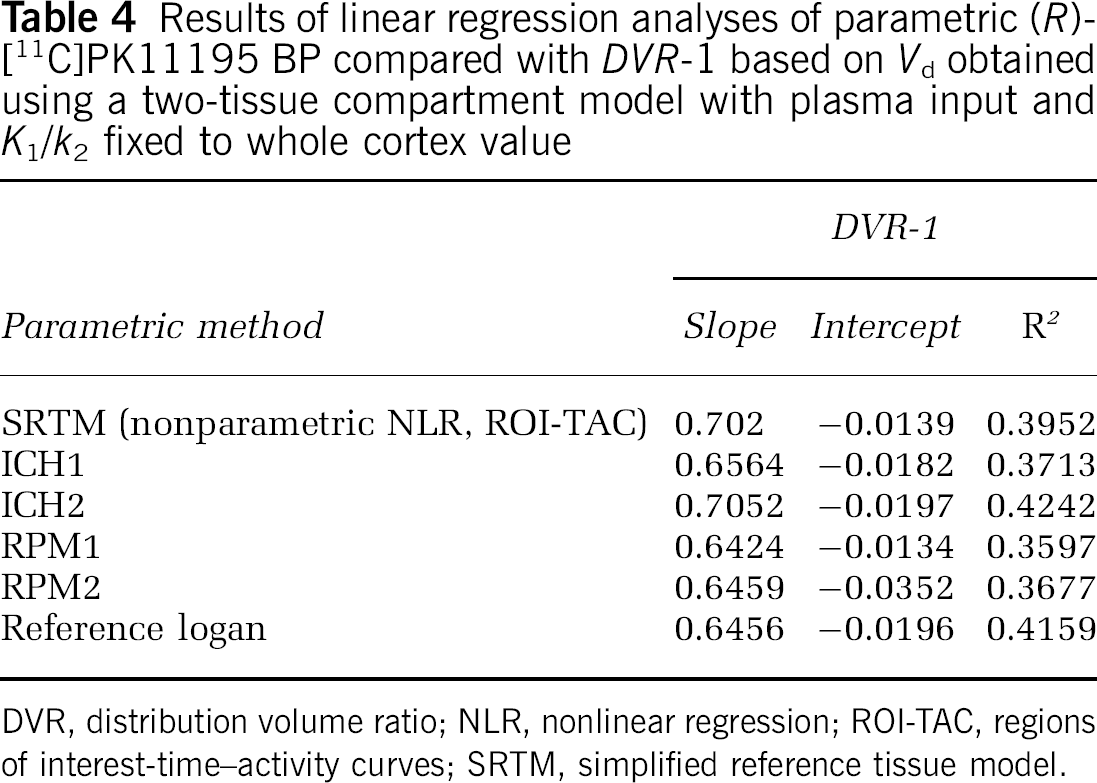
Regression of Logan plot data provided a Pearson's correlation coefficient of 0.88, and slope and intercept were 0.93 and 0.04, respectively. In Figure 2B, specific BP obtained using RPM1 is compared with BP obtained from nonlinear fitting using SRTM, while Figure 2C shows the comparison with DVR-1 based on Vd from plasma input modelling. Finally, in Figure 2D, BP using RPM1 is plotted against DVR-1 calculated from Logan plot Vd values. Difference between Figure 2C and 2D is the way Vd, used for DVR, is obtained. Data were very similar for all other parametric reference tissue methods (ICH1, ICH2, RPM2, and reference Logan). Table 3 summarises parameters obtained from linear regression of the various parametric methods with the corresponding nonlinear methods, and in Table 4, these parameters are listed for linear regression against plasma input-derived DVR-1. From the regression coefficients presented in Tables 3 and 4, it can be deduced that all reference tissue input-based parametric methods have similar performance or accuracy, although RPM2 performed slightly worse than other reference tissue parametric methods. Table 4 and Figure 2C also show that, on average, BP using reference tissue input parametric methods (and SRTM) underestimate BP compared with plasma input-derived DVR-1. This negative bias is different for thalamus and whole cortex regions (Figure 2C).
Results of linear regression analyses of parametric (R)-[11C]PK11195 Vd and BP with corresponding nonlinear ROI methods
Vd obtained using two-tissue compartment model with plasma input and K1/k2 fixed to the whole cortex value (2T-4k) and BP obtained using BPSRTM.
Simulations
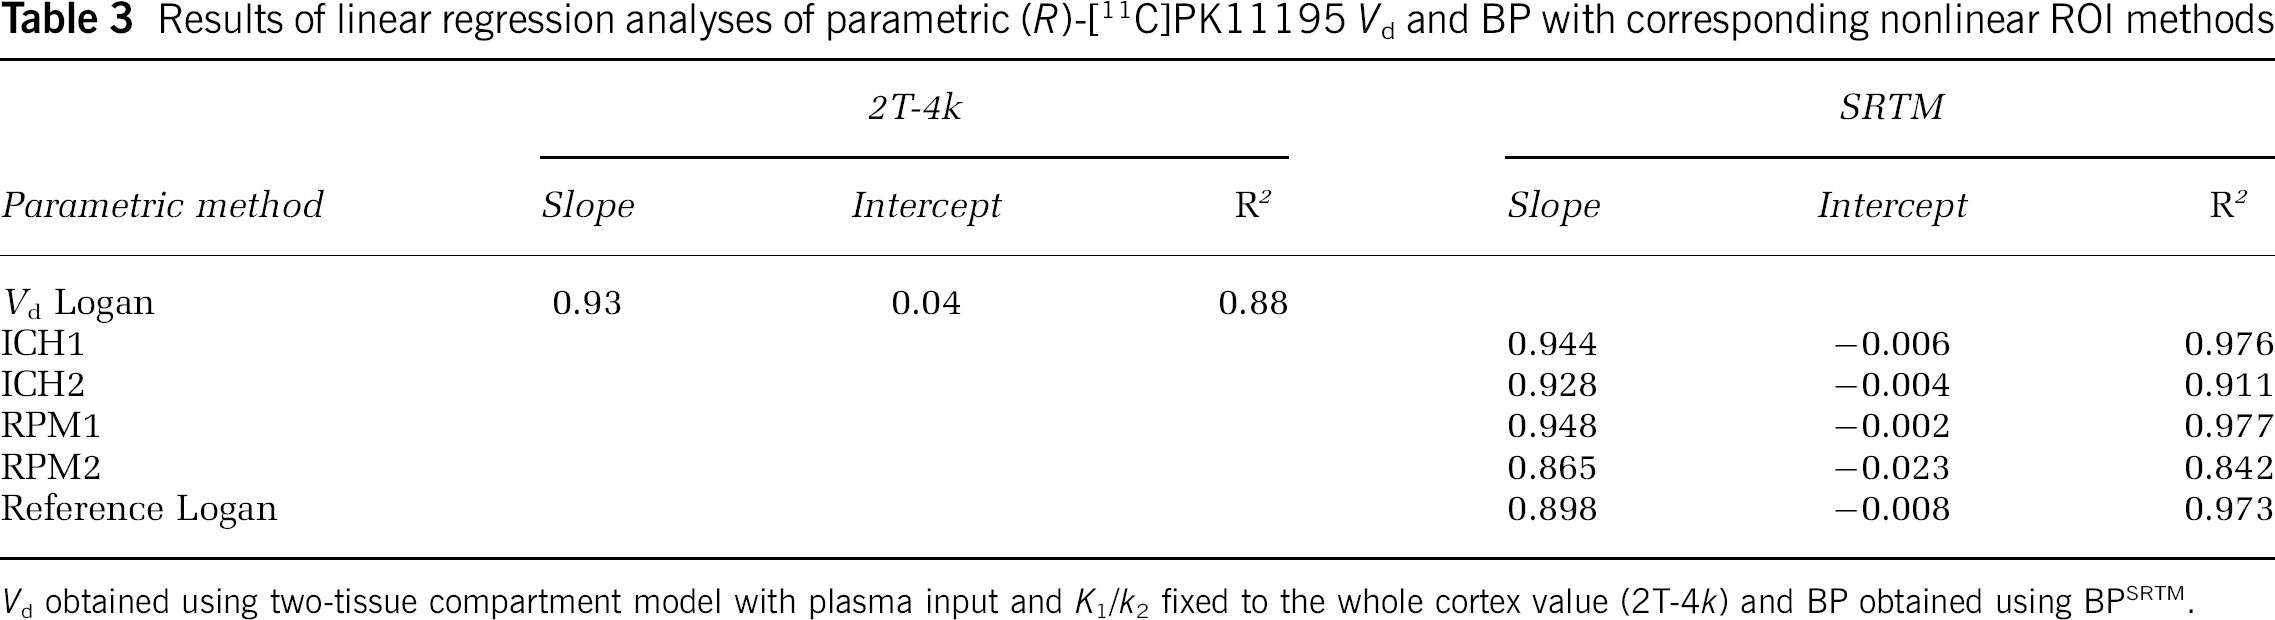
In Figure 3A, results of simulations for the (plasma input) Logan plot are given. It can be seen that for noise levels up to ∼15%, bias in Vd remained relatively small (i.e., < 5%). At low noise levels, there was a small positive bias owing to the intravascular signal, as demonstrated in Figure 3B, where the same plot is given but now for a target tissue with smaller blood volume fraction (0.025). Overall, a decrease of average Vd value is seen with increasing noise level. In general, precisions decreased (almost linearly) to ∼20% with increasing noise level up to 30%.
Bias and precision of Vd obtained using Logan analysis with arterial plasma input as a function of noise level. Simulated TAC with (
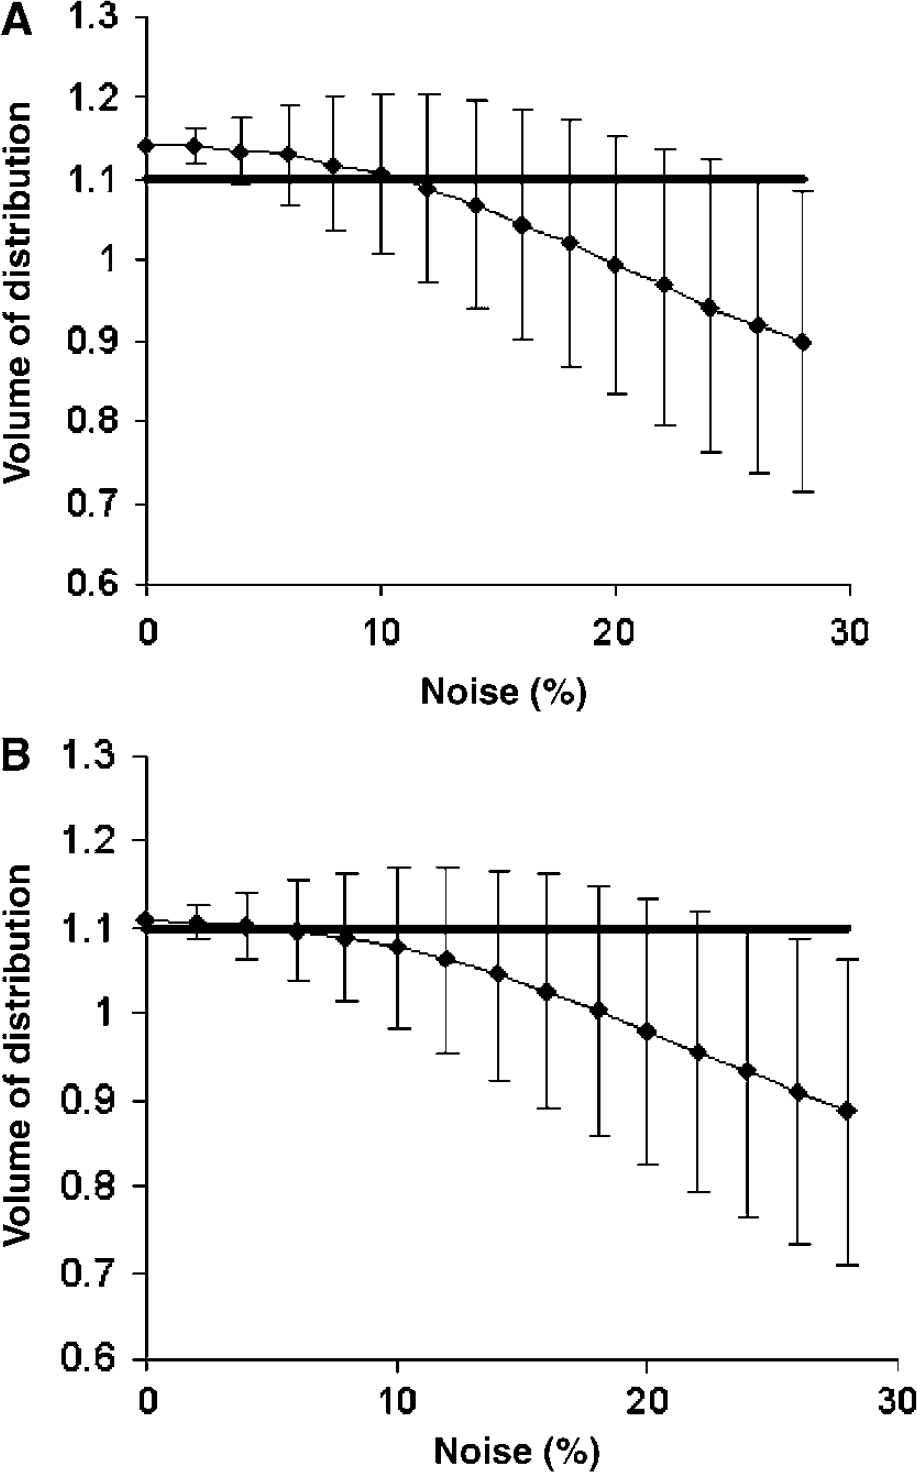
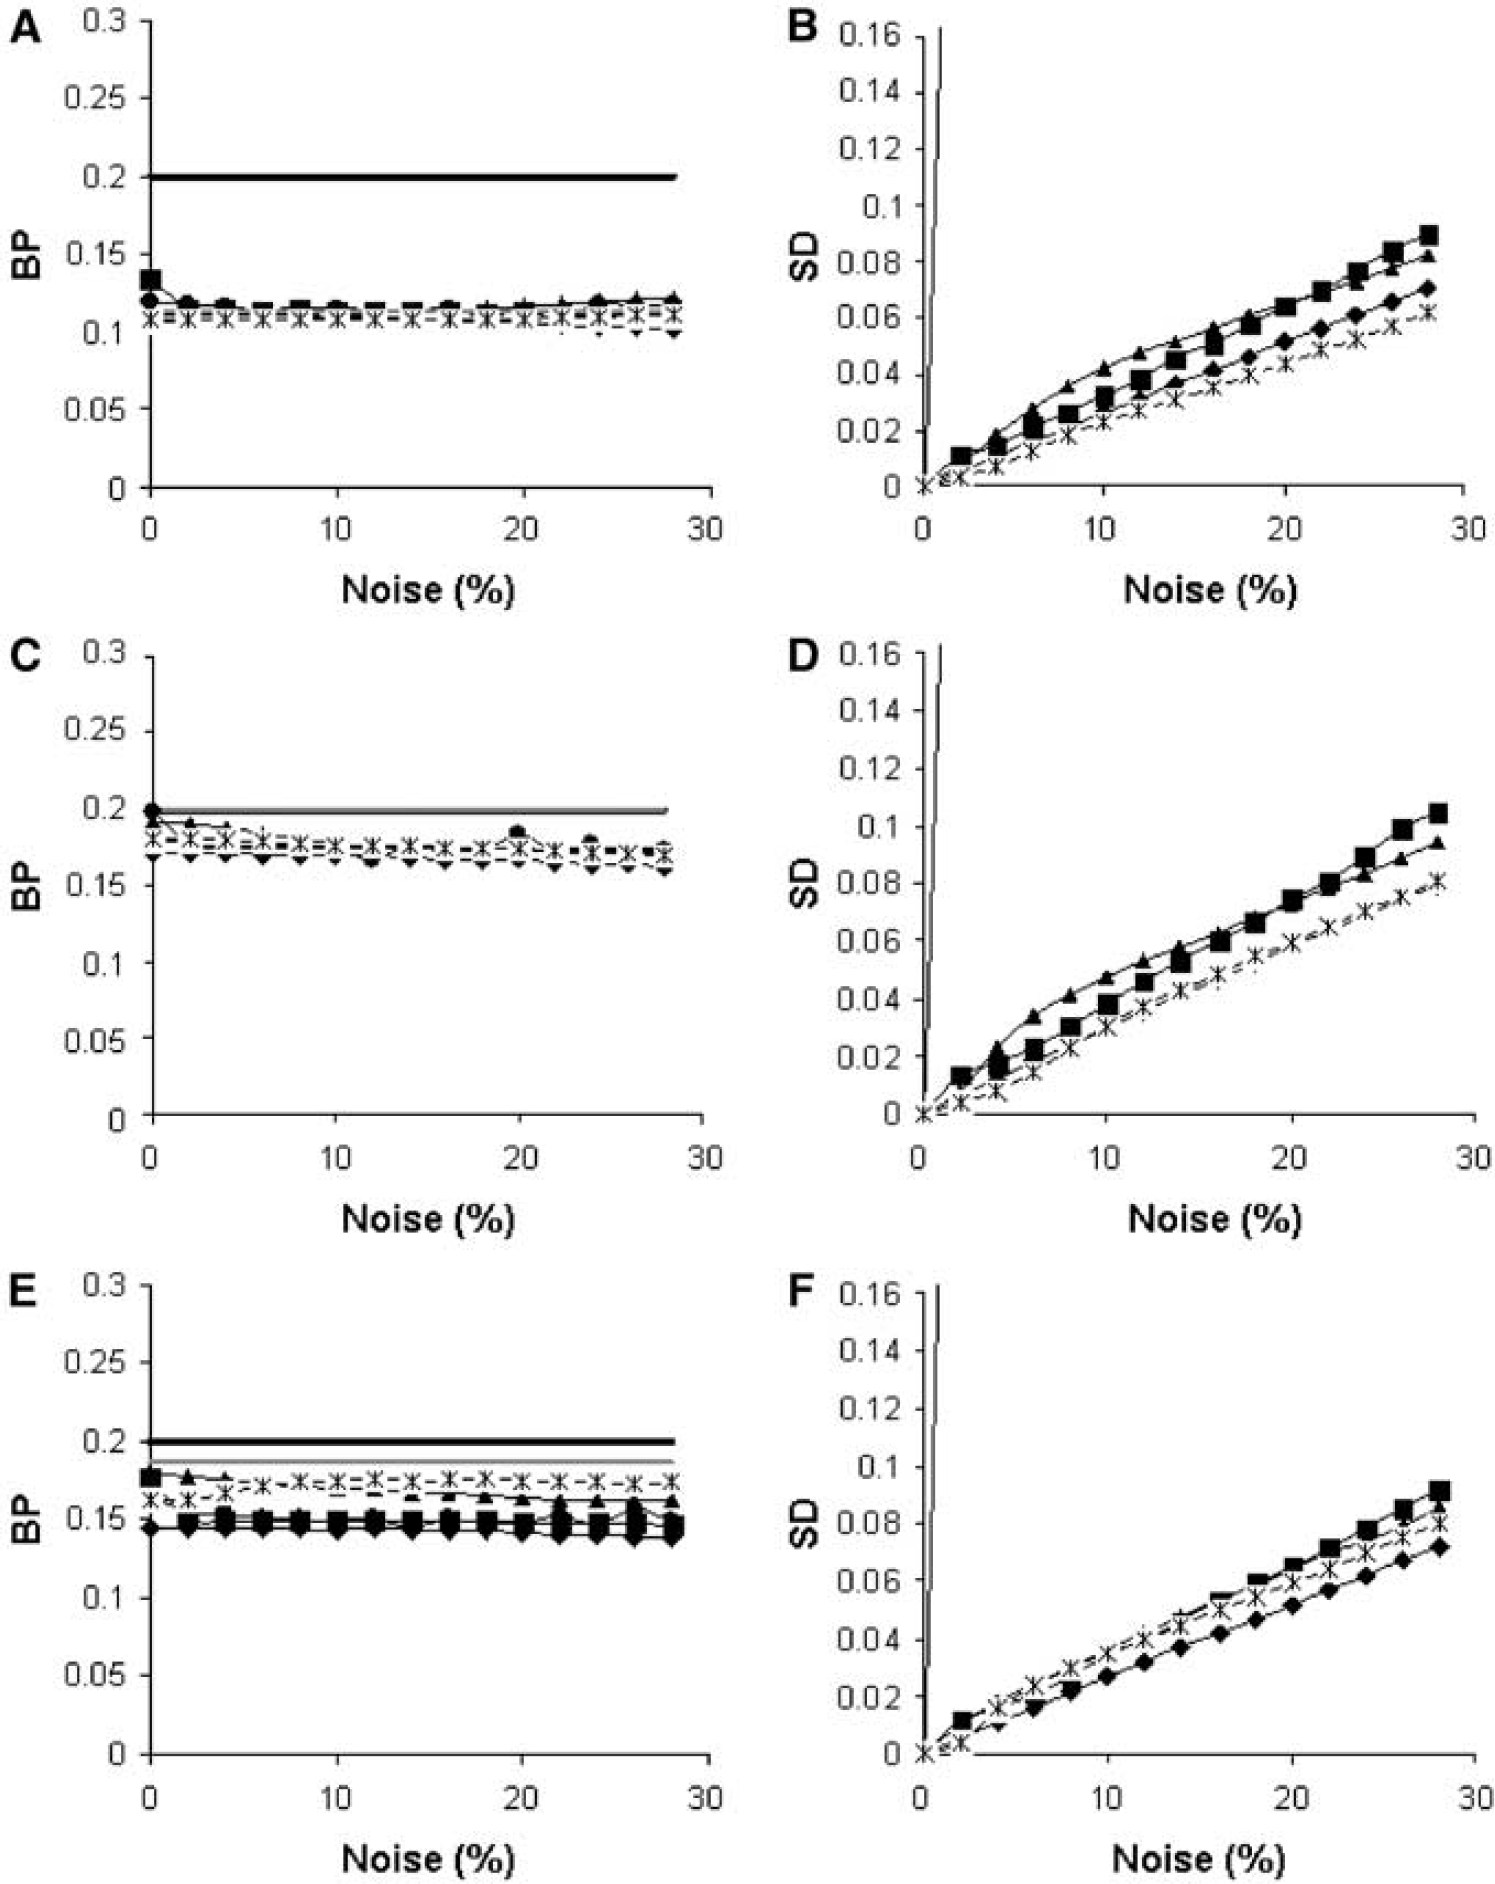
Figure 4 shows BP and its precision for the various parametric reference tissue methods and three levels of specific binding (DVR-1): 0.05 (top), 0.2 (middle), and 0.4 (bottom). All parametric methods show significant underestimation relative to plasma input DVR-1 (black horizontal line), with a smaller discrepancy compared with BPSRTM (grey horizontal line). RPM1 and RPM2 more closely agreed with BPSRTM than ICH1, ICH2, and reference Logan, and differences between RPM1 and RPM2 were small. Moreover, at low noise levels (<5%), RPM1 only slightly underestimated BPSRTM. The larger discrepancy with plasma input-derived DVR-1 is likely due to intravascular activity and might be typical for reference tissue input models. Note that BPSRTM itself was also around 10 to 15% lower than DVR-1 (Table 2). Precisions of the various parametric methods were approximately similar (right column of Figure 4).
BP (
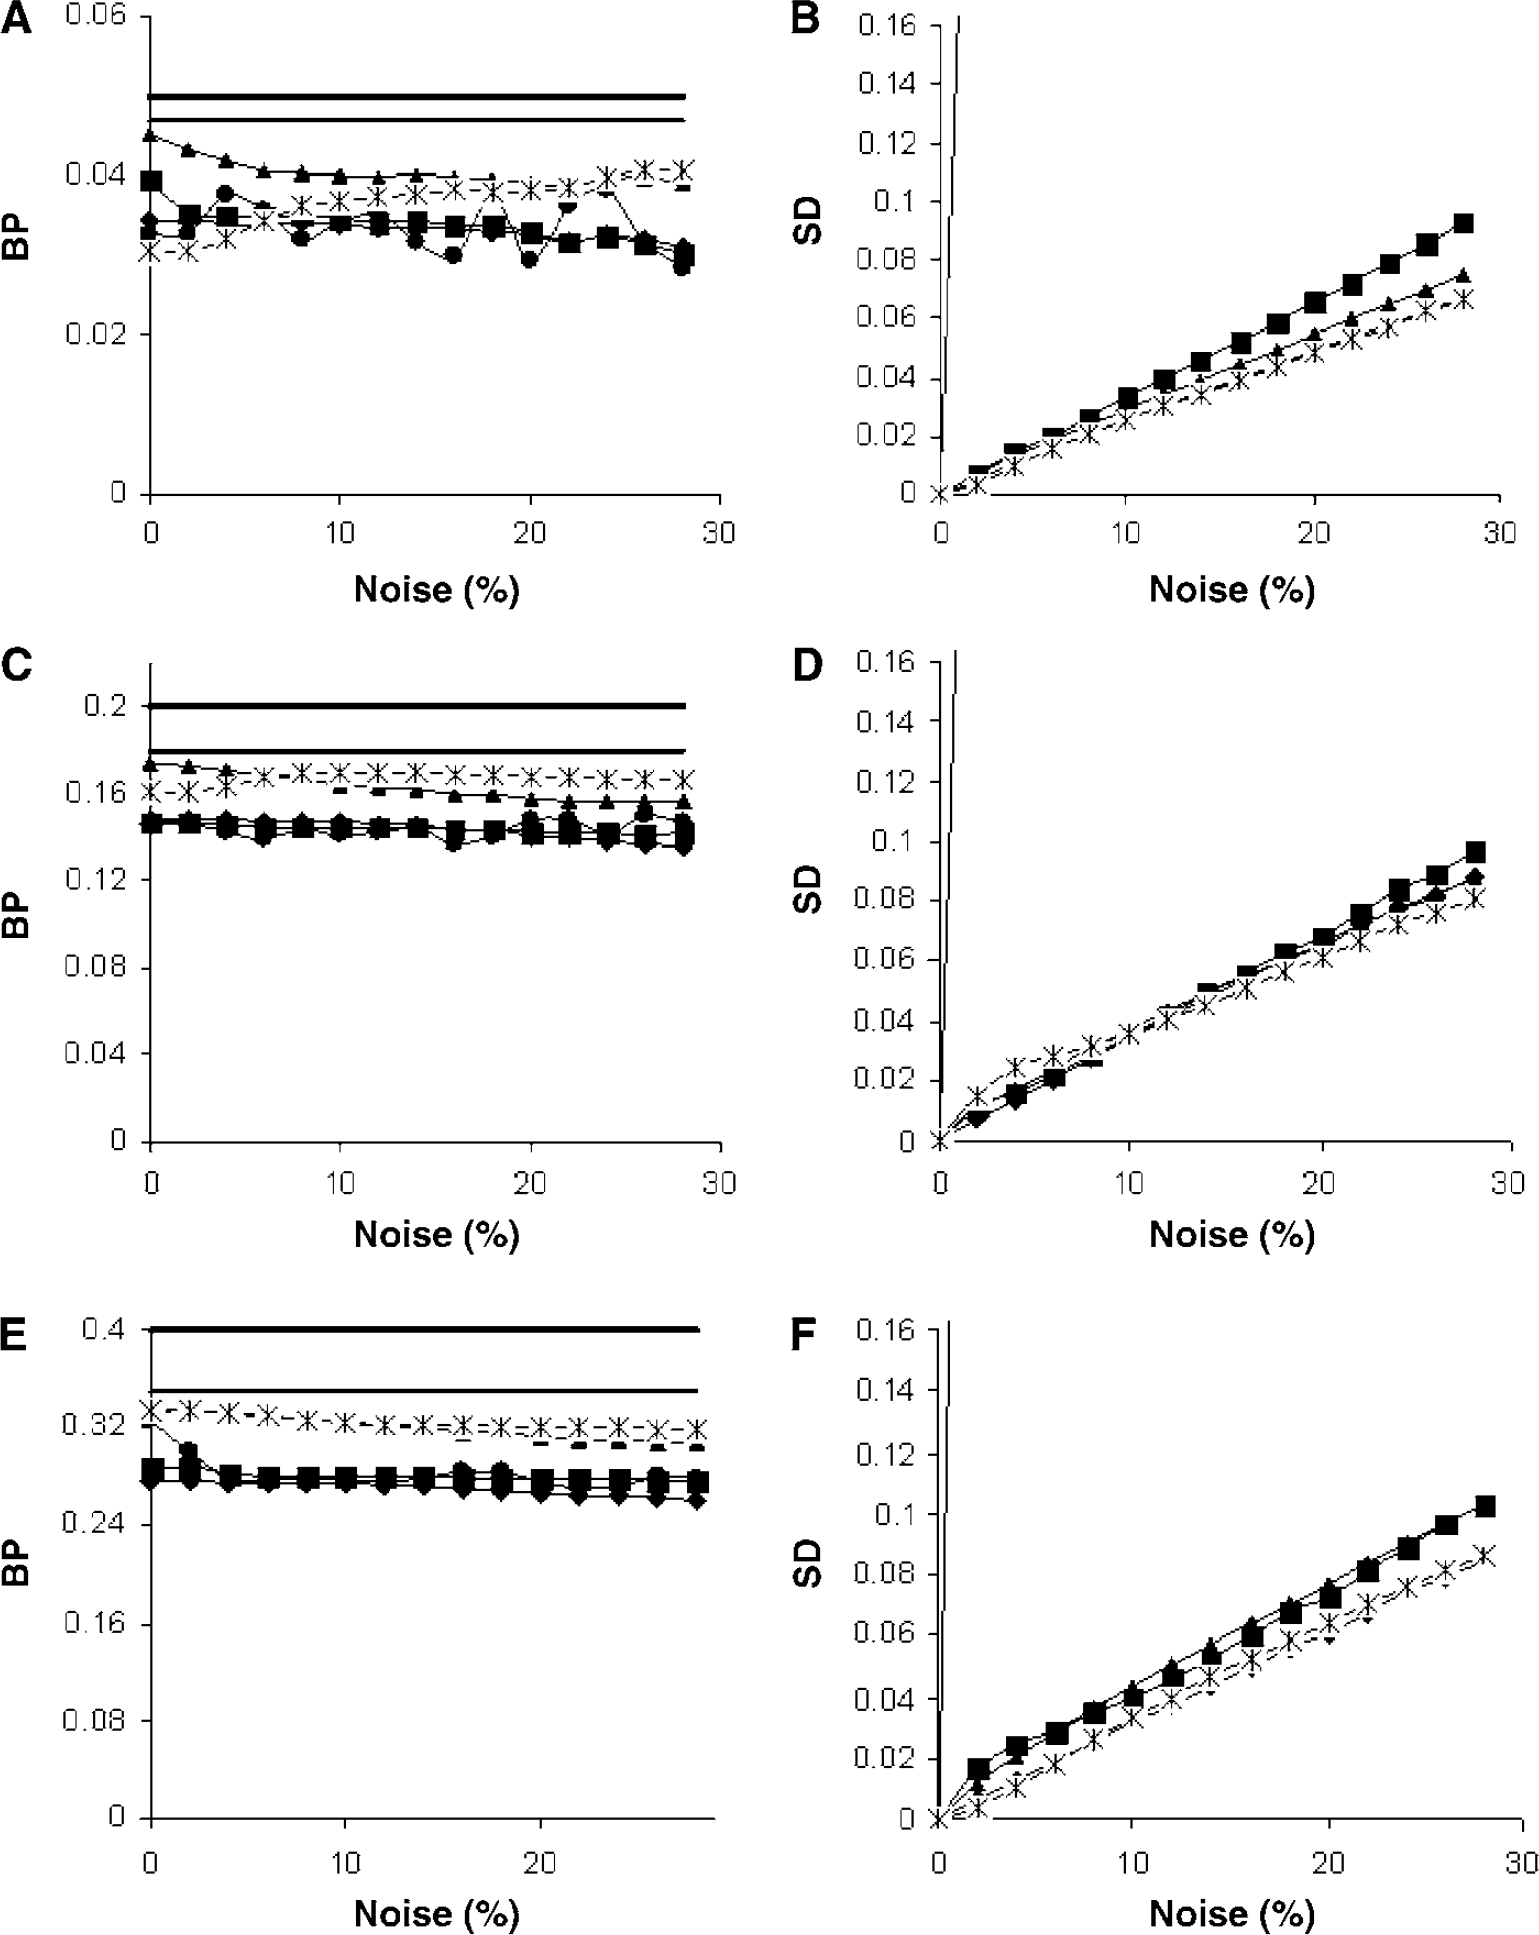
In Figure 5, results of similar simulations are presented, but with blood flow reduced by approximately 25% (top) and 50% (bottom). At these reduced flow rates, an increasing negative bias was found for all methods. Again, RPM1 and RPM2 results were in closer agreement with BPSRTM and DVR-1 values than other parametric methods. In case of a large (50%) flow reduction, however, all methods failed to provide an accurate estimate of BP.
BP (
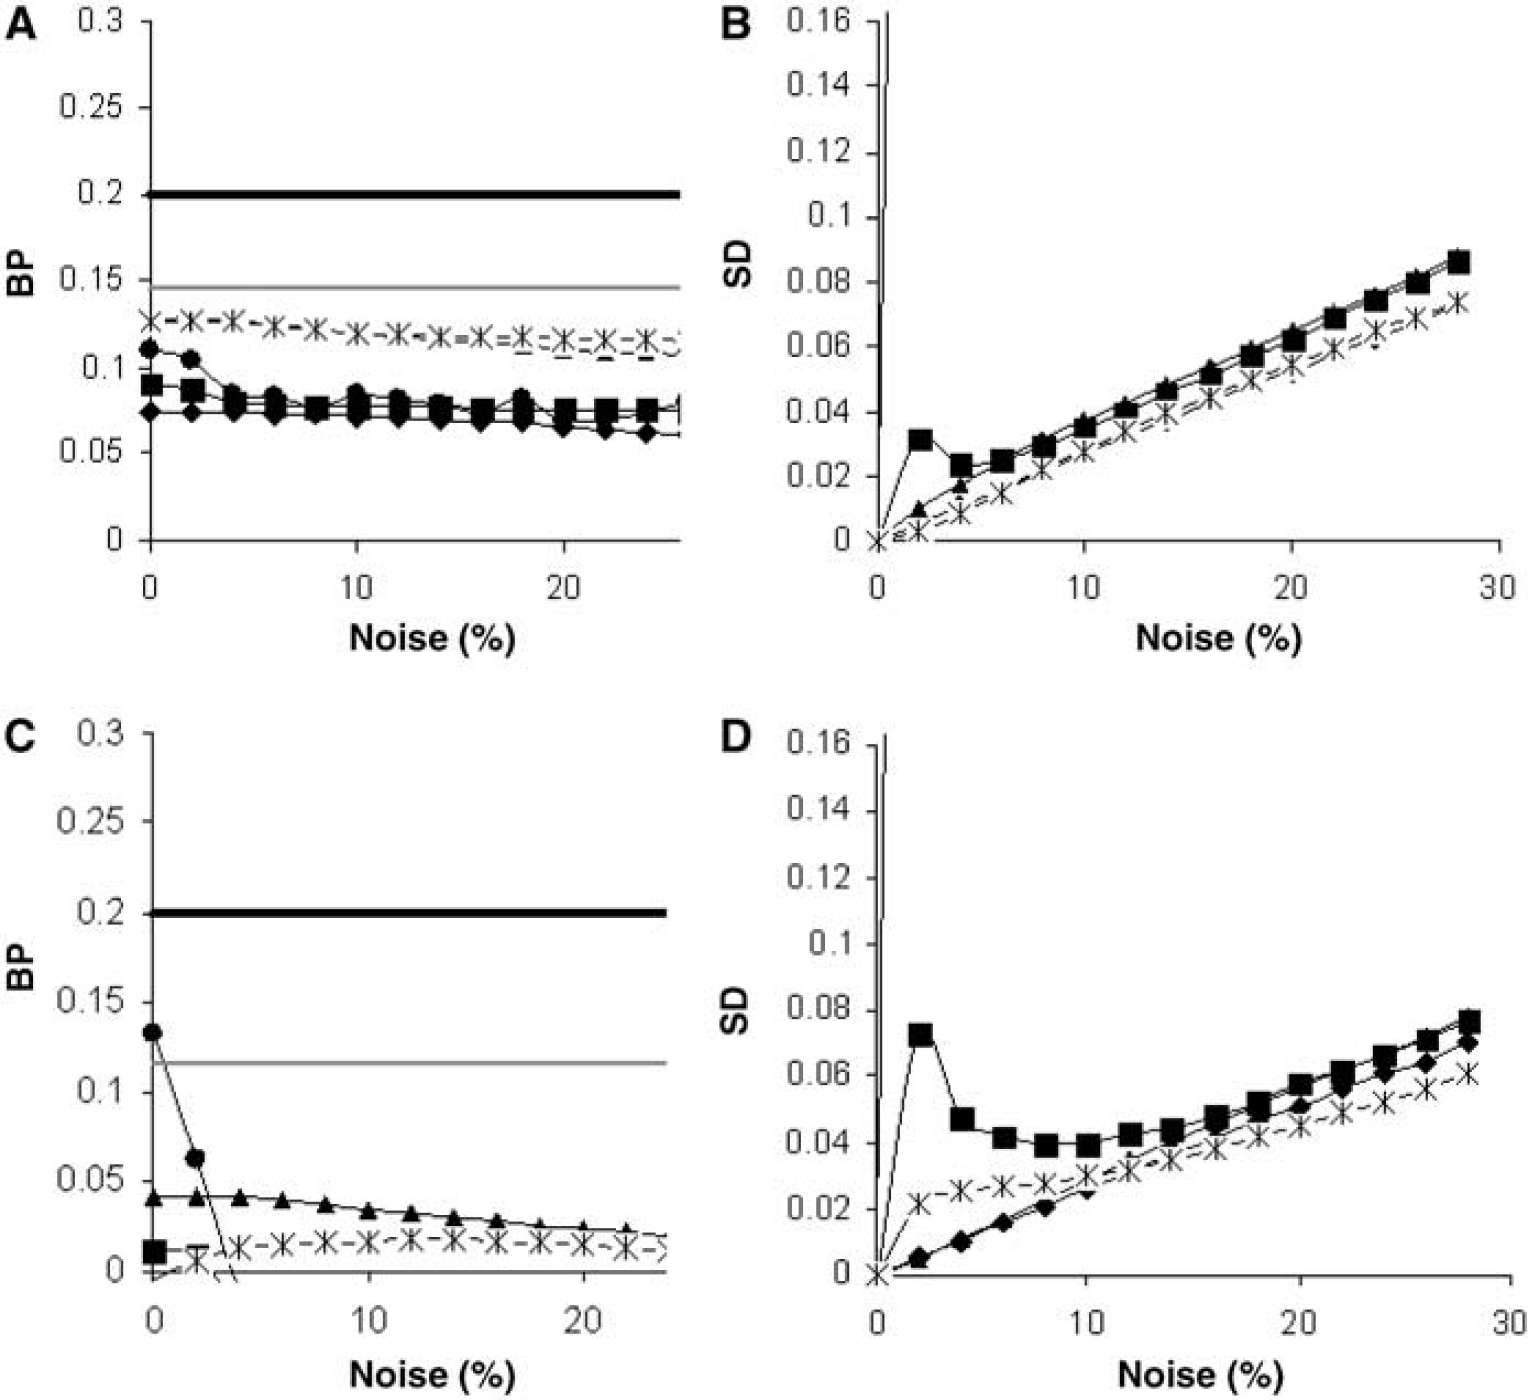
Finally, in Figure 6, effects of varying blood volume fraction on estimated BP are illustrated. In case of an increased blood volume in the target tissue (top), all reference tissue methods provided a larger underestimation of BP, whereas a decreased blood volume fraction (middle) resulted in more accurate results regarding both DVR-1 and BPSRTM. More accurate results were also observed in case of a ‘matched’ lower (bottom) or higher (data not shown) blood volume fraction in both reference and target tissue region.
BP (
Discussion
In this study, the performance of different parametric methods to quantify microglial activation in healthy and AD subjects using (R)-[11C]PK11195 and PET was evaluated by comparing the results of these methods with those of full compartmental analysis using NLR, which is considered to be the gold standard for ROI data. Use of accurate and precise parametric data is of interest for use within statistical parametric mapping to better localise changes in PK11195 binding or to study PK11195 binding heterogeneity (at a voxel level).
Logan Graphical Analysis with Plasma Input
The Logan plot is a simple linear method, which allows for the estimation of the Vd of any reversible ligand, irrespective of the number of compartments (Logan et al, 1990). Using computer simulations, however, it has been shown that this graphical analysis may be affected by the presence of blood-borne activity and noise-induced bias (Slifstein and Laruelle, 2000). The present simulations indicate that, for (R)-[11C]PK11195, this bias is relatively small, that is, lower than 5% for noise levels up to 15% (Figure 3). These latter observations are consistent with the excellent results obtained for clinical data, showing good correlation between Logan and NLR results (Figure 2A). Data observed for elderly and AD subjects did not differ from those obtained using younger subjects. No difference in noise-induced bias between subject groups was observed as scan statistics are approximately equal for all subject groups. The latter might be explained by the fact that the total (specific + nonspecific) binding across the entire brain is not significantly different between subject groups. Although noise-induced bias seems small at clinically relevant noise levels for the present (R)-[11C]PK11195 studies, larger biases were observed at higher noise levels (simulation studies), consistent with the observations of Slifstein and Laruelle (2000). The excellent correlations (0.88) for clinical data also suggest that, in practice, the presence of a small blood volume fraction (<0.05) may be neglected during Logan plot analysis. In addition, simulations indicated that the precision of Logan graphical analysis is more sensitive to noise than some of the parametric reference tissue methods. Standard deviations seen with Logan plot analysis were approximately twofold higher than those of reference tissue input parametric methods. Reduced precision of the Logan graphical analysis also explains the slightly decreased correlation coefficient than those found for ICH1, RPM1, and reference Logan compared with BPSRTM (Table 3). Overall, it can be concluded that Logan graphical analysis with plasma input provides a fast and reasonably accurate method to obtain Vd for (R)-[11C]PK11195 and, therefore, can be used in disorders in which a reference tissue cannot be defined.
Parametric Reference Tissue Methods
Logan also introduced a noninvasive model to estimate the DVR (Logan et al, 1996) based on a reference tissue input (reference Logan). Simulated data showed results with some negative bias, but high precisions at normal blood flow (Figure 4). Again, for clinical data, there was good correlation with the NLR method (Tables 3 and 4). Although correlations of clinical data were still reasonable, for simulated data, substantial bias in BP was seen compared with DVR-1 data. The larger negative bias in specific parametric BP with regard to DVR-1 compared with that with regard to BPSRTM was observed both in simulations and in clinical data (Figure 2B versus Figure 2C). Possible reasons for this difference will be discussed below. The bias in BP was not only observed for the reference Logan method, but for all other parametric reference tissue methods (Figure 2, Tables 3 and 4).
Results of linear regression analyses of parametric (R)-[11C]PK11195 BP compared with DVR-1 based on Vd obtained using a two-tissue compartment model with plasma input and K1/k2 fixed to whole cortex value
DVR, distribution volume ratio; NLR, nonlinear regression; ROI-TAC, regions of interest-time–activity curves; SRTM, simplified reference tissue model.
Ichise et al (1996) presented a multilinear regression technique that, unlike the Logan plot, does not require the assumption that the ratio of concentrations in target and reference regions becomes constant (note that this method, which is denoted as ICH1 in the present manuscript, corresponds to MRTM0 in the original manuscript). Because ICH1 contains more parameters than reference Logan, it may, at least in theory, be more accurate but less precise. The present simulations showed an almost constant negative bias of ICH1 of around −15% to −20% compared with BPSRTM for noise levels of 15% (Figure 4A). Larger biases were observed compared with DVR-1, as will be discussed later.
To reduce noise-induced bias, Ichise et al (2002) modified the operational equation of the multilinear regression model (this method is denoted ICH2 in the present manuscript and corresponds to MRTM in the original manuscript). The present simulations indeed showed slightly decreased bias compared with ICH1 at very low noise levels only. Variability, however, was much higher, even for low noise levels, which is consistent with the results for other tracers reported by Ichise et al (2003). This poorer precision of ICH2 is also reflected in the lower image quality seen in the clinical data (Figure 1). Both simulations and clinical evaluations indicate that ICH2 is not an improvement compared with ICH1 for obtaining (R)-[11C]PK11195 BP images.
The present data also show that receptor parametric mapping (Gunn et al, 1997) (denoted RPM1 in the present manuscript) provided the most accurate fits with relatively low variance levels. Correlations with NLR confirmed the robustness of this method. Both accuracy and precision were better than those obtained with ICH1. Simulations indicated that, in the presence of flow deficits, RPM1 and RPM2 show less bias and higher precision than reference Logan and ICH1. These results indicate that RPM1 and RPM2 might be preferred for studies where changes in blood flow across the brain can be expected, although all methods failed to provide accurate BP values in case of very large flow deficits (−50%). Another advantage of RPM1 (and RPM2) is that it also provides parametric relative flow distributions (R1 images, Figures 1H and 1I). Evaluation of accuracy and precision of the latter R1 images is beyond the scope of this study, which focuses on assessment of (R)-[11C]PK11195 binding.
To further improve precision, Wu and Carson (2002) developed an adjusted version of this RPM method. In this latter method (denoted RPM2 in the present manuscript), a global reference region clearance rate constant k′2 was used. The method consists of two steps. First RPM1 is applied providing k′2 per pixel (in addition to BP and R1). Because k′2 represents the clearance rate constant of the reference tissue, it should be the same for all image voxels. Next, the median k′2 value in voxels showing a BP > 0 is calculated and fixed in a subsequent RPM step. Simulations showed that RPM2 provided comparable BP results (including precision) as RPM1 for DVR-1 values of 0.2 and higher. From the example images shown in Figures 1H and 1I, it can be seen that use of RPM2 will mostly improve the quality (precision) of the R1 images, which was confirmed by simulations showing a more than two-fold improvement of s.d. for R1 (data not shown). Thus, reducing the number of fit parameters within RPM2 compared with RPM1 improves R1 but does not improve accuracy and precision of BP. Moreover, in case of low DVR-1 values (<0.2), RPM2 showed less accurate BP values for most of the noise levels studied. In previous studies (Schuitemaker et al, 2006), it was observed that for most regions, including the thalamus, BP values are generally much lower than 0.2, even for subjects suffering from mild cognitive impairment or AD. The negative bias of RPM2 at these low BP values is also reflected in the lower values for the intercept (Table 3), indicating a small underestimation for low BP values. The somewhat poorer performance of RPM2 for low BP values is not yet fully understood, but is probably caused by small mismatches between ‘true’ and estimated k′2 values due to the low uptake (poor statistics) of (R)-[11C]PK11195. In addition, the selection of a specific range of basis functions could affect accuracy and precision of both RPM1 and RPM2 (Gunn et al, 1997). Although the range and number of basis functions was optimised in this study, selection of a different range might lead to (slightly) different results. In practice, selection of a specific range of basis functions is slow and inefficient and is based on a compromise between accuracy and precision, as has recently been investigated by Cselenyi et al (2006).
Effects of Blood Volume and Blood Flow on Accuracy of Reference Tissue Parametric Methods
In the simulation studies, a fairly constant relative underestimation of BPSRTM compared with plasma input-derived DVR-1 was observed for all parametric reference tissue input methods studied. This discrepancy between ‘true’ DVR-1 and observed BP values is likely caused by the effects of a blood volume fraction within the TAC. In the 8th and 9th column of Table 2, plasma input DVR-1 and BPSRTM, calculated using noiseless TAC, are given. When blood volume fractions are approximately equal for both reference and target tissue, a small underestimation of about 10% in BPSRTM compared with DVR-1 is seen. Reduction of flow and large differences in blood volume between reference and target tissues increases the difference between DVR-1 and BPSRTM. These differences indicate the inability of SRTM to obtain accurate (specific) BP estimates under these specific conditions. Note also that a larger blood volume fraction in the target region compared with the reference region increases R1 as can be deduced from Table 2, target region 7. This also explains the clearly visible sagittal sinus in the R1-images shown in Figures 1H and 1I. Gunn et al (1997) already showed that presence of blood volume (i.e., intravascular activity) can affect accuracy and precision of SRTM. At lower flows, the relative contribution of activity from blood to the total TAC in the early frame (<2mins) increases, and this explains the increased negative bias of SRTM (due to overestimation of R1). It can be expected that parametric methods using a reference tissue TAC as input function will show a similar dependency on flow and blood volume fraction as SRTM. In fact, this can be observed in Figure 2C and Table 4, showing a trend for underestimation of BP for all parametric methods compared with plasma input-derived DVR-1. The simulations also confirmed that, in general, BP calculated using parametric reference tissue methods most closely agreed with BPSRTM. Of all methods tested, RPM1 most closely corresponded with results from SRTM, as both methods are essentially the same.
The above considerations suggest that BP would be most accurately estimated from DVR-1, with Vd values obtained using a plasma input two-tissue compartment model, including for a parameter for blood volume fraction. In the case of (R)-[11C]PK11195, however, DVR is the ratio of two (relatively large) Vd values having a very small difference, as generally BP is very low (<0.2 for the present clinical data including AD subjects). Consequently, BP estimates using DVR-1 will be very noisy. The poor correlations between parametric methods and DVR-1 in Figures 2C and 2D are not only owing to the presence of a (variable) blood volume fraction, but also reflect the uncertainty in DVR-1 estimates. Estimated uncertainty of Vd for the clinical data was of the order of 3% to 5% and, consequently, for Vd's around 0.7 and specific BP of 0.1, DVR-1 will have an uncertainty of approximately 20% to 80% (or 0.02 to 0.05 = 1 s.d.).
In addition to the above discussion concerning the effects of blood volume on the accuracy of BPSRTM, it should be kept in mind that both plasma input-derived DVR-1 values and BPSRTM suffer from bias in presence of nonspecific binding. Assuming that the reference Vd equals K1/k2(1 +k5/k6), where k5/k6 reflects nonspecific BP and the target region Vd equals K1/k2(1 + k3/k4 + k5/k6), where k3/k4 represent specific BP, it can easily be seen that DVR-1 equals (k3/k4)/(1+k5/k6). Consequently, DVR-1 does not provide specific BP, but a ‘specific’ BP measure whose value is scaled by 1 + nonspecific BP. Therefore, in this paper (reference tissue), parametric methods were also directly compared with their equivalent (nonparametric) method (i.e., BPSRTM). The question whether to use a certain reference tissue model has been addressed previously (Kropholler et al, 2006). Comparison of various different reference tissue models confirmed that SRTM provided (specific) BP values, which correlated reasonably well with plasma input values and SRTM was recommended for the analysis of clinical PK11195 studies.
It can be concluded from this study that RPM1 is the most suitable parametric reference tissue input method, providing BP values that most closely correspond to those obtained with SRTM. Clinical data indicated that ICH1 and reference Logan might be good (and faster) alternatives in the absence of flow deficits.
Limitations
The methods investigated in this study represent commonly used parametric methods in neuroreceptor imaging. Another (third) modification of the multilinear regression technique, described by Ichise et al (2003), was not investigated, as this method is based on assuming a global reference region clearance constant k′2 for all pixels, thereby reducing the number of fit parameters, similar to the approach adopted in RPM2. This method was omitted because of the somewhat poorer performance of RPM2 for clinically relevant DVR-1 values (< 0.2), indicating that fixing k′2 does not necessarily provide an advantage for obtaining BP in case of (R)-[11C]PK11195 studies.
Other parametric methods based on using a spectrum of basis functions have been described. For example, application of spectral analysis (SA) in neuroreceptor PET studies was first described by Cunningham and Jones (1993). Spectral analysis can be used to obtain (parametric) Vd images. It has the advantage compared with Logan graphical analysis in that it allows inclusion of high-frequency basis functions, enabling the incorporation of a blood volume component. Therefore, in theory, SA could provide more accurate results than those obtained with Logan plots. Initial attempts to use SA, however, resulted in exceedingly long computation times. Considering these long computation times and the fact that Logan graphical analysis already performed very well for (R)-[11C]PK11195, use of SA was not further attempted. Nevertheless, it should be mentioned that SA may outperform Logan graphical analysis for other tracers.
Gunn et al (2002) described a method called ‘Basis Pursuit’, which is an algorithm related to SA, in that it uses a spectrum of basis functions. The advantage of Basis Pursuit over SA is that a reference tissue input function can be used. The use of a reference tissue input within Basis Pursuit is facilitated by including a penalty term in the cost function, allowing for regularisation of fits during the optimisation process. Unfortunately, the method is also relatively slow and considerable computation time and large memory stacks are needed to generate parametric images. Again, Basis Pursuit might be the method of choice when linear methods such as ICH1, ICH2, and reference Logan do not perform satisfactorily.
Conclusion
Logan graphical analysis is a robust and fast method to obtain parametric Vd images for (R)-[11C]PK11195 PET studies. Among the parametric reference tissue methods, ICH1, RPM1, and reference Logan provide accurate and precise estimates of BP at normal flow rates compared with SRTM results. Simulations suggest that RPM1 is the best candidate for conditions with reduced flow rates, as reference Logan and ICH1 show more bias than RPM1 in the presence of flow deficits.
Footnotes
Acknowledgements
We thank the control subjects for participating in this study, the personnel of the BV Cyclotron VU for the production of [11C]CO2, and the staff of the Department of Nuclear Medicine & PET Research for the production of (R)-[11C]PK11195, data acquisition, and blood metabolite analysis.