
Abstract
(R)-[11C]PK11195 ([1-(2-chlorophenyl)-N-methyl-N-(1-methylpropyl]-3-isoquinoline carboxamide) is a ligand for the peripheral benzodiazepine receptor, which, in the brain, is mainly expressed on activated microglia. Using both clinical studies and Monte Carlo simulations, the aim of this study was to determine which tracer kinetic plasma input model best describes (R)-[11C]PK11195 kinetics. Dynamic positron emission tomography (PET) scans were performed on 13 subjects while radioactivity in arterial blood was monitored online. Discrete blood samples were taken to generate a metabolite corrected plasma input function. One-tissue, two-tissue irreversible, and two-tissue reversible compartment models, with and without fixing K1/k2 ratio, k4 or blood volume to whole cortex values, were fitted to the data. The effects of fixing parameters to incorrect values were investigated by varying them over a physiologic range and determining accuracy and reproducibility of binding potential and volume of distribution using Monte Carlo simulations. Clinical data showed that a two-tissue reversible compartment model was optimal for analyzing (R)-[11C]PK11195 PET brain studies. Simulations showed that fixing the K1/k2 ratio of this model provided the optimal trade-off between accuracy and reproducibility. It was concluded that a two-tissue reversible compartment model with K1/k2 fixed to whole cortex value is optimal for analyzing (R)-[11C]PK11195 PET brain studies.
Introduction
(R)-[11C]PK11195 ([1-(2-chlorophenyl)-N-methyl-N-(1-methylpropyl]-3-isoquinoline carboxamide) is a specific ligand for the peripheral benzodiazepine receptor. This receptor is expressed by mitochondria in cells of the mononuclear phagocyte lineage. Expression of this receptor is very low in healthy adult brain, but high in the presence of activated microglia, the brain's intrinsic macrophage (Banati et al, 1997).
Both a racemic mixture and the (R)-enantiomer of PK11195, with its higher uptake (Shah et al, 1994), have been used as positron emission tomography (PET) tracers for quantifying microglia activation. Various neurologic disorders such as Alzheimer's disease (Groom et al, 1995; Cagnin et al, 2001a), multiple sclerosis (Banati et al, 2000; Debruyne et al, 2003), stroke (Pappata et al, 2000), Rasmussen's encephalitis (Banati et al, 1999), herpes encephalitis (Cagnin et al, 2001b), amyotrophic lateral sclerosis (Turner et al, 2004), and multiple system atrophy (Gerhard et al, 2003) have been investigated.
All these studies used a reference tissue to quantify uptake, either by applying the simplified reference tissue model (Lammertsma and Hume, 1996) or by using uptake normalized to a reference region (Groom et al, 1995; Versijpt et al, 2003; Debruyne et al, 2003).
Two of these studies used the cerebellum as reference region, one cortical gray matter and another the contralateral hemisphere. Five studies used cluster analysis to extract the reference tissue because no a priori unaffected region could be defined. The use of a reference tissue method, however, has never been validated for (R)-[11C]PK11195 binding. This validation requires comparison with a plasma input model.
Unfortunately, to date, no (R)-[11C]PK11195 study using a metabolite corrected plasma input function has been reported. The purpose of the present study was, therefore, to determine which tracer kinetic plasma input model most accurately describes (R)-[11C]PK11195 kinetics.
Materials and methods
Subjects
Thirteen subjects (two patients with Alzheimer's disease, five patients with mild cognitive impairment, and six healthy controls) were included in the study. All subjects gave informed consent before scanning. The study was approved by the medical ethics committee of the VU University Medical Center. In the present study, patient data were used only for model development. Comparison of results between patients and controls is beyond the scope of the present study and will be reported elsewhere.
Scanning Protocol
Studies were performed in 3D mode using an ECAT Exact HR + scanner (CTI/Siemens, Knoxville, TN, USA) Characteristics of this scanner have been described elsewhere (Brix et al, 1997; Adam et al, 1997). Before tracer administration, a 10-min transmission scan in 2D mode was performed, which was used to correct the subsequent emission scans for attenuation. Then a [15O]H2O emission scan was acquired, but data from this scan were not used in the current study. Finally, a 1 h (R)-[11C]PK11195 emission scan was performed. Time frames used were (in order) 1 × 30, 1 × 15, 1 × 5, 1 × 10, 2 × 15, 2 × 30, 3 × 60, 4 × 150, 5 × 300, and 2 × 600 secs. The first frame was used to correct for background radioactivity from the previous [15O]H2O scan. In all, 224 ± 47 MBq (R)-[11C]PK11195 with a specific activity of 94 ± 34 GBq/μmol (all data are expressed as mean ± s.d.) at the time of injection was administered as a bolus simultaneously with the start of the second frame. Arterial blood was withdrawn continuously using an online blood sampling device described previously (Boellaard et al, 2001). At 3, 5, 10, 20, 30, 40, and 60 mins after tracer injection, blood sampling was interrupted briefly for withdrawal of manual samples followed by flushing the arterial line with heparinized saline. These manual samples were used to determine plasma and whole blood concentrations using a cross-calibrated well counter and plasma metabolite concentrations using HPLC as described previously (Greuter et al, 2004).
In addition, T1 weighted magnetic resonance imaging (MRI) scans were acquired using a 1 T IMPACT scanner (Siemens Medical Solutions, Erlangen, Germany), which was used for segmentation of gray and white matter and for region of interest (ROI) definition.
Image Reconstructions
All emission scans were normalized and corrected for attenuation, randoms, dead time, scatter, and decay. Emission scans were reconstructed using filtered back-projection with a Hanning filter with a cutoff of 0.5 times the Nyquist frequency. A zoom factor of 2 and a matrix size of 256 × 256 × 63 were used resulting in a voxel size of 1.2 × 1.2 × 2.4 mm and a spatial resolution of approximately 7 mm full-width at half-maximum at the center of the field of view.
Magnetic resonance imaging scans were generated with a voxel size of 0.98 × 0.98 × 1.49 mm.
Region of Interest Definition and Extraction of Time Activity Curves
The skull was removed from the MRI scans using a brain extraction tool (Smith, 2002), which is part of the FMRIB software library (www.fmrib.ox.ac.uk/fsl, Image analysis group, Oxford, UK). Deskulled brain and corresponding PET scans were aligned using a mutual information algorithm included in the image registration package MIRIT (Maes et al, 1997; West et al, 1997). Correct alignment was checked visually. The MRI scan was also used to perform a gray/white matter segmentation to generate specific gray and white matter time activity curves (TACs). This segmentation was performed using an expectation-maximization algorithm (Zhang et al, 2001), which is part of the FMRIB software library. The segmentation automatically removed the ventricles from the ROIs. Only gray matter TACs were used in the present study.
Regions of interest for the cerebellum, temporal lobe, anterior cingulate, hippocampus, parahippocampus, amygdala, thalamus, pons, and whole cortex were drawn on the fused MRI scan. Regions were drawn for left and right structures separately except for the pons and whole cortex. Left and right ROIs were also summed and used as additional ROIs.
Kinetic analysis
Kinetic analyses were performed using dedicated software developed within matlab 5.3 (The Mathworks, Natick, MA, USA). A metabolite corrected plasma function was obtained in the following way. Plasma/whole-blood ratios obtained from the manual blood samples were fitted to an exponential function. The whole blood (online sampler) curve was multiplied with this exponential function to obtain the corresponding plasma curve. The (R)-[11C]PK11195 parent fraction in the plasma samples was fitted to the function f = 1-a(2-exp(−bt)-exp(−ct)), where f is the parent fraction and a, b, and c are the fitted parameters. The plasma curve was multiplied with this function to obtain the metabolite corrected plasma input function. Various other fits for plasma/whole blood ratio and metabolite level were investigated but did not perform any better (Lubberink et al, 2004). Delay between arrival of the (R)-[11C]PK11195 bolus in the brain and at the online blood detector was estimated by fitting a reversible two tissue compartment model including blood volume and delay to the subjects' whole cortex TAC as described previously (Lammertsma et al, 1996). Separate input functions for whole blood (blood volume) and metabolite corrected plasma (tissue input) concentrations were used. Delay was then fixed to this value for all other ROIs.
Three different compartment models (Gunn et al, 2001) were fitted to the TACs: a one-tissue compartment model, an irreversible two-tissue compartment model and a reversible two-tissue compartment model (Figure 1). Again, separate input functions for whole blood (blood volume) and metabolite corrected plasma (tissue input) concentrations were used in these models. In addition, the reversible two-tissue compartment model was investigated using fixed values for K1/k2, k4, and blood volume (Vb). K1/k2 is the ratio of forward and backward transport rate constants across the blood-brain barrier and k4 is the rate of disassociation from the bound compartment. Fixed values of K1/k2, k4, and Vb used for all TACs were derived by applying a reversible two-tissue compartment model to the whole cortex TAC of each patient. Time activity curves were weighted with the square of the frame duration divided by the number of trues in the frame. A weighted version of the Akaike information criterion, corrected for small sample sizes (Akaike, 1974; Turkheimer et al, 2003), hereafter referred to as the Akaike information criterion (Sugiura, 1978; Hurvich and Tsai, 1989), was used to determine which model provided the best fit to the data. The effect of ROI size on model selection was also examined, as higher noise levels (smaller ROIs) are likely to favor models with less parameters.
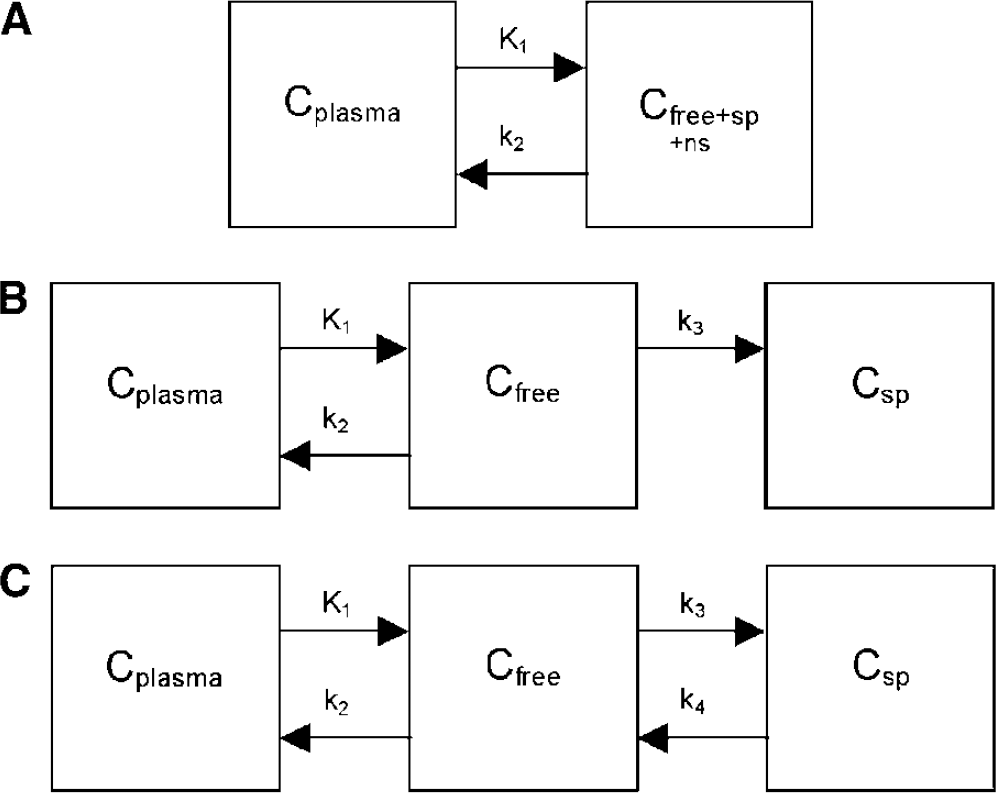
Compartment models used: (
Fixing parameters or their ratio requires that these parameters are relatively constant over all regions for each patient. To validate the assumption that K1/k2 was constant over the brain, the variability of K1/k2 for large ROIs (defined as larger than 3 mL, i.e., cerebellum, left, right and summed frontal lobe, temporal lobe) compared with that of the whole cortex K1/k2 was investigated. The relationship between K1/k2 and ROI size was assessed to examine the hypothesis that K1/k2 variance measured in small ROIs was mainly because of noise. The same procedure was used for k4 and Vb.
Monte Carlo Simulations
Monte Carlo simulations were performed to investigate the effects of noise and of fixing K1/k2, k4, and Vb to incorrect values on both bias (percentage difference between observed and actual values) and reproducibility (expressed as coefficient of variation (COV)) of binding potential (BP) and volume of distribution (Vd). Binding potential was defined as k3/k4 and Vd as K1/k2(1 + BP). In addition, the effects of noise on the Akaike selected model were investigated.
A representative input function and typical parameters found in human data were used to create simulated TACs using a reversible two-tissue compartment model (K1 = 0.056 mL/min/mL, k2 = 0.15 min−1, k4 = 0.040 min−1, Vb = 7.1%). An average BP of 1.5 for the whole cortex ROI was derived from clinical data. Usually scanner count rates are used to estimate relative variances (and weighting factors for fitting) for all frames of a dynamic scan. Because of low extraction fraction of (R)-[11C]PK11195, this would result in very high weighting factors for the early frames, when activity is still intravascular and the data contain relatively little information on tissue kinetics. Furthermore, because the effects of the actual noise model used on measured BP and Vd values are small (Yaqub et al, 2004), Gaussian noise with an s.d. of 7.5 or 15% of the decay corrected activity was used when creating TACs. Thousand runs were performed for each noise level.
All models used to fit the patient data were also fitted to the simulated TACs, including the models with fixed parameters. Again, the optimal model was selected using the Akaike information criterion.
In addition, simulations were performed in which the effects of the differences between (simulated) correct and fixed K1/k2, k4, and Vb were investigated over a physiologically relevant range of parameters. The COVs of the parameters observed among large ROIs (cerebellum, left and right frontal lobe, temporal lobe) were used to estimate this range. They were calculated using data from all subjects after normalization of values to the individual whole cortex value to eliminate variation between subjects and to include only variation between ROIs within subjects. Fixed parameters were varied over a range corresponding to the correct value plus or minus two s.d. For K1/k2, k4 and Vb, COV of 5%, 32% and 8% were used, respectively (Table 1). Simulations were performed using a BP of 1, 2.5, and 4. The range of BP from 1 to 2.5 contains 85% of the observed clinical BP values and, in addition, the higher BP value of 4 is expected to be near the upper limit of BP in case of (severe) microglia activation. Thousand TACs were generated using Gaussian distributed noise of 7.5% s.d., which is a reasonably high noise level for ROI data.
Effect of regions of interest (ROIs) size on coefficient of variation (COV) of K1/k2, k4 and blood volume (Vb) for the reversible two-tissue compartment model with all parameters free
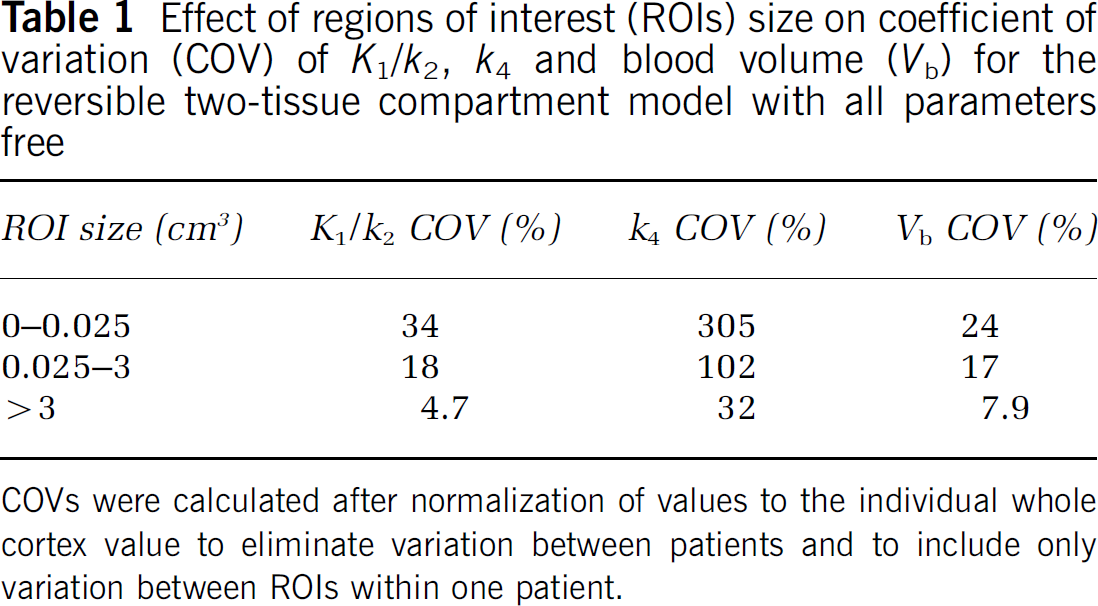
COVs were calculated after normalization of values to the individual whole cortex value to eliminate variation between patients and to include only variation between ROIs within one patient.
Results
Clinical Evaluation
A representative example of an arterial plasma (R)-[11C]PK11195 TAC is shown in Figure 2A. In addition, a corresponding TAC of an ROI (parahippocampus, volume 0.3 mL) is shown in Figure 2B together with fits to the one-tissue, two-tissue irreversible and two-tissue reversible compartment models. The plasma/whole blood ratio was approximately constant during the scan and was 1.55 ± 0.08 for the data shown in Figure 2. The parent fraction in plasma decreased during this scan to 47% after one hour. Metabolism was relatively constant across subjects.
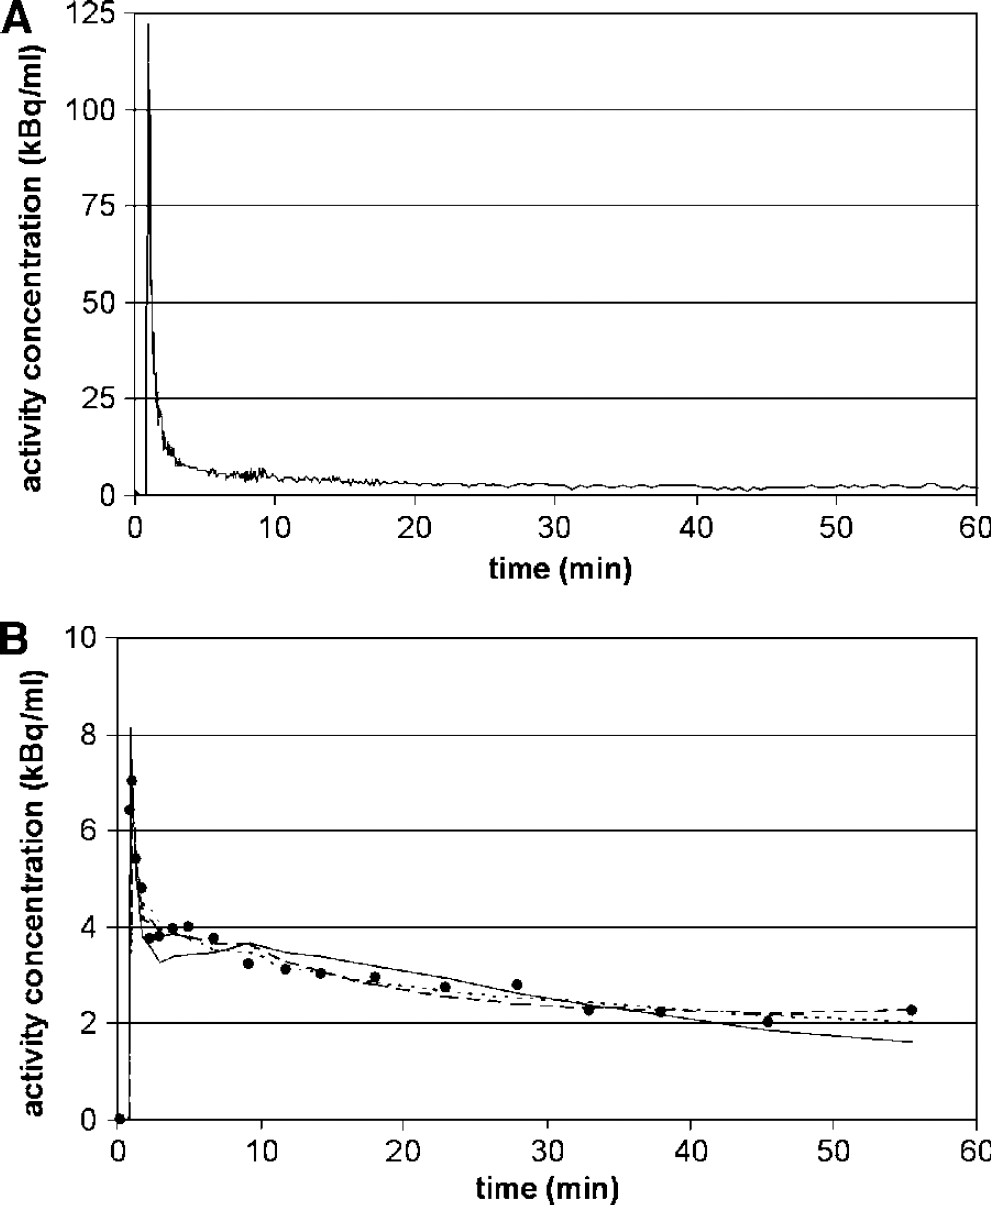
Examples of (
In case of human data, the reversible two-tissue compartment model was the Akaike selected model of choice for 94% of all large ROIs (Figure 3A). With decreasing ROI volume, and thus increasing noise level, the one-tissue and irreversible two-tissue compartment models were selected more frequently compared with the (unfixed) reversible two-tissue compartment model. Average parameters for large ROIs derived using the reversible two-tissue compartment model were K1 = 0.06 ± 0.01 mL/min/mL, k2 = 0.16 ± 0.03 min−1, k3 = 0.06 ± 0.02 min−1, k4 = 0.04 ± 0.01 min−1, BP = 1.6 ± 0.4, Vb = 7 ± 1% and Vd = 0.97 0.2.
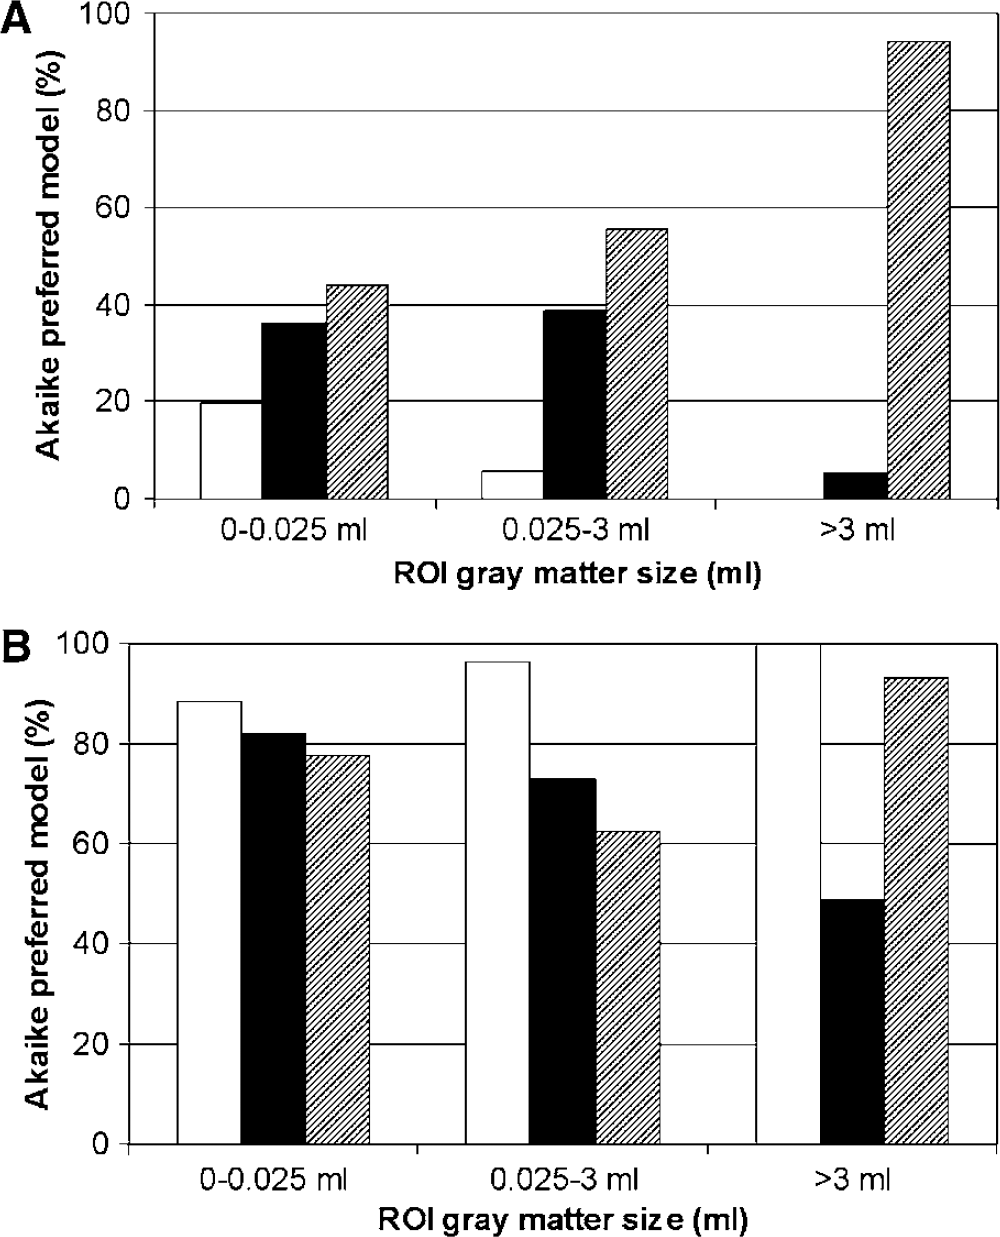
Results for human data, showing preferred model based on Akaike information criterion. The distribution of preferred model for regions of interest with various volumes is shown. (
Comparisons between the free and fixed two-tissue compartment models are shown in Figure 3B. Fixed models were not compared with other fixed models and therefore the bars do not add up to 100%. In general, models with any of the parameters fixed were selected in preference to the model with free parameters. Changing ROI size and thus varying noise level affects the selection rate of the models with fixed parameters. With increasing ROI size, selection of the model with fixed K1/k2 tends to increase, while that of the model with fixed k4 tends to decrease. The model with fixed Vb did not show a trend with varying ROI size. The model with fixed K1/k2 was selected most for all ROI sizes.
Variations observed in K1/k2, k4, and Vb over all ROIs and patients decreased with increasing ROI size. When ROI size increased from 0 to 0.025 mL to larger than 3 mL, COV decreased from 34% to 4.7% for K1/k2, from 305% to 32% for k4, and from 24% to 7.9% for Vb (Table 1). The latter COVs were calculated using data from all subjects after normalization of values to the individual whole cortex value to eliminate variation between subjects and to include only variation between ROIs within subjects.
Monte Carlo Simulations
Simulations showed that, for models with free parameters, preference for one-tissue and irreversible two tissue compartment models increased with increasing noise level (Figure 4A). In the presence of noise, two-tissue reversible compartment models with fixed parameters were selected more often than the model with free parameters (Figure 4B), with a slight preference for fixed Vb.
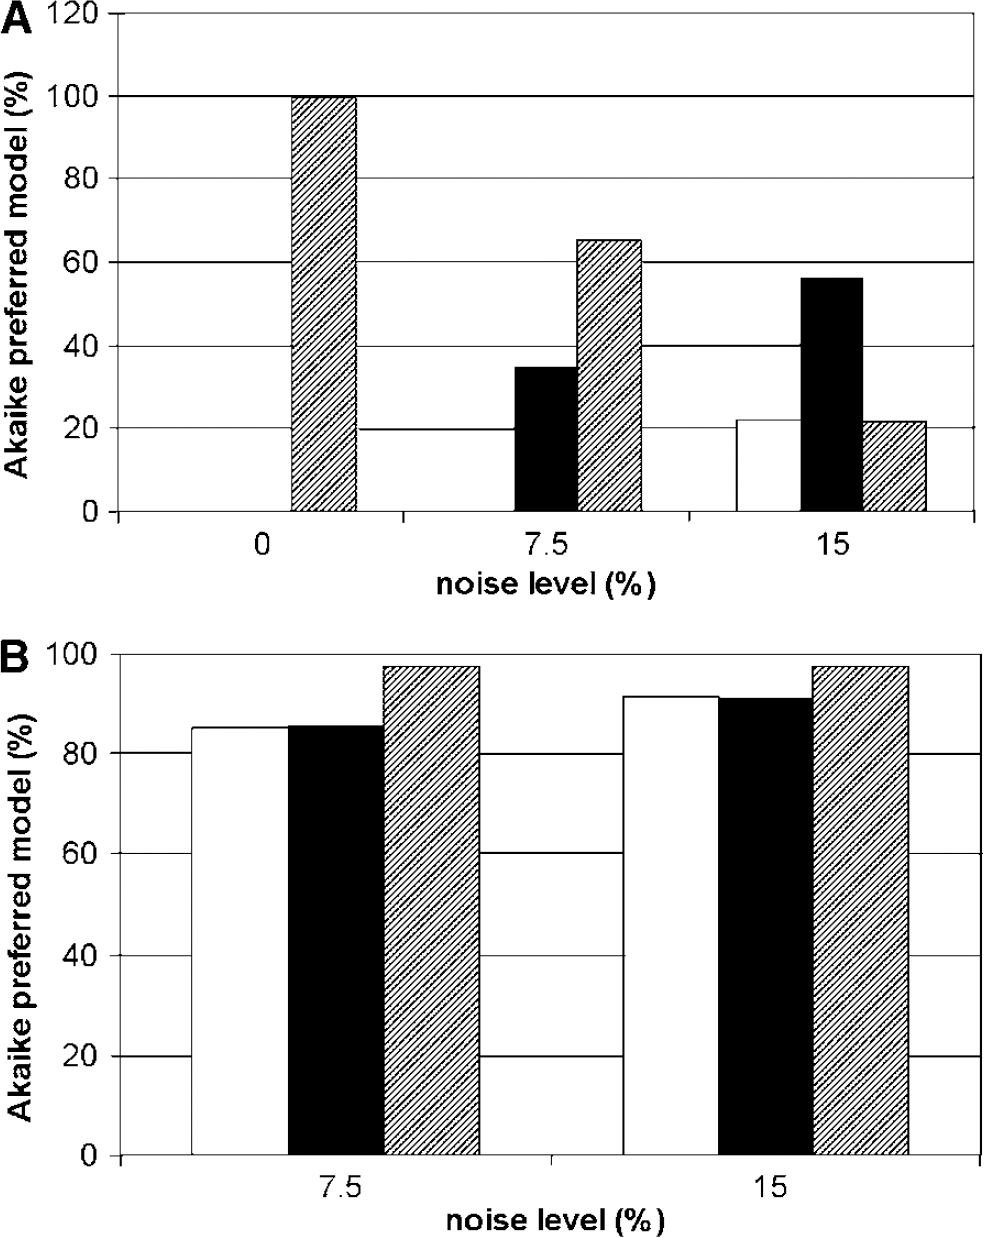
Simulations showing the effects of noise on the Akaike preferred model. (
To estimate bias and error in BP and Vd for the reversible two-tissue compartment model, simulations were performed with typical kinetic parameters and either 7.5% or 15% noise. Results obtained with free parameters and with parameters fixed at the simulated (true) values are shown in Table 2. Fixing K1/k2 decreased both bias and COVof both BP and Vd. Fixing k4 showed the same pattern, except that COV for BP increased slightly. Fixing Vb had little effect on COV, but it increased bias.
Binding potential (BP) and volume of distribution (Vd) bias and coefficient of variation (COV) for the reversible two-tissue compartment model with free parameters and with K1/k2, k4, and blood volume (Vb) fixed to their true values
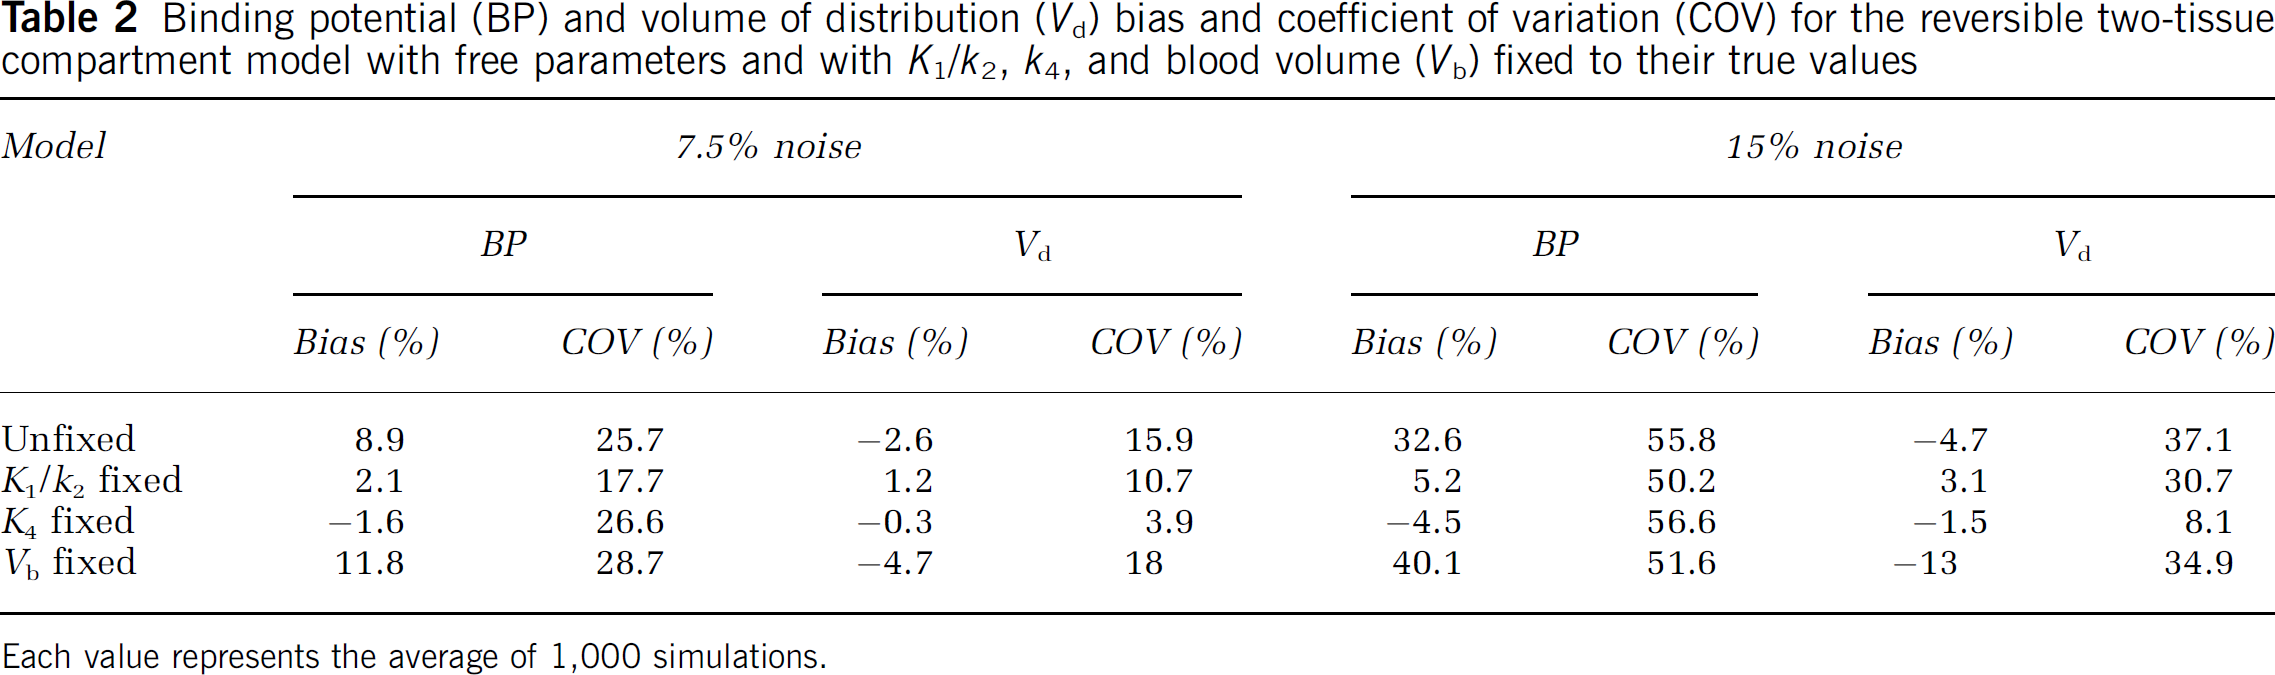
Each value represents the average of 1,000 simulations.
To estimate potential bias in BP and Vd as a result of fixing K1/k2, k4, or Vb to incorrect values, simulations were performed with these parameters fixed to values over an estimated relevant physiologic range (two s.d. of observed values in large ROIs). The noise level used was 7.5%. Results from simulations showing bias and COV in measured BP are shown in Figure 5, while bias and COV in measured Vd are shown in Figure 6.
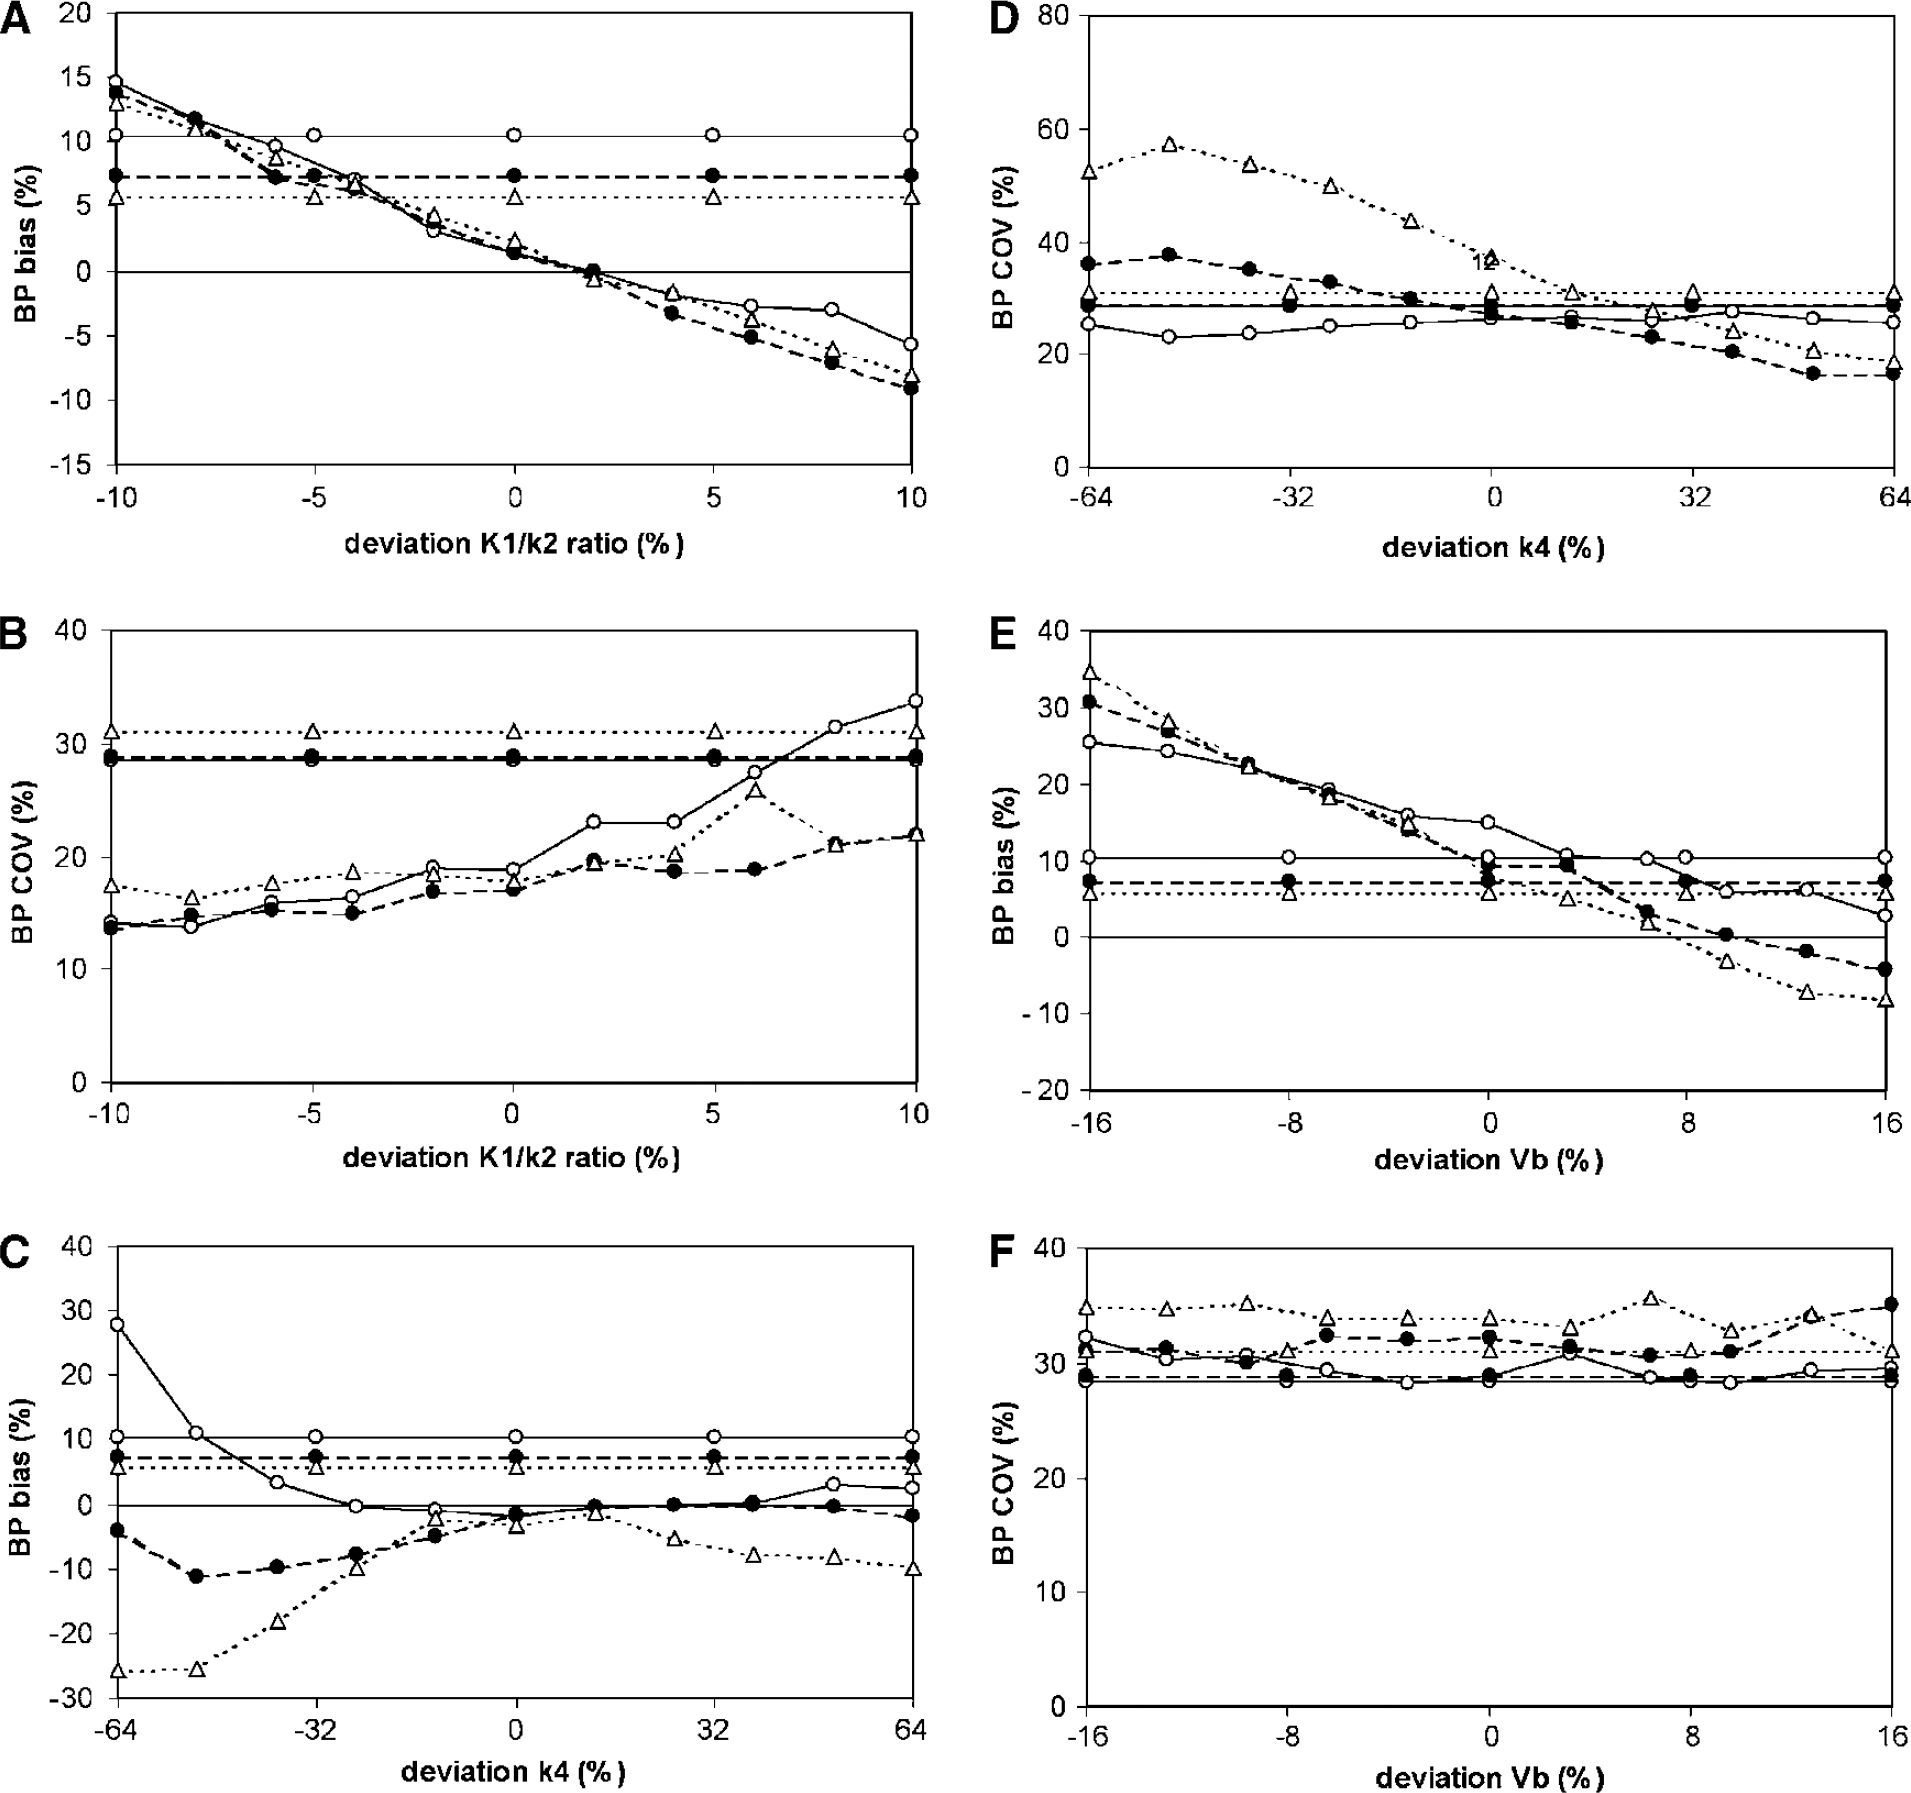
Simulations showing the effects of fixing K1/k2 (
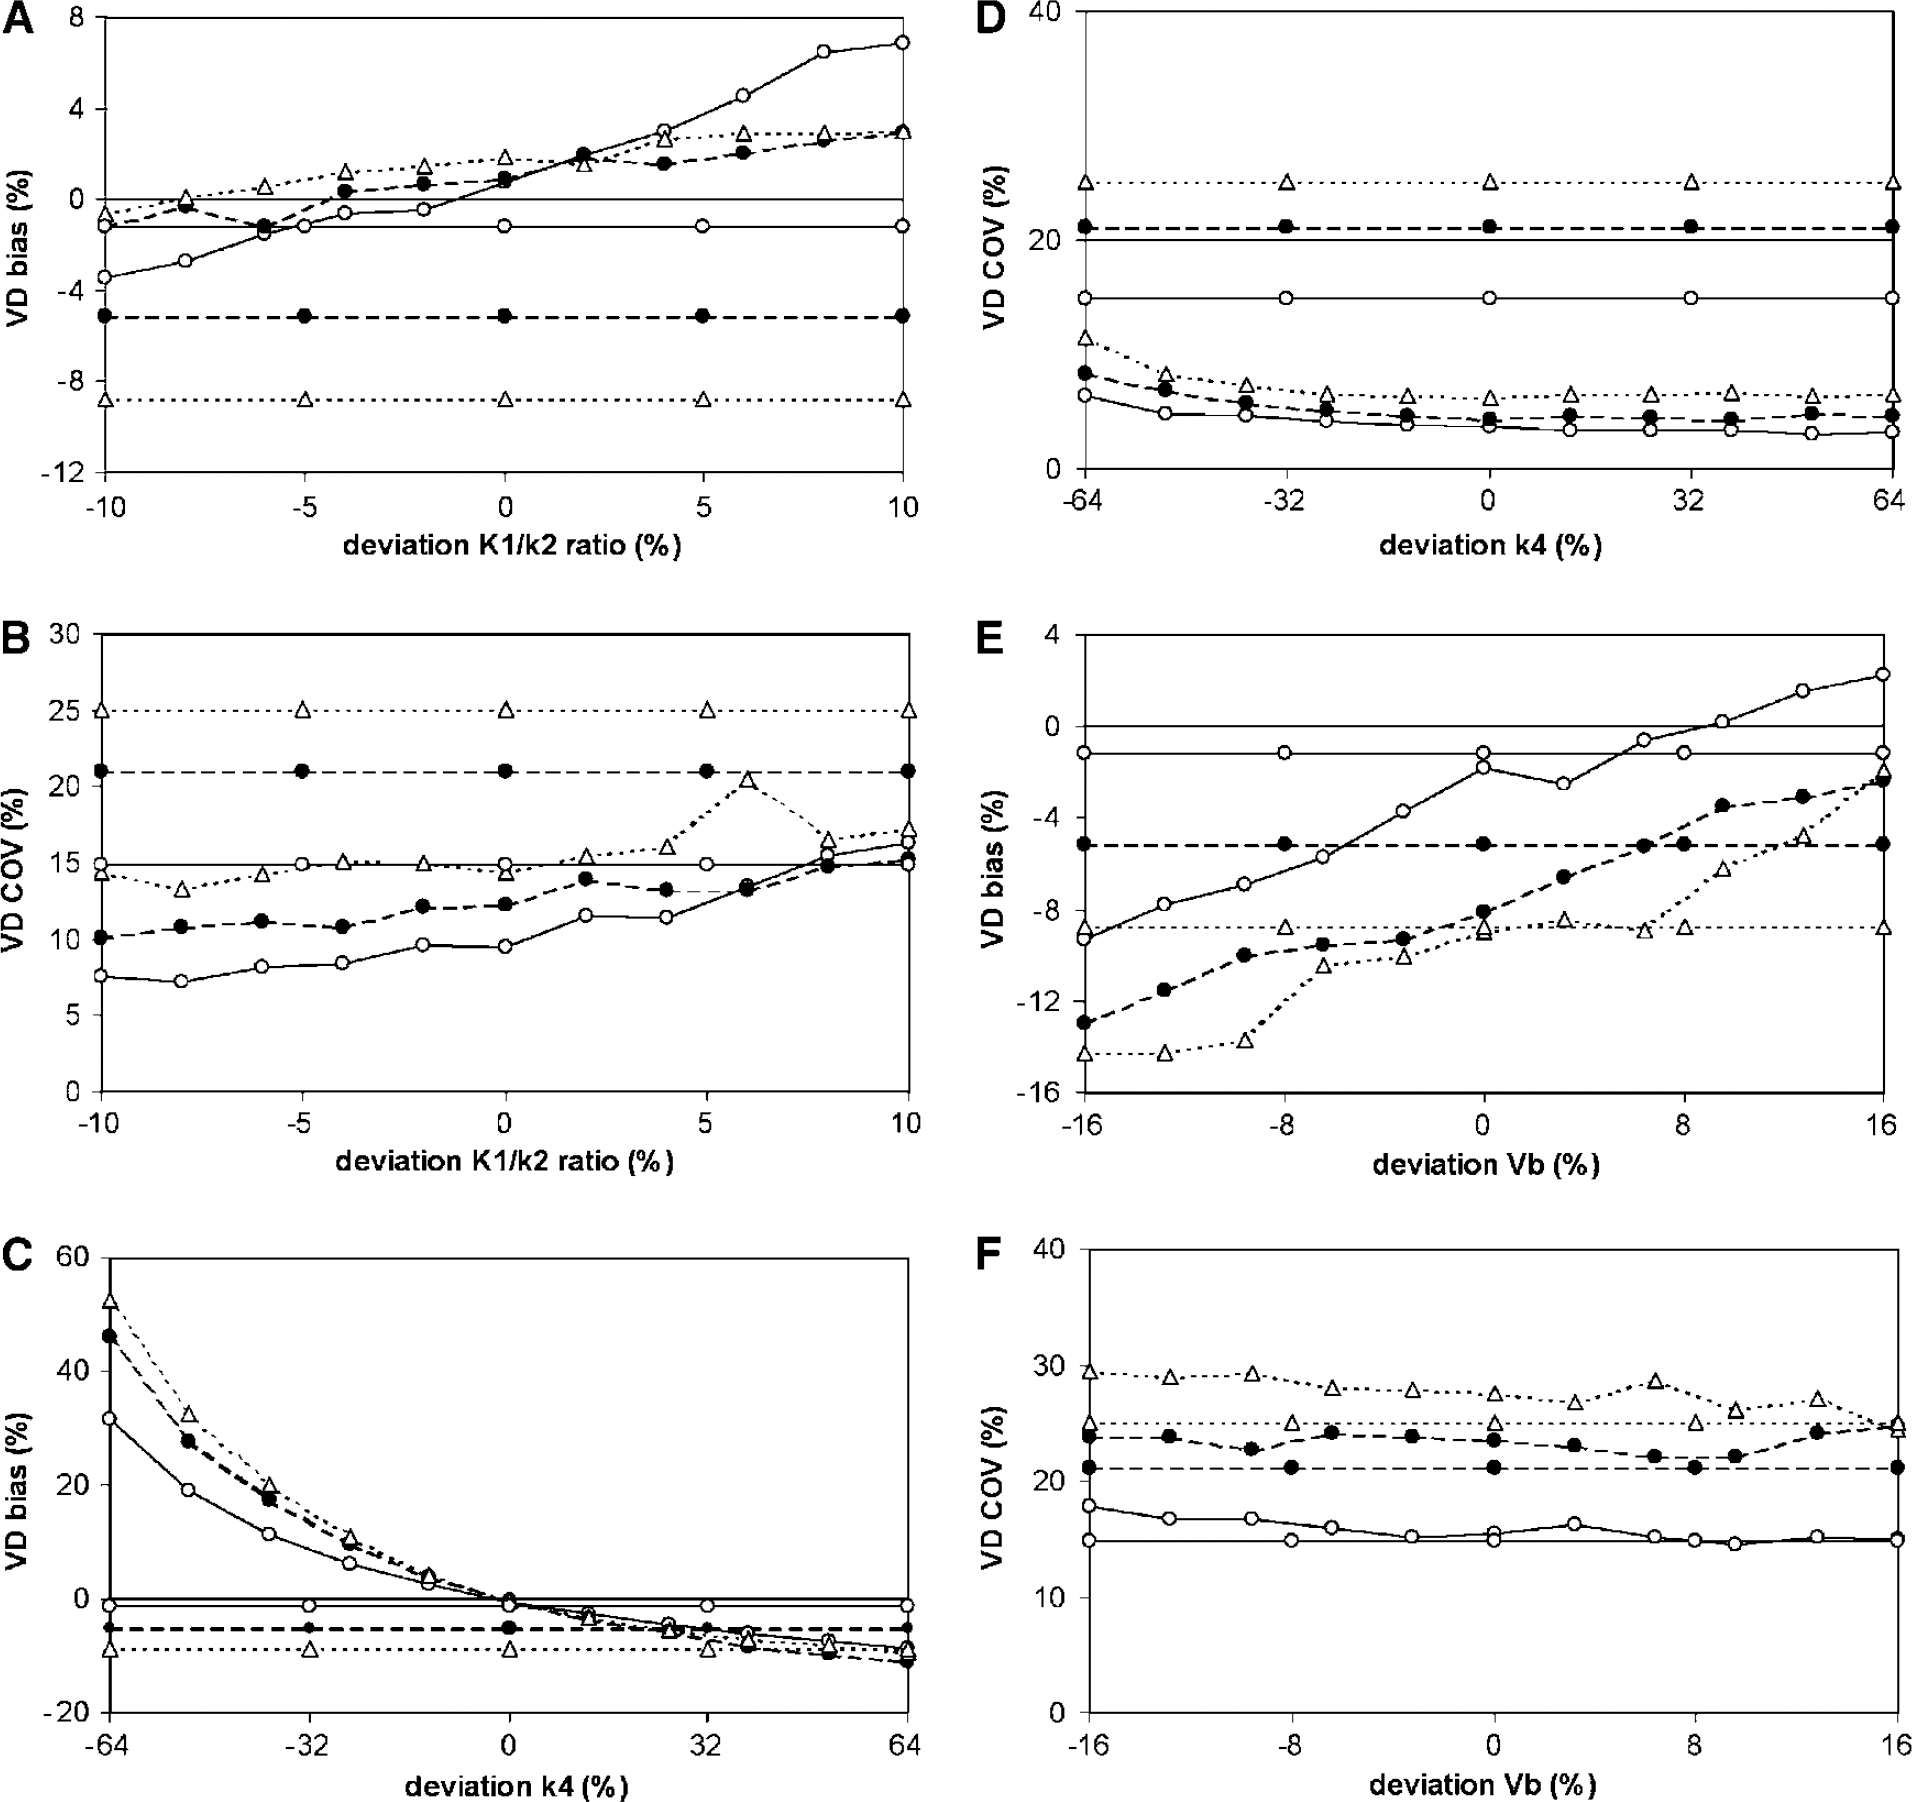
Simulations showing the effects of fixing K1/k2 (
Fixing K1/k2 decreased BP bias (Figure 5A) for all BP values simulated and for the major part of the range of simulated K1/k2 values. In addition, COV of BP became smaller for most simulated BP values (Figure 5B). Vd bias (Figure 6A) was smaller for almost the entire range of fixed K1/k2 values and for all of the simulated BP values. However, COV of Vd was much better than for the model with free parameters (Figure 6B). This was the case for all simulated BP values and for almost the entire range of simulated fixed K1/k2 values.
Fixing k4 decreased BP bias over most of the range of fixed k4 values (Figure 5C). However, at the lower level of fixed k4 values, bias became larger than that obtained with the reversible two-tissue compartment model without fixed parameters. Moreover, COV of BP did not improve or even worsened compared with the COV values obtained with the free model (Figure 5D). When k4 was underestimated by more than 1 s.d. (i.e., 32% or more), bias in Vd was much worse than that calculated with the free model (Figure 6C). However, COV of Vd improved significantly by fixing k4 (Figure 6D).
For all simulated BP values, fixing Vb resulted in BP bias that was larger than for the free model (Figure 5E) even for small deviations between true and fixed values. COV of BP was comparable between fixed and free models for all simulated BP values (Figure 5F). For Vd, fixing Vb resulted in bias similar to that for the free model and COV equal to or larger than that of the free model (Figures 6E and F).
Discussion
Throughout this study, the general approach to finding the best plasma input model for a tracer was used. This approach consists in comparing the one-tissue, two-tissue irreversible, and two-tissue reversible compartment models and selecting the best (Lammertsma, 2003) based on independent statistical criteria, in this case the Akaike criterion. Also based on additional simulations, the two-tissue reversible model was selected as the optimal compartment model for (R)-[11C]PK11195 studies with plasma input. Variations of this model with K1/k2, k4, or Vb fixed to whole cortex values were evaluated to see whether a decrease of bias and/or COV of the parameters of interest, BP and Vd, could be achieved. Again, the Akaike criterion was used to compare these modifications formally. In addition, the sensitivity of BP and Vd to fixing K1/k2, k4, or Vb to incorrect values was investigated by estimating the resulting bias and COV (of BP and Vd) over the physiologic range of K1/k2, k4, and Vb.
The reversible two-tissue compartment model was, at low noise levels, the preferred model according to the Akaike information criterion (Figure 3A). The increased frequency of other models for smaller ROI is likely because of higher noise levels as illustrated by the simulation studies (Figure 4A). Therefore, it is concluded that the reversible two-tissue compartment model best describes the underlying physiology.
The model with fixed K1/k2 ratio was, in patient data, the method of choice according to the Akaike information criterion (Figure 3B). Monte Carlo simulations showed a slight preference of the Akaike information criterion for fixing Vb (Figure 4B). In these simulations, however, parameters were fixed at the exact value and clearly this is not necessarily the case for patient data. Simulations with K1/k2 fixed to the correct value indicated that this improved both bias and COV of BP and Vd (Table 2). Interestingly, even if K1/k2 was fixed to the wrong value, bias was smaller than that for the model with free parameters for most of the K1/k2 values investigated. As expected, the same was true for COV (Figures 5 and 6). Therefore, it is concluded that, in general, fixing K1/k2 results in more reliable estimates of both BP and Vd.
The assumption that K1/k2 is constant may not be correct under certain conditions, for example, when the blood-brain barrier is disrupted. The results indicate, however, that use of fixed K1/k2 values provides acceptable results for a clinically relevant range of K1/k2 deviations (Figures 5 and 6). In case of severe abnormalities, such as in neurotrauma, fixing K1/k2 should be further evaluated.
For patient data, fixing k4 also performed better than the free model although to a lesser degree than for fixing K1/k2 (Figure 3B). Monte Carlo simulations indicated that, when k4 was fixed to the correct value, bias decreased for BP and both bias and COV decreased for Vd. Especially for high BP values, however, BP bias and COV were very sensitive to underestimates of k4 (Figure 5). When measuring Vd using the model with fixed k4, COV significantly decreased, but bias became unacceptably large when k4 was fixed to the wrong value (Figure 6). Given these observations and the difficulty of estimating k4 in practice, as indicated by the large COV (32%) for k4 itself, fixing of this parameter cannot be recommended.
Similarly, for patient data, fixing Vb was preferred over the free model according to the Akaike information criterion, but again to a lesser degree than when fixing K1/k2 (Figure 3B). In contrast, in the simulation studies there was a slight preference for fixing Vb (Figure 4B). It should be noted, however, that contrary to patient data, parameters were fixed at the exact value in these simulations. Despite the preference by the Akaike information criterion, fixing Vb (to the correct value) resulted in increased bias in BP and Vd. This apparent discrepancy is probably because of the fact that BP and Vd are primarily determined by the tail of the TAC, which has less impact on the sum of squares. Therefore, this model is not considered useful in practice.
To date, (R)-[11C]PK11195 has only been analyzed using reference tissue models. Cagnin et al (2001a) used a clustering method to define a reference tissue. Resulting BP values, obtained using a basis function implementation (Gunn et al, 1997) of the simplified reference tissue model in combination with the cluster method to obtain a reference TAC, were much lower (0.07 to 0.46) than in the current study (1.6 ± 0.4) for whole cortex ROIs. Similar low BP values were observed in other studies in which a reference tissue approach was adopted (Banati et al, 2000). There are several possible explanations for the difference between those reference tissue and the present plasma input model BP values.
Firstly, BP obtained from a plasma input model could contain a nonspecific component that does not exchange infinitely fast with the free compartment. This would result in an overestimation of plasma input model BP. This seems the most likely explanation as it is consistent with the finding that nonspecific binding of [11C]PK11195 in rat is high (Shah et al, 1994) and that (R)-[3H]PK11195 binding in the healthy human brain does not bind to microglia (Banati et al, 2000). Secondly, if the reference tissue contains a (low) component of specific binding, this would result in underestimation of reference tissue model BP. Thirdly, potential differences in nonspecific binding between reference and target tissues would result in a bias of reference tissue model BP relative to plasma input model BP. This effect should, however, be small if K1/k2 is fixed in the plasma input model.
A further difference between present and previous studies is the use of a gray/white matter segmentation in the present study with subsequent use of gray matter TACs. In previous studies whole ROI TACs were used. This difference, however, is unlikely to be responsible for the observed large difference between reference tissue and plasma input BP, given that the average BP, based on the two-tissue reversible model, was 1.6 ± 0.4 for gray and 1.9 ± 0.5 for white matter.
A labeled metabolite that crosses the blood-brain barrier may also influence results. It has been shown, however, that metabolites do not cross the blood brain-barrier in mice (Dumont et al, 1999). Therefore, it is expected that the results of the present study are valid for those disorders, where the blood-brain barrier remains intact.
The results of the present study indicate that, for human data, a reversible two-tissue compartment model best describes (R)-[11C]PK11195 kinetics when using a metabolite corrected plasma input function. Clinical data and simulation studies show that the reversible two-tissue compartment model with K1/k2 fixed to the value for whole cortex provides the optimal trade-off between accuracy and reproducibility for both BP and Vd.
Footnotes
Acknowledgements
The authors thank personnel of the BV Cyclotron VU for the production of [11C]O2 and staff of the Department of Nuclear Medicine & PET Research for the production of (R)-[11C]PK11195, data acquisition, and blood metabolite analysis. Helpful comments by HNJM Greuter, Dr JM Lubberink, and Dr S Rajasekharan are gratefully acknowledged.