
Abstract
In recent years, several linearized model approaches for fast and reliable parametric neuroreceptor mapping based on dynamic nuclear imaging have been developed from the simplified reference tissue model (SRTM) equation. All the methods share the basic SRTM assumptions, but use different schemes to alleviate the effect of noise in dynamic-image voxels. Thus, this study aimed to compare those approaches in terms of their performance in parametric image generation. We used the basis function method and MRTM2 (multilinear reference tissue model with two parameters), which require a division process to obtain the distribution volume ratio (DVR). In addition, a linear model with the DVR as a model parameter (multilinear SRTM) was used in two forms: one based on linear least squares and the other based on extension of total least squares (TLS). Assessment using simulated and actual dynamic [11C]ABP688 positron emission tomography data revealed their equivalence with the SRTM, except for different noise susceptibilities. In the DVR image production, the two multilinear SRTM approaches achieved better image quality and regional compatibility with the SRTM than the others, with slightly better performance in the TLS-based method.
Keywords
INTRODUCTION
The simplified reference tissue model (SRTM) 1 has been used extensively in quantitative studies of a reversibly binding radiotracer using dynamic positron emission tomography (PET) and single photon emission computed tomography, owing to its noninvasiveness and robustness in the estimation of kinetic parameters.2–5 The model parameters have been estimated mainly using nonlinear least squares (NLS), which can provide unbiased solutions for parameter estimation from time-activity curves (TACs) with low- or moderate-level noise. In the use of NLS, however, highly noisy data may bring several limitations such as dependency on initial values, long computation time, and a high level of uncertainty.2,4,6–8 Therefore, the NLS-based standard SRTM (NLS-SRTM) is undesirable for parametric image generation (voxel-by-voxel analysis) characterized by large amounts of voxel data with high-level noise. Consequently, the application of NLS-SRTM is limited to the analysis of regional average TACs that are much less noisy than voxel TACs.2,4
Several linearized model approaches, capable of implementing the SRTM, have been developed to achieve fast and reliable voxel-wise parameter estimation for the generation of parametric images of neuroreceptor binding.2,4,5,9 One of them is the basis function method (BFM) 2 that uses a set of basis functions to convert the SRTM equation into a multiple linear regression model. Another method is a multilinear reference tissue model with two parameters (MRTM2), 9 whose underlying linear regression model with three parameters (MRTM) was originally derived independently of any specific model structures but is able to represent the standard SRTM if one-tissue compartment is assumed.4,5 In these two methods, only two parameters need to be calculated through linear least squares (LLS) estimation. However, the unknown model parameters in these methods are not major kinetic parameters of interest (nondisplaceable binding potential or the distribution volume ratio (DVR)) 10 but their combinations with other parameters. Therefore, we need further division of the estimated parameters to obtain the parameters of interest, increasing the variability of the final result and yielding noisy parametric images.11,12
Conversely, Zhou
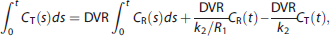
where
In the presence of noisy independent variables, total least squares (TLS) estimation
14
may be a plausible alternative to the LLS method; TLS provides consistent and unbiased estimates without suffering from the underestimation issue of the LLS method by taking into account the noise in both dependent and independent variables. Though the TLS problem is based on the fact that all variables in a linear model are measured with noise, the first independent variable and sometimes even the second one in equation (1) are often assumed to be effectively noise free. Thus, we can also consider an approach based on an extension of TLS, called
Because the aforementioned linear approaches can be derived from the standard SRTM, they are fundamentally equivalent to NLS-SRTM except for different susceptibilities to noise, leading to distinguishable performances in parametric imaging. Although BFM and MRTM2 have been evaluated and frequently used in the literature,3,5,11 a comparative analysis of them with the methods based on the multilinear SRTM has been rarely performed. In Zhou
For their comparison and evaluation, we applied these methods to both simulated and real dynamic [11C]ABP688 (3-(6-methyl-pyridin-2-ylethynyl)-cyclohex-2-enone-O-11C-methyl-oxime)
18
human brain PET data. [11C]ABP688 is a highly selective and promising radioligand recently developed for the
MATERIALS AND METHODS
Data Acquisition and Processing
The Institutional Review Board of Seoul National University Hospital approved this study and signed, informed consents were obtained from all participants. Thirty participants, including 9 healthy volunteers and 21 Parkinson's disease patients, underwent 60-minute dynamic [11C]ABP688 PET scan using a Siemens Biograph mMR PET/MRI scanner (PET spatial resolution: 4.4-mm at 1 cm and 5.2-mm FWHM at 10 cm offset from the center of transverse field-of-view). For each participant, about 370 MBq (10.0 mCi) [11C]ABP688 (mean specific activity: 139.6 GBq/μmol) was administrated with an intravenous bolus injection, and then the PET data were acquired in a 3D list mode without arterial blood sampling. A total of 44 dynamic PET frames (8×15, 16×30, 10×60, 10 frames×240 seconds) were reconstructed using filtered back projection followed by 4-mm Gaussian postfiltering, with routine corrections for physical effects such as radioactive decay and attention (using UTE MR-based attenuation map). The reconstructed individual frames consisted of 127 transaxial slices with a matrix size of 256×256, a pixel size of 1.40 × 1.40 mm2, and a slice thickness of 2.03 mm.
Simultaneously with the PET data, sagittal T1-weighted MR images (256 × 256 matrix and 208 sagittal slices with 0.98 × 0.98 × 1.00 mm3 voxel size) were acquired using a 3D Turbo FLASH sequence with a repetition time of 1,670 ms, a echo time of 1.89 ms, and a flip angle of 9°. Then, region-of-interest (ROI) masks for various brain regions at each hemisphere were automatically delineated from the individual T1 MR image using the FMRIB Integrated Registration and Segmentation Tool (FIRST, FSL v4.0, Oxford University, Oxford UK, http://www.fmrib.ox.ac.uk/fsl); the ROIs include the caudate nucleus, hippocampus, and putamen, which are receptor-rich brain regions, the thalamus with moderate-mGluR5 density, and the cerebellum (reference region) known to have almost no expression of the mGluR5.19,28 By directly placing those ROIs on the reconstructed PET images without any coregistration between both modalities, we obtained regional TACs.
Kinetic Analysis
In this study, DVR was the parameter of interest to be compared among the methods. In all DVR estimations, cerebellar TAC was used as a reference input function, and a weighted sum of squared residuals was minimized to account for noise-level differences among the 44 data points. For the weights, we used the frame durations.4,8
From each set of tissue and reference TACs, DVR was estimated by applying LLS to the multilinear SRTM (LLS-SRTM), by applying MTLS while assuming that only
Meanwhile, DVR parametric images were generated by applying LLS-SRTM-SC, MTLS1-SC, MTLS2-SC, BFM, and MRTM2 as well as LLS-SRTM, MTLS1, and MTLS2 methods to whole-voxel data. Regional mean values of the DVR images were extracted by applying the ROI masks to the images, and then their linear relationships with the NLS-SRTM ROI results (the gold standard) were also analyzed and compared among the methods. Moreover, the qualities of the parametric images were assessed by comparing the spatial variation of DVR values in image space among the methods. Because we evaluated all the results against the NLS-SRTM results, the term bias in the real data analysis will mean a deviation from the NLS-SRTM results throughout the paper.
Multilinear Simplified Reference Tissue Model Based on Linear Least Squares
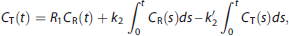
With dynamic PET measurements of

where X is an
Given

The meaning of the minimized cost function in equation (3) is the minimal perturbation of noisy data such that the modified set
In equation (1),
Multilinear Simplified Reference Tissue Model Based on Linear Least Squares with Spatial Constraints
An intuitive and direct approach to address the aforementioned bias issue in parametric imaging via LLS-SRTM would be to reduce the noise level of
Multilinear Simplified Reference Tissue Model Based on Mixed LS-Total Least Squares
The
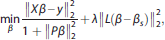
In this study, the MTLS solution, denoted by β0, was computed using the closed form solution (equation B.4) of the original MTLS problem described in Supplementary Appendix B. Meanwhile, we also derived the following minimization problem that is equivalent to the original MTLS problem,

where P is a diagonal matrix whose diagonal entries have values of 1 and 0 corresponding to noisy and effectively noise-free columns of X, respectively. Notice that the new formulation of equation (4) is very convenient for setting a regularization problem in the context of the MTLS problem as shown in the next subsection and, to our knowledge, has not yet been reported elsewhere.
Although MTLS assumes that some of the independent variables are exactly known, all data in tracer kinetic models are contaminated with noise to some extent. Therefore, care has to be taken to identify which independent variables in equation (1), particularly
Mixed LS-Total Least Squares With Spatial Constraints In theory, MTLS provides an estimate with better accuracy but larger variance than LLS.
14
Furthermore, highly noise contaminated voxel data and strong correlation between independent variables in kinetic models can exacerbate the variability in the MTLS results (β0), giving rise to large spatial noise in parametric image space. Since a regularization technique can drastically reduce variance at the expense of acceptable bias, we adapted one strategy introduced in Zhou
where β
The implementation of solving the above regularized MTLS with a spatial constraint (MTLS-SC) includes two steps. In the first step, the spatial constraint β
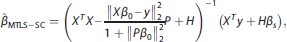
where

Here, β0
Basis Function Method
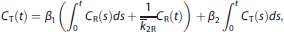
The BFM is based on the analytical solution of the original SRTM rewritten as

where (β1, β2, β3)T =(

where each
Multilinear Reference Tissue Model with Two Parameters
The MRTM2 is based on the following model with two parameters [β1, β2]
where
It is noteworthy that the MRTM and MRTM2 were derived from graphical analysis without specifying a specific compartmental configuration for tissue region and without assuming the same
RESULTS
Simulation Studies
Figures 1 and 2 show the bias and CV of DVRs estimated by each method for different levels of input function noise. For noiseless input data (solid lines), all the methods showed almost no bias at low tissue-noise levels (μ10%) but very different bias properties with increasing tissue-noise levels. The biases of results from LLS-SRTM, MTLS2 and MTLS2-SC have larger extents than the others at almost all tissue-noise levels. The negative bias of LLS-SRTM rapidly increased and then converged to a certain value while those of MTLS2 and MTLS2-SC showed fast and more complicated change. The other five approaches showed much slower changes in bias, while maintaining small values; among them, MTLS1-SC provided the most stable and the smallest bias. However, the CV also increased with higher tissue-noise levels for all the methods except for MTLS2 and MTLS2-SC; the two methods showed very complicated behavior in CV like in bias, possibly due to violation of assumption for noise level of independent variables. MTLS1 yielded the largest CVs at the expense of achieving small bias whereas LLS-SRTM showed the smallest CVs. The DVRs directly estimated by MTLS1-SC and LLS-SRTM-SC showed better precision than those computed by division of parameter estimates in BFM and MRTM2.
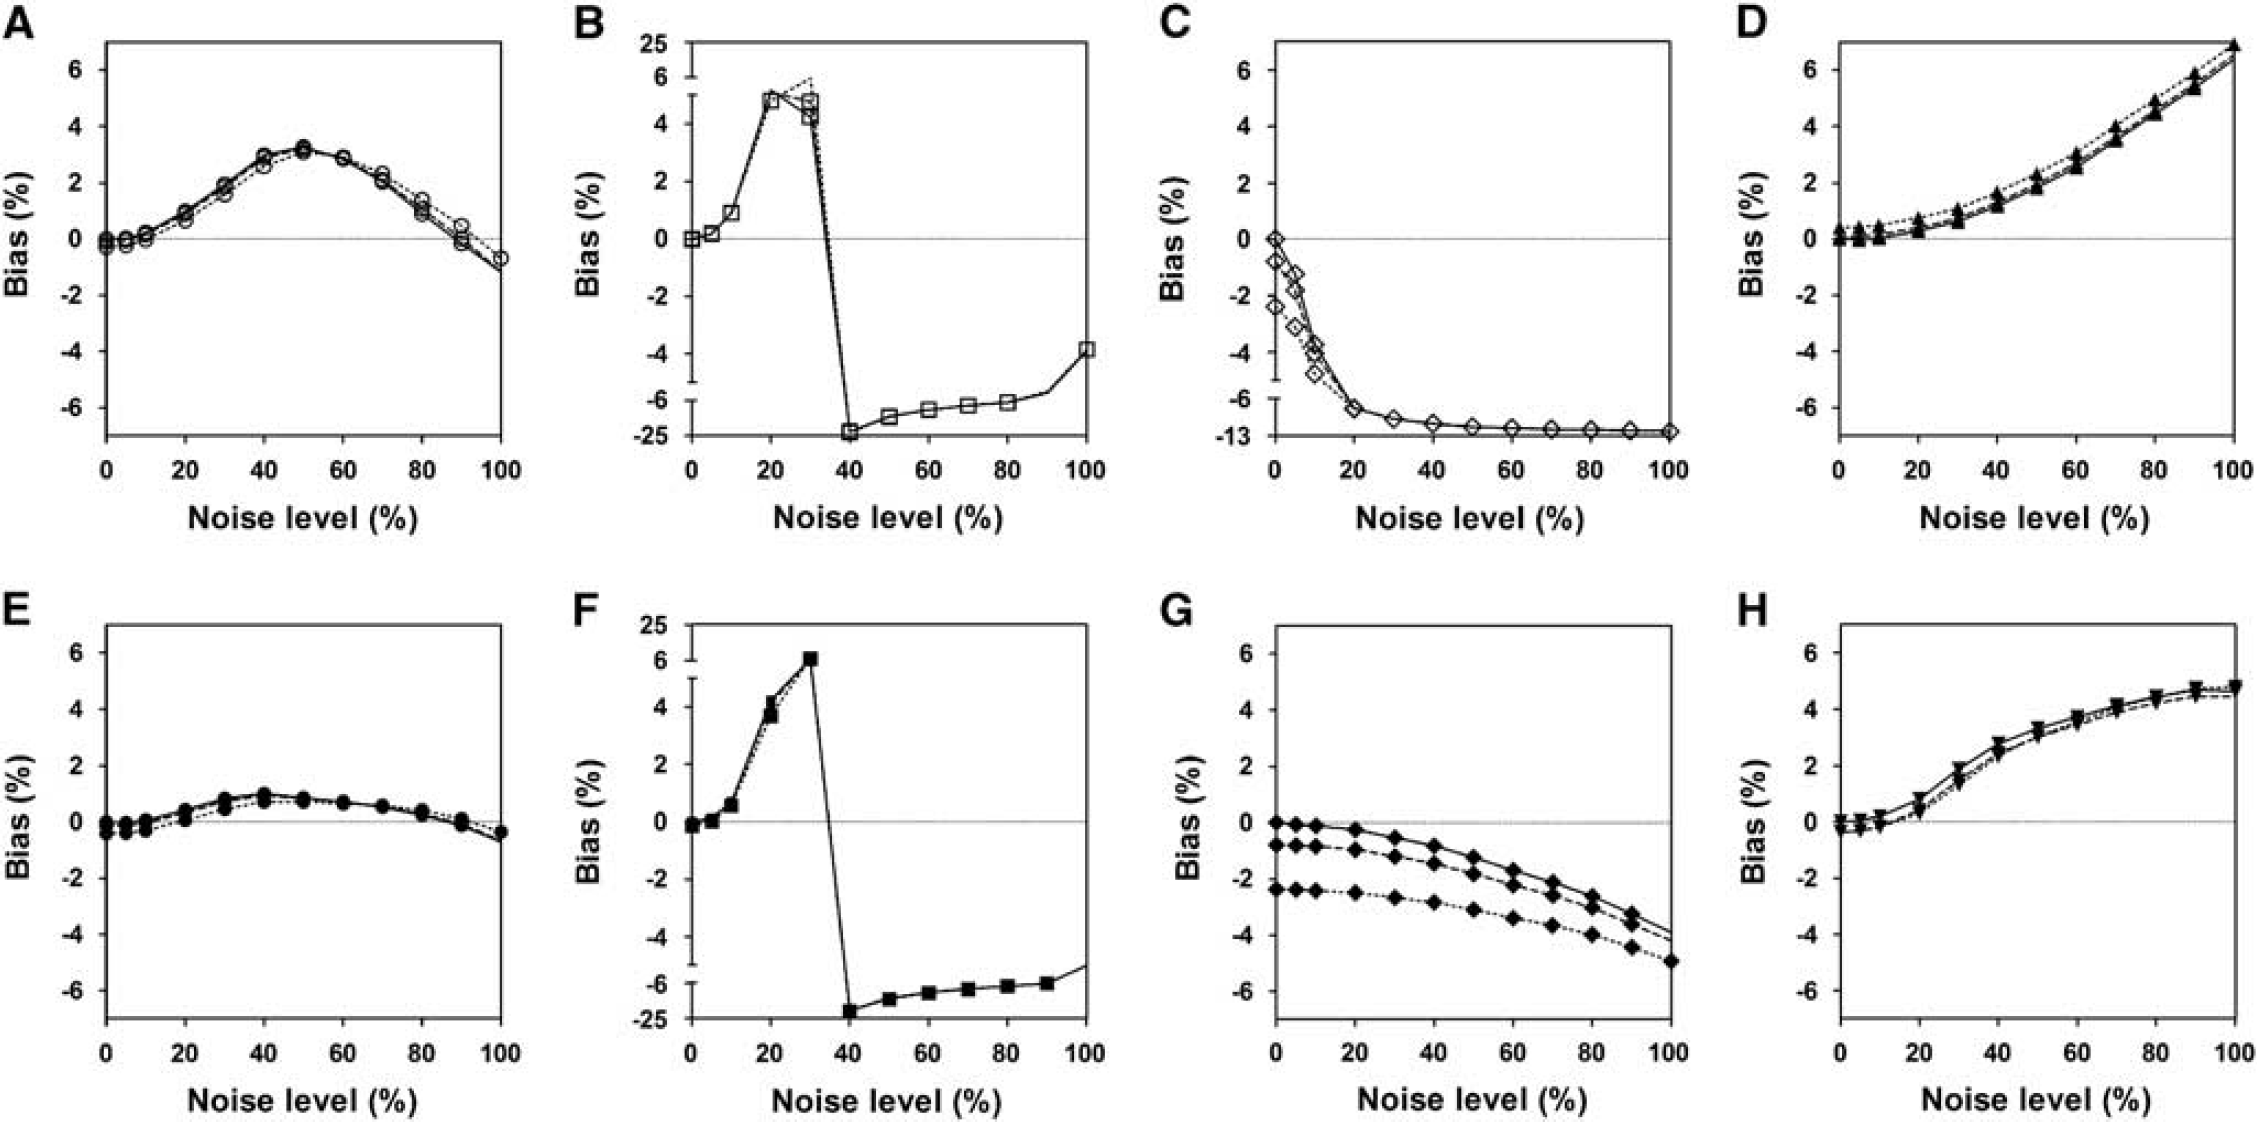
Comparison of bias of distribution volume ratio (DVR) values estimated by various methods from simulated tissue time-activity curves (TACs) of [nC]ABP688 at different noise levels ranging from 0% to 100% and reference region input functions at noise levels of 0% (solid line), 5% (dashed line), and 10% (dotted line). We used eight different linear estimation methods based on the standard simplified reference tissue model (SRTM) including (
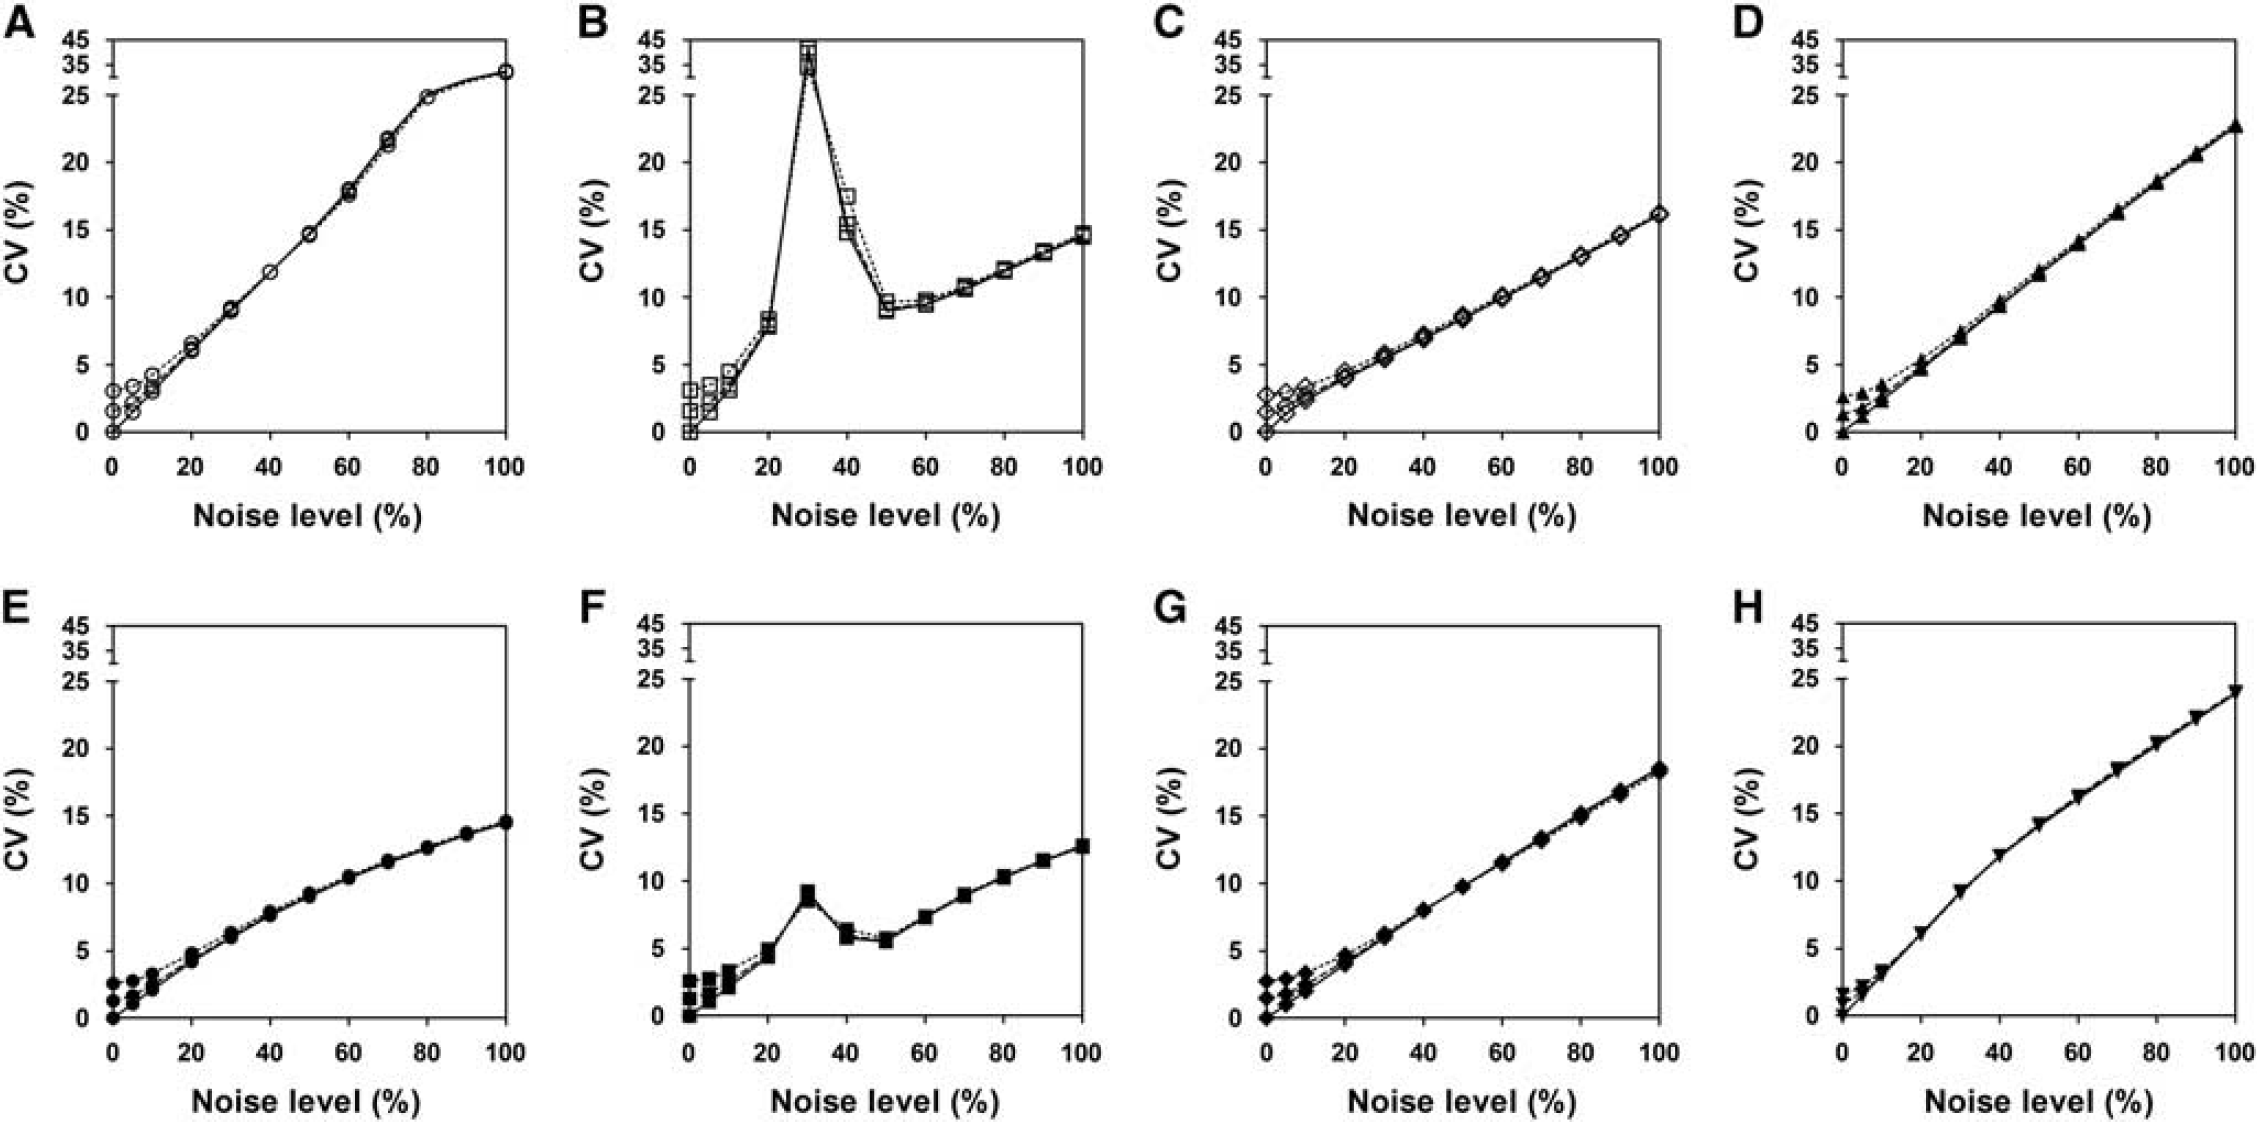
Comparison of coefficient of variance (CV) of distribution volume ratio (DVR) values, presented as in Figure 1. (
As shown in Figures 1 and 2, similar overall trend of the bias and CV for each method was observed when using noisier reference input function. Only LLS-SRTM and LLS-SRTM-SC showed noticeable changes in bias (Figure 1); there was additional noise-induced negative bias that decreases as the noise of tissue TAC increases and becomes dominant compared with the noise of input function. The effect of noisy input function on the bias by the other methods was marginal and very consistent over all tissue-noise levels. However, the noisy input function affected the CV similarly for all the methods, only at low tissue-noise levels that are not very different from the noise levels of input function (Figure 2). As the tissue-noise becomes dominant, the effect of noisy input function on CV diminished.
Human Positron Emission Tomography Studies
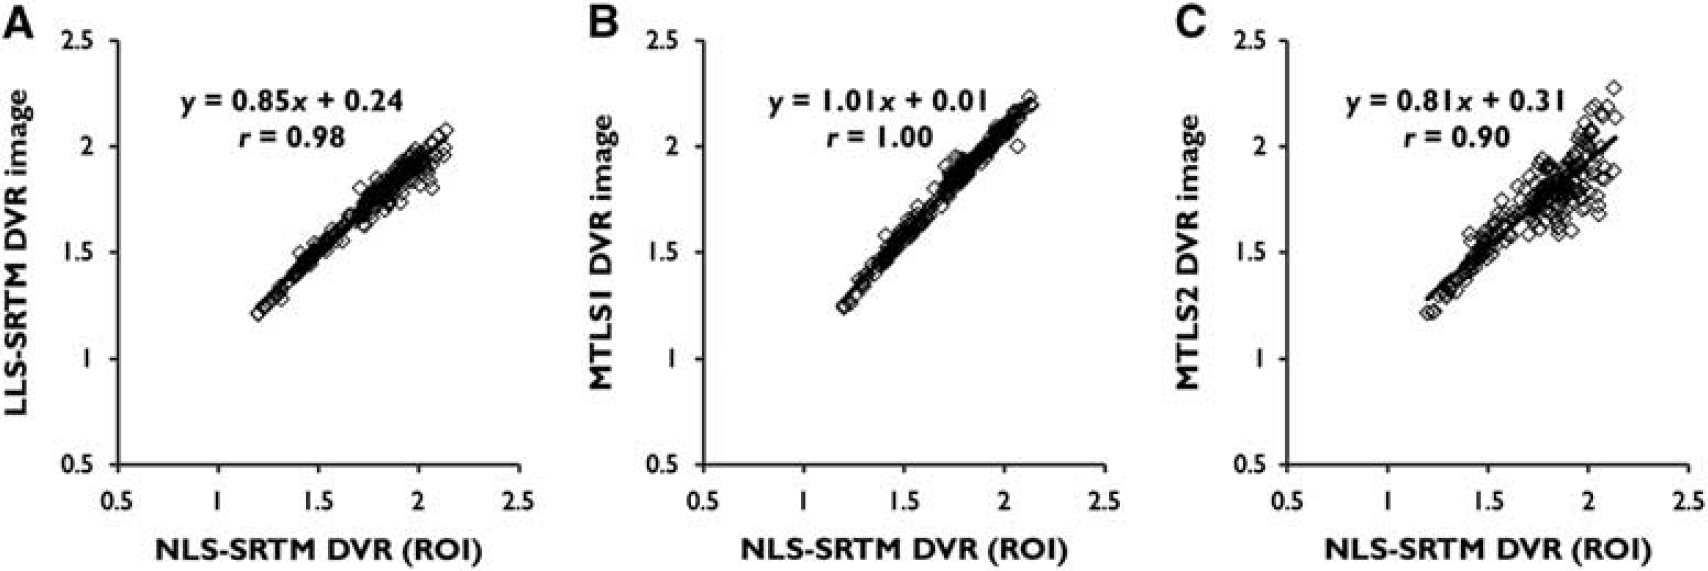
For ROI TACs with low noise level in general, the DVRs from LLS-SRTM, MTLS1, and MTLS2 (for a multilinear SRTM) were almost identical to those from NLS-SRTM (
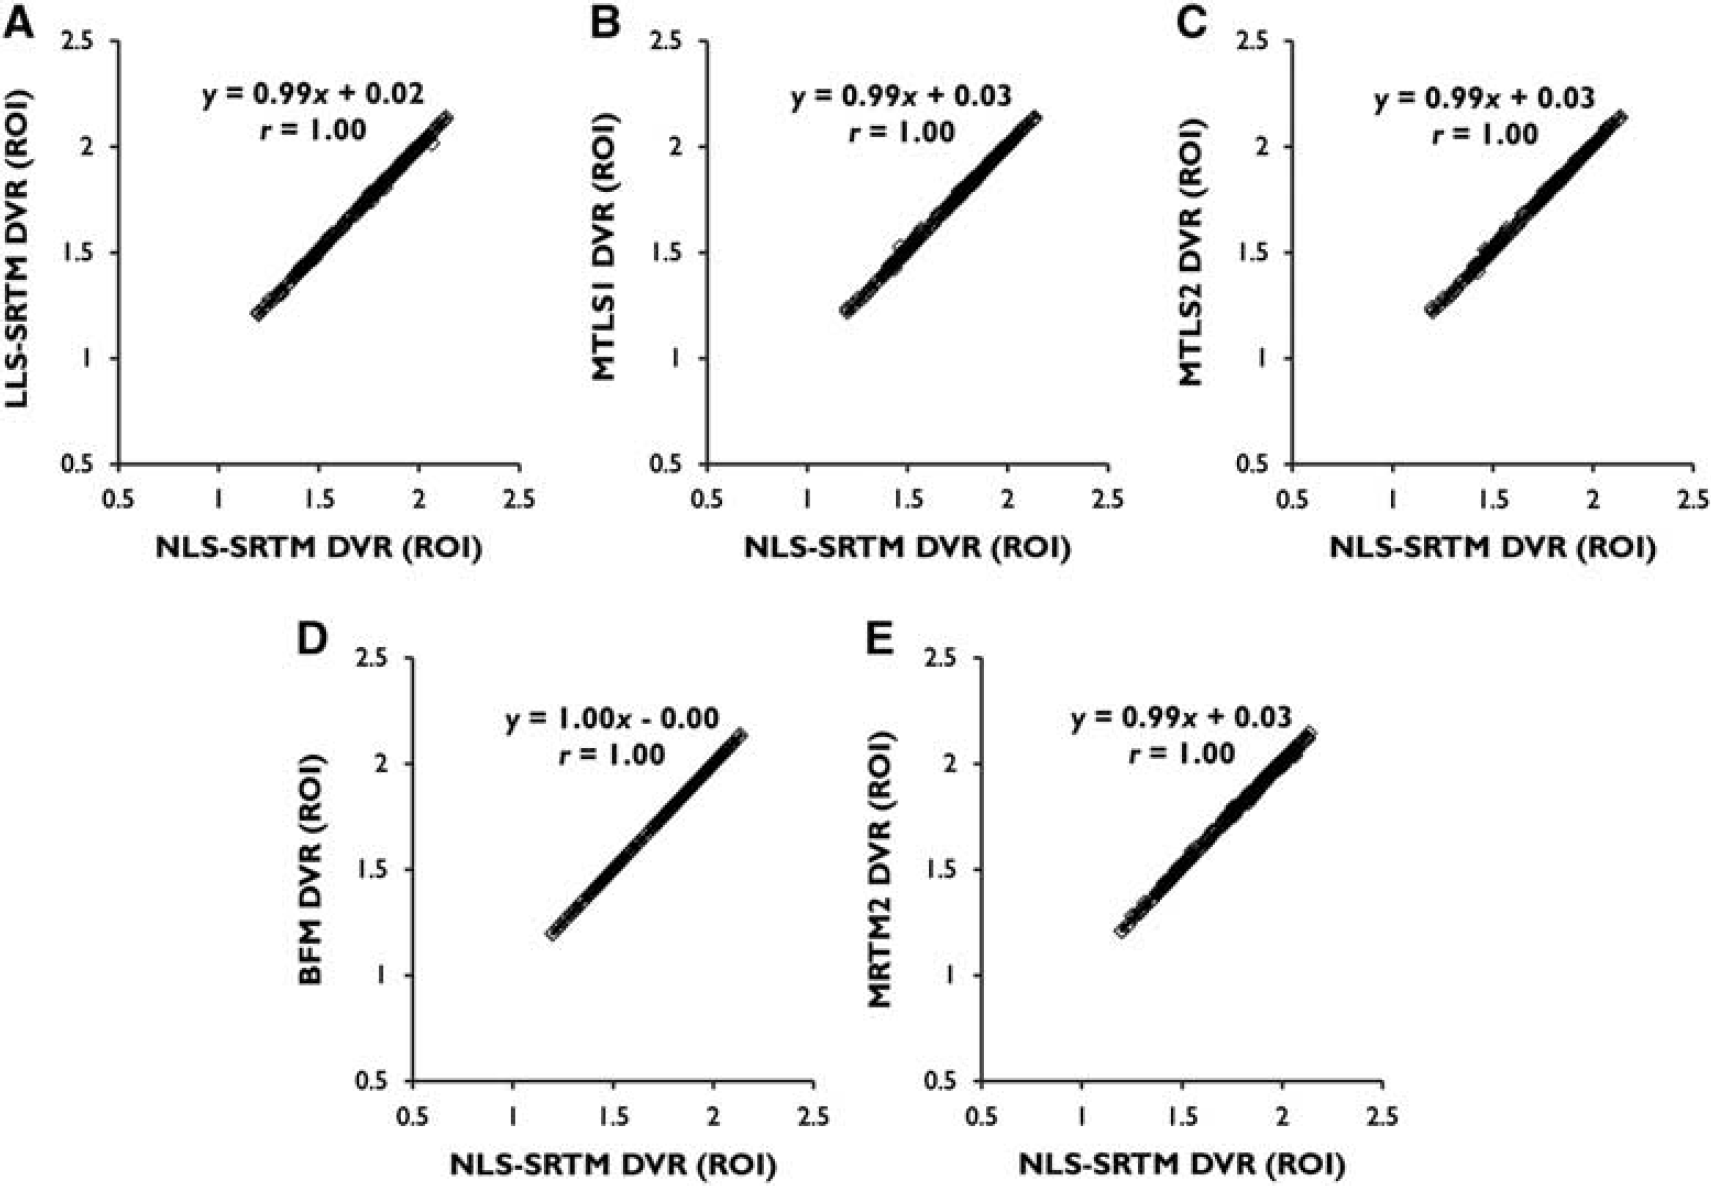
Linear relationship between distribution volume ratios (DVRs) from several linear estimation methods based on the simplified reference tissue model (SRTM) and those from the SRTM using nonlinear least squares (NLS-SRTM) for region-of-interest (ROI) TACs from dynamic [11C]ABP688 positron emission tomography (PET) data. (
The different effects of noise become apparent in parametric images (Figures 4 and 6). Figure 4 shows the representative [11C] ABP688 DVR parametric images generated using LLS-SRTM (
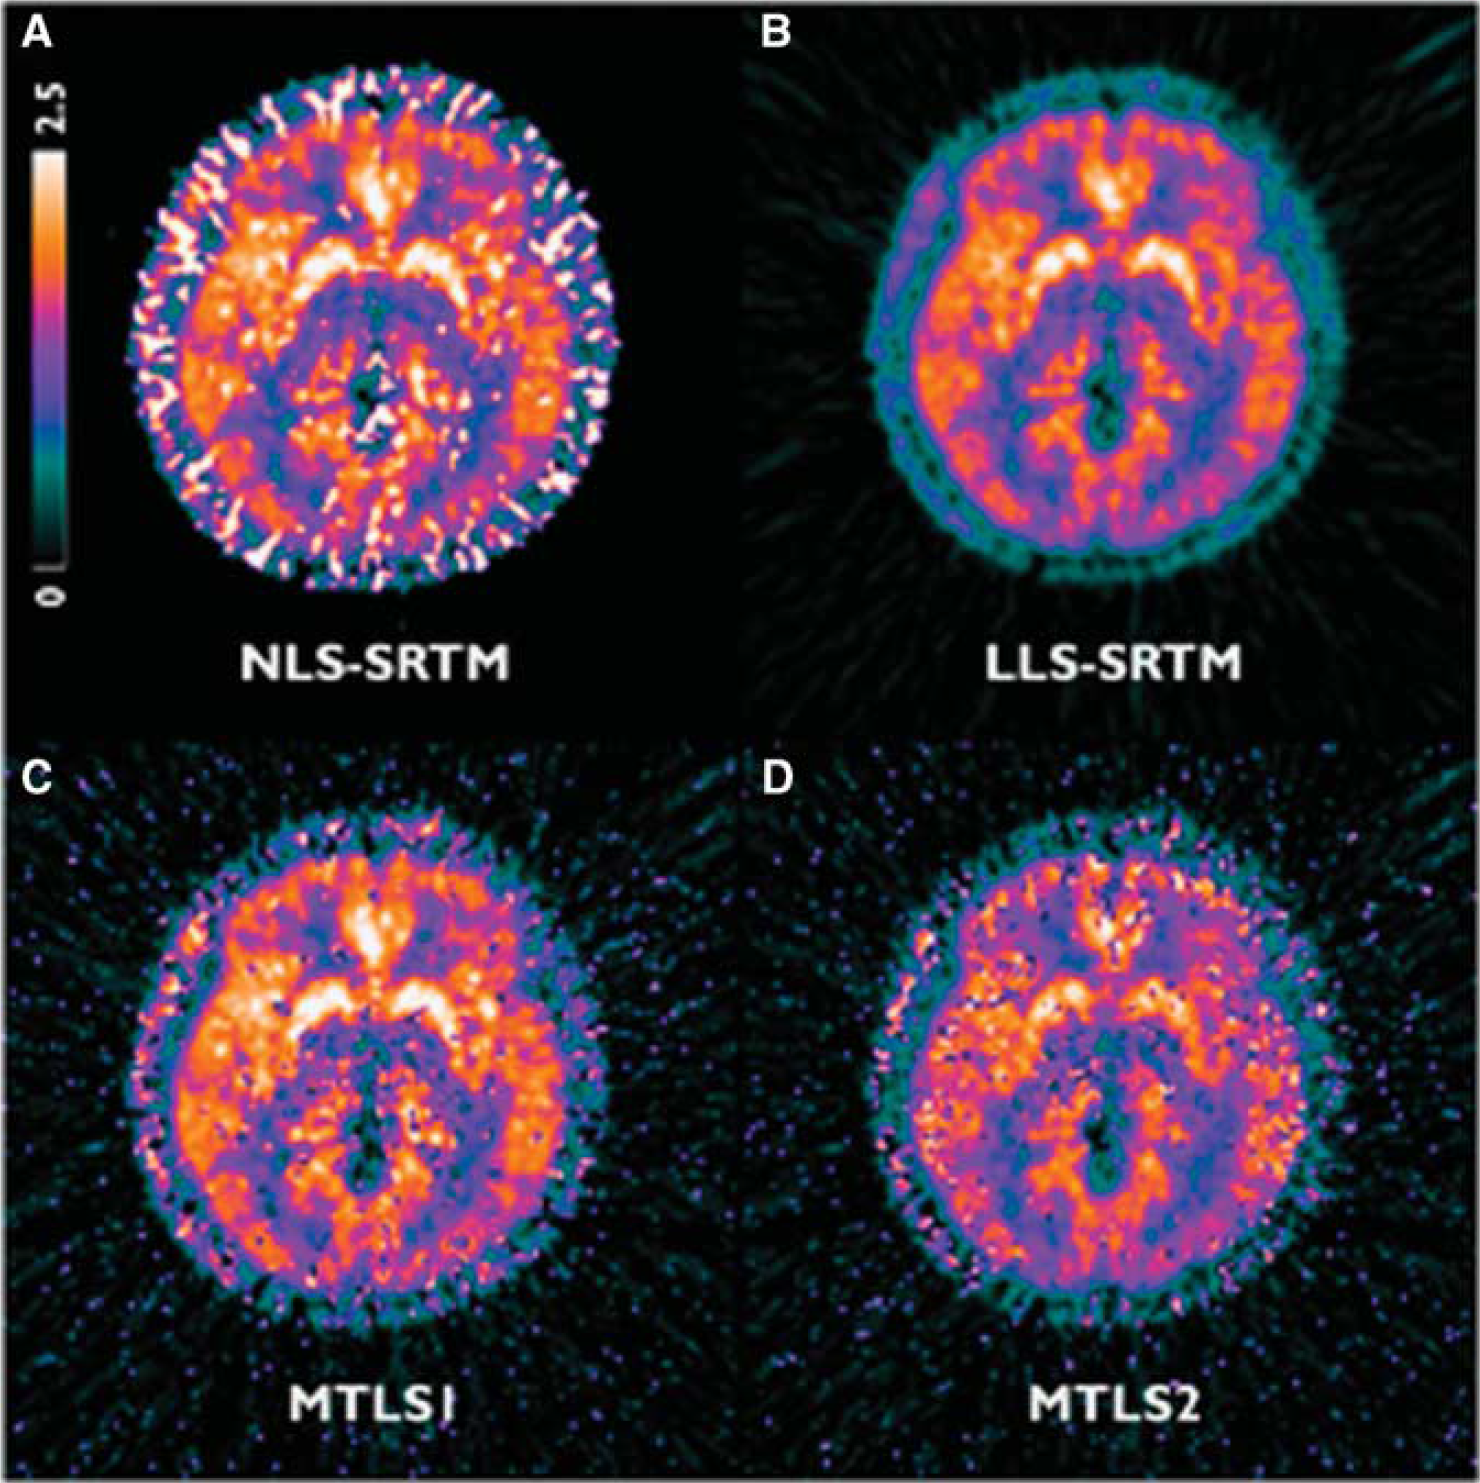
Transverse planes of representative [11C]ABP688 distribution volume ratio (DVR) parametric images generated using (
Linear relationship between regional mean values of distribution volume ratio (DVR) images generated using (
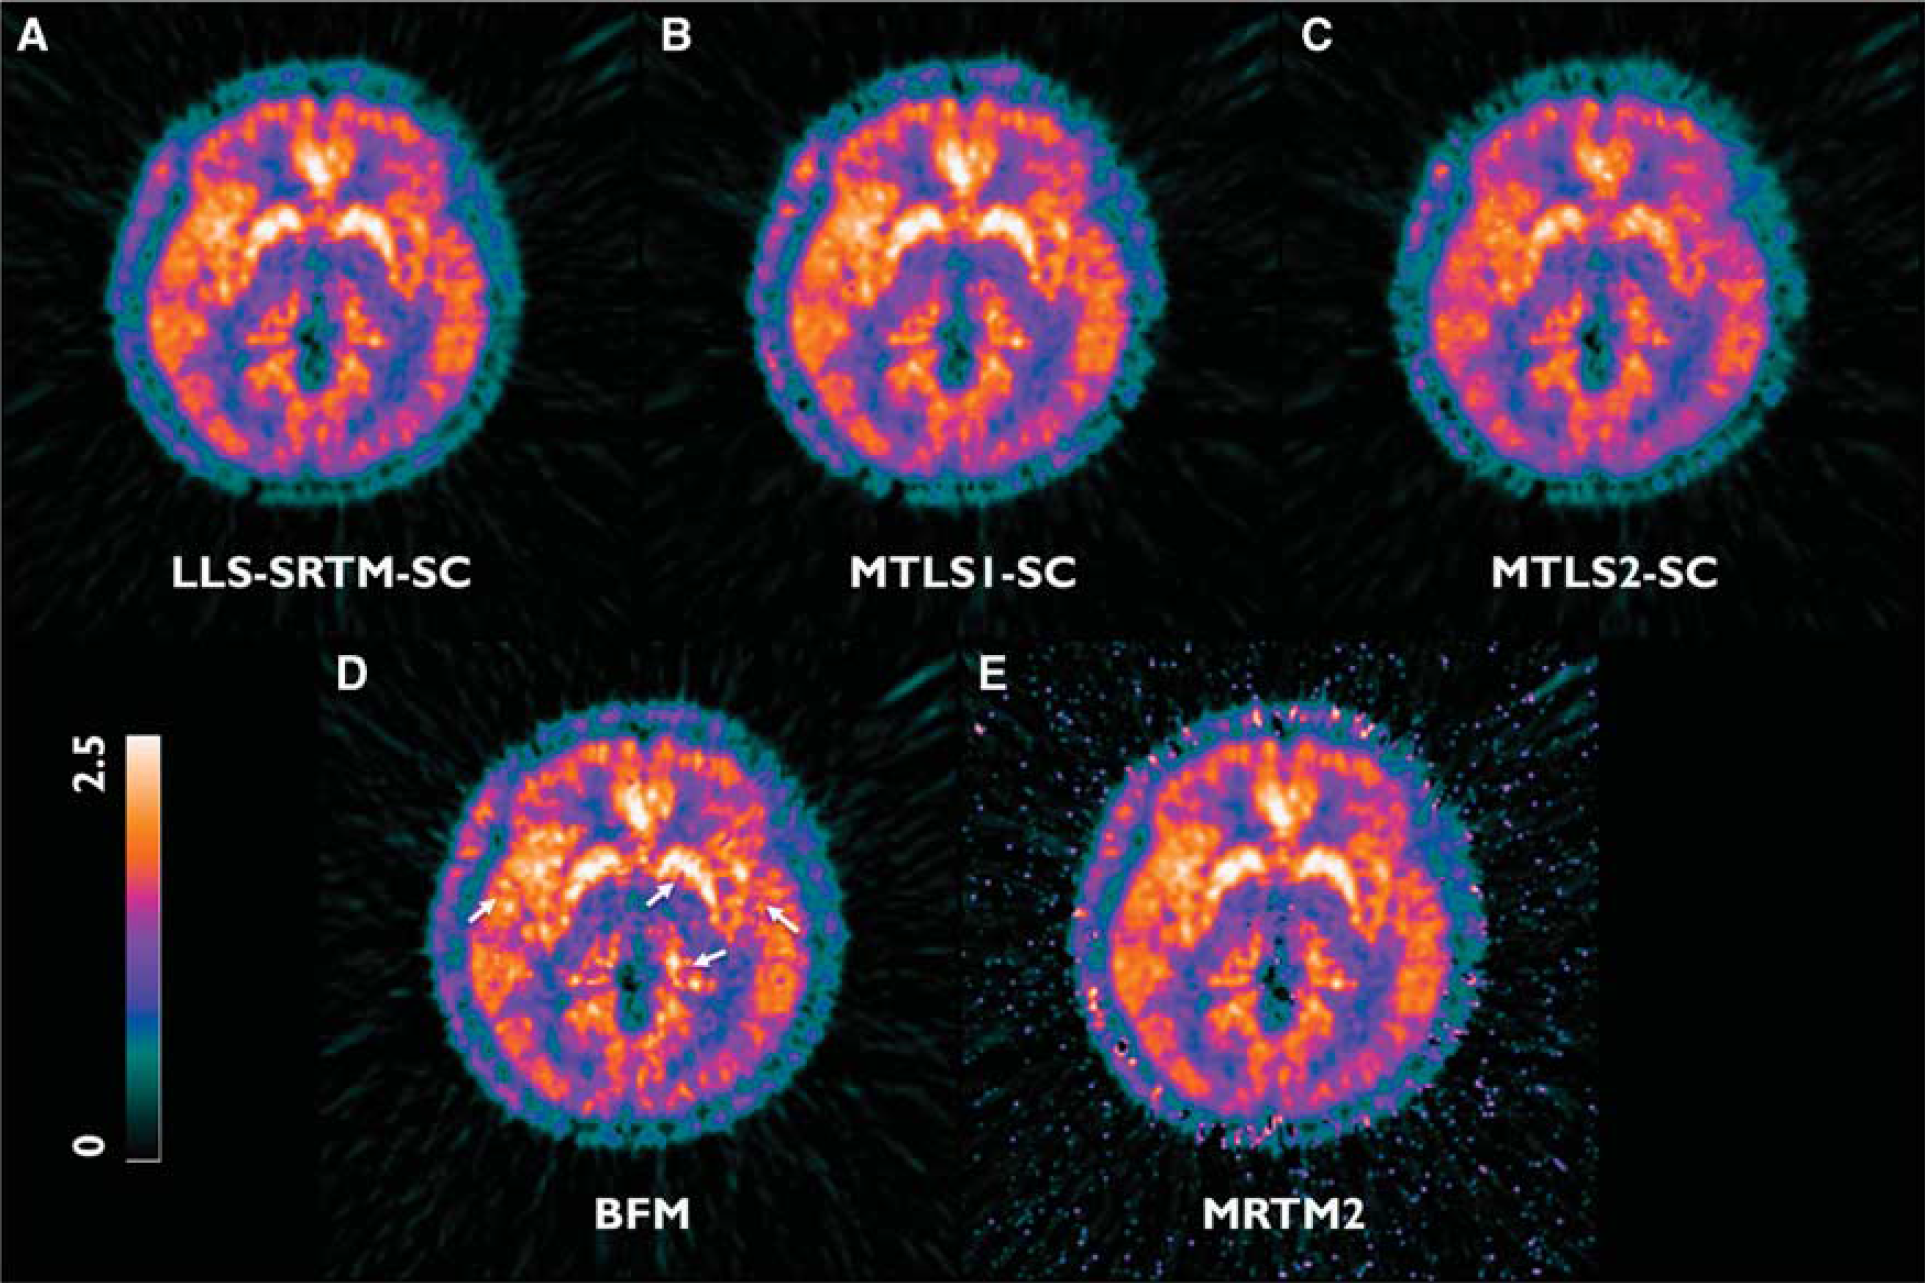
Transverse planes of representative parametric images of distribution volume ratio (DVR) acquired using various methods from data of the same subject as Figure 4. (
However, the use of a spatial constraint improved the results of LLS-SRTM and MTLS1 as shown in Figures 6 and 7. By use of the denoised
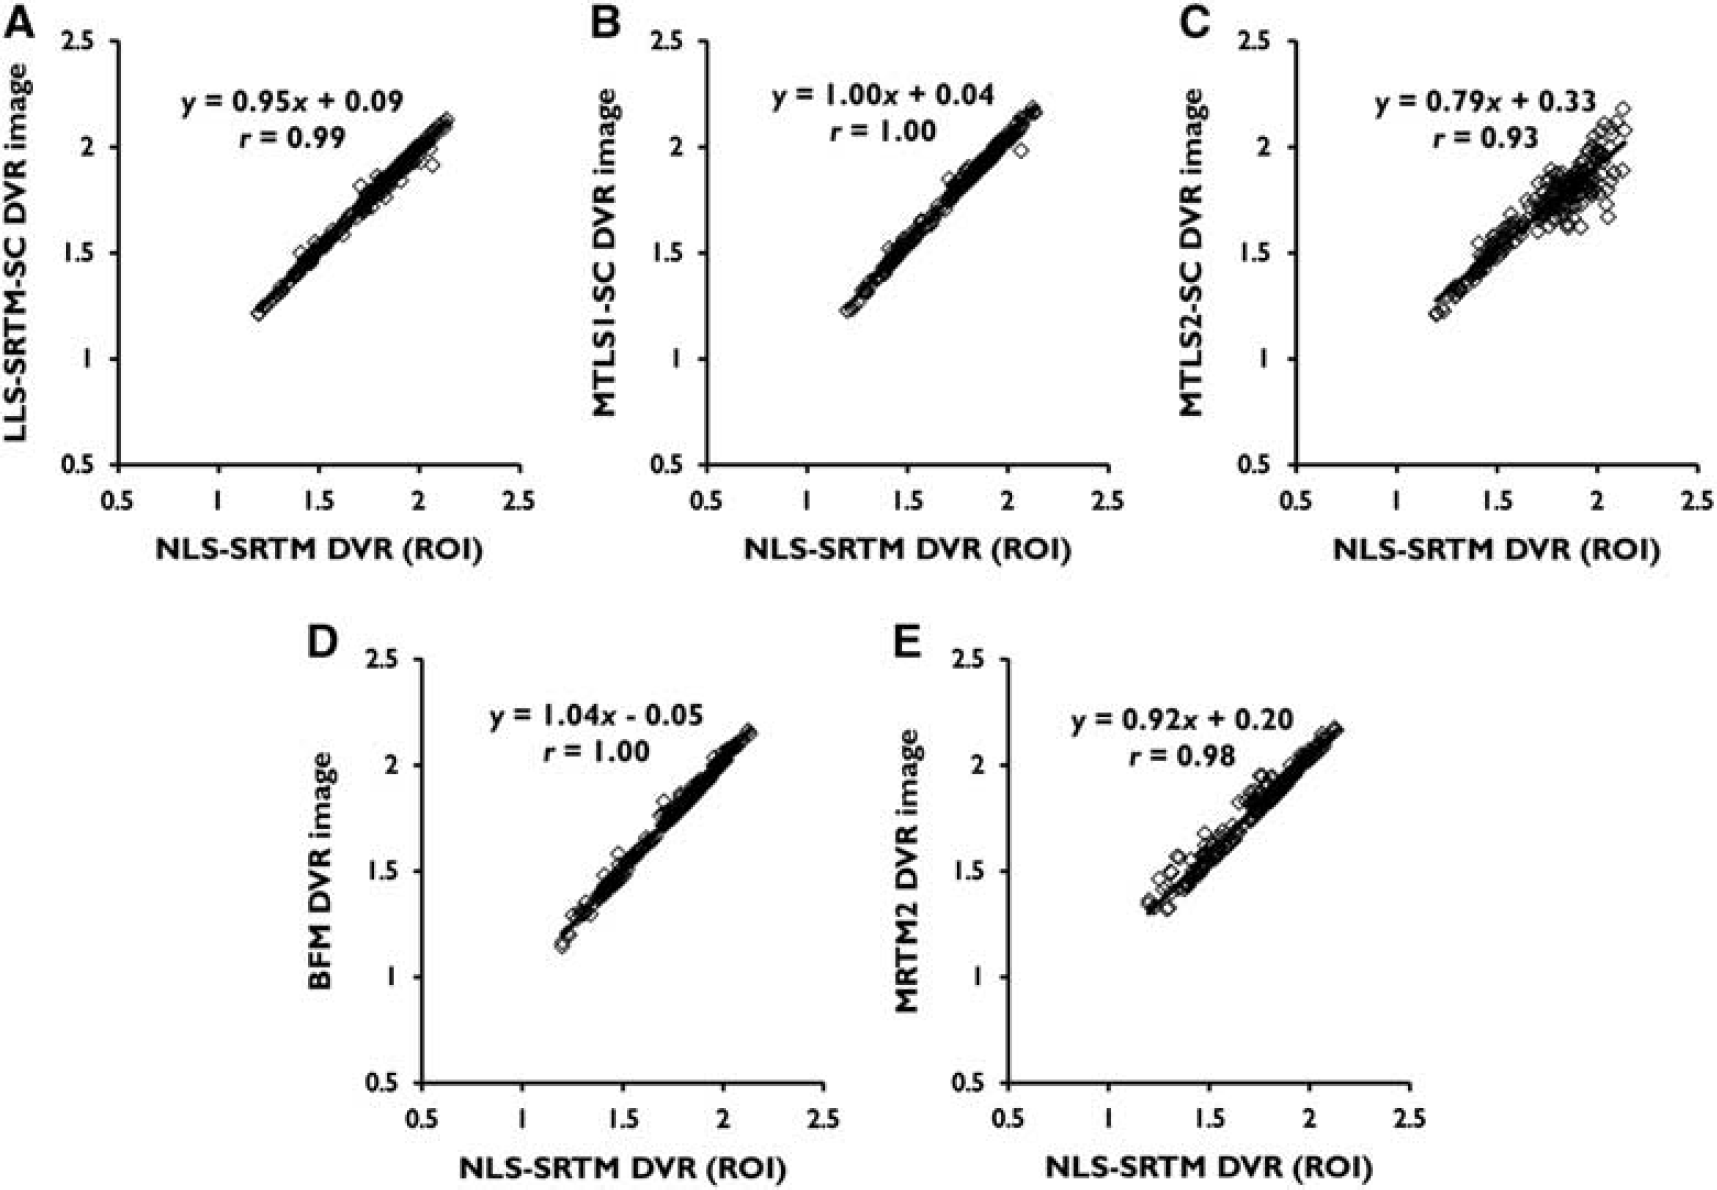
Linear relationship between regional mean values of distribution volume ratio (DVR) images generated using various methods and the same gold standard used for ROI level comparison in Figure 3 (the ROI DVRs from NLS-SRTM). All the data points were obtained after removing outliers. Each panel corresponds to a DVR image in Figure 6. (
Basis function method and MRTM2 produced DVR images of similar intensity levels. However, their parametric images were slightly noisier, as shown in Figures 6D and 6E. Although DVR images from BFM had ROI-mean values similar to those of gold standard (Figure 7D), they introduced some blob-like artifacts, possibly due to the spatial correlation of noise, indicated by the white arrows. MRTM2 have a larger number of outliers that deteriorate correlation with gold standard (Figure 7E) and produced noisy parametric image voxels in low binding regions (usually found in some subjects with relatively lower inject dose) and the background region outside the brain.
DISCUSSION
In the present study, we have compared several different parametric neuroreceptor mapping approaches whose underlying models can be derived by the linearization of the standard SRTM equation. These methods share the basic assumptions of the SRTM except for how to handle the major noise source, CT(
Comparison Between Direct and Indirect Approaches for Distribution Volume Ratio Estimation
Our simulation studies verified that the methods considered are radically equivalent to NLS-SRTM but have different susceptibilities to image noise. This is consistent with our human PET studies; in the ROI analysis, all the methods showed equivalently good results (Figure 3) whereas those of the corresponding parametric imaging approaches were distinguishable from each other (Figures 4–7). The major distinction in parametric imaging appeared between two categories of methods: ones that provide direct estimation of DVR using multilinear SRTM (LLS-SRTM or LLS-SRTM-SC and MTLS or MTLS-SC) and the others that produce DVR indirectly through division of other parameter estimates (BFM and MRTM2). In addition, the former direct methods estimate three parameters (including DVR) in weighted least squares manner by using
Those differences caused the direct approaches except for MTLS to achieve better image quality than the indirect ones (Figure 6). In general, the variability of the estimated model parameters depends on the noise level of the dependent variable. Because of the lower noise level of
Conversely, in the indirect methods, the higher-level noise in
Noise-Level Assumptions for Independent Variables
The different noise susceptibilities among the direct methods stem from the different assumptions regarding noise levels of independent variables in multilinear SRTM,
The similar ROI results are based on the low noise levels of the ROI TAC data for both
The effects of noisy
Bias Reduction Strategies
The LLS method has been widely used to estimate kinetic parameters from various linear models as well as multilinear SRTM, BFM, and MRTM2 assessed in this paper.2,4,7–9,12,29,31–33 However, the noise-induced negative bias in LLS estimates is a well-known phenomenon in tracer kinetic modeling,15–17
To address the bias issue, various strategies have been suggested including graphical analysis methods11,30,34,35 (see Seo
The theory of TLS was introduced for the first time to improve a result from the Logan graphical analysis with plasma input
32
by Varga and Szabo.
35
However, successful bias reduction in the original work was not reproduced well in other studies where the TLS only partially removed bias.7,11,29,34 The remaining bias is possibly because of the high noise correlation between the dependent and independent variables of the Logan model equations,14,29 which comes from sharing
Variance Reduction Techniques
In parametric image generation using MTLS, bias reduction was accompanied by a variability increase (Figure 4C). To alleviate the increased variability, the nearly unbiased MTLS estimates were incorporated after smoothing as a spatial constraint into a subsequent regularized MTLS problem (MTLS-SC). The DVR images from MTLS1-SC showed a similar level of spatial variability compared with the level of LLS images (Figure 6D versus Figure 4B). For the regularization step, we used the ridge regression-based regularization strategy 4 but with a modification to regularize the solution in terms of the MTLS cost function. In the field of numerical analysis, regularization in the context of the TLS problem has been solidly studied to address stability issues arising from the ill-conditioning of problems and high-level noise in the data.36,37 However, the regularization of MTLS has not been treated explicitly. Hence, in the present study, we derived for the first time a new formulation of the MTLS problem (equation (4), Supplementary Appendix C) to use it as the main cost function in a regularized MTLS problem (equation (5), Supplementary Appendix D).
As mentioned in section Comparison Between Direct and Indirect Approaches for Distribution Volume Ratio Estimation, to enhance the stability of important parameters, MRTM2 (equation (10)) was proposed as a reduced model of MRTM given by
Similarly, BFM avoids the variability arising from highly noisy
Reference Region for [11C]ABP688
In previous human studies using [11C]ABP688 pet,19,26,38 the ROI TACs for various brain regions including the cerebellum or its gray matter were best fitted by a two-tissue compartment model. The violation of the single-tissue compartment assumption for the reference region (and also tissue) would introduce biases to the gold standard.
3
Probably because of such violation, the assessment of the reference region approaches for [11C]ABP688 PET in humans has been very limited.3,25 Although the possibility of low specific binding in the cerebellum was raised as a reason for the violation based on the results from several studies,19,26,28 mGluR5 protein expression in that region was not detected in a postmortem study.
39
Meanwhile, Milella et
Noise in Reference Region Data
In this study, we assumed the cerebellar TAC (Supplementary Figure E3) as almost noiseless reference region input function because of its large size. However, in general, the noise level of the reference TAC may change depending on several factors such as size of the region and injection dose. 5 With simulation, therefore, we explored the effect of noise in reference region by increasing the noise levels up to 10% to cover small-sized reference region or noisier reference region data. In our simulation, only the results from LLS-SRTM and LLS-SRTM-SC were notably influenced by the noise in reference region data (Figures 1 and 2). Although the noisy input function violates the MTLS1 assumption about noise-level of independent variables, its impact on the results from MTLS1 and MTLS1-SC was insignificant. Conversely, MTLS2 yielded poor results at high levels of tissue noise even if noisy input function used, because predominance of the tissue noise over the input noise would give rise to a violation of the MTLS2 assumption. Therefore, we may claim that noise in reference region can be considered as noiseless in the application of MTLS-based method, making MTLS1-based methods be optimal choice.
CONCLUSIONS
In the present study, we have compared several SRTM-based parametric neuroreceptor mapping approaches. Very consistent results under ROI-level noise proved that the methods considered are fundamentally equivalent to NLS-SRTM. Meanwhile, discrepancies between the generated parametric images or the results under high-level noise indicated different noise susceptibilities among those methods. Basically, by incorporating different prior information or spatial constraints, all the methods sacrificed a reasonable or negligible bias to improve the quality of the parametric image. However, in general, the methods for multilinear SRTM achieved better image quality and regional compatibility with the SRTM than the others; this is because the former methods directly estimate DVR whereas the latter methods have increasing variability due to division and directly apply the prior information to the model parameters. Two different approaches for reducing the bias in multilinear SRTM (LLS-SRTM-SC and MTLS1-SC) were similarly effective, with slightly better performance in MTLS1-SC, especially given noisy reference region data. Unlike MTLS2 and MTLS2-SC, MTLS1 and MTLS1-SC are less dependent on noise-level assumption for reference region data, indicating that MTLS1-SC is the optimal choice for parametric imaging.
Footnotes
SS developed theory, performed image processing and kinetic analysis, and wrote the manuscript. SJK developed theory, performed image processing and kinetic analysis, and wrote the manuscript. YKK recruited subjects and collected data. J-YL recruited subjects and collected data. JMJ prepared radiotracer for this study and funded the study. DSL recruited subjects, collected data, and supervised study. JSL developed theory, supervised and funded this study, and wrote the manuscript.
The authors declare no conflict of interest.
References
Supplementary Material
Please find the following supplemental material available below.
For Open Access articles published under a Creative Commons License, all supplemental material carries the same license as the article it is associated with.
For non-Open Access articles published, all supplemental material carries a non-exclusive license, and permission requests for re-use of supplemental material or any part of supplemental material shall be sent directly to the copyright owner as specified in the copyright notice associated with the article.