
Abstract
Quantifying both arterial cerebral blood volume (CBVa) changes and total cerebral blood volume (CBVt) changes during neural activation can provide critical information about vascular control mechanisms, and help to identify the origins of neurovascular responses in conventional blood oxygenation level dependent (BOLD) magnetic resonance imaging (MRI). Cerebral blood flow (CBF), CBVa, and CBVt were quantified by MRI at 9.4T in isoflurane-anesthetized rats during 15-s duration forepaw stimulation. Cerebral blood flow and CBVa were simultaneously determined by modulation of tissue and vessel signals using arterial spin labeling, while CBVt was measured with a susceptibility-based contrast agent. Baseline versus stimulation values in a region centered over the somatosensory cortex were: CBF = 150 ± 18 versus 182 ± 20 mL/100 g/min, CBVa = 0.83 ± 0.21 versus 1.17 ± 0.30 mL/100 g, CBVt = 3.10 ± 0.55 versus 3.41 ± 0.61 mL/100 g, and CBVa/CBVt = 0.27 ± 0.05 versus 0.34 ± 0.06 (n = 7, mean ± s.d.). Neural activity-induced absolute changes in CBVa and CBVt are statistically equivalent and independent of the spatial extent of regional analysis. Under our conditions, increased CBVt during neural activation originates mainly from arterial rather than venous blood volume changes, and therefore a critical implication is that venous blood volume changes may be negligible in BOLD fMRI.
Keywords
Introduction
Cerebral blood flow and volume (CBF and CBV) are important indicators of brain physiology, viability, and function. Regional CBF and total CBV (CBVt) changes have been determined by magnetic resonance imaging (MRI) and positron emission tomography (PET) during global and neural stimulation, and their inter-relationship has been determined in rat, monkey and human brain (Grubb et al, 1974; Ito et al, 2001b; Jones et al, 2002; Lee et al, 2001; Mandeville et al, 1999). Relative CBVt (rCBVt) and relative CBF (rCBF) represent values normalized to baseline, and the relationship between these values is generally described following Grubb's equation (Grubb et al, 1974), as rCBVt = rCBFκ, where κ is a constant equal to 0.38. However, it is not clear what portion of arterial and venous cerebral blood volume (CBVa and CBVv, respectively) changes contribute to CBVt changes. Since CBVv comprises ~60% to 80% of CBVt (Lee et al, 2001), biomechanical models of vascular response (such as the balloon model) assume that CBVv changes dominate during stimulation, while CBVa changes are minimal (Buxton et al, 1998; Mandeville et al, 1999); thus, changes in CBVv have often been assumed to be similar to changes in CBVt. According to vascular physiology studies, however, local and upstream arterial vessels rigorously dilate during increased neural activity (Iadecola et al, 1997). Thus, it would be valuable to know the portion of CBVa change that contributes to overall stimulus-induced CBVt change to gain insight into vascular control mechanisms. Additionally, in functional MRI (fMRI), the blood oxygenation level dependent (BOLD) signal is closely dependent on many parameters, including CBF and venous (not total) cerebral blood volume (Ogawa et al, 1993). An increase in venous oxygenation level induced by an increase in CBF produces an increase in BOLD signals, while an increase in venous blood volume decreases the BOLD effect. Therefore, the separation of CBVt change into CBVa and CBVv changes is helpful for the interpretation of BOLD signals.
To measure the relationship between rCBVt and relative arterial and venous components (rCBVa and rCBVv, respectively) at different PaCO2 baseline conditions in rat, Lee et al (2001) utilized in vivo 19F nuclear magnetic resonance (NMR) spectroscopy after infusion of an oxygen-carrying perfluorocarbon, and found that the change in CBVa was larger than the CBVv change. Similarly, CBVt changes induced by hypercapnia and hypocapnia in human PET measurements have been determined to be mainly caused by changes in CBVa (Ito et al, 2005). However, these previously-determined global stimulation findings may not be applicable to a brain region specifically responding to neural stimulation, because of potential differences in global versus local and chemical versus neural vascular regulation mechanisms.
We therefore investigated the relationship between CBVa and CBVt in the rat somatosensory stimulation model. Although most fMRI studies have been performed with α-chloralose anesthesia, we instead chose to use isoflurane because it provides stability of anesthetic depth coupled with simple noninvasive induction (Lukasik and Gillies, 2003); these benefits enabled us to maintain consistent animal physiology during the long duration of these experiments. Baseline CBF with isoflurane anesthesia is known to be higher than with α-chloralose (Masamoto et al, in press), and has been shown to be similar to that of unanesthesized, awake rats (Maekawa et al, 1986). Thus, baseline CBF values in our isoflurane studies are expected to higher than for α-chloralose studies. Changes in CBF, CBVa, and CBVt were quantified at baseline and during stimulation in these fMRI studies. CBF and CBVa were simultaneously determined by a recently-developed MRI technique (Kim and Kim, 2005), which relies on independent MOdulations of TIssue and VEssel (MOTIVE) signals; signal intensity from the blood pool can be changed by arterial spin labeling (ASL), while signal originating from tissue can be selectively varied by magnetization transfer (MT) effects with no detectable change to arterial blood signals. The CBVa value measured by MOTIVE at 9.4 T represents the blood volume within arterial vessels of all sizes, and includes the portion of capillaries carrying blood water before it exchanges with tissue water; the diameter of arterial vessels in the rat parenchyma ranges from 30 to 40 μm in intracortical arterioles to 4 to 6 μm in capillaries (Nakai et al, 1981; Sanders and Orrison, 1995). CBVt was determined by intravascular infusion of a susceptibility-based contrast agent (Tropres et al, 2001; Yablonskiy and Haacke, 1994).
Materials and methods
Animal Preparation and Stimulation
All animal protocols were approved by the University of Pittsburgh Animal Care and Use Committee. Thirteen male Sprague—Dawley rats weighing 350 to 450 g (Charles River Laboratories, Wilmington, MA, USA) were studied; CBF, CBVa, and CBVt values were measured in seven animals, while only CBF and CBVa values were determined in an additional six animals. The animals were initially anesthetized with ~ 3% isoflurane in a mixture of O2 and N2O gases (1:2). The animals were intubated and the femoral artery and the femoral vein were catheterized. Isoflurane levels were then reduced to 1.3% to 1.5%, and the O2 and N2O gases were replaced with air supplemented with O2 to attain a total O2 level of ~ 30% throughout the experiments. The head of the animal was carefully secured in a home-built restrainer before placement in the magnet. Arterial blood pressure and respiration rate were continuously recorded. Blood gases were measured (Stat profile pHOx, Nova Biomedical, MA, USA) and ventilation rate and volume were adjusted accordingly. Rectal temperature was maintained at 37 to 37.5°C.
Electrical stimulation was applied to either the right or the left forepaw using two needle electrodes inserted under the skin between digits 2 and 4 and connected to a constant current stimulation isolator (A365D, World Precision Instruments, Inc., Sarasota, FL, USA), which was triggered by a pulse generator (Master 8, AMPI, Israel). Stimulation parameters for activation studies under isoflurane anesthesia were previously optimized by measurements of field potential, blood flow, and BOLD fMRI (Masamoto et al, in press); optimal values were implemented in this study where current = 1.5 to 1.8 mA, pulse duration = 3 msecs, and repetition rate = 6 Hz. The stimulation duration was 15 secs and the inter-stimulation period was > 1 min.
Magnetic Resonance Acquisitions
All MRI measurements were performed on a 9.4 T magnet with bore size of 31 cm diameter, interfaced to a Unity INOVA console (Varian, Palo Alto, CA, USA). The gradient coil was an actively shielded 12-cm inner diameter set with a gradient strength of 40 G/cm and a rise time of 130 μs (Magnex, Abingdon, UK). Two actively detunable radio frequency (RF) coils were used: a butterfly-shaped surface coil was positioned in the neck region for ASL, while a surface coil of 2.3 cm diameter was positioned on top of the head, both for tissue saturation via MT effects and for image acquisition. The homogeneity of the magnetic field was manually optimized on a slab twice the thickness of the imaging slice. All coronal images were acquired using single-shot echo planar imaging techniques with slice thickness = 2 mm, matrix size = 64 (readout) × 32 (phase-encode), and field of view = 3.0 × 1.5 cm2.
Measurements of cerebral blood flow and arterial cerebral blood volume using the MOTIVE method: A MOTIVE method (ASL with MT) was implemented to measure baseline CBF and CBVa values and their corresponding changes during somatosensory stimulation. In ASL, blood water spins are labeled at the carotid arteries, then this label is carried though arterial vessels and into the capillaries where the exchange between blood and tissue water occurs. If labeled water in capillary blood freely exchanges with tissue water, and spin relaxation is ignored, the contribution of labeled water in capillary blood, tissue, and venous blood will be identical, and so these three compartments are treated together as one compartment. Furthermore, T2 of venous blood at 9.4 T (5–7 msecs) is very short relative to T2 of tissue and arterial blood (40 msecs) (Lee et al, 1999), and therefore, even if labeled water in capillaries does not completely exchange with tissue water, signal contribution of any remaining labeled water in venous blood will be minimal when TE > 3 times T2 of venous blood. Since there is minimal label remaining in venous blood, venous blood volume does not contribute to CBVa values determined by MOTIVE at 9.4 T. Therefore, it is assumed that signal in an imaging voxel originates from only two compartments: arterial blood and tissue.
The experimental design and pulse sequence have been described previously (Kim and Kim, 2005). Arterial-spin labeled and unlabeled images at each of three different MT levels were acquired with an adiabatic-version spin-echo (SE) echo planar imaging sequence (Lee et al, 1999). On alternate acquisitions, RF pulses were transmitted from the neck coil at either -8500 Hz in the presence of a 1 G/cm B0 gradient (for labeled data), or at + 8500 Hz with the same B0 gradient (for unlabeled data). Tissue signals were differentially reduced without changing ASL efficiency by adjusting the RF power level of MT-inducing pulses, which were transmitted from the head coil at + 8500 Hz. The MT ratios (MTRs) (1-(SMT/S0), where SMT and S0 are equilibrium signals in the presence and absence of MT, respectively) were targeted to values of 0, 0.3, and 0.5 for gray matter, and applied in randomized order (their respective B1 field strengths were 0, 0.11, and 0.16 G). The spin preparation period was 2.4 s, which includes interleaved ASL and MT pulses, and the repetition time (TR) was 2.5 s. Although the MR signal may not reach steady state during a single spin preparation period, virtually continuous repetition of spin preparation during fMRI studies ensured steady-state MT conditions (acquisition time ≪ spin-preparation time). TE was 40 msecs in the seven studies where CBVt was subsequently measured, and 30 msecs in the other six studies.
Sixteen pairs of arterial-spin labeled (lab) and unlabeled (unlab) images were acquired for each MTR; five pairs during prestimulus baseline, three pairs during stimulation and eight pairs during the poststimulus period. The acquisition order of lab and unlab images was changed in alternate runs; the image order in run A was unlabA1, labA1, unlabA2, …, labA16, while in run B it was labB1, unlabB1, labB2, …, unlabB16, where subscripts refer to both the run and the pair. Thus, one cycle consisted of six combinations (two acquisition runs × three MTRs). Each full cycle was repeated 20 to 30 times.
Measurement of total cerebral blood volume using a contrast agent: The susceptibility contrast of dextrancoated super paramagnetic iron oxide particles (SPIO) was utilized for the determination of CBVt at baseline and during somatosensory stimulation. Super paramagnetic iron oxide (whole particle diameter ~ 30 nm (Dodd et al, 1999), obtained from Chien Ho's laboratory at Carnegie Mellon University) was prepared for intravenous injection at a concentration of 15 mg Fe/kg body weight. CBVt-weighted fMRI studies were performed by acquisition of gradient-echo (GE) echo planar images with TR = 1 s, and TE = 20 and 10 msecs before and after MION injection, respectively. For each condition (without and with SPIO), 70 images were acquired: 10 during prestimulus baseline, 15 during stimulation, and 45 during the poststimulus period. Stimulation runs were repeated 10 to 15 times. Additionally, separate GE echo planar images were acquired without stimulation before and after SPIO injection with TE = 20 msecs for determination of the change in apparent transverse relaxation rate induced by SPIO (
At the end of CBVt-weighted fMRI measurements, blood was withdrawn from the femoral artery to determine the magnetic susceptibility effect of SPIO in blood (Tropres et al, 2001). An assembly of perpendicularly oriented tubes had been previously constructed; two capillary tubes (1.1 mm inner diameter and 0.2 mm wall thickness; Fisher Scientific, Pittsburgh, PA, USA) filled with normal saline to ~14 mm length were secured inside an empty large cylinder (12.7 mm inner diameter, 15.0 mm height). The withdrawn blood was immediately placed in this assembly and positioned in the magnet such that one of the capillaries was oriented parallel to B0, while the other was perpendicular to B0. Localized spectra were acquired to measure the frequency difference between the peaks originating from each of the capillaries. Blood gas and hematocrit (Hct) levels were measured before and after spectroscopy measurements.
Data Processing
General Data Processing: For each animal, all identical-condition runs were averaged to generate group data. Then, for the purpose of inter-animal comparison only, an exclusion criterion was established. This was necessary because there was a drift in animal physiology of unknown origin during the long experimental durations, making it necessary to adjust the ventilation rate and volume between runs to maintain a constant end-tidal CO2 level, and consequently, some runs had extremely high or low functional responses. To identify these abnormal fMRI runs, stimulus-induced signal changes were initially calculated within a 9-pixel contralateral region of interest (ROI) for each run (see below for selection of ROIs), and a mean and s.d. value was then determined from all identical-condition runs. Then only identical-condition runs whose stimulus-induced changes were within the range of the aforementioned ROI-based mean ± 1.5 s.d. were averaged for the inter-animal comparisons.
To determine blood flow and volume changes four time periods were considered. The stimulation period was defined as the time between 5 and 15 secs after the onset of stimulation. Since CBVt is known to have a slow return to baseline after the cessation of stimulation (Mandeville et al, 1999), poststimulation data were divided into consecutive time intervals of 20 secs each, representing early and delayed poststimulation periods. For this reason, only the prestimulation time was defined as the baseline period.
Two types of quantitative analyses were then performed; maps were generated from pixel-by-pixel analysis with 2D Gaussian smoothing, and regional analysis was performed without spatial smoothing. Functional maps were obtained using a boxcar cross-correlation (CC) method (Bandettini et al, 1993). Statistical analyses were performed using paired t-tests (Origin 7.0, Northampton, MA, USA). All data are reported as mean ± s.d.
Calculation of cerebral blood flow and arterial cerebral blood volume: Data acquired in runs A and B were combined at each MT level to obtain unlabeled (SMT) and difference (ΔSMT = unlab—lab) images for matched time spans. It should be noted that Ssat and ΔSsat in our original MOTIVE paper (Kim and Kim, 2005) are replaced with SMT and ΔSMT here. SMT images were obtained as (unlabA1 + unlabB1)/2, (unlab A2 + unlabB1)/2, (unlab A2 + unlabB2)/2, etc. Similarly, ΔSMT images were obtained by subtraction of labeled from unlabeled data as [(unlabA1 + unlabB1)–(labA1 + labB1)]/2, [(unlab A2 + unlabB1)–(labA1 + labB2)]/2, [(unlab A2 + unlabB2)–(labA2 + labB2)]/2, etc. In this manner, images were reconstructed for each MT level as follows: the entire prestimulation period yielded nine SMT and nine ΔSMT baseline images; the period from 5 to 15 secs after stimulus onset yielded four SMT and four ΔSMT stimulation images; the initial 20 secs after stimulus offset yielded seven SMT and seven ΔSMT early poststimulus images; and data obtained from the final 20 secs after stimulation offset yielded seven SMT and seven ΔSMT delayed poststimulus images. Then, normalized ΔSMT signals (ΔSMT/S0) for each of the three MT levels were linearly fitted against normalized unlabeled signals (SMT/S0) at the corresponding MT level (Kim and Kim, 2005), where S0 is the signal intensity of an unlabeled image obtained in the absence of MT.
Cerebral blood flow (in units of mL/g/sec) without any arterial blood volume contribution was determined from the fitted data as
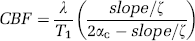
where λ is the tissue-blood partition coefficient of 0.9 mL/g (Herscovitch and Raichle, 1985); T1 is the T1 value of tissue without MT and in the absence of CBF contributions, which is 2.0 secs (Kim and Kim, 2005); αc is the labeling efficiency of arterial spins at the capillary exchange site within the imaging slice (as measured with identical experimental parameters), which is 0.31 (Kim and Kim, 2005). The correction term (ζ) in Equation (1) corrects for insufficient relaxation, since labeled and unlabeled images were acquired in an interleaved manner, and since the spin-labeling time was much less than 3 times
CBVa (in units of mL/g) can be obtained from the intercept and slope of the aforementioned fitting as

where αa is the labeling efficiency of spins entering the imaging slice, which is 0.36 (Kim and Kim, 2005).
Calculation of total cerebral blood volume and relative total cerebral blood volume change: Baseline CBVt was mapped first. Baseline CBVt quantification requires independent determinations of the effect of SPIO on magnetic susceptibility and the effect of SPIO on the in vivo relaxation rate. The effect of SPIO on magnetic susceptibility was measured in the arterial blood withdrawn at the end of studies. All susceptibility values are expressed in CGS units. The spectroscopic frequencies of water peaks originating from our parallel and perpendicularly-oriented capillaries (v‖ and v⊥, respectively) immersed in the withdrawn blood differ because of both hemoglobin in red blood cells and SPIO in plasma, and their separation can be expressed as v‖–v⊥ = 2π Δχblood+agent · v0 (Chu et al, 1990; Spees et al, 2001), where Δχblood+agent is the susceptibility difference between the arterial blood containing SPIO and water, and v0 is the spectrometer resonance frequency, which is 400.37 MHz in this study. Since the susceptibility of plasma is similar to that of water (Weisskoff and Kiihne, 1992), the susceptibility effect of the agent in plasma (Δχagent) can then be determined for each animal from the relationship,
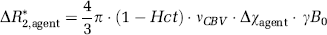
where vCBV is the fractional whole blood volume (mL blood/mL brain), which includes both plasma and blood cells, γ is the gyromagnetic ratio, which is 2.675 × 10⁸ rad/(sT), and B0 = 9.4 T in this study.
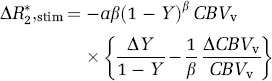
Absolute CBVt changes (ΔCBVt) during stimulation were determined after first calculating the stimulus-induced percentage changes in CBVt as follows. In fMRI studies, stimulus-induced apparent transverse relaxation rate changes (
Selection of regions of interest: The size of the forelimb somatosensory cortical area is ~ 1.5 × 1.5 mm2, based on coronal plates from a rat brain atlas (Paxinos and Watson, 1986) at positions 0.2 and 0.3 mm from bregma. Therefore, 9-pixel square ROIs (1.4 × 1.4 mm2) were defined, where one was centered over the anatomically defined somatosensory cortex on the side contralateral to stimulation (and hereafter referred to as the ʻfocus' ROI) and the other was positioned on the side ipsilateral to stimulation. Additional ROIs were defined to include a larger area on the side contralateral to stimulation, and thus remove any potential spatial bias: one ROI consisted of pixels where CBVt maps showed CC≥0.4, while another ROI was similarly defined, but the previously described 9-pixel inner region was not included. For ROI analyses, all pixels within the ROI were averaged, regardless of whether pixels were active.
Error propagation analysis: Error propagation analysis was performed for the measurement of baseline and stimulation CBF, CBVa, and CBFt values. For each animal, baseline time points were selected for the calculation of error propagation from the averaged time course (data used for the inter-animal comparisons). For CBF and CBVa, the slope and intercept (used in Equations (1) and (2)) obtained from linear fitting of three MT levels for each time point were calculated, and then mean and s.d. of baseline time points were determined. Additional CBF and CBVa errors were propagated based on our errors measured previously (Kim and Kim, 2005, 2006); s.d. is 23.2% of its mean for αc and αa, and 3% for tissue T1. For baseline CBVt, mean and s.d. of baseline time points were determined for conditions without and with SPIO. Another CBVt error was propagated from Hct levels determined before and after spectroscopy measurements and SPIO-induced frequency shifts determined from multiple spectroscopy measurements of the same blood sample. It is assumed that errors during stimulation are the same as for the baseline condition. Then, the error for ΔCBF, ΔCBVa, and ΔCBFt was propagated based on errors for baseline and stimulation values.
Results
All animals were maintained within normal physiological ranges; PaCO2 = 38.1 ± 4.6 mm Hg, PaO2 = 110.2 ± 11.6 mm Hg, and mean arterial blood pressure = 93.1 ± 8.0 mm Hg (n = 13). No significant blood pressure changes were observed during somatosensory stimulation. In the seven animals where SPIO was injected, comparison of Hct values before and after spectroscopy measurements on the withdrawn arterial blood show that there was no red blood cell precipitation. The average Hct level was 35.9% ± 0.9% (n = 7). The susceptibility effect of blood and agent (Δχblood + agent) after SPIO injection was 0.23 ± 0.02 ppm (corresponding to an average frequency shift of ~ 570 Hz) and the susceptibility effect of SPIO in plasma (Δχagent) was 0.36 ± 0.03 ppm (n = 7). The average baseline transverse relaxation rate change induced by SPIO (
Baseline CBF, CBVa, and CBVt maps were successfully obtained from all measurements, as well as functional maps corresponding to somatosensory stimulation. Results for three animals appear in Figure 1A–Figure 1C, where the grayscale maps are baseline values, and color overlays represent functional activation. The ventral brain region was relatively far from the detection coil, resulting in poor sensitivity, and likely large errors in CBF, CBVa, and CBVt quantification. Baseline maps in all three animals (Figure 1A–Figure 1C) were quite similar, except at the cortical surface area where large vessels exist. CBVa and CBVt maps show apparent differences in the deep gray matter (including thalamus) regions, which may be caused by structural differences in tissue supplied by striate arteries, use of constant λ, T1, and αa values for generating CBVa maps, or smearing from the susceptibility effect of the contrast agent. Baseline values for CBF, CBVa, and CBVt are higher in gray matter than in white matter, as expected. During stimulation, localized activation was observed in the contralateral somatosensory cortex. Since the CC value is dependent on sensitivity, the size of the activation area also depends on the threshold chosen for display. Functional activation maps of CBVt for matched display thresholds would therefore show the largest regions of activation, because the CBV-weighted fMRI technique has higher sensitivity than the MOTIVE method with ASL. However, the focus of activation is consistent for CBF, CBVa, and CBVt. Similar observations were detected in all animals.
Regional quantification of CBF, CBVa, and CBVt values was performed without spatial smoothing for baseline and stimulation periods. Location of ROIs chosen for analysis is shown on echo planar images (Figure 1D), where this lack of smoothing clearly resolves gray and white matter boundaries. The ʻfocus' ROIs centered over the anatomically defined somatosensory cortex on the side contralateral to stimulation appear in Figure 1D as white boxes marked ʻcʼ, while 9-pixel ROIs on the side ipsilateral to stimulation appear as white boxes marked ʻiʼ. Average baseline and stimulation values (n = 7) from ʻfocus' ROIs are reported in Table 1. The average ratio of CBVa to CBVt within the ʻfocus' ROI was 0.27 ± 0.05 for baseline and 0.34 ± 0.06 for stimulation. Regional baseline values of CBF, CBVa, and CBVt were also measured in the 9-pixel ROI on the ipsilateral side: CBF = 146 ± 20 mL/100 g/min, CBVa = 0.87 ± 0.32 mL/100 g and CBVt = 3.18 ± 0.41 mL/100 g (n = 7). Baseline values in these contralateral versus ipsilateral ROIs for CBF, CBVa, and CBVt were not statistically different (P > 0.05). With inclusion of the six studies in which CBVt was not measured, CBF and CBVa values within the ʻfocus' ROI were 151 ± 23 mL/100 g/min and 0.90 ± 0.25 mL/100 g (n = 13) for baseline, and 196 ± 33 mL/100 g/min and 1.32 ± 0.39 mL/100 g (n = 13) for stimulation. It should be noted that autoradiography measurements in the rat somatosensory cortex yielded a CBF value of 147 mL/100 g/min for 1.38% isoflurane anesthesia (Maekawa et al, 1986). Changes in CBF and CBVt (22% and 10%) in our isoflurane-anesthetized studies are less than values observed previously under α-chloralose anesthesia (Mandeville et al, 1998; Silva et al, 2000), which is likely because of the difference in anesthetics.
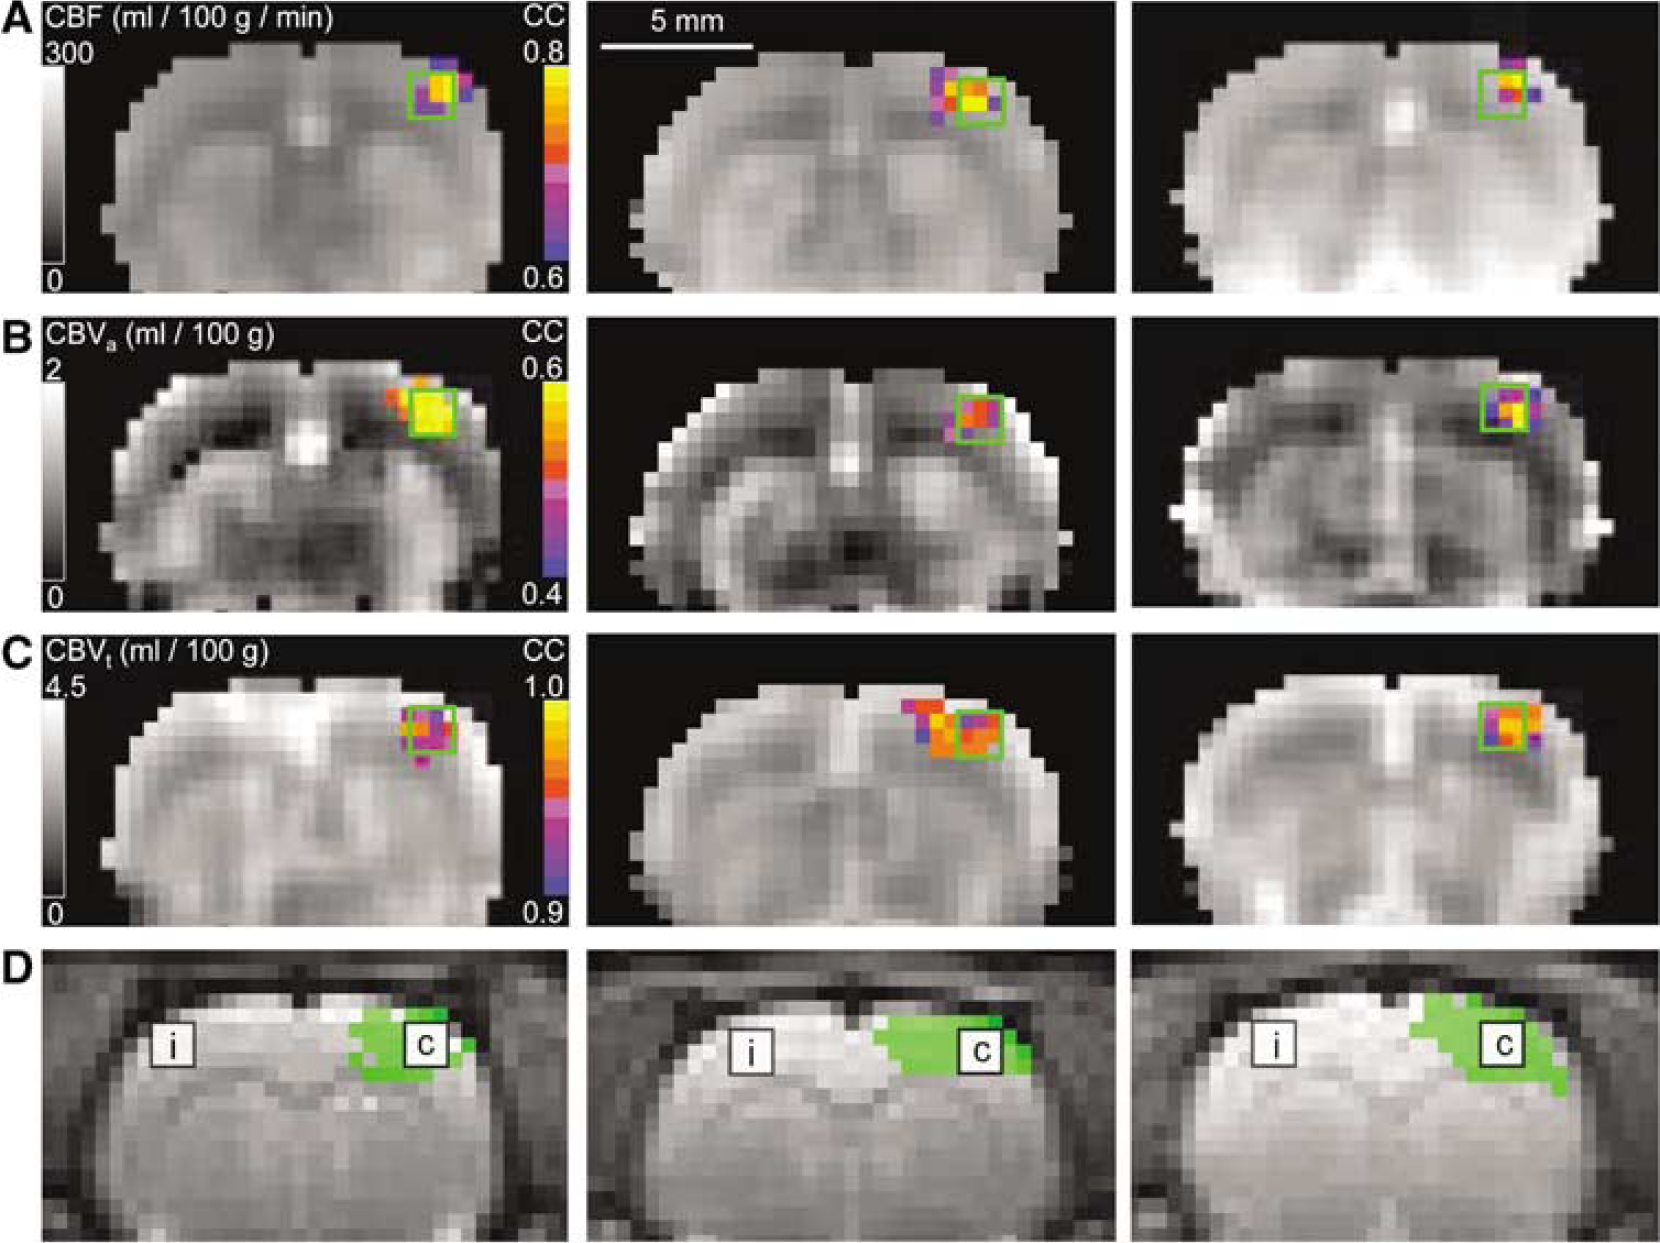
Quantitative baseline hemodynamic maps and the corresponding responses to somatosensory stimulation for three different animals (columns). The hemisphere contralateral to stimulation appears on the right side of all images. Functional activation maps are overlaid in color on the grayscale baseline maps from measurements of CBF (
Measured parameters and changes due to activation within the ʻfocus' ROI (n = 7, mean ± s.d.) a
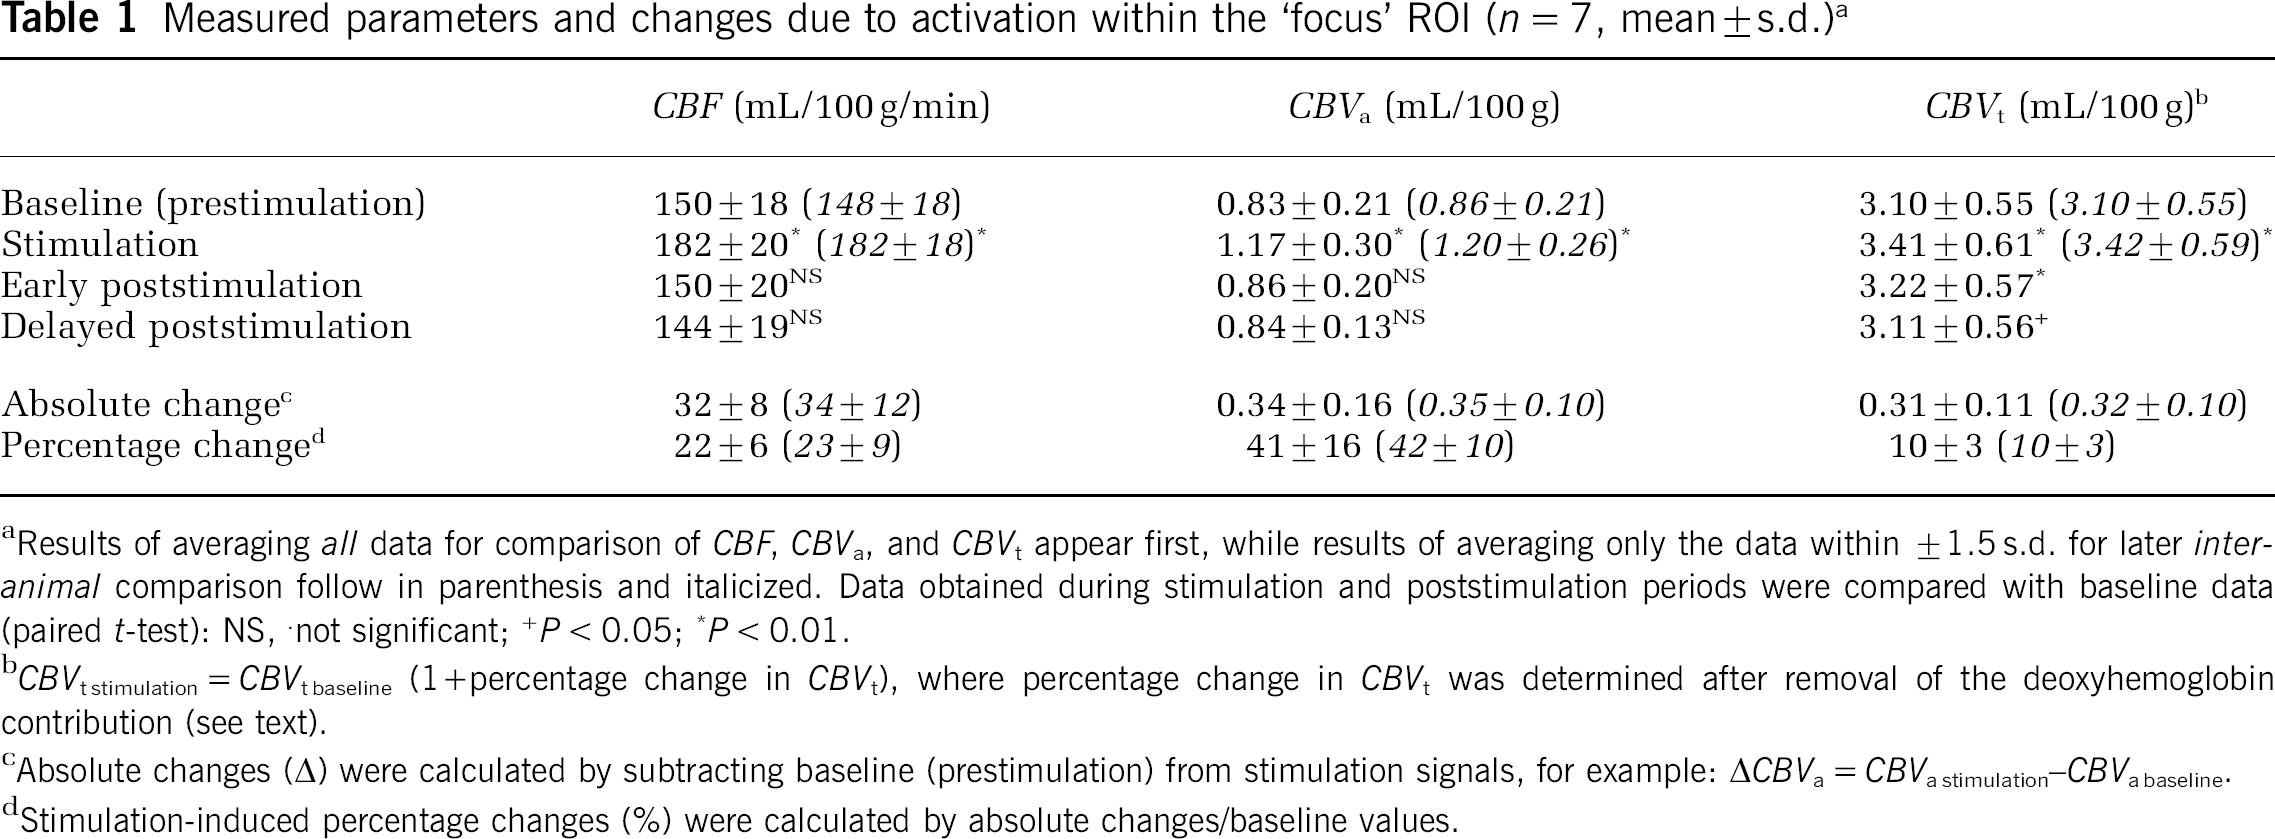
aResults of averaging all data for comparison of CBF, CBVa, and CBVt appear first, while results of averaging only the data within ±1.5 s.d. for later inter-animal comparison follow in parenthesis and italicized. Data obtained during stimulation and poststimulation periods were compared with baseline data (paired t-test): NS, not significant; +P < 0.05;P < 0.01.
bCBVt stimulation = CBVt baseline (1 + percentage change in CBVt), where percentage change in CBVt was determined after removal of the deoxyhemoglobin contribution (see text).
cAbsolute changes (Δ) were calculated by subtracting baseline (prestimulation) from stimulation signals, for example: ΔCBVa = CBVa stimulation–CBVa baseline.
dStimulation-induced percentage changes (%) were calculated by absolute changes/baseline values.
From CBF and CBV, mean transit time of blood (MTT) can be calculated as MTT (min) = CBV (mL/100 g)/CBF (mL/100 g/min), using the central volume principle. For the ʻfocus' ROI, the mean arterial transit time (MTTa) (i.e., the time for blood to travel through arterial volumes within a pixel) was 336 ± 95 msecs for baseline and 388 ± 99 msecs for stimulation, while the mean total transit time of blood (MTTt) (i.e., the time for blood to travel through the total vasculature within a pixel) was 1271 ± 347 msecs for baseline and 1140 ± 269 msecs for stimulation (n = 7). Thus, the stimulus-induced changes in MTT (ΔMTT) are + 53 ± 34 msecs for arterial vasculature and -131 ± 100 msecs for total vasculature. Since average blood velocity is related to the inverse of MTT, the negative values of ΔMTTt indicate a stimulus-induced increase in total blood velocity, while the small ΔMTTa values suggest there is minimal change to arterial blood velocity.
The relationship between CBVa and CBVt was also determined in the ʻfocus' ROI during two consecutive poststimulation recovery periods (Table 1). Values for baseline (pre-stimulation) CBVa versus both early and delayed poststimulation CBVa were not statistically different (P > 0.05). However, both post-stimulation CBVt values were significantly higher than baseline CBVt (Table 1). This suggests that there is a slow return of CBVt to prestimulation baseline levels after stimulation offset, which is consistent with previous observations in the rat somatosensory cortex (Mandeville et al, 1999).
The absolute change in CBVa (ΔCBVa) because of activation in the ʻfocus' ROI was 0.34 ± 0.16 mL/100 g, while the CBVt change (ΔCBVt) was 0.31 ± 0.11 mL/100 g (Table 1). The statistical difference between stimulation-induced ΔCBVa versus ΔCBVt is not significant (paired t-test, P = 0.38); however, the active region always appeared larger in CBVt than in CBF and CBVa functional maps displayed with the same CC threshold, and therefore the size of ROI chosen for analysis could potentially bias our results. To examine the consistency of the quantitative relationship between CBF, CBVa, and CBVt values were also analyzed within a larger ROI encompassing pixels where CC ≥ 0.4 in CBVt maps. This region includes 33 ± 6 pixels (n = 7) and is referred to as the ʻCBVt-activeʼ ROI (shown in Figure 1D as the area of green pixels plus the white boxes marked ʻc‘). It should be noted that this includes all pixels of CBF and CBVa activation for the same threshold. Values were also quantified for an area away from the activation focus; this ROI was defined as pixels in the ʻCBVt-active’ ROI outside of the ʻfocus' ROI (the area covered by only the green pixels in Figure 1D). This region includes 24 ± 5 pixels (n = 7) and is referred to as the ʻCBVt-active minus focus' ROI. The absolute change in these larger ROIs was smaller compared with the ʻfocus' ROI because of a partial volume effect (Figure 2A). However, even in these larger regions, ΔCBVa versus ΔCBVt is not statistically different (Figure 2A). The ratio of relative values for CBVt to CBVa is also consistent; 0.78 ± 0.07 in the ʻfocus' ROI versus 0.85 ± 0.07 in the ʻCBVt-active ROI' versus 0.87 ± 0.08 in the ʻCBVt-active minus focus' ROI (no statistical difference, P > 0.05) (Figure 2B). This demonstrates that the choice of ROI does not change the relationship between CBVa and CBVt.
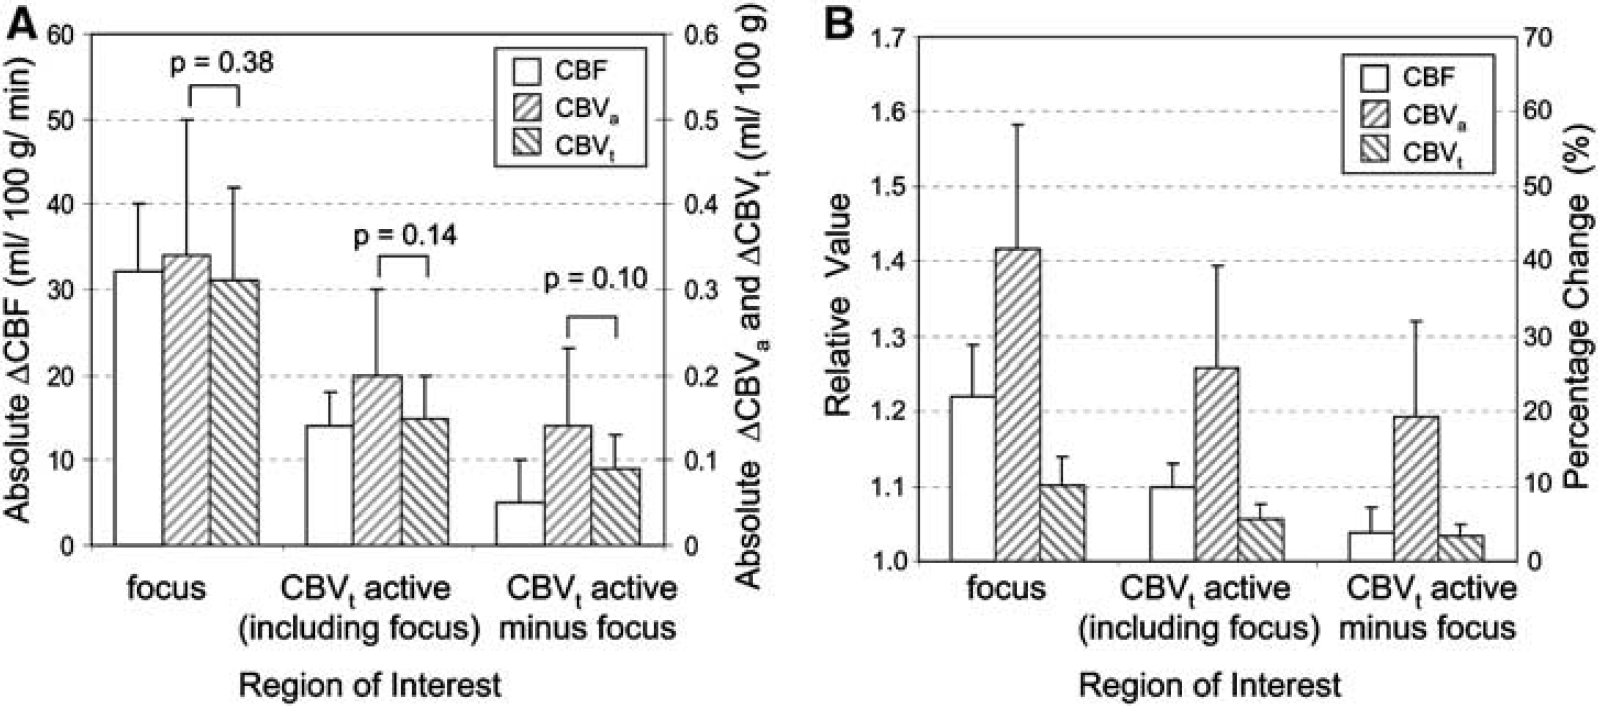
Regional quantification of absolute changes and relative hemodynamic values for ROIs of varying spatial extent. Analysis was performed for the contralateral ROIs indicated in Figure 1D to examine the ratios between hemodynamic measurements. (
Inter-animal comparisons of CBF, CBVa, and CBVt baseline and stimulation values were made for runs whose mean stimulus-induced changes were within the range of the mean ± 1.5 s.d.; these values within the ʻfocus' ROI were averaged across all animals and appear in parenthesis in Table 1. Averaged values with and without this exclusion criterion were not different (P > 0.05). Inter-animal comparisons of CBF, CBVa and CBVt baseline and stimulation values within the ʻfocus' ROI are plotted in Figure 3A and Figure 3B, while stimulus-induced changes in absolute values (ΔCBF, ΔCBVa, and ΔCBVt) are plotted in Figure 3C and Figure 3D. Although inter-animal variation still causes scatter in the data (Figure 3A and Figure 3B), CBF, CBVa, and CBVt values for all animals are increased during stimulation (Figure 3C and Figure 3D), and relationships between these stimulus-induced changes are highly correlated. Inter-animal comparisons for the ʻfocus' ROI are also plotted for arterial versus total CBV changes (Figure 4A), and for stimulus-induced changes in MTTt (ΔMTTt) and MTTa (ΔMTTa) (Figure 4B). These inter-animal comparisons further illustrate the dominance of the ΔCBVa contribution to ΔCBVt, and suggest a stimulus-induced increase in total blood velocity, but not arterial blood velocity.
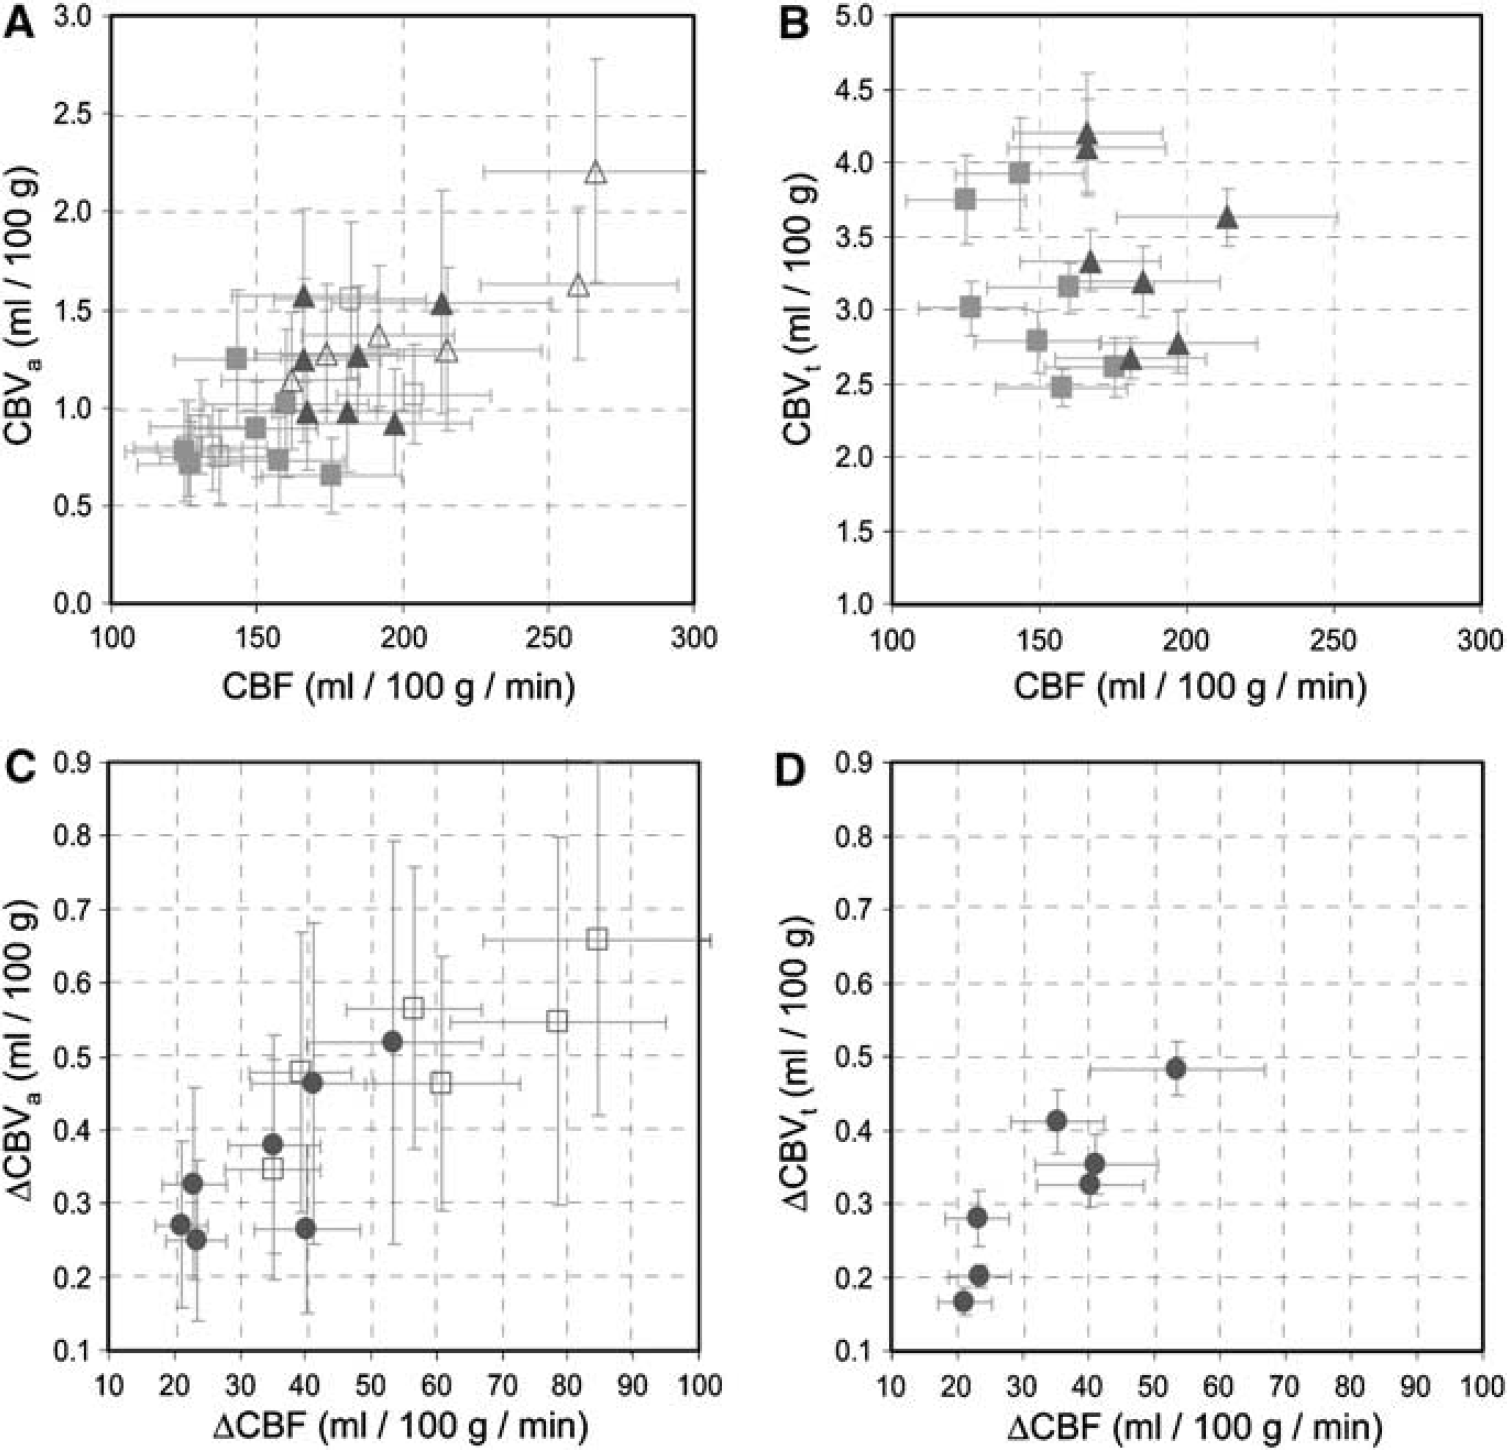
Inter-animal comparisons between values and changes to CBVa and CBVt versus CBF from within the ʻfocus ROI‘. Open symbols represent data without subsequently measured CBVt (n = 6) and filled symbols represent data with CBVt measurements (n = 7). Data from baseline (squares) and stimulation (triangles) conditions for CBVa versus CBF (
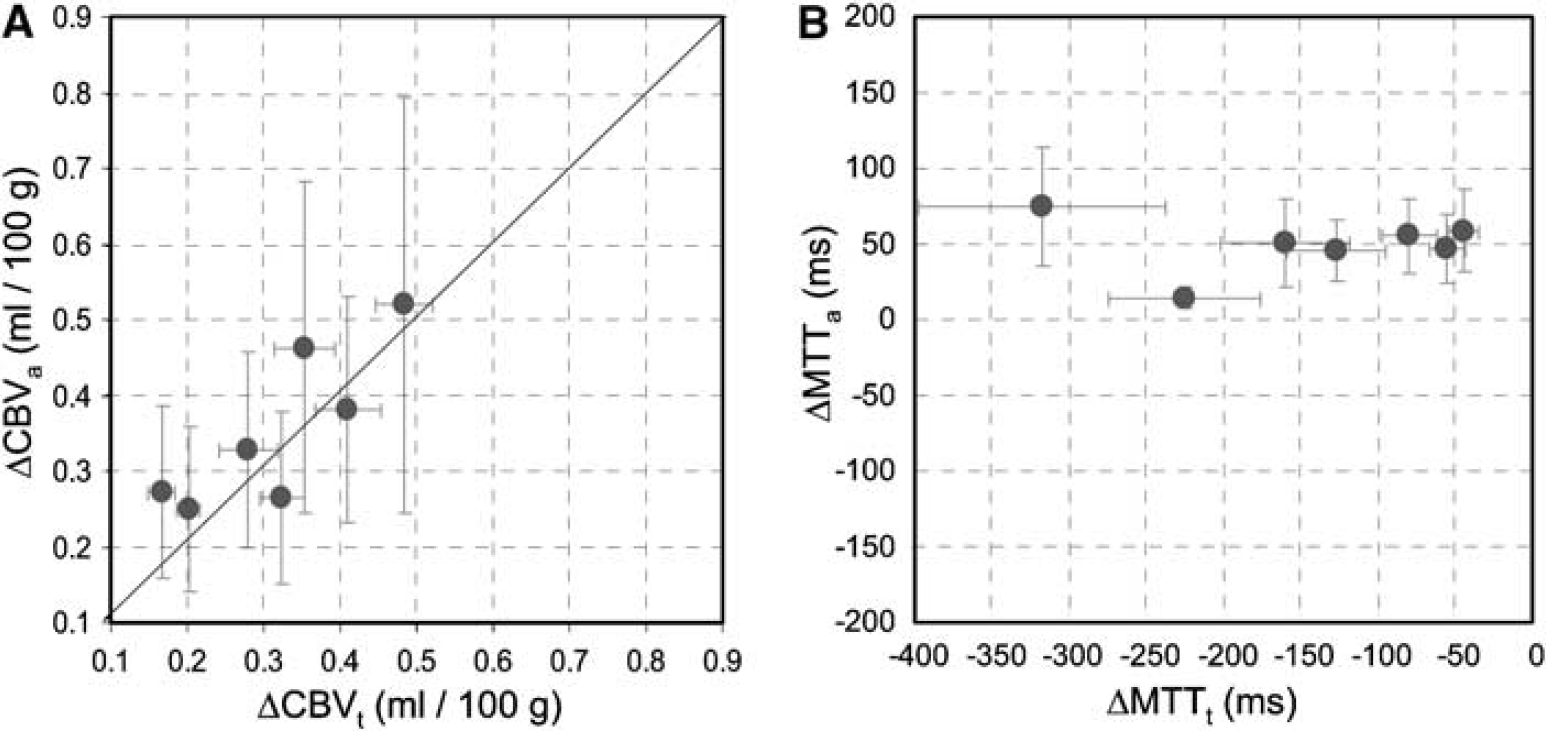
Inter-animal comparisons between stimulus-induced changes in CBVa versus CBVt (
Discussion
Technical Considerations in Arterial Cerebral Blood Volume and Total Cerebral Blood Volume Measurements
If there were significant CBVv changes during stimulation, then ΔCBVt would exceed ΔCBVa. However, no significant differences between ΔCBVa and ΔCBVt were detected in our studies (Figure 2A), raising questions about possible errors in the measured values of CBVa and/or CBVt. We will first evaluate CBVa quantification errors based on potential contributions from (i) venous blood signal; (ii) stimulation-induced changes in oxygenation and in exchange between blood and tissue water pools; and (iii) MT effects in arterial blood.
The contribution of venous volume to the CBVa values will be negligible if labeled blood water in capillaries freely exchanges with tissue water during the spin tagging time; in this case, the exchange fraction (E, often referred to as the ʻextraction fraction‘) will be equal to 1. If labeled blood water does not freely exchange with tissue water, some labeled water remains in the capillary, and venous blood then contributes to the CBVa quantification. To evaluate this potential error, we expand our biophysical model from two compartments (artery and tissue) to four compartments (artery, capillary, tissue, and vein). Signal sources then consist of labeled spins in the arterial blood water pool, labeled spins in the tissue pool, and any labeled spins remaining in both the capillary and venous pools. Thus, the intensity difference between arterial labeled and unlabeled images (ΔSMT) can be described as
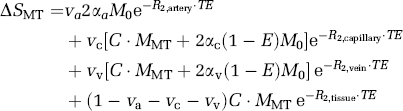
where the spin fractions of arterial (va), capillary (vc) and venous blood (vv) are assumed to be 1%, 1%, and 3%, respectively; spin-labeling efficiencies in arterial (αa), capillary (αc), and venous (αv) compartments are 0.36, 0.31, and 0.26, respectively (Kim and Kim, 2005); M0 is the magnetization without MT and without spin labeling; MMT is the magnetization with MT and without spin labeling; R2,artery and R2,tissue are the transverse relaxation rates (R2 values) of arterial and tissue blood, which are both assumed to be 25 secs−1 (Lee et al, 1999); venous R2 (R2,vein) is determined from 478–(458 · Y) secs−1 (Lee et al, 1999), where Y is the venous oxygenation level; capillary blood R2 (R2,capillary) is assumed to be the averaged value of artery and vein; C is a constant related to blood flow, which is equivalent to
and is measured from the slope of normalized arterial spin-labeled signal change versus normalized unlabeled signals as a function of MT level and is assumed to be 0.033. Simulations performed with TE of 40 msecs for various venous oxygenation levels and exchange fractions that cover a range of reasonable expectations are graphed in Figure 5. Overestimation of CBVa as calculated from the two-compartment model used in Results is relatively small.
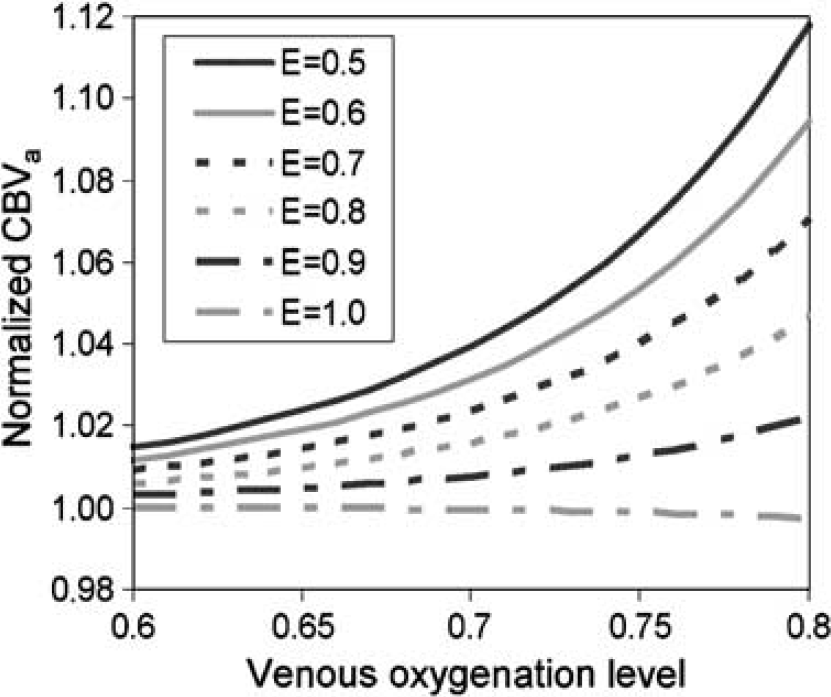
Simulation of CBVa quantification errors with the two-compartment model, in the case that arterial spin-labeled water does not completely exchange with tissue. Two signal sources (artery and tissue) in the original biophysical model for measurement of CBVa by MOTIVE are expanded to include four compartments, artery, capillary, tissue, and vein. See text for simulation parameters and assumptions. The overestimation of CBVa is relatively small with the two-compartment model.
Also, during neural stimulation, an elevation of CBF may cause a decrease in the water exchange fraction in capillaries and an increase in venous oxygenation level, resulting in an overestimation in ΔCBVa. Venous oxygenation levels during stimulation can be determined from CBF values at baseline and stimulation conditions using Fick's principle assuming no oxygen consumption change induced by stimulation. Baseline oxygenation levels were 0.58 ± 0.01 for venous blood in human brain (An and Lin, 2000) and 0.64 ± 0.14 (n = 6) for blood from the femoral vein in our studies. Therefore, a reasonable upper estimate of venous oxygenation levels for baseline conditions is 0.60 to 0.70, and the corresponding levels during stimulation will be 0.67 to 0.75. The water exchange fraction relevant to our studies can be obtained by determination of E = 1 – exp(–PS/CBF), where PS is the capillary permeability-surface product. Assuming PS = 138 mL/100 g/min (Eichling et al, 1974), E will be 0.6 for the baseline CBF of 150 mL/100 g/min, and ~ 0.5 for the stimulation CBF value of 182 mL/100 g/min. These simulations show that for baseline conditions (E = 0.6, Y = 0.60 to 0.70), CBVa is overestimated by 1% to 3%, while for stimulation conditions (E = 0.5, Y = 0.67 to 0.75), CBVa is overestimated by 3% to 7%. True CBVa assuming these reasonable oxygenation levels would then be 0.81 to 0.82 mL/100 g at baseline and 1.09 to 1.14 mL/100 g during the stimulation condition. The largest possible error for any studies would occur if there was no overestimation for baseline (E = 1), and the measured CBVa value during stimulation was overestimated by 12% (see Figure 5, E = 0.5, Y = 0.8). If we apply these larger errors to our own measurements, true CBVa would increase from 0.83 at baseline to only 1.04 mL/100 g during stimulation. When we correct for these varying estimates of CBVa quantification errors, we find that true ΔCBVa would be somewhere in the range of 0.21 (assuming largest error) to 0.33 mL/100 g (assuming smallest error).
Related to this overestimation of CBVa is the slight increase in our calculated value of MTTa because of stimulation (Figure 4B), which suggests a blood velocity decrease in parenchymal arterial vessels. This is not expected. Blood velocity was previously observed to increase in pial arterial vessels (Ngai and Winn, 1996; Ngai and Winn, 2002). The discrepancy may be at least partly because of errors in our quantification. When E < 1, not only is CBVa overestimated, but also CBF is underestimated. For example, if E is decreased by 10% because of activation, our ΔCBF value is underestimated by 10%. A reduced exchange fraction because of stimulation would therefore cause ΔMTTa to be overestimated and could explain the slight increase we determined for MTTa.
With the MOTIVE approach, it is assumed that the MT effect in arterial blood is not significant. When protons in tissue macromolecules are saturated by RF pulses, their magnetization is transferred to tissue water protons, selectively reducing the tissue signal. But we assume that the arterial pool is only minimally affected, because of its small macromolecular content, and because of the inflow of fresh spins from outside the B1 field of MT-inducing pulses. Magnetization during an MT saturation time (t) reaches a steady state at the rate of 1/T1sat, where T1sat is the apparent T1 for equilibration of water and macromolecular pools; this magnetization can be expressed as MMT(t) = Ma exp(–t/T1sat) + Ms, where Ma is the magnitude of magnetization decay and Ms is the magnetization residue at steady state, such that MMT(0) = Ma + Ms; MMT(∞) = Ms (Niemi et al, 1992). The MTR in stationary blood relative to gray matter is ~40% (Niemi et al, 1992; Pike et al, 1992), and therefore when MTR (= 1 – MMT(t)/MMT(0) = 1 – SMT(t)/SMT(0)) is 0.5 in gray matter (the highest MTR value in our studies), MTR of stationary blood is expected to be ~ 0.2. Using the same pulse power level, which gave an MTR value of 0.5 for gray matter, our own MR measurement on stationary blood yielded MMT(t) = 0.21 · exp(–t/1.87) + 0.79 (n = 1, data not shown), where T1sat is 1.87 secs. This fitting is well matched with estimates from literature (Niemi et al, 1992; Wolff and Balaban, 1989). In our specific application, the B1 field from the head coil did not extend to the position of ASL in the animal's neck. Labeled arterial blood water will travel to the imaging plane in ~ 300 msecs (and so will experience the MT-inducing pulse for < 300 msecs), and then will spend ~ 300 msecs in the arterial vasculature of the imaging pixel before exchange in the capillaries (Kim and Kim, 2006). Thus, the time that moving blood in arterial vessels experiences the MT-inducing B1 field is within the range of 300 to 600 msecs, which gives MMT (t = 0.3 to 0.6) = 0.97 to 0.94, with a resultant MTR range of 0.03 to 0.06. Therefore, in our measurements the signal reduction because of MT effects in arterial blood is negligible (~ 3% to 6% in arterial blood versus 50% in gray matter).
A potential error in CBVt quantification is because of its determination by injection of a susceptibility contrast agent, which distributes only in plasma. Since we could not measure hematocrit levels from the cortical tissue of our MRI pixels, systemic Hct levels were instead measured to convert from plasma volume to whole blood volume (CBVt) in our studies (see the factor (1 – Hct) in Equation (3)). However, capillary Hct level values have been reported to be 74% (Cremer and Seville, 1983) and 81% (Levin and Ausman, 1969) of systemic Hct levels. Therefore, the error in CBVt quantification depends on the ratio of volumes between capillaries and large vessels, but the measurement of capillary volume is not trivial. If the capillary:large vessel volume ratio is 1:3, then CBVt will be overestimated by 3% to 4%, whereas if the volume ratio is 1:1, then CBVt will be overestimated by 5% to 7%. If the capillary volume is dominant, then CBVt will be overestimated by 10% to 14%, which represents the upper limit of CBVt error. If we assume that the Hct level does not change during stimulation, then ΔCBVt will be similarly overestimated. After correction for this overestimation (i.e., 3% to 14%), ΔCBVt is between 0.26 and 0.30 mL/100 g. An additional assumption is that the signal intensity of pixels is not influenced by static magnetic susceptibility effects from neighboring pixels. However, in our CBVt maps, pixels in the region near large vessels will experience susceptibility effects from neighboring vessels, and thus CBVt values in those pixels will be overestimated by an unknown amount. In our studies, the deoxyhemoglobin contribution to stimulus-induced CBVt changes were removed; ΔCBVt calculated without the correction of deoxyhemoglobin contribution would have been underestimated by ~ 20%. Variation of stimulation-induced deoxyhemoglobin changes will also affect ΔCBVt. In our studies, the intra-animal, interrun s.d. of BOLD signals was 42% of its mean, which will give ~8% error (0.42 × 0.2) in ΔCBVt values.
Relationships between Arterial Cerebral Blood Volume and Total Cerebral Blood Volume
The ratio of baseline CBVa to CBVt for normal physiological conditions has previously been a parameter of interest. Our CBVa/CBVt value was 0.27 ± 0.05, which is consistent with 0.29 ± 0.07 in halothane-anesthetized rats (Duong and Kim, 2000), 0.25 in α-chloralose-anesthetized rats (Lee et al, 2001), and 0.23 ± 0.04 in humans (An and Lin, 2002). However, these CBVa/CBVt values measured by NMR spectroscopy or MRI are lower than the values determined by PET in humans of 0.37 ± 0.11 (Ito et al, 2001a) and 0.46 ± 0.12 (Ito et al, 2005). Interestingly, although there is a large difference in baseline CBF between isoflurane and α-chloralose anesthetics (~ 150 versus ~ 60 mL/100 g/min), values of CBVa/CBVt are similar. This suggests that isoflurane effects on arterial and venous vessels may be similar.
During neural activation, the CBVa change is dominant, while the CBVv change is negligible. Our quantitative relationship between CBVa and CBVt data in this rat study during 15 secs of somatosensory stimulation agrees reasonably well with human PET studies during global stimulation (Ito et al, 2005). If overestimation errors in ACBVa outweigh overestimation errors in ΔCBVt, then there could actually be a CBVv increase. In our laboratory's previous CBF and CBVv measurements with 19F NMR spectroscopy, CBVv was slightly increased during elevated CBF in α-chloralose anesthetized rats during steady-state, high PaCO2 conditions (Lee et al, 2001). The discrepancy in measured CBVv changes in the two studies might be because of different anesthetics (isoflurane versus α-chloralose), different spatial distributions of activation (somatosensory cortex versus whole brain), different physiological origins of response (CO2 or H + versus neural activity), different stimulus durations (short forepaw stimulation versus long CO2 inhalation), different baseline CBF values, and/or measurement errors that differ with technique.
Arterial and venous CBV changes can also be inferred from vessel diameter measurements. Most measurements have been performed on pial vessels because of limitations in microscopic vessel visualization. Direct pial vessel diameter measurements during hypercapnia showed increases of ~ 58% in 10 to 20 μm diameter arterial vessels versus ~ 10% increases in 10 to 20 μm diameter venous vessels (Lee et al, 2001). Using the 2D optical imaging spectroscopy technique, Berwick et al (2005) found that blood volume changes during rodent whisker-stimulation were larger in arterial pial vessels than in venous pial vessels by a ratio of 2.9. Recently, Takano et al (2006) measured changes of parenchymal vessels in mouse somatosensory cortex using two-photon microscopy; arterial vessel diameter increased ~ 18% during stimulation, while venous vessel diameter increased ~ 2%. These microscopic measurements of vessels indicate that arterial blood volume change is dominant during neural stimulation, which is consistent with our observations.
Our finding may not be applicable to all stimulation studies. The magnitude of time-dependent CBVv change may depend on stimulation type and duration. Stefanovic and Pike reported a 16% CBVv increase in humans during 4-min-long radial yellow/blue checkerboard stimulation at 4 Hz reversing frequency (Stefanovic and Pike, 2005). In their measurement, many assumptions are required to separate the venous blood volume change from transverse relaxation changes in tissue and blood. Since venous blood vessels passively respond to upstream blood pressure, the dynamics of CBVv are likely to be slower than those of CBVa (Mandeville et al, 1999). Thus, stronger and longer stimulation is likely to result in a higher CBVv response at a later time.
Implication for Blood Oxygenation Level Dependent Quantification
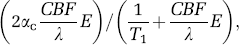
The relationship between
Increased neural activity induces a change in venous blood oxygenation level (ΔY) and a change in venous blood volume
(see Kim et al, 1999 for a detailed derivation). ΔCBVv/CBVv has previously been estimated either directly from ΔCBVt/BVt measurements (Mandeville et al, 1998) or indirectly from CBF changes using rCBVt = rCBVv = rCBFk (Davis et al, 1998; Kim and Ugurbil, 1997). Since our results show relatively small or negligible venous blood volume changes during stimulation (ΔCBVv ≅ 0), BOLD fMRI signals under our conditions arise mostly from changes in venous oxygenation (ΔY). If the relationship ΔCBVv/CBVv = ΔCBVt/CBVt is used in Equation (5), ΔY will be overestimated as determined from the measured BOLD response, and this overestimation in ΔY consequently translates into an underestimation of ΔCMRO2/CMRO2. Therefore, accurate determination of venous CBV change is important in quantification of physiological parameters from BOLD fMRI signal changes.
Conclusions
We have successfully quantified CBF, CBVa and CBFt during control and stimulation periods. Under our conditions of 15-s somatosensory stimulation in isoflurane-anesthetized rats, we determined that coincident with the neural-induced elevation of CBF, blood volume changes occur mainly in arteries rather than in veins. Since arterial and venous CBV changes can be dependent on stimulation duration and type, extensive studies are needed before our observation can be generalized.