
Abstract
To evaluate changes in cerebral hemodynamics and metabolism induced by acetazolamide in healthy subjects, positron emission tomography studies for measurement of cerebral perfusion and oxygen consumption were performed. Sixteen healthy volunteers underwent positron emission tomography studies with15O-gas and water before and after intravenous administration of acetazolamide. Dynamic positron emission tomography data were acquired after bolus injection of H215O and bolus inhalation of15O2. Cerebral blood flow, metabolic rate of oxygen, and arterial-to-capillary blood volume images were calculated using the three-weighted integral method. The images of cerebral blood volume were calculated using the bolus inhalation technique of C15O. The scans for cerebral blood flow and volume and metabolic rate of oxygen after acetazolamide challenge were performed at 10, 20, and 30 minutes after drug injection. The parametric images obtained under the two conditions at baseline and after acetazolamide administration were compared. The global and regional values for cerebral blood flow and volume and arterial-to-capillary blood volume increased significantly after acetazolamide administration compared with the baseline condition, whereas no difference in metabolic rate of oxygen was observed. Acetazolamide-induced increases in both blood flow and volume in the normal brain occurred as a vasodilatory reaction of functioning vessels. The increase in arterial-to-capillary blood volume made the major contribution to the cerebral blood volume increase, indicating that the raise in cerebral blood flow during the acetazolamide challenge is closely related to arterial-to-capillary vasomotor responsiveness.
Keywords
Evaluation of the cerebrovascular response to a cerebral vasodilatory stimulus may be useful for predicting the risk of cerebral ischemia in patients with major cerebral arterial occlusive diseases, who show a variable degree of cerebral autoregulatory vasodilatation in response to reduced perfusion pressure (Vorstrup, 1988; Yonas and Pindzola, 1994). Measurement of the cerebral blood flow (CBF) or blood velocity response to acetazolamide (ACZ) is commonly used to assess the vasodilatory capacity of the cerebral circulation (the ACZ test) because ACZ is safer and more easily administered than carbon dioxide. However, it is controversial whether the ACZ test is valid for quantitative assessment of maximum cerebral autoregulatory vasodilatation (Derdeyn et al., 1999). The vasodilatory effects of ACZ are complex and might be caused by mechanisms that are different from those of other vasodilatory stimuli. In patients with major cerebral arterial occlusive diseases, dissociation between the CBF response to carbon dioxide or neural activation and ACZ has been reported (Kazumata et al., 1996; Inao et al., 1998). The effects of ACZ on cerebral hemodynamics and metabolism are not well understood.
Acetazolamide is known to increase CBF via its effects on peripheral vasodilatation. However, it has not been investigated using clinical imaging studies whether ACZ induces vasodilatation of cerebral arteries, and whether cerebral blood volume changes in proportion to the degree of CBF increase. The simultaneous evaluation of CBF and cerebral blood volume (CBV), an index of vasodilatation, before and after ACZ administration is not easy, and therefore CBV has not been studied with the ACZ test. However, a few investigations showed that cerebral oxygen consumption was not affected by ACZ administration (Posner and Plum, 1960; Vorstrup et al., 1984), which provides the basis for the ACZ test to evaluate cerebrovascular vasodilatory capacity. Those studies measured oxygen consumption from the arteriovenous differences in oxygen content and reported only a global difference in cerebral metabolic rate of oxygen (CMR o2) before and after ACZ administration. Presently, using positron emission tomography (PET) and15O-labeled tracers, regional CBF (rCBF), regional metabolic rate of oxygen (rCMR o2), and regional CBV (rCBV) can be measured in a few minutes. The bolus method used in the present study allows measurements to be repeated every 10 minute (Okazawa et al., 2001 a). This method is considered to be ideal for repeated measurement of parametric images before and after drug administration to determine the effect of the drug. Furthermore, this method is expected to reflect the real arterial-to-capillary response to ACZ because the recent technique distinguishes arterial-to-capillary blood volume, as a parameter of vascular distribution volume (V0), from the total blood volume (CBV), which includes both arteries and veins (Ohta et al., 1996; Okazawa et al., 2001 a).
The purpose of this study was to evaluate the effects of ACZ on CBF, CBV, V0, and oxygen metabolism in the brain using PET performed with healthy volunteers. Regional differences in response to ACZ were also investigated. The advantage of the new bolus method in PET is that it measures rCBF, rCMR o2, and blood volume directly in each condition without combining two different scans, which may be subject to the influence of time-dependent physiologic changes after ACZ administration. All parameters (rCBF, rCMR o2, rCBV, and V0) can be assessed individually in terms of absolute values.
MATERIALS AND METHODS
Subjects and PET procedures
Sixteen healthy volunteers (8 men, 8 women), age 21 to 52 years (mean, 30.0 ± 10.6 years), were recruited for the PET study. They underwent PET studies with H215O,15O2 and C15O before and after intravenous administration of ACZ. The study was approved by the Ethical Committee of the Shiga Medical Center. Written informed consent was obtained from each subject before the study.
All subjects underwent PET scans with a whole-body tomography scanner (ADVANCE, General Electric Medical System, Milwaukee, WI, U.S.A.), which permits simultaneous acquisition of 35 image slices in a two-or three-dimensional acquisition mode with inter-slice spacing of 4.25 mm (DeGrado et al., 1994). Performance tests showed the intrinsic resolution of the scanner to be 4.6 to 5.7 mm in the transaxial direction and 4.0 to 5.3 mm in the axial direction. A transmission scan was performed using68Ga/68Ga for attenuation correction in each subject before the tracer administration. The PET data were reconstructed using a Hanning filter with a 6.0-mm full width resolution at half maximum in the transaxial direction.
The subjects were positioned on the scanner bed with their heads immobilized using a head holder. A small cannula was placed in the left brachial artery for blood sampling. The PET scans for H215O,15O2, and C15O with a bolus technique were performed at the time indicated in Fig. 1. For CBF measurement, a 3-minute dynamic PET scan was started at the time of the bolus H215O injection (555 MBq) from the right antecubital vein with frame durations of 5 seconds × 12, 10 seconds × 6, and 20 seconds × 3. In the oxygen bolus inhalation method, the same procedure of dynamic PET acquisition was started at the time of bolus inhalation of15O2, with an activity of15O2 up to 1800 MBq.
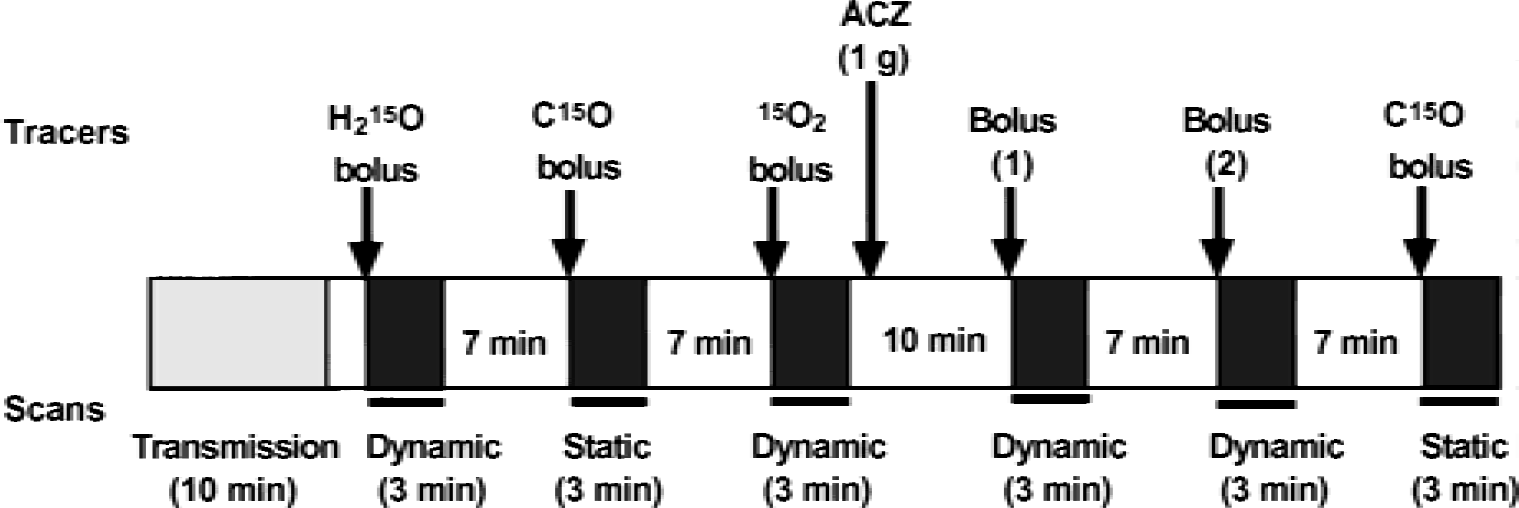
Protocol used in the present study. Each bolus scan takes 10 minutes, including the scan interval. Acetazolamide (ACZ) was injected into the venous line over a period of 1 minute, and scans after the ACZ challenge were started 10 minutes after ACZ administration. Bolus (1) and (2) indicate that the bolus H215O injection or15O2 inhalation method was performed in the opposite order for two groups of eight subjects each.
Radioactivity in the arterial blood was counted continuously using an automatic coincidental radioactive counter (Pico-Count; Bioscan Inc., Washington, DC, U.S.A.). Details of the device performance of the Pico-Count were described elsewhere (Votaw and Shulman, 1998). The arterial blood was drawn using a mini-pump (Bio-minipump AC-2120; Atto Co., Tokyo, Japan) with a constant rate of 10 mL/minute for the first 2 minutes, followed by manual sampling of 0.5 mL blood every 20 seconds during the rest of the scan time. Radioactivity counted by the Pico-Count was calibrated by that of the blood radioactivity obtained manually. Decay of the radioactivity from PET and blood data was corrected to the starting point of each scan, and dispersion for the external tube in the arterial curves was corrected with the double-exponential dispersion function described elsewhere (Okazawa et al., 2001 b; Vafaee et al., 1996).
Acetazolamide (1.0 g) in 10 mL saline was administered from the venous line for 1 minute at a constant flow rate. Two scans for both rCBF and rCMR o2 were performed before and after ACZ administration. The PET scans after ACZ administration were started 10 minutes after the injection. In eight subjects, CBF measurement (H215O scan) was performed first, followed by CMR o2 measurement (15O2 scan) after the ACZ administration, whereas the rest underwent the scans in the opposite order (Fig. 1). Each subject also inhaled C15O as a single dose of 1200 MBq to obtain the CBV images before and after the ACZ administration. The interval for each scan was 10 minutes, including scanning time. The C15O scan was started at least 40 seconds after the arrival of the peak count of C15O in the brain and continued for 3 minutes (Okazawa et al., 2001 a). Arterial blood was sampled twice during each C15O study. The radioactivity in the blood samples obtained was immediately measured with a scintillation counter to determine arterial blood activity. During the PET scanning with15O2 inhalation, the oxygen content in the arterial blood was measured to obtain CMR o2. The arterial tensions for carbon dioxide (Pa co2) and oxygen (Pa o2), and pH were also measured in the same blood samples. The blood pressure of each subject was measured continuously through the arterial line and displayed on a monitor during the PET study.
Calculation of parametric images
The CBF and CMR o2 (mL·minute−1·100g−1) images were calculated from the dynamic PET data and arterial blood curves by means of the three-weighted integral method. The calculation procedure for this method has been described in detail elsewhere (Ohta et al., 1992, 1996; Okazawa and Vafaee, 2001). The CBF images were also calculated using the autoradiographic method with the modification to correct for the influence of intravascular radioactivity (Okazawa and Vafaee, 2001). The time delay of arterial input was corrected automatically in the program, and a time constant of τ = 4 seconds was used for internal dispersion correction (Ohta et al., 1996; Meyer, 1989; Iida et al., 1986). A distribution volume of 0.9 was used in the calculation of rCBF (Herscovitch and Raichle, 1985). Oxygen content in the arterial blood measured in each15O2 scan was used to convert the influx rate constant K1 (= CBF × OEF [oxygen extraction fraction]) into CMR o2 (i.e., CMR o2 = K1 × O2 content).
In the calculation of rCBV (mL/100 g) from the data of the C15O scan, a cerebral/large-vessel hematocrit ratio of 0.85 was used (Phelps et al., 1979; Okazawa et al., 1996). The V0 images (mL/100 g), which were calculated simultaneously in the three-weighted integral method, were also obtained both before and after ACZ administration.
Coregistration of PET and magnetic resonance imaging
Subjects underwent a high-resolution magnetic resonance imaging (MRI) scan (124 slices, 1.3 mm thick) obtained with a Signa Holizon LX scanner (1.5T, General Electric Medical System, Milwaukee, WI, U.S.A.). Coregistration of individual PET and MRI images was performed using an automatic procedure (Woods et al., 1993) that uses the CBF image in the baseline condition. The MRI image of each subject was transformed into Talairach space automatically (Collins et al., 1994; Talairach and Tournoux, 1988). The baseline CBF image coregistered to MRI was then transformed into Talairach space using the individual spatial transformation parameter, which combined the two parameters from coregistration of PET to MRI and transformation of MRI into the Talairach space. All parametric images including CBV and V0 were also transformed into Talairach space in accordance with the same individual parameter (Okazawa et al., 2001 a).
Statistical data analysis
Global values for each parametric image in 16 subjects were determined using a template generated from the averaged MRI in Talairach space. The voxel values obtained after image transformation were averaged among all voxels inside of the template (Okazawa et al., 2001 a). The same template was applied to all parametric images of all subjects. Global values thus obtained from each parametric image were compared between the two conditions before and after the ACZ administration. Analysis of variance was used for the comparison.
Regional values were obtained using a template of multiple regions of interest drawn on several brain structures in Talairach space. The same regions of interest were applied to all parametric images in each subject (Okazawa et al., 2001 a). Regional values for each parametric image were compared between different structures and different conditions by analysis of variance. A P value of less than 0.05 was considered statistically significant.
RESULTS
Table 1 shows the average values of the physiologic variables measured in 16 subjects during scanning in the conditions of baseline and after ACZ administration. The Pa co2 value was slightly reduced and Pa o2 increased significantly, but no other parameters were changed by ACZ administration. Fig. 2 shows average parametric images obtained from 16 healthy volunteers in the two conditions and the corresponding slice level of MRI. Individual PET and MRI images were transformed into Talairach space and then averaged. The CBF, V0, and OEF values showed remarkable changes between the two conditions of baseline and ACZ administration. However, CMR o2 and CBV did not show marked differences before and after ACZ administration.
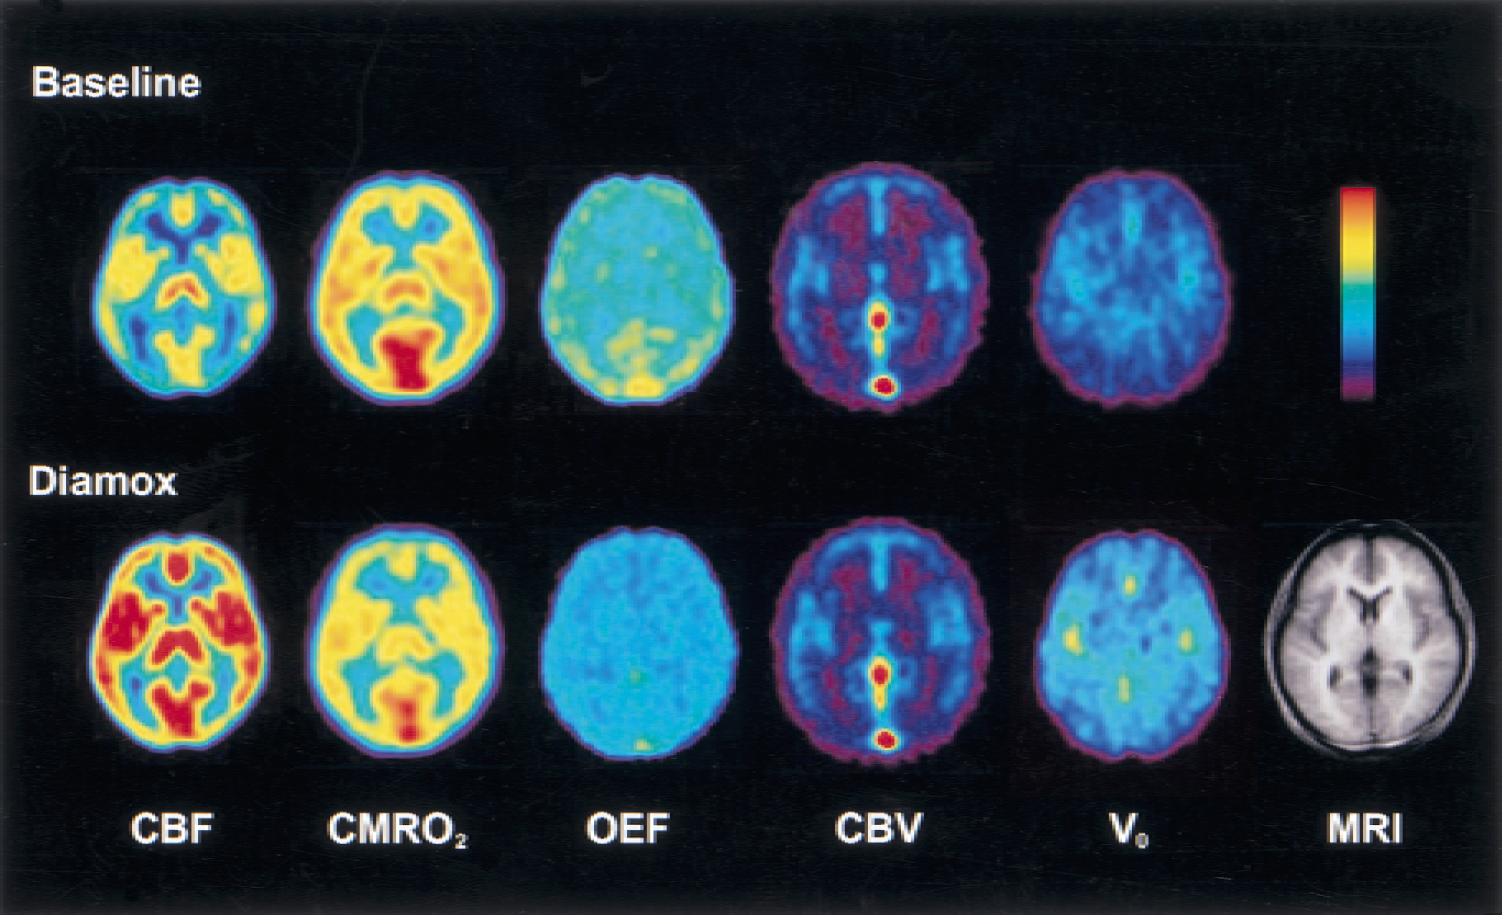
Average images obtained from 16 volunteers. The top row shows average images for each parameter in baseline condition, and the bottom row shows the same parametric images after acetazolamide administration. The same color scale is used for the same parametric image. The corresponding slice level of magnetic resonance imaging is presented in the bottom row. Individual parametric images were transformed into Talairach space and averaged among the 16 subjects. OEF images were calculated from individual cerebral blood flow and metabolic rate of oxygen images and arterial oxygen content for each subject.
Physiological data in 16 healthy volunteers measured during baseline conditions and after ACZ administration
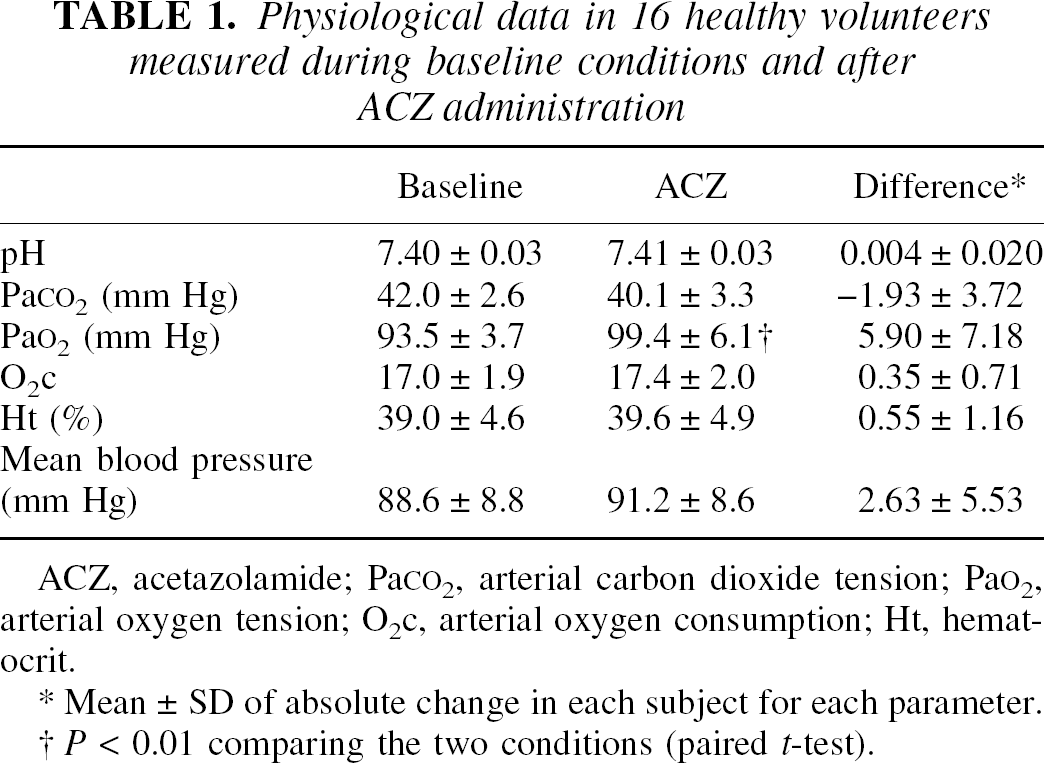
ACZ, acetazolamide; PaCO2, arterial carbon dioxide tension; PaO2, arterial oxygen tension; O2c, arterial oxygen consumption; Ht, hematocrit.
Mean ± SD of absolute change in each subject for each parameter.
P < 0.01 comparing the two conditions (paired t-test).
Global and regional values and percent changes of each parametric image in the two conditions are presented in Tables 2 and 3. Because CBF images obtained using the different calculation methods (three-weighted integral and autoradiographic methods) did not show differences in either regional or global values, absolute values for CBF from the three-weighted integral method were compared. Global CBF, CBV, and V0 increased significantly after ACZ administration, whereas global CMR o2 showed a slight nonsignificant decrease; thus, global OEF was reduced significantly as a result of the increase in CBF. The percent increases of global CBF, CBV, and V0 after ACZ administration were 33.5, 10.8 and 44.1%, respectively (Table 3). Therefore, the percent increase in V0 was greater than that in CBV.
Regional values of each parameter in conditions of baseline and after acetazolamide administration
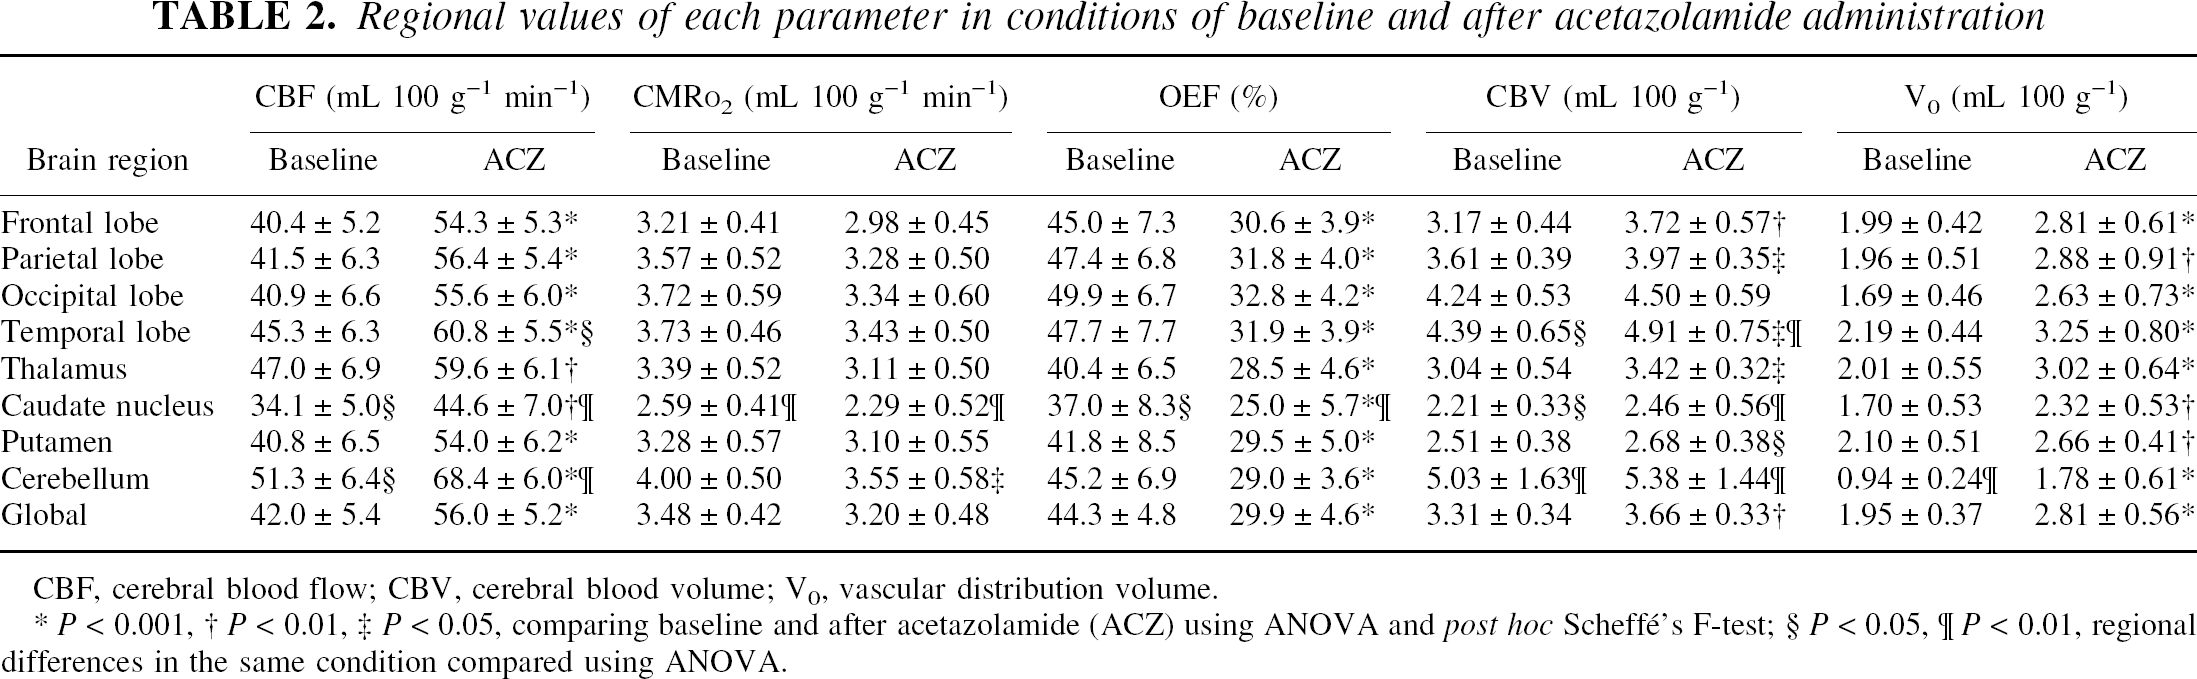
CBF, cerebral blood flow; CBV, cerebral blood volume; Vo, vascular distribution volume.
P < 0.001
P < 0.01
P < 0.05, comparing baseline and after acetazolamide (ACZ) using ANOVA and post hoc Scheffé's F-test
P < 0.05
P < 0.01, regional differences in the same condition compared using ANOVA.
Regional changes in absolute values and % change in each parameter
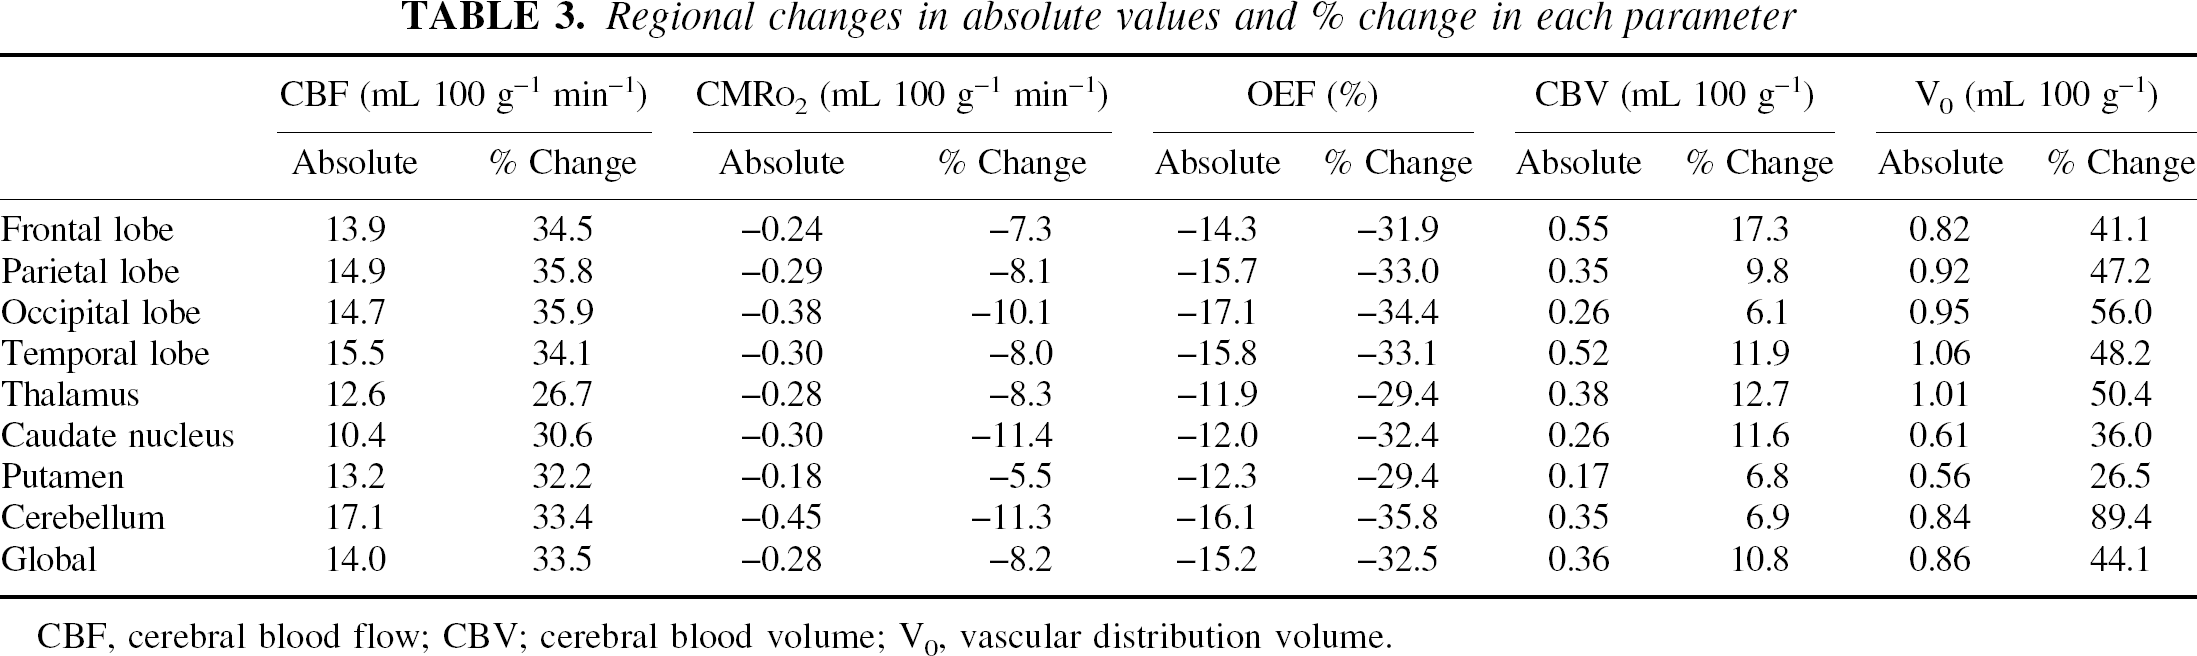
CBF, cerebral blood flow; CBV; cerebral blood volume; Vo, vascular distribution volume.
The time-dependent changes in each parametric image after ACZ administration are presented in Figure 3. The increase in global CBF and V0 was greater at 10 minutes than at 20 minutes after ACZ administration. Both values were increased significantly compared with the baseline condition, though the differences between 10 and 20 minute were not significant. However, CMR o2 showed no change even at 10 minutes after ACZ administration, though a greater tendency to decrease was seen at 10 minutes after ACZ administration than at 20 minutes. The OEF value showed a significant decrease after ACZ injection as a result of the significant increase in CBF and lack of change in CMR o2. The CBV value showed a significant increase at 30 minutes after ACZ administration.
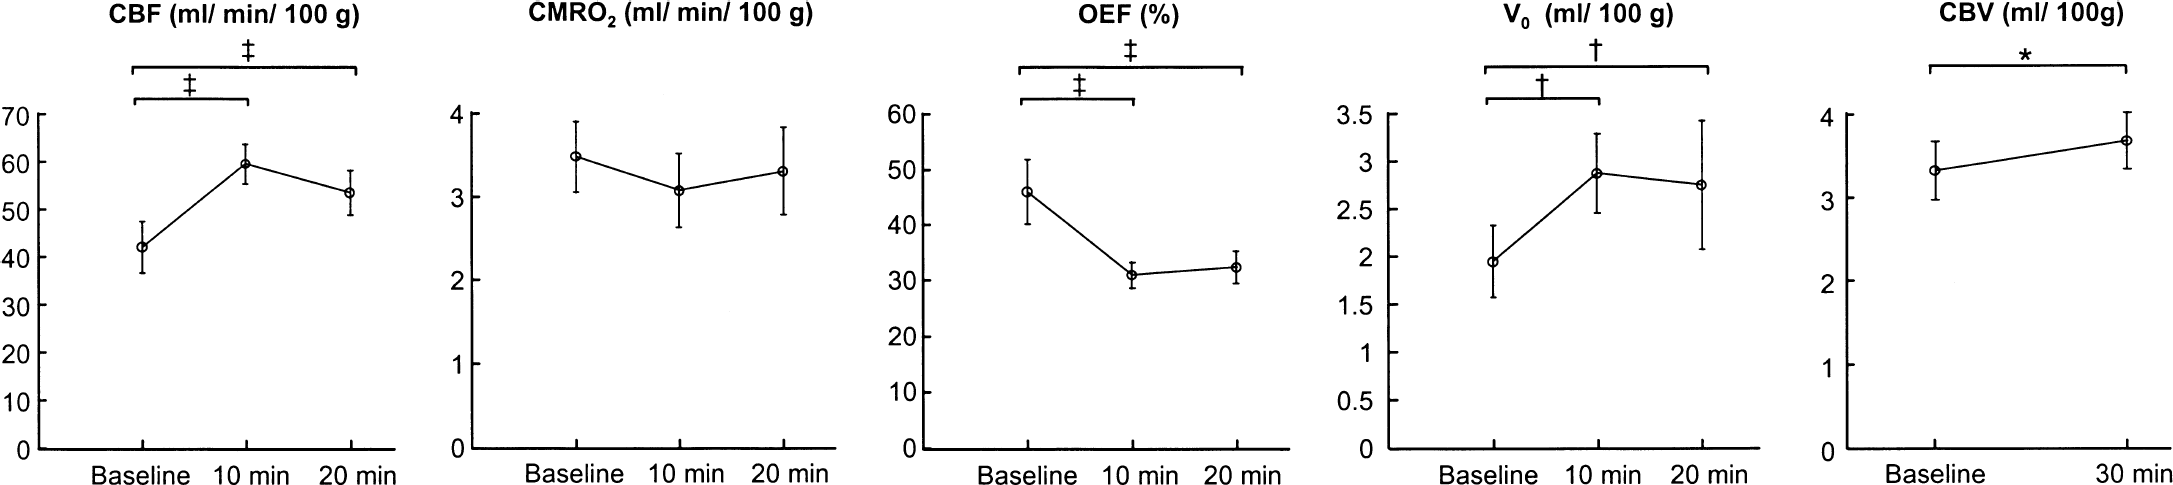
Time-dependent changes in each parametric image before and after acetazolamide (ACZ) administration. Values were obtained from global regions of interest. Changes were greater at 10 minutes after ACZ than at 20 minutes, though the difference between 10 and 20 minutes was not significant. Metabolic rate of oxygen did not show differences in absolute values under the three conditions. Cerebral blood volume was measured only at baseline and 30 minutes after ACZ injection. * P < 0.01, †P < 0.005, ‡P < 0.001; analysis of variance with post hoc Sheffé's F-test.
A tendency for a negative linear correlation between the body weight of subjects and percent change in global CBF was observed, though the correlation was not significant (y = −0.65 × + 75.4, r = 0.45, P > 0.05). Body weight was significantly greater in men than in women (P < 0.001; two-tailed t-test). However, the differences in percent change of parametric values between men and women were not significant.
DISCUSSION
In the present study with 16 normal volunteers, ACZ induced a greater than 30% increase in CBF compared with baseline flow but caused no significant change in CMR o2, though a slight tendency for ACZ to reduce CMR o2 was observed. The effect of ACZ on blood flow and metabolism in the brain was previously investigated, and an increase in global CBF and lack of change in global CMR o2 were shown based on the data of arteriovenous oxygen differences under normal brain circulation (Posner and Plum, 1960; Vorstrup et al., 1984), though Laux et al. (1978) reported a significant decrease in CMR o2 after ACZ administration. The results of our study were consistent with those of previous reports because we observed a tendency of a decrease in CMR o2, though the change was not significant. Based on these previous reports, the ACZ test has been performed to evaluate vasodilatory capacity in the brain to determine whether neurosurgical treatment was indicated or to assess the effects of treatment for patients with major cerebral arterial occlusive disease (Vorstrup, 1986, 1988; Yonas and Pindzola, 1994). Recently, the ACZ test has been combined with measurement of rCBF using SPECT or xenon-enhanced computed tomography (Xe-CT) studies to evaluate vasodilatory capacity in cerebrovascular diseases quantitatively or qualitatively (Vorstrup, 1986, 1988; Yonas and Pindzola, 1994; Derdeyn et al., 1999). However, it has not been proved in these clinical imaging studies, including PET studies, that ACZ really induces vasodilatation of cerebral arteries, and that cerebral blood volume changes in accordance with the degree of CBF increase. Moreover, the changes in CMR o2 after ACZ administration have not been measured in human PET studies. One of the purposes of the present study was to determine the changes in cerebral perfusion and oxygen metabolism before and after ACZ injection in the normal brain, and our findings show that ACZ induced an increase in rCBF without significantly changing CMR o2.
Another purpose of this study was to investigate the arterial vascular response to ACZ by measuring V0 separately from the whole blood volume (CBV), because measurement of V0 was expected to clarify the mechanism of CBF increase in the normal brain after ACZ challenge. Changes in arterial blood volume after ACZ administration, which are thought to occur simultaneously with changes in CBF, can be evaluated with the new bolus method of Ohta et al. (1996) because the method can calculate arterial-to-capillary blood volume images (V0) along with the CBF calculation from the H215O scans.
In the original two-compartment model addressed by Ohta et al. (1996), V0 was named apparent vascular distribution volume and defined as an equation of V0 = Va + Vc (E0 F/P) + Vv (1−E0), where Va, Vc, and Vv are arterial, capillary, and venous blood volume; F is blood flow; E0 is extraction fraction of tracer; and P is permeability of blood brain barrier. When E0 is sufficiently high, V0 reflects arterial-to-capillary volume, though there would still be a possibility of including venous fraction of blood volume. Whether the V0 image possibly represents arterial-to-capillary blood volume or not was controversial (Fujita et al., 1993 a). The V0 images were compared with computed tomography angiography and revealed a good correspondence to the cerebral arteries (Fujita et al., 1997). A clear difference between V0 and CBV images is also shown in Figure 2, in which V0 images showed lack of major veins. Subtraction of V0 from CBV depicted major veins and sinuses (Okazawa et al., 2001 a). Furthermore, the increases in V0 values after neural activation proved that the V0 images obtained from H215O-PET scans can depict the changes in arterial-to-capillary blood volume (Fujita et al., 1997; Okazawa and Vafaee, 2001). The mean global V0 value obtained in the present study was 1.95 mL/ 100g, which was 58% of mean global CBV. Fujita et al. (1993 b) reported that V0 values obtained from the two bolus methods using15O-water and15O2 were 57% and 61% of CBV obtained from the C15O inhalation method, respectively. These ratios are consistent with the results of our previous study (Okazawa et al., 2001 a) and the current study. Arterial-to-capillary blood volume is estimated approximately half of total CBV in the cerebral cortex (Hudetz, 1997; van Zijl et al., 1998), and the results of our studies and that of Fujita et al. (1993 b) consistent with this estimation, though V0 may have overestimated by a few percent because of including a small fraction of venous volume. The global V0 values in the current study were slightly higher than global Va values, defined as arterial blood volume in the kinetic modeling, reported by Law et al. (2000). The region of interest determined for global CBF and Va in their study, including extracerebral space, was greater than the global region of interest used in the current study. The difference in size of regions of interest may provide smaller global Va in their study than V0 in our studies. Regardless of the method chosen, V0 or Va is considered to be a more reliable hemodynamic parameter reflecting changes in cerebral arterial blood volume than CBV.
The parallel increases in rCBF and V0 found in the current study supported the assumption that local carbonic acidosis under inhibition of carbonic anhydrase causes dilatation of cerebral arteries, resulting in an increase in rCBF without a change in systemic blood pressure. Bickler et al. (1988) reported the difference in pH and P co2 in the brain tissue compared with peripheral Pa co2, indicating that carbonic acidosis induced an increase in tissue or capillary Pa co2 after ACZ administration, which caused the increase in rCBF. Our results are consistent with their report because no change in arterial Pa co2 was observed after ACZ administration, supporting the conclusion that the increase in CBF was not due to a systemic increase in carbon dioxide tension, as reported by Laux et al. (1978). The lack of changes in systemic physiologic variables including Pa co2, pH, blood pressure and arterial O2 content, were also consistent with other reports (Vorstrup et al., 1986; Piepgras et al., 1990; Inao et al., 1998).
Regional parametric values were determined in eight brain structures, and differences were examined by comparing the various structures and also by comparing the two conditions. The caudate nucleus showed significantly smaller regional values for all parametric images except for V0, even in the baseline condition. Because the caudate nucleus is a small structure, the partial volume effect may be one of the reasons for the smaller parametric values seen in both conditions. The cerebellum showed significantly greater regional values of rCBF, rCBV, and smaller values of V0.
The temporal lobe showed greater values of rCBV both at baseline and after ACZ, whereas other major cortices showed no significant differences. The temporal lobe and cerebellum are adjacent to large vessels, and the radioactivity in those vessels might affect those parametric values (Okazawa and Vafaee, 2001). However, the smaller values of cerebellar V0 cannot be explained by such vascular radioactivity. The percent change in V0 in the cerebellum was significantly greater than that in the other brain structures, though the increase in absolute value was not different; smaller baseline V0 seemed to cause this large percent change. In the putamen, the regional values of CBV and V0 were close, especially after ACZ challenge. The increases in absolute rCBV were smaller than those of V0, which may not normally occur physiologically. Differences in scanning time (10 or 20 minutes, and 30 minutes) after ACZ might be one of the possible reasons for the close values and paradoxical increase in blood volume after ACZ administration.
The increased rate in blood volume may be reduced as a function of time after ACZ injection. Overestimation of arterial-to-capillary blood volume due to faster flow velocity and reduced extraction of H215O after ACZ might be another explanation, because V0 may include a part of venous volume in condition of reduced extraction as discussed above. In any case, the parallel increases in rCBF and V0 in all regions is consistent with the physiologic mechanism of the ACZ effect, and the hemodynamic parameter of vascular distribution volume (V0) is considered important for the assessment of vasodilatory capacity in the brain, though the degree of V0 response may show some regional differences.
Measurement of rCBF and rCMR o2 were performed at 10 and 20 minutes after administration of ACZ. The same number of subjects was scanned for each condition to observe changes in each parameter as a function of time. There was a tendency for a greater change at 10 minutes after ACZ injection; however, the differences between each parameter at 10 and 20 minutes after ACZ administration were not significant. Both CBF and V0 increased significantly at 10 and 20 minutes after ACZ injection compared with the baseline condition. Kuwabara et al. (1995) reported with15O-water PET that the increased rate of rCBF was not different at 5 and 20 minutes after ACZ administration in the nonocclusive side of hemispheres in patients with unilateral cerebrovascular disease. Hayashida et al. (1996) conducted a similar experiment by measuring rCBF at 10, 20, and 30 minutes after ACZ administration, and reported that percent change of rCBF was greater at 10 minutes after ACZ challenge than at 20 and 30 minutes. The current study showed similar results with these reports, though the difference in parametric values between 10 and 20 minutes after ACZ injection was not significant. The CBV value, measured at rest and 30 minutes after ACZ injection, increased significantly after the injection, indicating that the effect of ACZ continued even after 30 minutes, though the effect may have been reduced. The time dependency of the ACZ effect on blood flow velocity (FV) was also investigated using transcranial Doppler sonography, and it was reported that the increase in FV reached a plateau at 5 minutes after ACZ injection and lasted for 30 minutes (Piepgras et al., 1990). That study showed no correlation between FV and rCBF at rest; however, the increase in FV (ΔFV) was well correlated with the increase in CBF (ΔCBF). Our results and those in the reports cited here indicate that the effects of ACZ on the cerebral circulation continue for at least 20 to 30 minutes in the normal brain, though the effect in the occlusive side of the brain may be time dependent in patients with occlusive diseases of major cerebral arteries (Kuwabara et al., 1995; Inao et al., 1998; Démolis et al., 2000).
The same amount of ACZ (1 g) was injected in all subjects irrespective of body weight because the dosage is commonly used in clinical studies (Vorstrup, 1988). A tendency of a negative linear correlation between the body weight of subjects and the percent change in global CBF was observed, though the correlation was not significant. Karnik et al. (1996) reported sex-related differences in ACZ-induced ΔFV with the administration of 14.3 mg ACZ/kg body weight. Because body weight was significantly greater in men than in women in our subjects, a negative correlation between ΔCBF and body weight should have been observed if a sex-related difference in vasomotor reactivity to ACZ existed. However, the difference in ΔCBF between men and women was not significant in this study. If an inverse correlation of ACZ effect on CBF with body weight is observed, there is a possibility of lacking in maximal ACZ effect on vasodilatation with the selected dose. The dose for maximal vasodilatation with ACZ has been controversial and it has not been defined, especially in human studies. Demolis et al. (2000) reported that a dose of ACZ greater than 21 mg/kg did not induce greater increase in ΔCBF in rats. Karnik et al. (1996) determined the dosage (14.3 mg/ kg = 1 g/ 70 kg) according to a report by Maren (1977), who found full inhibition of carbonic anhydrase after intravenous administration of ACZ at a dose greater than 10 mg/kg in human. All subjects in the current study were administrated a greater dose than 10 mg/kg ACZ, which is expected to fully affect on vasodilatation. Although there is still a possibility that ACZ may not have induced maximal effect on all subjects, the increases in CBF, V0, and CBV were significant, indicating that 1 g ACZ seems to be an appropriate dose for evaluating vascular reserve. However, in cases with extraordinarily overweighed subjects, the ACZ dose may have to be modified.
The bolus method employed in the present study has been assessed and compared with the conventional steady-state method, and the results showed an excellent correlation between the parametric images obtained using the two methods (Okazawa et al., 2001 a). The series of three bolus techniques, including C15O scanning, takes only 30 minutes for each pre-ACZ or post-ACZ challenge, and can provide many hemodynamic parameters (e.g., CBF, CBV, V0, and CMR o2). The method is one of the promising alternatives for evaluating hemodynamics with cerebrovascular diseases. The finding in the current study that the ACZ-induced increase in V0 was significant and parallel to the changes in rCBF indicates that the V0 image reflects arterial-to-capillary blood volume, which can be a more reliable parameter to evaluate vasodilatory capacity than CBV. It has been proved that ACZ induces arterial-to-capillary vasodilatation in the normal brain; however, various reactions to ACZ challenge in patients with vascular insufficiency are expected (Inao et al., 1998). The diffuse effect of ACZ on vasodilatation may have resulted in the lack of change or paradoxical reduction of rCBF because of the ‘steal phenomenon.’ The method used to measure arterial-to-capillary blood volume performed in the present study would be useful for evaluating the vascular response to ACZ directly. Whether the absolute values of rCBF reflect the vasodilatory reaction could be revealed by further investigations of such patients.
CONCLUSION
In the current study, quantitative measurement of V0 proved that a vasodilatory reaction was induced in arteries by ACZ, which caused parallel increases in rCBF and V0 without affecting rCMR o2. This finding supports the idea that ACZ is a useful cerebral vasodilatory stimulus for the evaluation of cerebrovascular reserve capacity. Measurement of rCBF and V0 under baseline conditions and after ACZ challenge can be used to properly evaluate vascular dilatory capacity and its relation to rCBF response. Further investigations of patients with cerebrovascular disease would clarify whether the evaluation of rCBF response to ACZ is valid for quantitative assessment of maximum cerebral autoregulatory vasodilatation.
Footnotes
Acknowledgments:
The authors thank the staff of PET Unit in the Research Institute, Mr. Matsugi, and Dr. Shiino in the Department of Neurosurgery, Shiga University of Medical Science for technical and clinical assistance.