
Abstract
A noninvasive method of assessing cerebral arterial compliance (AC) is introduced in which arterial spin labeling (ASL) is used to measure changes in arterial blood volume (aBV) occurring within the cardiac cycle. Short inversion time pulsed ASL (PASL) was performed in healthy volunteers with inversion times ranging from 250 to 850 ms. A model of the arterial input function was used to obtain the cerebral aBV. Results indicate that aBV depends on the cardiac phase of the arteries in the imaging volume. Cerebral AC, estimated from aBV and brachial blood pressure measured noninvasively in systole and diastole, was assessed in the flow territories of the basal cerebral arteries originating from the circle of Willis: right and left middle cerebral arteries (RMCA and LMCA), right and left posterior cerebral arteries (RPCA and LPCA), and the anterior cerebral artery (ACA). Group average AC values calculated for the RMCA, LMCA, ACA, RPCA, and LPCA were 0.56%±0.2%, 0.50%±0.3%, 0.4%±0.2%, 1.1%±0.5%, and 1.1%±0.3% per mm Hg, respectively. The current experiment has shown the feasibility of measuring AC of cerebral arteries with short inversion time PASL.
Introduction
The classic definition of arterial compliance (AC) by Spencer and Denison 1 is a change in arterial blood volume (aBV) resulting from a given change in arterial blood pressure (BP). The compliance of arteries ensures that they are able to accommodate the pulsatile blood flow originating from the heart and average out these pulsations into continuous blood flow in the capillary bed of human tissue. 2 When AC decreases, that is arteries become stiffer, they lose the ability to smooth the pulsatile blood flow and as a consequence downstream arterioles and capillaries are exposed to higher BP fluctuations. 3 This increase in BP in the distal arterial bed in turn causes deterioration of vessel walls, which in the brain manifests as cerebral small-vessel disease (SVD). 3 The prevalence of SVD increases with aging and has also been linked to cognitive decline in patients with dementia and Alzheimer's disease. 4 Moreover, patients with diabetes mellitus 3 and hypertension 5 also have an increased risk at developing SVD. Although the mechanisms underlying development of cerebral SVD are still poorly understood, it is evident that arterial stiffening is highly linked to this pathologic assessment. 6 Measuring local AC in the brain may therefore give valuable insight in the development and treatment of cerebral SVD.
Compliance of cerebral arteries has long been ignored in cerebrovascular research because of the difficulty of obtaining
Currently, ultrasound echotracking of arterial walls to obtain maximum (systolic) and minimum (diastolic) diameters with simultaneous measurement of local pulse pressure (the difference between systolic and diastolic BP) is one of the standard methods to assess local AC,13, 14 whether it be in peripheral (e.g., radial 15 ) or more central (e.g., carotid 16 ) arteries. However, echotracking of cerebral arteries is difficult because the skull reflects most of the ultrasound waves. 17 One ultrasound method that is currently used to assess cerebral AC is transcranial Doppler ultrasound (TCD),18, 19, 20 which detects blood flow velocities from accessible cerebral arteries (mainly the middle cerebral artery (MCA)). One drawback of TCD is that it cannot measure arterial geometry, such as volume or diameter, directly and therefore either a mathematical model is used to transform blood flow into volume, which assumes that there is no change in arterial diameter,18, 19 or arterial stiffness is assessed with the augmentation index, a parameter based on the wave form of the blood flow velocity. 20 Another drawback of TCD, in particular for the MCA, is that thickness of the temporal bone renders it impossible to measure MCA flow velocities in ∼20% of the population. 21
We propose a method that enables measurement of cerebral aBV based on short inversion time (TI) pulsed arterial spin labeling (PASL). 22 Pulsed arterial spin labeling is a method in which arterial blood is magnetically labeled before it reaches the volume of interest and is usually applied to measure tissue perfusion, which is the delivery of blood to the capillary bed of the brain. Images containing perfusion-weighted signal are calculated by subtracting a tag image from a control image. The latter acquired without any labeling of arterial blood, but before acquisition of the tag image blood is labeled when it flows through the major brain-feeding arteries (i.e., internal carotid and vertebral arteries) and image acquisition takes place after leaving time (>1 second) for the labeled blood to pass into the cerebral capillary bed. However, before arriving at the capillary bed the labeled blood first has to pass through the macrovasculature of the brain. Imaging at short TIs (<1 second) therefore results in ASL images in which the major arteries, such as the MCAs, posterior and anterior cerebral arteries (PCAs and ACA), are clearly visible.
The aim of the study is to show the feasibility of noninvasive measurement of AC by exploiting the signal arising from the cerebral arteries at short TI PASL.
Modeling Arterial Blood Volume
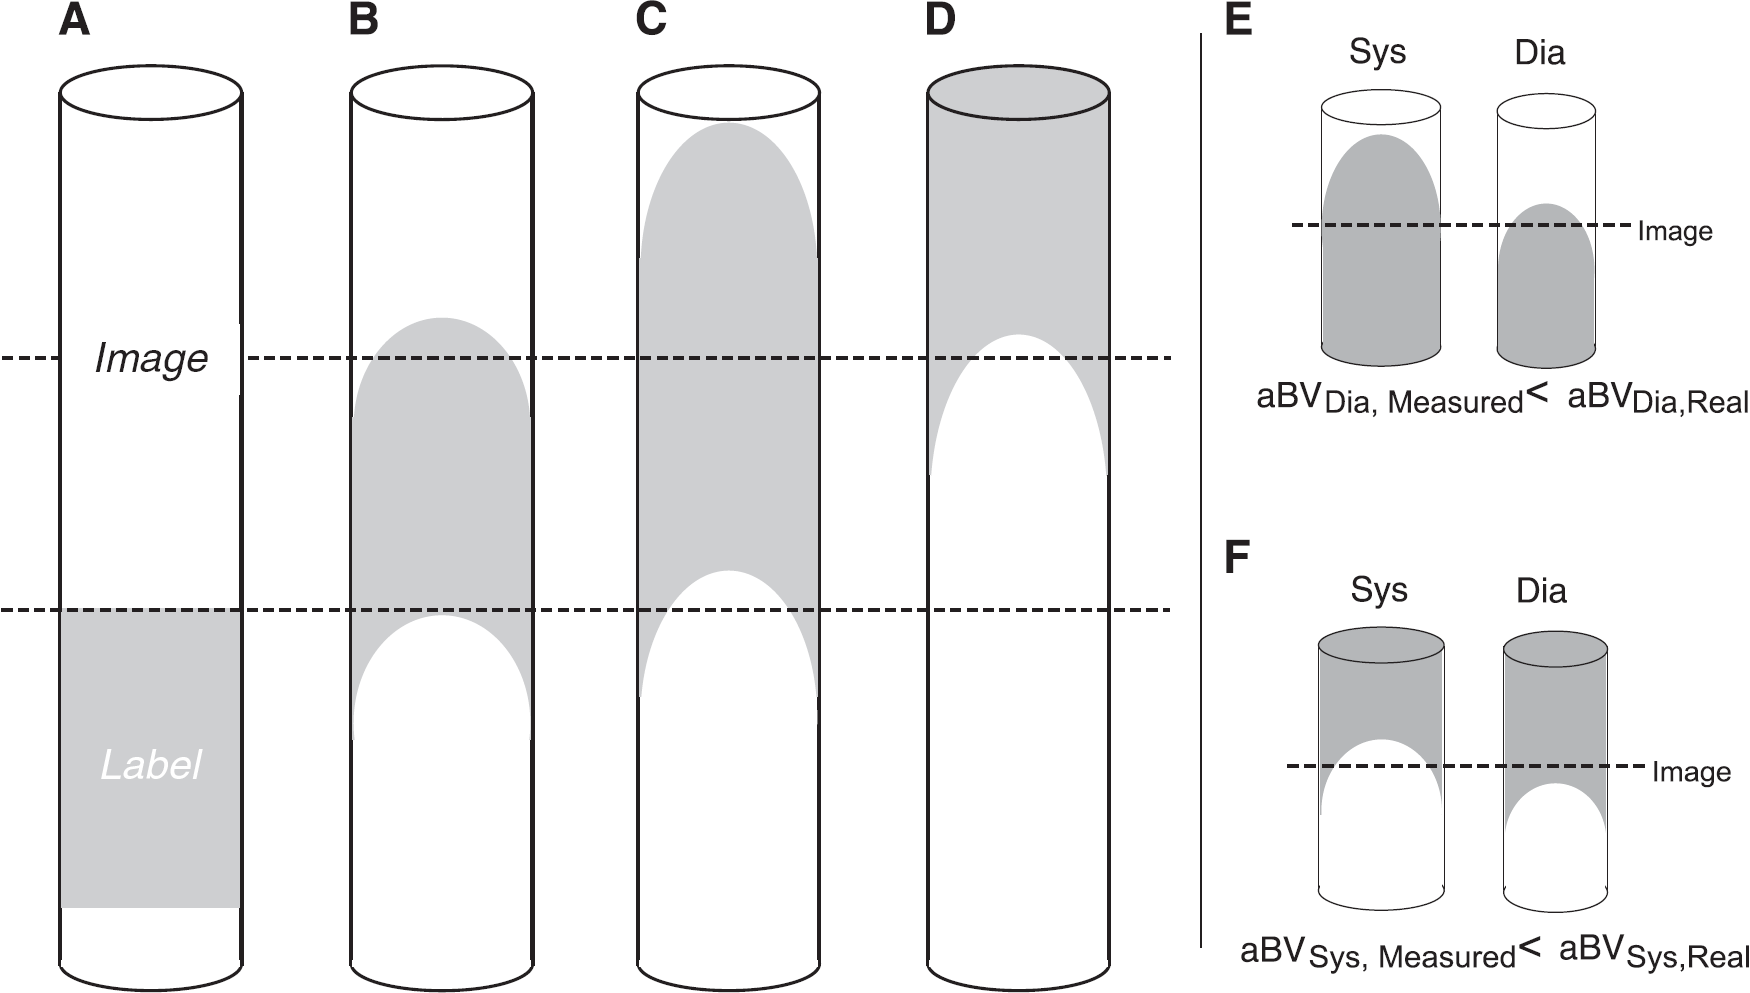
In measuring aBV with PASL it is important to account for changes in the kinetics of the labeled bolus because of the cardiac cycle, such as differences in bolus arrival time.23, 24 In addition, as the label progresses through the vasculature dispersion takes place, which means that the leading and trailing edges of the bolus are not well defined (Figures 1A and 1D). If a single TI is used to assess blood volume, the cardiac phase—related changes in label kinetics may cause underestimation of aBV, as illustrated by Figures 1E and 1F, which in turn will confound calculation of AC. To account for changes in arrival time and dispersion, we therefore model the aBV based on multi-TI PASL data.
(
Here we model the arterial signal by extending the macrovascular compartment described previously by Chappell
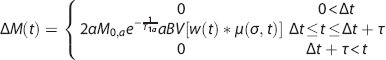
With ΔM(
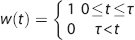
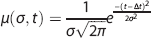
Which is convolved with a Gaussian kernel centered on Δ
It is important to note that, although PASL is most commonly performed to assess tissue perfusion, here the interest lies solely in measuring the PASL signal of the macrovasculature. For this purpose, only short TI PASL with TIs <1 second are used and regions of interest (ROIs) are drawn that only contain voxels with a relatively large arterial compartment (see Materials and Methods section for more details). The short TIs ensure that the signal coming from the brain parenchyma is small in comparison to the signal coming from large arteries. Even though arrival times of the label into the microvasculature (Δ
To confirm the minimal interference of signal coming from the microvasculature at short TIs, the signal from a voxel containing both macrovascular and microvascular compartments was simulated up to 2.5 seconds after PASL labeling by adding a tissue signal model described previously
22
to Equation 1. The aBV was set to range between 0.1%v and 10%v, the tissue perfusion was set at 60 mL/100 g/min and Δ
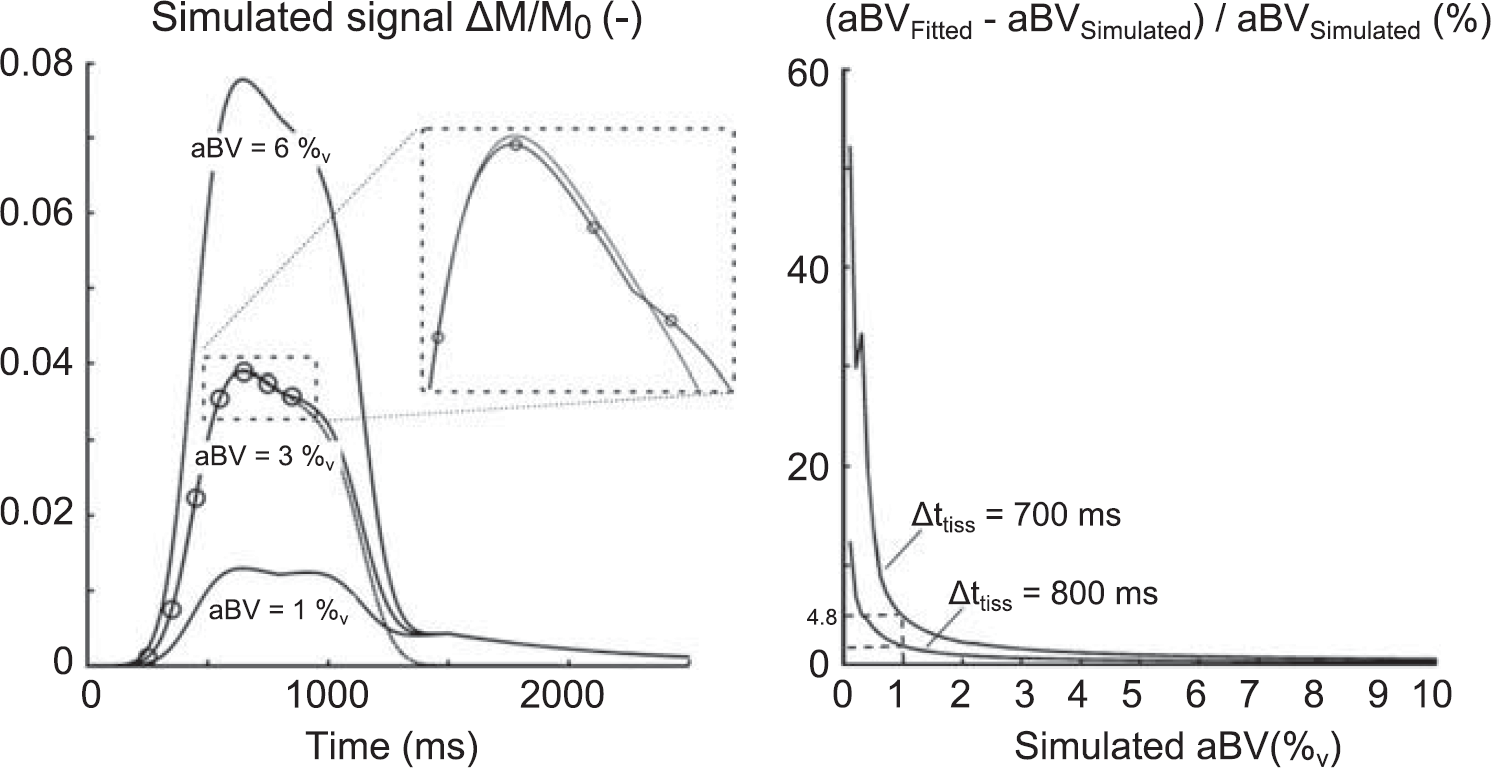
Left: Simulated ΔM/M0 signal from a voxel containing a macrovascular and microvascular compartment. The microvascular compartment was simulated with previously described methods,
22
the cerebral blood flow was set to be 60 mL/100 g/min and the tissue arrival time (Δ
Materials and methods
Imaging data were acquired on a 3 T whole-body MRI system (GE Excite HDx, Milwaukee, WI, USA) using an eight-channel receive-only head coil. Informed consent was obtained from all volunteers under ethical approval from the Cardiff University School of Psychology Ethics Committee and all experiments were performed in accordance with the guidelines stated in the Cardiff University Research Framework (version 4.0, 2010).
Image Acquisition
Multiinversion time PICORE 29 PASL acquisitions were performed on five healthy volunteers (age 25.4±1.5 years). Seven TIs were acquired in random order (250 to 850 ms, spacing 100 ms, separate scan series). Note that all TIs <1 second, as explained in the Introduction section. The label was applied 10 mm below the most proximal slice and had a width of 200 mm. A Quantitative Imaging of Perfusion with a Single Subtraction (QUIPSS) II 25 cut-off of the label was applied at 700 ms for TIs >700 ms. Images were acquired with a spiral gradient echo sequence (echo time (TE)=2.7 ms, repetition time (TR)=1400 ms, 80 tag-control pairs per TI, 14 slices, slice gap 1 mm, slice delay 29 ms, voxel size 3 × 3 × 7 mm3). A fully relaxed (infinite TR) calibration image was obtained with the same acquisition parameters but without labeling, to obtain the equilibrium magnetisation of CSF (M0,CSF).
Blood Pressures
The cardiac cycle was monitored by finger plethysmography. Brachial artery BP was measured noninvasively with an MRI-compatible BP cuff once for each ASL scan (OMRON, Tokyo, Japan). Per participant, the seven BP measurements were used to calculate average systolic and diastolic BP (BPsys and BPdia).
Image Analysis
Pulsed arterial spin labeling time series were motion corrected using
Where
The number of tag and control images in each cardiac phase was noted to analyze whether the synchronization led to any bias for a particular cardiac phase or TI.
Calculation of Parameter Maps
Equation 1 was used to estimate aBV, Δ
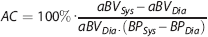
Note that here AC is normalized for the aBV in diastole and is therefore calculated as percentage change in aBV per mm Hg (%/mm Hg), which can also be referred to as arterial distensibility. 32
Regions of Interest
For each participant, an average ΔM image was obtained for the full time series of TI=750 ms (i.e., the average of 80 tag-control difference images). Regions of interest were determined based on data from TI=750 ms because on average this was the TI with the maximum intensity in the raw difference images (data not shown). A mask of the TI=750 ms ΔM image was created such that each slice only contained the 5% of voxels with the highest intensities (the 95th percentile intensity threshold was determined for each slice separately). Broad ROIs were manually drawn around the vascular territories within each slice. For instance, in the slice just above the circle of Willis these regions were drawn to encompass the flow territories of the right middle, left middle, right posterior, left posterior, and anterior cerebral arteries (RMCA, LMCA, RPCA, LPCA, and ACA). The ROIs of the flow territories were then calculated by multiplying each of the broad masks with the thresholded ΔM image. Note that there is only one ROI for the ACA, because the voxel size used for image acquisition did not allow for separation of the left and right ACA.
Statistical Analysis
A three-way repeated measures analysis of variance (RM-ANOVA) was used to assess the number of tag and controls per cardiac phase after retrospective synchronization of image acquisition with the cardiac cycle. TI, ROI, and cardiac phase (systole versus diastole) were used as independent variables. To investigate differences in aBV, Δ
Results
All relevant subject information is summarized in Table 1. The average pulse pressure (BPSys–BPDia) was 52.7±9.5 mm Hg with an average heart rate of 65.4±10.0 beats per minute.
Summary of participant data (three M and two F)

BP, blood pressure; bpm, beats per minute (averaged over seven acquisitions); dia, diastole; F, females; M, males; PP, pulse pressure; sys, systole.
Mean and s.d. are shown.
Retrospective resynchronization of image acquisition with the cardiac cycle did not lead to any bias toward a particular TI (RM-ANOVA, F(6,24)=0.804,
Fitting the model on a voxel-by-voxel basis leads to individual parameter maps for aBV, Δ
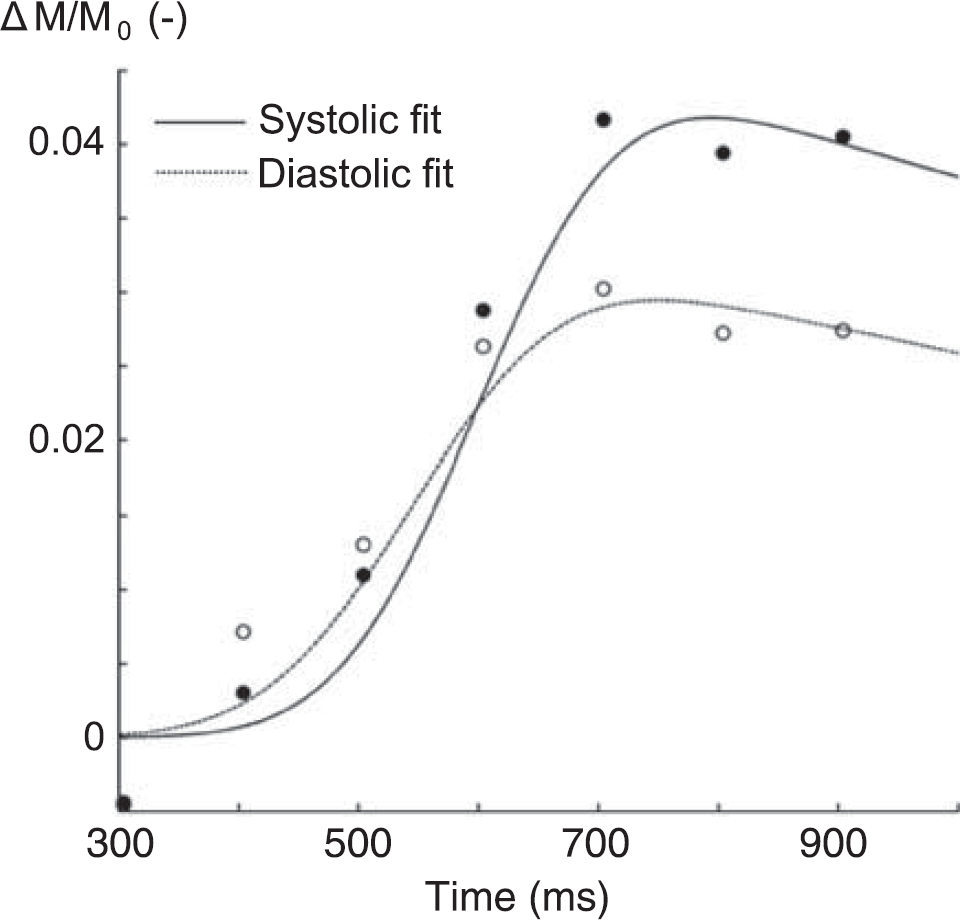
Example of model fit for a single voxel in the flow territory of the right middle cerebral arteries of one subject. Note that although signal intensities were calculated for eight different cardiac phases, only systolic (•) and diastolic (∘) data points are shown here. Data were corrected for slice time acquisition.
Example of fitted aBV (top) and Δ
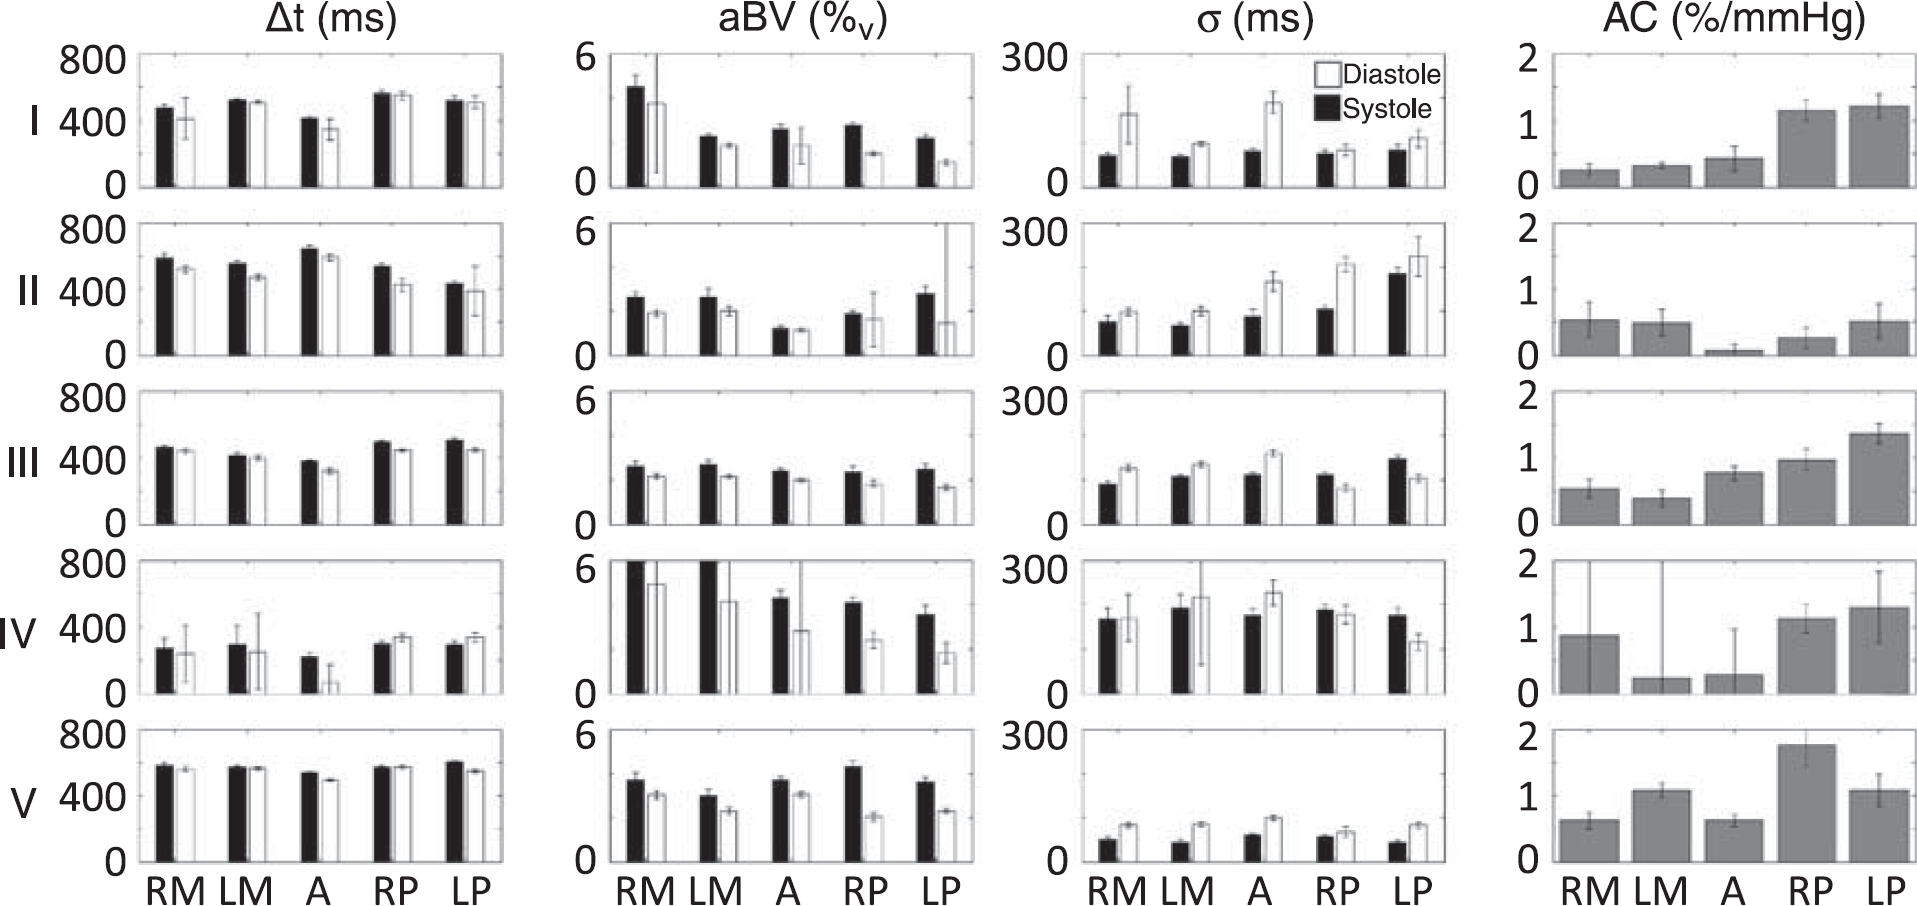
Regional median results for aBV, Δ
Individual values for AC for the slice just above the circle of Willis can be seen in Figure 5. Averaged over five subjects AC values calculated for the RMCA, LMCA, ACA, RPCA, and LPCA were 0.57%±0.20%, 0.50%±0.30%, 0.43%±0.24%, 1.1%±0.48%, and 1.1%±0.30% per mm Hg, respectively. Note that these values for AC indicate that we have measured aBV changes within the cardiac cycle from 25% to 50% (multiplying AC by the pulse pressure).
Examples of the aBV maps in diastole and systole and the resulting maps of AC containing the slice just superior to the circle of Willis can be seen in Figure 6.
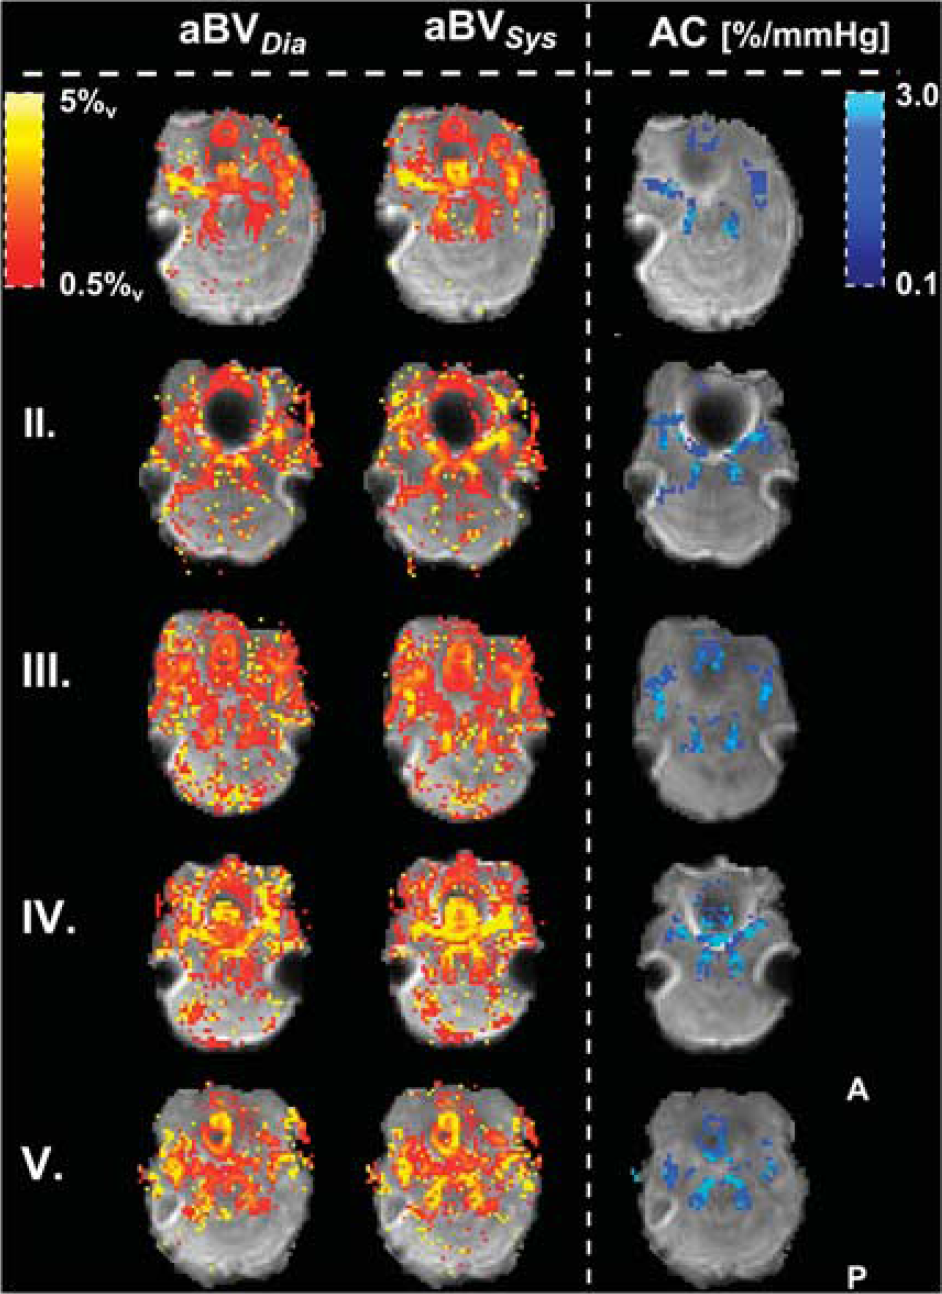
Maps of aBV (%v) just above the circle of Willis. aBVDia and aBVSys are plotted for each individual (top row shows subject I). The calculated AC maps are plotted in the right column. Note how AC here is normalized for aBVDia and is therefore showing percentage increases in aBV between systole and diastole per mm Hg increase in blood pressure. The AC maps are masked, showing only the voxels used to calculate flow territory averages. aBV, arterial blood volume; AC, arterial compliance.
Discussion
The current study has shown the feasibility of noninvasive assessment of AC of major cerebral arteries by retrospective synchronization of short TI ASL images with the cardiac cycle. In addition to finding significant differences between systolic and diastolic aBV, we have also found differences in dispersion and arrival time, which can be attributed to the pulsatility of the cardiac cycle.
Pulsatility of the Cardiac Cycle
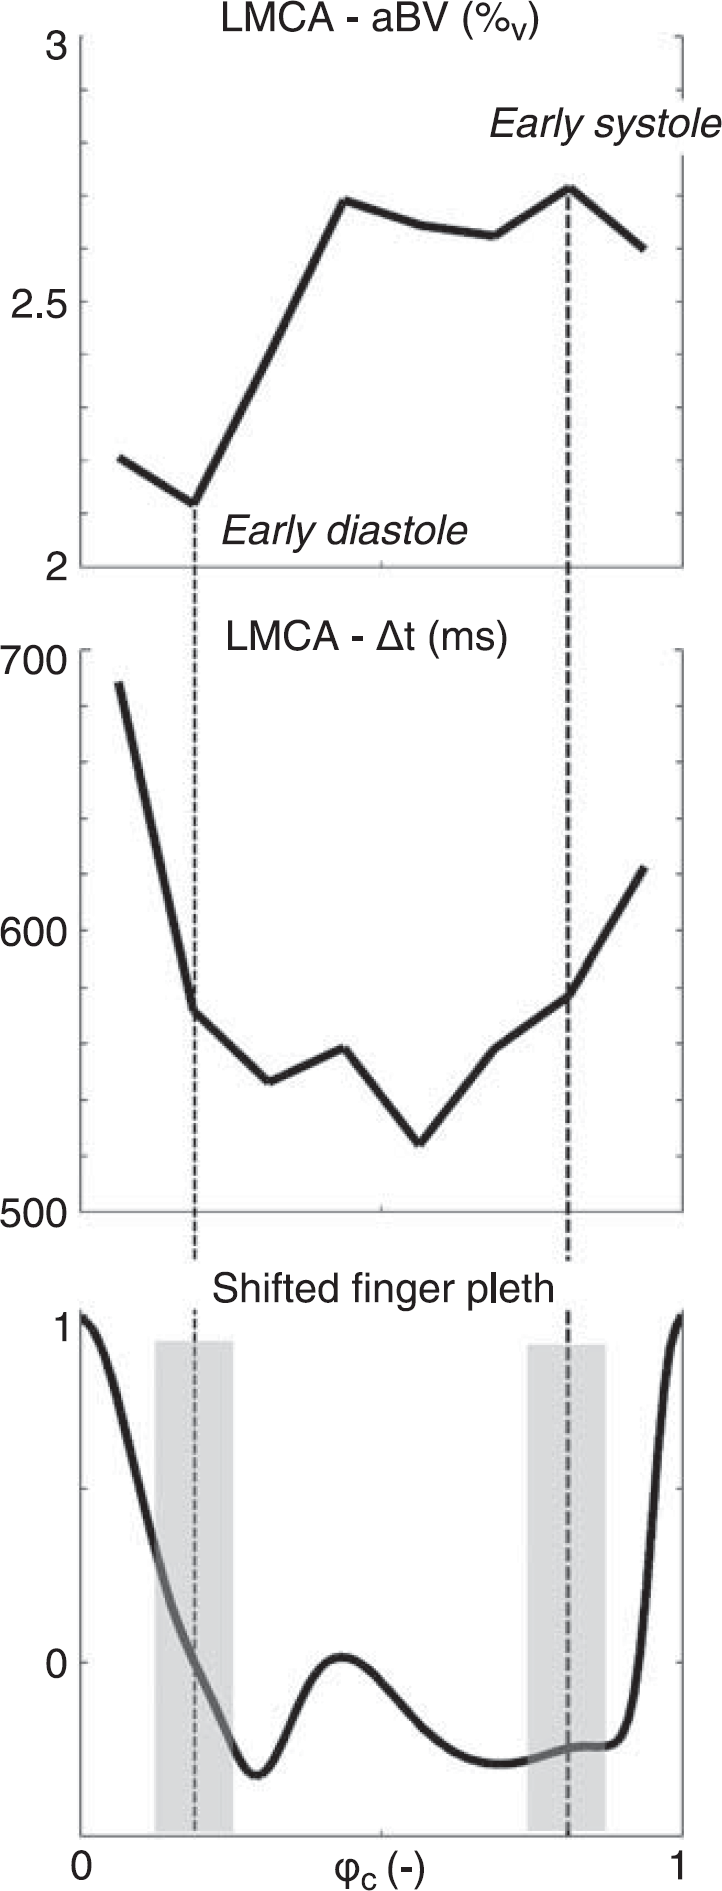
Although it has been shown that pulsatility arising from the cardiac cycle causes modulation of PASL signal,23, 33 to our knowledge this is the first study actually exploiting this modulation of PASL signal to assess cerebrovascular AC. In particular, here we robustly show that aBV changes in line with the cardiac cycle (Figure 4), which is as expected based on elastic properties of the cerebral arteries 34 as well as on AC measured in arteries outside the brain. 32
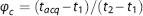
One important aspect of assessing cardiac pulsatility of the PASL signal in the
The fact that ϕaBV,max and ϕaBV,min shift for more distal slices when the label is applied in the same phase for each of the slice acquisitions shows that the aBV within the slice follows the cardiac phase of the slice itself, rather than being determined by the cardiac phase of the label location at the time of labeling. An important note here is that, when images are sorted according to the cardiac phase of the label and 14 slices are acquired with a slice delay of 29 ms, there is a cardiac phase difference (Δϕc) of more than 0.4 (406/1,000 ms) between the most proximal and most distal slice acquired for the average heart rate of 60 beats per minute (
In short, the findings from the analysis in which the PASL time series were sorted according to the cardiac phase of the
Previously Reported Arterial Compliance of Cerebral Arteries
Owing to the difficulty of
A direct comparison between AC reported here and AC methods derived from TCD should be interpreted with caution. As mentioned in the introduction, TCD (of the MCA) is restricted to the measurement of blood flow velocity and to estimate compliance, assumptions on vessel diameter have to be made. For instance, in the method described by Kim
Another cerebral compliance measure derived from TCD data is the augmentation index, which is calculated as the ratio of the difference between velocities at the return of the pulse wave reflected by the distal arterial bed and at diastole, and the differences between systolic and diastolic velocities in the flow profile of the insonated vessels (MCA and PCA in the experiment performed by Flück
Current models of pressure—flow relationships in the cerebral vasculature are in general validated with TCD measurements of blood flow velocity profiles through accessible cerebral arteries,9, 10, 36 and therefore also stress that the compliance parameters included in these models reflect the capacitive behavior of the distal arterial bed instead of local arterial wall properties.
9
Furthermore, values used for AC vary in order of magnitude between different models. For instance, Alastruey
Interestingly, a recent study performed by Yan
In short, ASL-derived measurements of arterial stiffness are difficult to compare directly with compliance measurements of the cerebral vasculature derived from different methodologies, such as TCD. Our method of local AC measurement has the potential of giving complementary information to TCD-based estimates of compliance. Reports on
Methodological Considerations
In the current experiment no model of tissue perfusion is included, even though PASL is conventionally used to assess this physiologic parameter. The main reason for not including this compartment in the model is the fact that the TIs used here are below 1 second, which means that the majority of the labeled blood has not reached the capillary bed of the brain yet and therefore little perfusion of the label has taken place. However, at TI=850 ms some perfusion might have still taken place, since transit delays from the blood to the capillary bed of more proximal brain regions have been reported to be <900 ms.27, 38 Our simulation study described in the Introduction section aimed to address this and showed that a short arrival time of the label to the capillary bed (of 700 ms), would result in a maximum overestimation of aBV of 5%, when the underlying aBV is >1%v. As an example, the resulting aBVDia for the LPCA here (group average aBVDia=1.68%v with Δ
It is important to note that, although overestimation of aBV is marginal, it is dependent on the true aBV and decreases with increasing aBV (as illustrated in Figure 2). This means that the estimates for aBVDia are more biased than the estimates for aBVSys and, because compliance depends on aBVSys–aBVDia, the AC might therefore be underestimated. However, as illustrated by the example of the LPCA as stated above, the fact that the ROIs used here only contain voxels with a sufficiently large aBV (>1.5%v) ensures that not including later TIs has limited effect on the AC measurement.
One potential systematic error in this study could arise from using brachial BPs as a surrogate for intracranial BPs. Pulse pressure in the common carotid artery is lower than in the brachial artery, because the peripheral brachial artery is located closer to reflection sites of the pressure wave through the vascular tree. 13 Use of the brachial pulse pressure could, therefore, result in an underestimate of cerebral AC. Distal to the carotid the pulse pressure decreases again until it is (almost) zero in the capillary bed to facilitate exchange of oxygen and nutrients in the cerebral tissue. 39 The cerebral arteries of interest here lie in between the common carotid and the capillary bed, which means that an invasive measurement would be necessary to obtain local pulse pressures.
To obtain perfusion-weighted ΔM images within the ASL technique it is required to subtract tag from control images. The retrospective synchronization of image acquisition to the cardiac cycle used here can result in an unbalanced number of tag and control images used to calculate the ΔM images. When the number of tag or control images used to calculate the ΔM of a particular cardiac phase becomes too small, there is a potential to lead to biased measurements of aBVSys or aBVDia. In particular when motion is present within the time series. However, because of the use of a variable repetition time in image acquisition and the constant heart rate of healthy participants in rest of the current data set, it does not reveal any bias toward the number of images used to calculate systolic and diastolic aBV maps.
Lastly, it should be noted that cerebral aBV can be measured with different MRI methods as presented here, some of which could be synchronized to the cardiac cycle and therefore have the potential to assess cerebral AC as well. For instance, Yan
The current study has shown the feasibility of measuring local AC of cerebral arteries with short TI PASL and has resulted in plausible estimates of local AC. Compared with TCD, measurement of AC with PASL has the benefit of measuring AC based on local arterial wall properties instead of assessing compliance of the arterial bed distal to the location of measurement and therefore has the potential to give complimentary information about the health of cerebral arteries.