
Abstract
The PET tracer [11C]5-hydroxytryptophan ([11C]5-HTP), which is converted to [11C]5-hydroxytryptamine ([11C]5-HT) by aromatic amino acid decarboxylase (AADC), is thought to measure 5-HT synthesis rates. But can we measure these synthesis rates by kinetic modeling of [11C]5-HTP in rat? Male rats were scanned with [11C]5-HTP (60 minutes) after different treatments. Scans included arterial blood sampling and metabolite analysis. 5-HT synthesis rates were calculated by a two-tissue compartment model (2TCM) with irreversible tracer trapping or Patlak analysis. Carbidopa (inhibitor peripheral AADC) dose-dependently increased [11C]5-HTP brain uptake, but did not influence 2TCM parameters. Therefore, 10 mg/kg carbidopa was applied in all subsequent study groups. These groups included treatment with NSD 1015 (general AADC inhibitor) or p-chlorophenylalanine (PCPA, inhibitor of tryptophan hydroxylase, TPH). In addition, the effect of a low-tryptophan (Trp) diet was investigated. NSD 1015 or Trp depletion did not affect any model parameters, but PCPA reduced [11C]5-HTP uptake, and the k3. This was unexpected as NSD 1015 directly inhibits the enzyme converting [11C]5-HTP to [11C]5-HT, suggesting that trapping of radioactivity does not distinguish between parent tracer and its metabolites. As different results have been acquired in monkeys and humans, [11C]5-HTP-PET may be suitable for measuring 5-HT synthesis in primates, but not in rodents.
INTRODUCTION
The neurotransmitter serotonin, or 5-hydroxytryptamine (5-HT), is implied in several functions of the central nervous system, such as regulation of mood. Antidepressants, like selective serotonin reuptake inhibitors, increase the levels of serotonin in the synaptic cleft by blocking the serotonin transporter or by occupying the serotonin receptors. 5-HT synthesis may be an important aspect in the efficacy of antidepressants, as enough 5-HT should be produced for replenishing 5-HT stocks.1, 2, 3
Serotonin is produced by neurons, of which the cell bodies lie in the raphe nuclei and project to almost every region of the brain. Serotonin is synthesized from the amino acid tryptophan (Trp), mainly in synaptic endings. This process takes place in two enzymatic steps. First, Trp is converted to 5-hydroxytryptophan (5-HTP) by the enzyme tryptophan hydroxylase (TPH). Second, 5-HTP is converted to 5-HT by aromatic amino acid decarboxylase (AADC). 5-HT is transported into vesicles by the vesicular monoamine transporter. When serotonergic neurons fire, such vesicles fuse with the synaptic membrane to release 5-HT into the synaptic cleft. Released serotonin can be pumped back into the nerve endings by serotonin transporter, and can either be stored in the vesicles or be degraded by monoamine oxidase to 5-hydroxyindoleacetic acid (5-HIAA), which leaves the brain through the cerebrospinal fluid.
Besides activity of the enzymes involved in 5-HT synthesis, several other processes may influence the production of 5-HT. The availability of Trp for 5-HT production is the rate-limiting step in this metabolic pathway.4, 5 Trp is transported over the blood–brain barrier by the large neutral amino acid transporter (LAT). Transported Trp is not only used for 5-HT synthesis, but also incorporated into proteins and used for the production of kynurenine. The rate-limiting step in kynurenine production is the activity of the enzyme indoleamine 2,3-dioxygenase. Increased activity of indoleamine 2,3-dioxygenase may result in reduced availability of Trp for serotonin synthesis. 6
As direct measurement of serotonin synthesis is difficult, indirect estimates are commonly employed. 5-HT turnover rates can be measured by determining 5-HIAA concentrations or the 5-HTP/5-HIAA ratio in cerebrospinal fluid. 7 However, this is an invasive method, as a lumbar puncture is necessary to obtain cerebrospinal fluid. Another method is measurement of the levels of 5-HT in blood platelets, as 5-HT is synthesized within these cells in a way similar to neurons. The validity of this procedure is questionable, for peripheral levels of 5-HT may not reflect corresponding levels in the brain.8, 9, 10
The only direct and non-invasive methods for measuring metabolic processes in the living brain are positron emission tomography (PET) and single-photon emission computed tomography. Several PET tracers have been produced for this purpose. 7 Radiolabeled Trp is not optimal, as Trp is also incorporated into proteins and used in the kynurenine pathway, rather than being used for 5-HT synthesis. 11 Tracer incorporation into proteins can be avoided by using a radiolabeled analog of Trp. Diksic and colleague's labeled α-methyltryptophan (AMT) with carbon-11.12, 13, 14, 15, 16, 17 However, AMT can still enter the kynurenine pathway.18, 19 Consequently, [11C]AMT uptake reflects both 5-HT and kynurenine synthesis. Although some studies support the idea that [11C]AMT-PET measures 5-HT synthesis rates, 20 this may not be true under pathologic conditions, which are accompanied by neuroinflammation.
Another option to measure 5-HT synthesis with PET, is labeling the endogenous precursor of serotonin, [11C]5-HTP.21, 22 A great advantage of this compound is that it is metabolized exactly in the same way as endogenous 5-HTP. Several studies with [11C]5-HTP have indicated that this tracer can be used to measure 5-HT synthesis rates by kinetic modeling of PET data. The rate constant for accumulation of [11C]5-HTP, Kacc, calculated using a two-tissue compartment model (2TCM) with irreversible tracer trapping, reflects 5-HT synthesis rates.23, 24
The trapping of radioactivity in the brain regions represents the production of [11C]5-HT and its metabolite [11C]5-HIAA. When the enzyme monoamine oxidase, converting 5-HT to 5-HIAA, is inhibited in monkeys, the trapping of radioactivity is unchanged. 24 This indicates that within a period of 60 minutes, there is no significant loss of radiolabeled metabolites from monkey brain, and the trapping of 11C reflects 5-HT synthesis. Inhibition of AADC, and thus the conversion of 5-HTP to 5-HT, reduces the value of k3, which suggests that this rate constant is closely related to the decarboxylation of [11C]5-HTP. 24
Positron emission tomography studies with [11C]5-HTP have only been performed in monkeys or humans. To our knowledge, only one study applied [11C]5-HTP in rodents. 25 Rats were killed 40 minutes after [11C]5-HTP injection and radioactive metabolites in the striatum and cerebellum were determined by high-performance liquid chromatography. The results of this analysis raise the question whether pharmacologically induced changes of 5-HT synthesis in the rodent brain can be detected also with PET. If so, small animal imaging could be used to examine the mechanism of action of antidepressants.
The enzymatic steps in 5-HT synthesis can be inhibited by administering various drugs, thus one could investigate what [11C]5-HTP is exactly measuring. Levels of the precursor Trp can be reduced by feeding animals a special, Trp-free diet, lacking Trp but containing identical levels of other amino acids as the control diet. As Trp is the direct precursor of 5-HT, we expect a decrease of 5-HT synthesis in animals fed a Trp-free diet. The first enzymatic step in 5-HT synthesis, hydroxylation of Trp by TPH, can be inhibited by para-chlorophenylalanine (PCPA), which strongly reduces 5-HT content in the rat brain. 26 As PCPA treatment reduces the conversion from Trp to 5-HTP, 5-HT synthesis should decrease as well. The second step in 5-HT synthesis, decarboxylation of 5-HTP by AADC, can be inhibited in peripheral organs by carbidopa, without affecting AADC activity in the brain. 27 Treatment of animals with carbidopa should not influence cerebral rates of 5-HT synthesis, but only reduce the peripheral metabolism of 5-HTP. When peripheral metabolism of [11C]5-HTP is reduced, more parent tracer becomes available for uptake in the brain. A final compound, NSD 1015, inhibits AADC activity both in the brain and periphery. 28 Treatment of animals with NSD 1015 should decrease 5-HT synthesis rates in rat brain, as the production of 5-HT from 5-HTP is directly inhibited. An overview of the manipulations used in this study is presented in Figure 1.
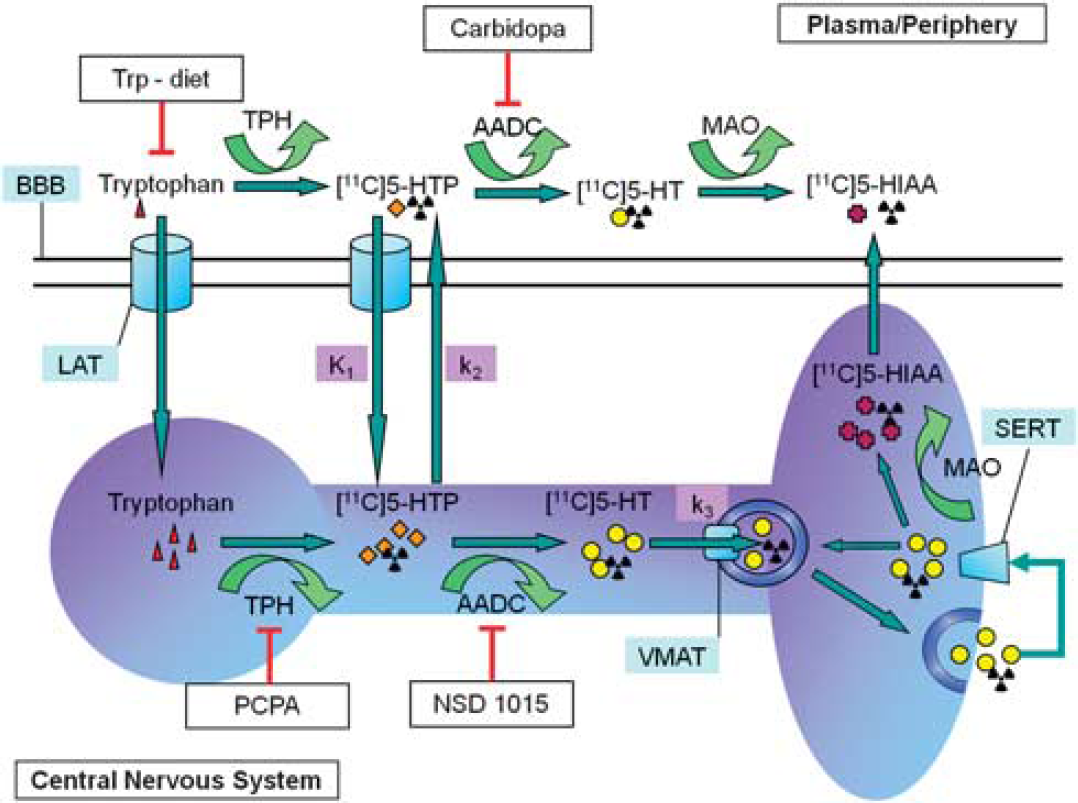
Manipulations in the serotonin synthesis pathway. Serotonin (5-HT) synthesis takes place within neurons in the brain and cells in the periphery. Tryptophan (Trp) is the amino acid precursor of 5-HT, which is transported by the large amino acid transporter (LAT) over the blood–brain barrier. Within the neuron, Trp is hydroxylated by tryptophan hydroxylase (TPH), the rate-limiting enzyme in the synthesis pathway, to 5-HTP. In turn, 5-HTP is decarboxylated to 5-HT by AADC. 5-HT is transported into vesicles by the vesicular monoamine transporter. When these vesicles fuse with the synaptic membrane, 5-HT is released in the synaptic cleft and can be taken up by the serotonin transporter. Finally, 5-HT is metabolized to 5-HIAA by monoamine oxidase and transported out of the brain. [11C]5-HTP follows the same pathway as endogenous 5-HTP. Different treatments can be used to manipulate different aspects of the 5-HT synthesis pathway. In this study, we used a Trp low diet (Trp−diet) to deplete rats from the 5-HT precursor. Carbidopa was used to inhibit peripheral AADC, and NSD 1015 was used to inhibit both peripheral and central AADC. Para-chlorophenylalanine (PCPA) was used to inhibit TPH. The different kinetic modeling rates are represented in purple. Adjusted from Visser et al. 7
Thus, we performed the current study that is aimed at answering the following questions: (1) Can [11C]5-HTP uptake in rat brain be increased by inhibiting peripheral AADC with carbidopa? (2) Can changes of 5-HT synthesis after pharmacologic inhibition of key enzymes be detected with [11C]5-HTP and microPET?
MATERIALS AND METHODS
Animals
Adult male Wistar rats (CpB:WU) weighing 317±34 g were housed in pairs (Harlan, Boxmeer, The Netherlands). They were kept under a 12:12 hour light:dark cycle (light on at 7.00 a.m.) with food and water available ad libitum. Animals were either fed a diet with 0.025 g Trp/100 g (Trp depletion) or 0.25 g Trp/100 g (Research Diet Services, The Netherlands, for 4 days). The animal experiments were performed by licensed investigators in compliance with the Law on Animal Experiments of The Netherlands. The protocol was approved by The Institutional Animal Care and Use Committee of the University of Groningen.
Tracer and Drug Treatment
[11C]5-HTP was produced according to a published method. 22 The average injected dose of [11C]5-HTP was 12.0±6.4 MBq with a specific radioactivity of 23.4±11.2 GBq/μmoL. All drugs were administered by i.p. injection. Carbidopa was dissolved in water (1 mg/mL or 2.5 mg/mL), and doses of 1 or 10 mg/kg were administered 1 hours before tracer injection. NSD 1015 was dissolved in saline at 100 mg/mL, and a dose of 100 mg/kg was administered 30 minutes before tracer injection. Para-chlorophenylalanine (PCPA) was dissolved in saline at 150 mg/mL and a single dose of 150 mg/kg was administered on the two consecutive days before PET scanning. The second PCPA administration took place 24 hours before tracer injection.
In the initial part of this project, the dose-dependent effect of carbidopa was examined by treating groups of animals with 0, 1 or 10 mg/kg carbidopa. In the second part of the study, all animals were treated with 10 mg/kg carbidopa. Separate groups of animals were used for metabolite analysis.
MicroPET Acquisition and Image Reconstruction
Animals were anesthetized with isoflurane (5% in medical air for induction, 2% for maintenance). A cannula was placed in the left femoral artery to enable arterial blood sampling during PET scanning. Two cannulated animals were positioned in the Siemens/Concorde MicroPET Focus220 camera, with the brain in the field-of-view. A 515second-transmission scan with a 57Co source was made, to allow correction of the PET images for attenuation and scatter. Tracer solution was injected through the penile vein. MicroPET data was acquired, using a list mode protocol of 96 minutes. The camera was started at the moment of injection of the first animal, whereas the second animal was injected after 6 minutes. During microPET scanning, 15 arterial blood samples (volume 0.1 to 0.15 mL) were drawn at different time-points: 15, 30, 45, 60, 75, and 90 seconds; 2, 3, 5, 7.5, 10, 15, 30, 60, and 90 minutes. The 15 blood samples for determination of input curves were centrifuged for 5 minutes at 13,000 rpm. Plasma was collected (25 μL) and radioactivity was measured in a calibrated γ-counter.
List mode data were reframed into 8 frames of 30 seconds, 3 of 60 seconds, 2 of 120 seconds, 2 of 180 seconds, 3 of 300 seconds, 3 of 600 seconds, 1 of 720 seconds, and 1 of 960 seconds. Data of each frame were reconstructed employing an iterative algorithm (OSEM2D with Fourier rebinning, 4 iterations, and 16 subsets). The final data sets consisted of 95 slices with a thickness of 0.8 mm and an in-plane image matrix of 128 × 128 pixels. Voxel size was 0.5 mm × 0.5 mm × 0.8 mm. Linear resolution of the images at the center of the field-of-view was ∼1.5 mm.
Ex vivo Biodistribution
After scanning, animals were killed by extirpation of the heart under deep isoflurane anesthesia and blood was collected. The blood was centrifuged for 10 minutes at 6,000 rpm, and plasma and a cell fraction were collected separately. Samples of different tissues were taken and weighed. Radioactivity in all samples was measured in a γ-counter. Standard uptake values (SUV) were calculated using the formula:
The following brain regions were dissected: bulbi olfactorii, hippocampus, striatum, cortex, pons, medulla, cerebellum, and the rest of the brain.
Tryptophan Concentration
Blood samples were taken after extirpation of the heart, and plasma was collected as mentioned above. Approximately 0.3 mL of plasma was pipetted on an Amicon ultrafilter with 25 kDa cut-off. Free and bound Trp were separated by 30 minutes of centrifugation at 3,000 rpm. The ultrafiltrate was frozen (−20°C) to determine free Trp at a later moment. A sample of unfiltered plasma was used to assess total Trp. Free and total Trp were measured as described previously. 29
Metabolite Analysis
In separate groups, blood samples (0.8 to 1.5 mL) were drawn for metabolite analysis at 5, 10, 20, 40, and 60 minutes after tracer injection. The blood was centrifuged (2 minutes at 13,000 rpm). Plasma was collected and 5% perchloric acid was added. After Vortex mixing, proteins were removed by 2 minutes of centrifugation at 13,000 rpm. The supernatant was analyzed by high-performance liquid chromatography, using an X-Terra C18-column (Waters, 4.6 × 250 mm). The high-performance liquid chromatograph was equipped with a UV detector (set at 254 nm). Parent [11C]5-HTP was separated from radioactive metabolites using gradient elution (buffer A: 50 mmol/L potassium dihydrogen phosphate, pH 3.3, buffer B: 30% acetonitrile in buffer A). The gradient was programmed as follows: 0 to 2 minutes 90% A and 10% B; 2 to 10 minutes 60% A and 40% B; 10 to 10.1 minutes 0% A and 100% B; 10.1 to 15 minutes 0% A and 100% B; 15 to 15.1 minutes 90% A and 10% B; 15.1 to 17 minutes 90% A and 10% B. Flow rate was 1 mL/minute and the gradient was linear.
The eluate was collected by a fraction collector, every 30 seconds and every 20 seconds during peak collection, and measured in a γ-counter. Fractions of parent tracer and metabolites were calculated from the radiochromatograms.
MicroPET Data Analysis
A volume of interest of the whole brain was drawn on a template of the rat brain (rat scanned with [11C]verapamil and treated with cyclosporine). Positron emission tomography images were re-aligned to this template, and the volume of interest was used to calculate time–activity curves (TACs). Model fits to these TACs were performed using in-house MatLab software. Using metabolite-corrected plasma data as input function, a one-tissue compartment model or a 2TCM with irreversible tracer trapping were applied to fit the TACs. Blood volume was fixed to 3.6%. 30
Only the first 62 minutes of the scans were analyzed. As Patlak analysis requires an equilibrium state, which is reached after 20 minutes, a 40 minutes data set is too short. When a longer (90 minutes) data set was used, there is a higher chance of washout of [11C]5-HIAA from the brain. We therefore used 62 minutes of data. The accumulation constant, Kacc, was calculated with the formula:

A Patlak plot of the data was also made, as this graphical method can also be used to estimate the accumulation constant independent of the specific trapping model.31, 32
Statistical Analysis
For analysis of TACs, metabolite curves, and plasma curves, repeated measures analysis of variance (ANOVA) with Bonferroni posttest were used. One-way ANOVA was used for comparison of the values of K1,k2, k3, Kacc, and Patlak constant in the different groups. Dunnett's multiple comparison tests were applied for further analysis of group differences. Correlations between the Patlak constant and Kacc were examined by Spearman rank correlation. As we expected to observe a decrease in Trp levels in animals exposed to a low-Trp diet, measured plasma–Trp concentrations in the control and Trp depleted groups were directly compared using Student's t-test. The Akaike criterion of one-tissue compartment model and 2TCM were compared by a paired t-test, where we expect a better fit of the 2TCM. All statistical analysis was performed with GraphPad Prism 5 (GraphPad Software, La Jolla, CA, USA).
RESULTS
Tryptophan Depletion
Direct comparison of the Trp depleted (N=9) and control group (N=12) indicated no significant change of total Trp, but there was a significant decrease of free Trp (−28.5%) in plasma of animals that had been fed a low-Trp diet (t-test, t=2.636, Df=19, P=0.016). One-way ANOVA showed a significant effect of treatment on total Trp levels (control, NSD, PCPA, and Trp low diet) (F=4.64, Df=3, P=0.009). A significant decrease in total Trp levels (−24%) occurred in animals treated with PCPA (Dunnett's multiple comparison, q=2.99, P<0.05). The other treatments did not affect either total or free Trp. Neither total nor free levels of Trp were correlated with Kacc.
Metabolite Analysis
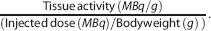
For all groups, metabolite analysis was performed. There was a significant difference in metabolism between the different treatment groups (repeated measures ANOVA, F=93.74, Df=5, P<0.0001). After Bonferroni posttests, it appeared that 10 mg/kg carbidopa decreased metabolism (also in combination with the other treatments).
After metabolite correction, there was a significant difference between plasma curves (repeated measures ANOVA, F=9.96, Df=5, P<0.0001). After Bonferroni posttest, it appeared that this significant difference was present between almost all treatment groups, but only in the early time-points of the plasma peak. See Figure 2 for metabolite and metabolite-corrected plasma curves.
Metabolism in plasma of all different groups (
Tracer Uptake
As visual inspection of microPET images and biodistribution data indicated a homogeneous uptake of [11C]5-HTP in rat brain, we used TACs of whole brain ROIs for kinetic modeling.
Time–activity curves of whole brain of animals treated with different carbidopa concentrations were significantly different (repeated measures ANOVA, interaction, F=2.4, Df=40, P<0.0001). After Bonferroni correction, an increase in [11C]5-HTP uptake was observed between animals treated with 0 mg/kg and 10 mg/kg carbidopa (Figure 3A).
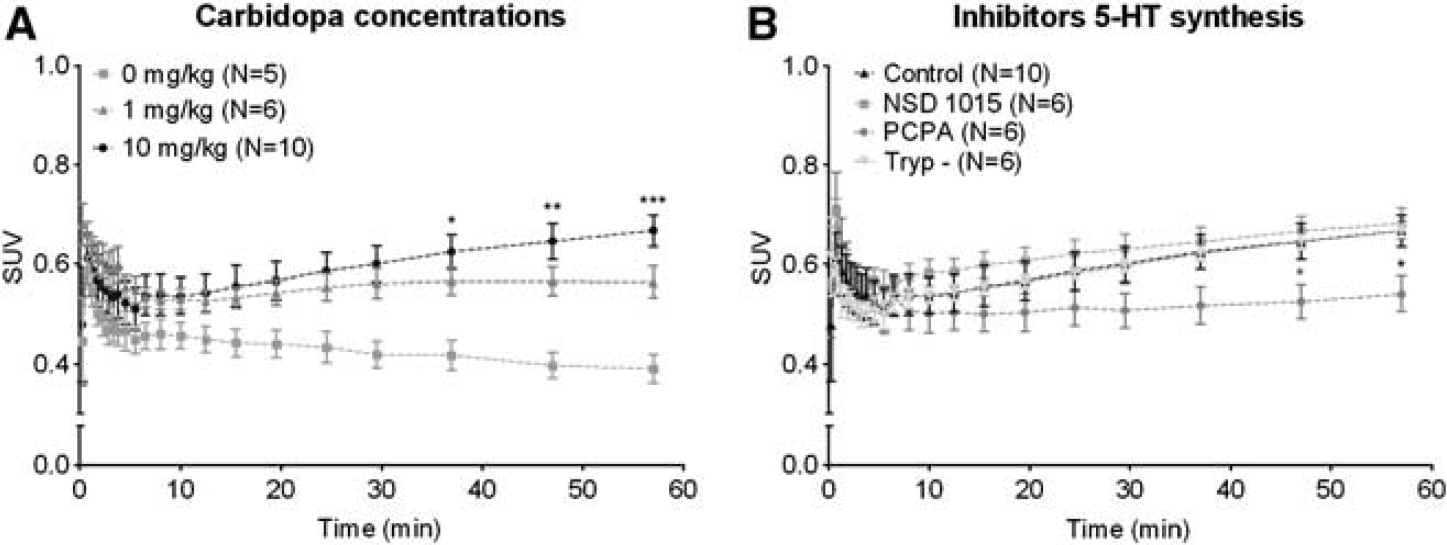
Time–activity curves of different concentrations of carbidopa (
Biodistribution data also indicated a significant increase of tracer SUV in the brain after carbidopa treatment (2-way ANOVA, F=49.89, Df=2, P<0.0001). Comparison of the different doses with Bonferroni posttests revealed that the SUV in the cortex was increased in animals treated with 1 mg/kg carbidopa, as compared with untreated controls, with an average SUV of 0.48±0.07 for animals treated with 1 mg/kg carbidopa versus 0.15±0.02 for untreated animals. Trends towards an increase were also seen in the hippocampus, cerebellum, pons, medulla, and the rest of the brain. At the higher dose used (10 mg/kg), carbidopa increased tracer uptake in all studied brain regions, although the change in striatum and hippocampus did not reach statistical significance (Figure 4A). As the effect of carbidopa appeared to be dose-dependent, we used 10 mg/kg carbidopa in all subsequent experiments to increase tracer delivery to the brain.
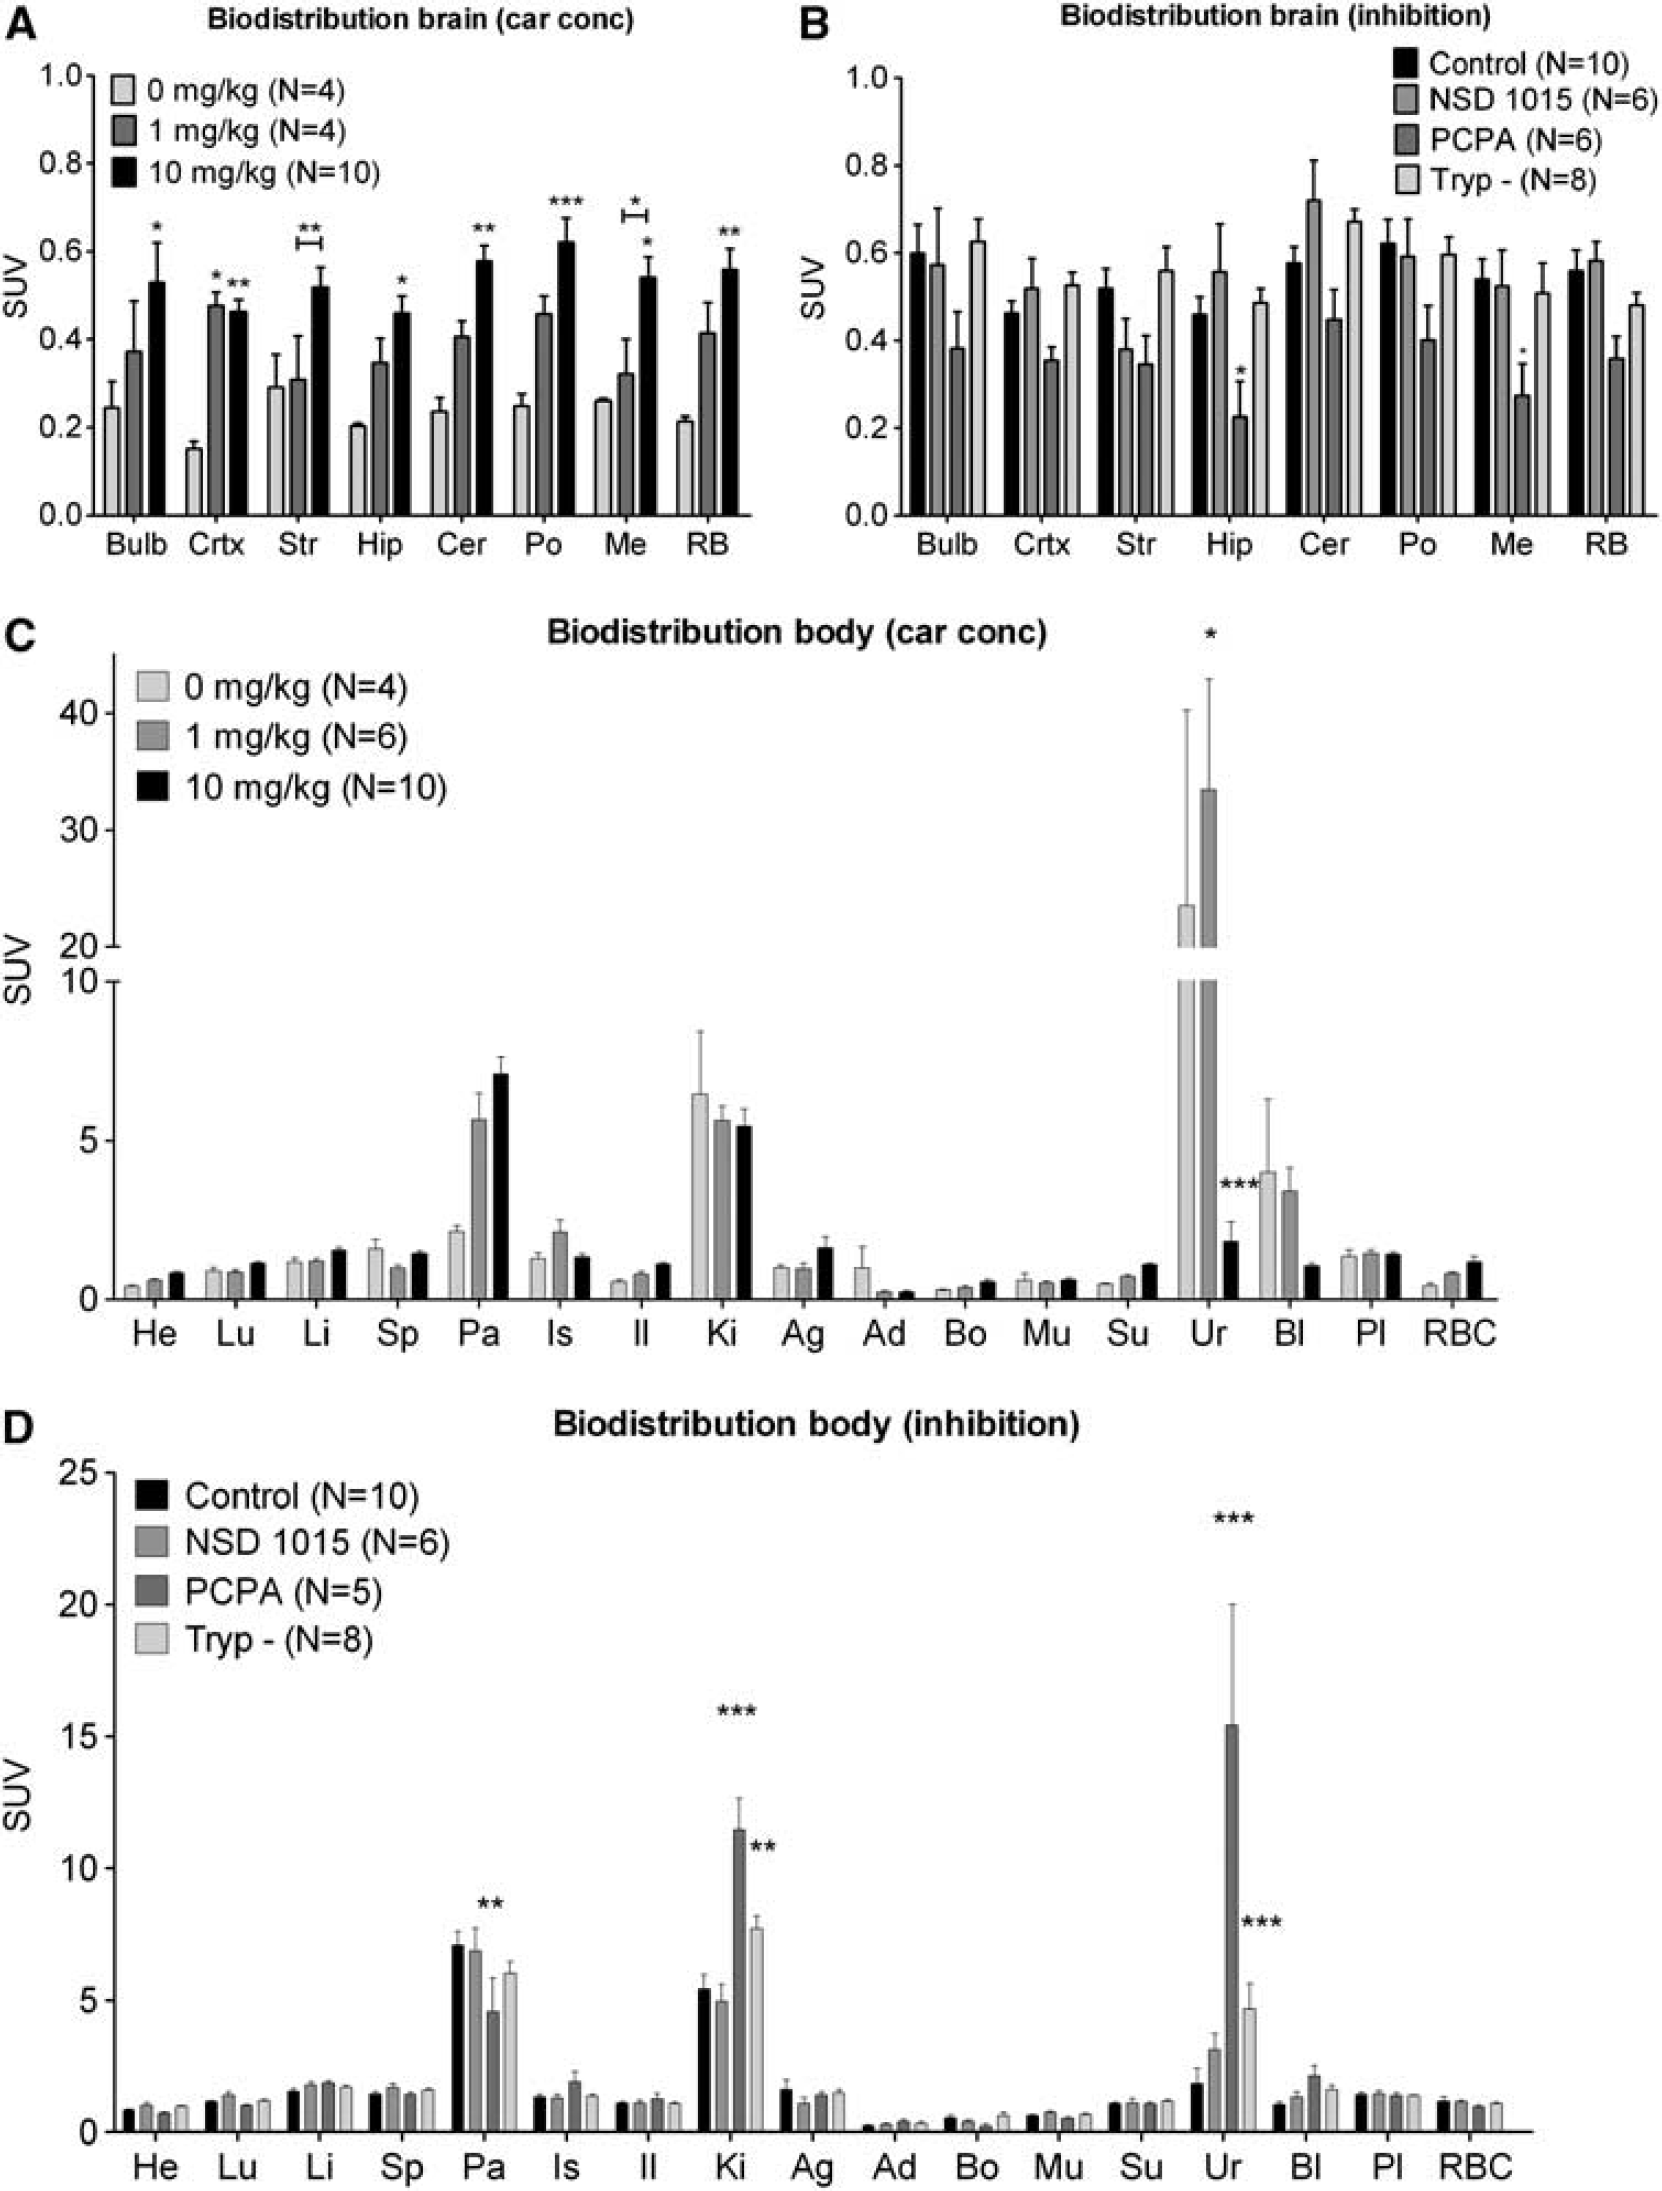
Biodistribution data for brain regions (
Brain TACs indicated no significant difference in [11C]5-HTP uptake in animals treated with 10 mg/kg carbidopa or the combination of 10 mg/kg carbidopa with either NSD, PCPA, or a Trp low diet (repeated measures ANOVA, F=0.45, Df=2, P=0.72) (Figure 3B). Biodistribution did indicate a significant decrease in tracer uptake after the different treatments (two-way ANOVA, F=20.25, Df=3, P<0.0001). Bonferroni posttest revealed a significant difference in the PCPA-treated group, in the hippocampus and medulla, and a trend towards a decrease in all the other brain regions investigated. NSD 1015 and a low-Trp diet did not affect brain uptake of [11C]5-HTP (Figure 4B).
Analysis of tracer uptake in the peripheral organs indicated a significant increase of radioactivity due to carbidopa treatment (two-way ANOVA, F=4.73, Df=2, P=0.0095). Bonferroni posttest revealed an increased radioactivity in the urine after treatment of animals with 1 mg/kg carbidopa, although a large individual variation was observed. The higher dose of 10 mg/kg had the opposite effect, as the amount of radioactivity in the urine was tremendously reduced. Carbidopa did not affect tracer uptake in any of the other organs, although uptake in the red blood cells and pancreas tended to be increased after treatment with 10 mg/kg carbidopa, compared with untreated controls (Figure 4C).
Para-chlorophenylalanine reduced [11C]5-HTP uptake in the pancreas and increased radioactivity in the kidney and urine (two-way ANOVA, F=13.49, Df=3, P<0.0001). Feeding rats a low-Trp diet also increased tracer elimination via the renal route (Figure 4D).
Kinetic Modeling
A 2TCM fitted whole brain TACs better than a one-tissue compartment model, as shown by lower values of the Akaike criterion (AICc corrected for small sample size; paired t-test, t=9.07, Df=46, P<0.0001), although both fits were good with an average Akaike value of 239±1.8 for the one-tissue compartment model and 225±2.6 for the 2TCM. Cerebral blood volume was fixed at 3.6% in kinetic modeling, to avoid model fits with physiologically irrelevant high values (>10%) for blood volume. In some cases, fixing the blood volume also resulted in a visually better fit.
Calculated values for the Patlak rate constant correlated well with Kacc (r=0.733, P=0.0001), therefore only Kacc is presented in Figure 5. Data analysis with one-way ANOVA revealed that carbidopa treatment did not result in significant changes in Kacc (F=0.13, Df=2, P=0.88) (Figure 5A). NSD 1015, PCPA, and Trp depletion did not result in significant changes of Kacc either, although a trend towards a decrease was seen after 2 days of treatment with PCPA (one-way ANOVA, F=2.76, Df=3, P=0.0655).
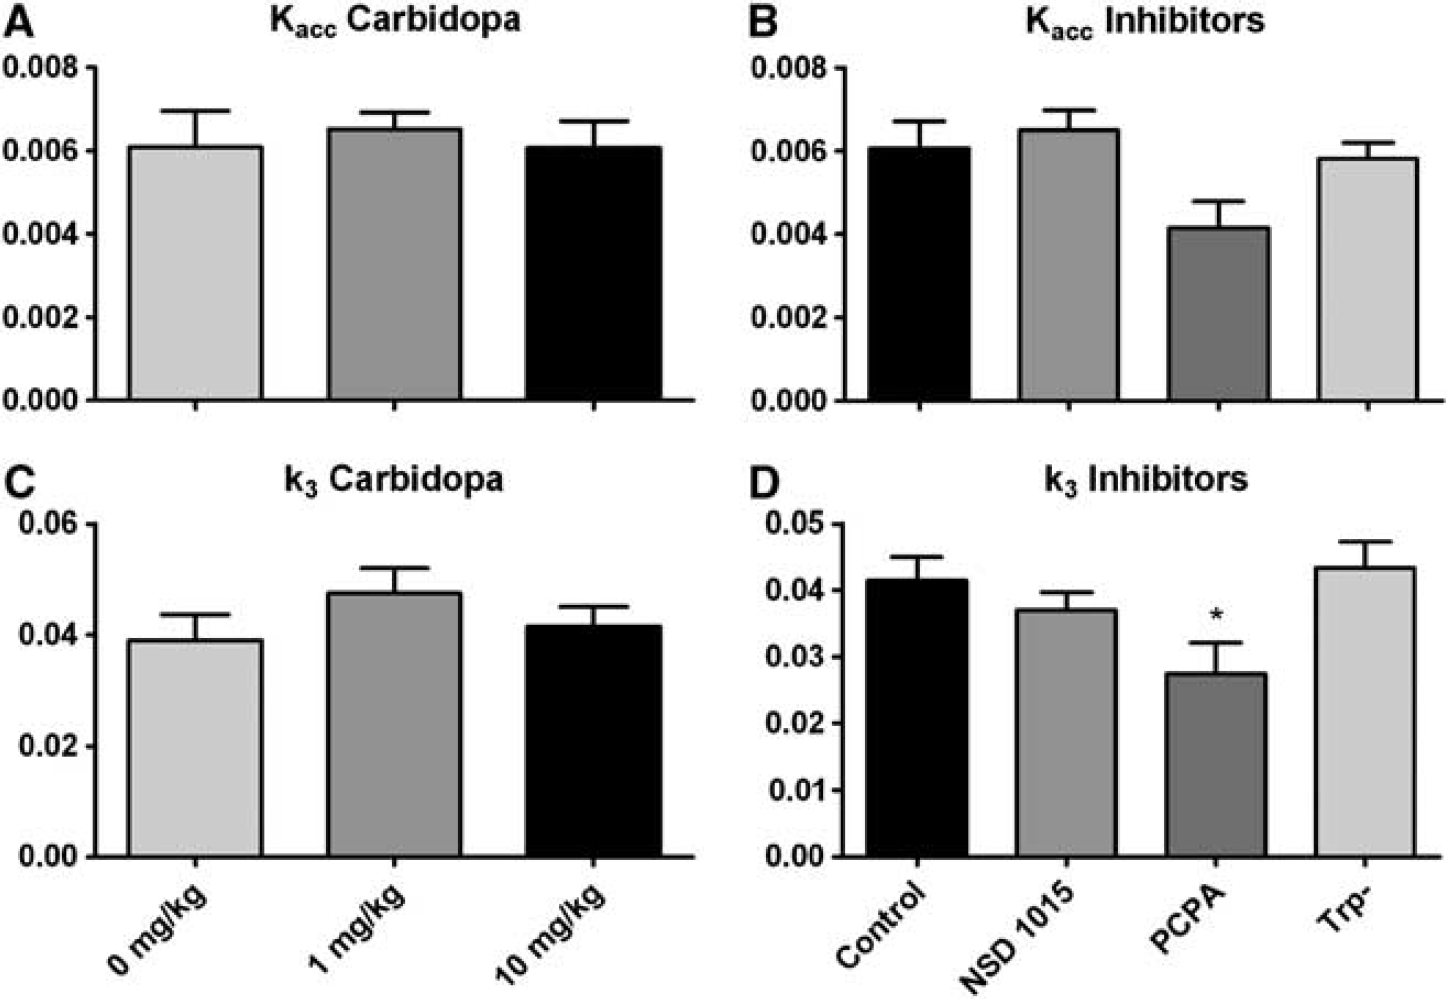
Rate constants after treatments with different doses of carbidopa (
Inter-individual variation of K1 and K2 was high in all groups, but values for k3 were more stable. As this rate constant possibly reflects the enzymatic activity of AADC, it is of equally great interest as Kacc. There was no significant effect of carbidopa treatment on k3 (one-way ANOVA, F=0.9767, Df=2, P=0.40) (Figure 5C). There was a significant effect of other treatments on k3 (one-way ANOVA, F=3.26, Df=3, P=0.04), attributable to a reduction in k3 after PCPA treatment (Dunnet's multiple comparison, q=2.70, P<0.05) (Figure 5D). None of the other constants (K1 or K2) showed significant difference between groups, which is probably caused by the high variability between individual animals. The kinetic modeling data are summarized in Table 1.
Summary of parameters determined with kinetic modeling
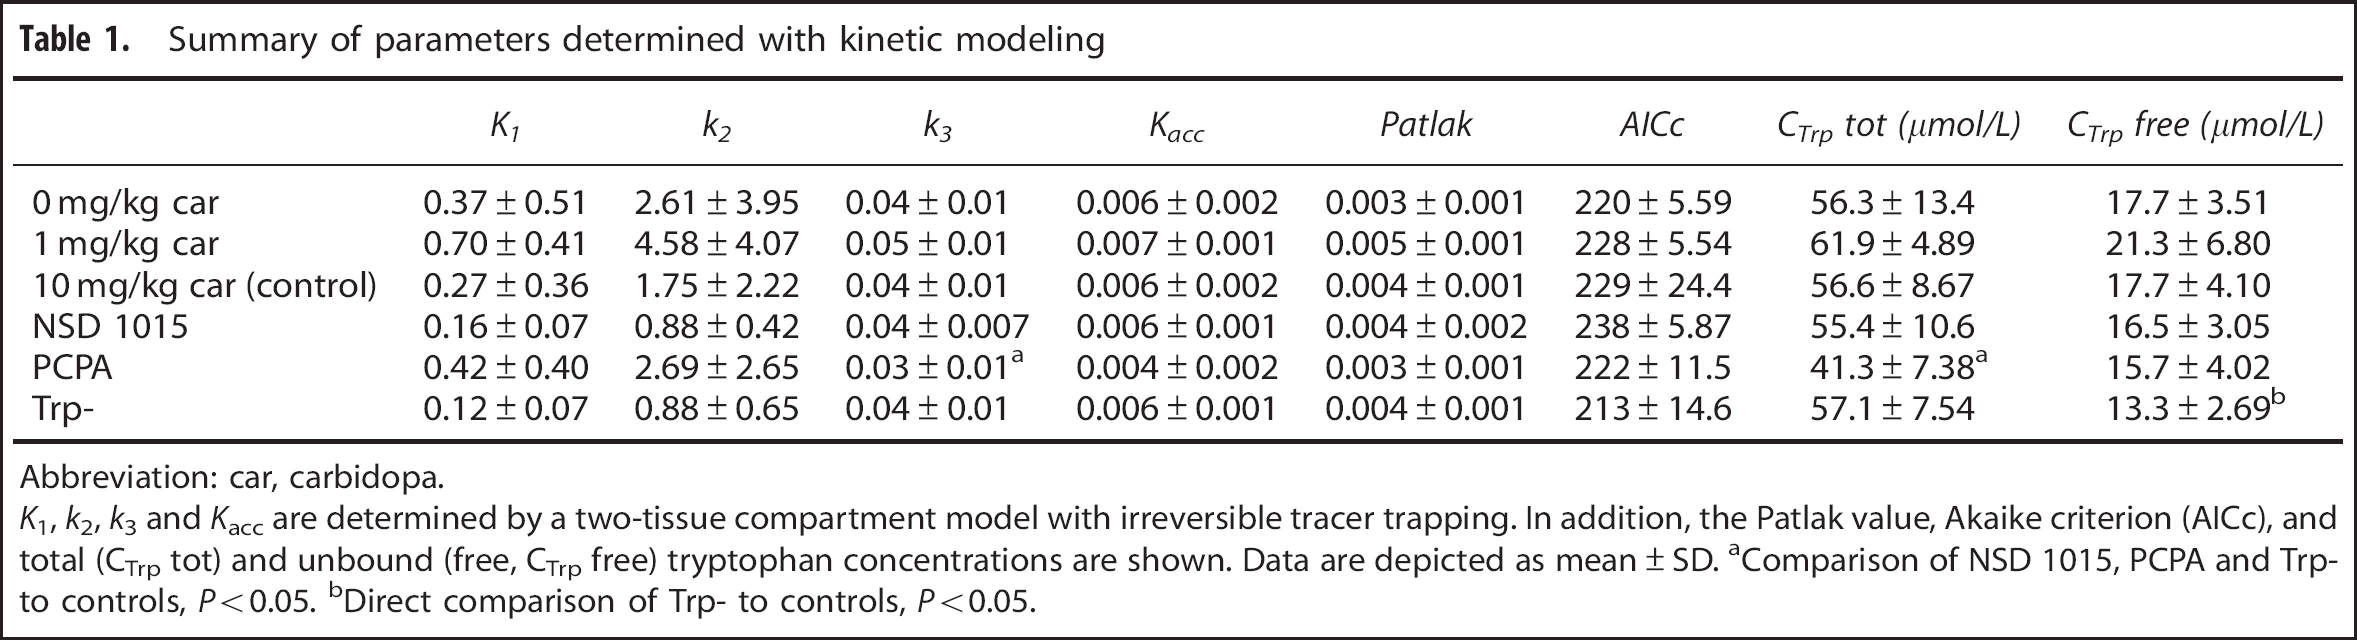
Abbreviation: car, carbidopa.
K1, k2, k3 and Kacc are determined by a two-tissue compartment model with irreversible tracer trapping. In addition, the Patlak value, Akaike criterion (AICc), and total (CTrp tot) and unbound (free, CTrp free) tryptophan concentrations are shown. Data are depicted as mean±SD.
Comparison of NSD 1015, PCPA and Trp- to controls, P<0.05.
Direct comparison of Trp- to controls, P<0.05.
DISCUSSION
This study focused on two questions: (1) whether carbidopa can dose-dependently increase [11C]5-HTP uptake in rat brain, and (2) whether enzyme inhibitors or Trp depletion affect [11C]5-HTP trapping in the rat brain. As [11C]5-HTP is metabolized in exactly the same way as endogenous 5-HTP and [11C]5-HIAA is the main radiolabeled metabolite contributing to the cerebral signal after 40 to 60 minutes, trapping of [11C]5-HTP should reflect the rate of 5-HT synthesis. 25
Both the microPET and biodistribution data indicate that carbidopa increases brain uptake (SUV) in a dose-dependent way, with the greatest effect occurring at a dose of 10 mg/kg. Increased tracer uptake in the brain could result from a decrease in the peripheral breakdown of [11C]5-HTP. The reduction of urinary radioactivity after carbidopa treatment, indicating decreased tracer excretion, confirmed this hypothesis. Carbidopa treatment does not influence Kacc or k3, indicating that AADC activity in the brain is the same as under control conditions. Therefore, we used 10 mg/kg carbidopa in all other treatment groups.
We expected to observe a large reduction of [11C]5-HTP trapping after inhibition of AADC in the brain with NSD, as this enzyme converts [11C]5-HTP to [11C]5-HT. Surprisingly, 100 mg/kg of NSD had no significant effect on tracer trapping. After inhibition of AADC with NSD, the total uptake of radioactivity may not be altered, because of the fact that PET cannot distinguish between [11C]5-HT and [11C]5-HTP. In order to see differences in k3 or Kacc, [11C]5-HTP should exit the brain and not be trapped. Such trapping was in fact measured in rat brain by Lindner et al. 25 In a study with [11C]5-HTP in monkeys, the brain uptake of radioactivity was even increased after administration of NSD 1015, although a decrease in Kacc was observed. 33 The observed increase of radioactivity in monkey brain could be due to inhibition of peripheral AADC by NSD 1015, an effect which we also observed in rats after carbidopa treatment. There seems to be a species difference between monkeys and rats, where the k3 in monkeys is influenced by NSD 1015 and in rats, it is not.
Besides NSD 1015, we examined the effect of PCPA, an inhibitor of the enzyme TPH, which is located upstream in the 5-HT synthesis pathway. Surprisingly, PCPA had a significant effect on TACs calculated from the microPET data and SUV values from the biodistribution study. Tryptophan hydroxylase inhibition additionally decreased k3, and tended to decrease Kacc. As neither [11C]5-HTP nor [11C]5-HT are a substrate for TPH, these were surprising findings. Decreases in SUV and k3 in the brain coincided with a decrease of the levels of total Trp in plasma, although Trp levels were not correlated with any of these values. The most likely explanation is that PCPA competes with [11C]5-HTP for transport over the blood–brain barrier. Competition at the level of LAT is highly probable, as PCPA has been shown to compete with Trp for blood–brain barrier transport. 34 However, this competition should influence the K1 (and thus Kacc), but not the decarboxylase activity rate constant of AADC (k3). Another explanation is that reduced 5-HT synthesis (by inhibition of the rate-limiting enzyme TPH) also influences enzymatic activity more downstream, e.g. AADC activity.
Trp depletion did not affect the brain uptake of [11C]5-HTP, although it increased tracer excretion via the renal route. We expected to see a decrease in the levels of total and free (unbound) Trp in plasma, but only the free fraction was found to show a decline. The relatively minor effect of the low-Trp diet on plasma levels of free Trp explains why we could not measure any effect on serotonin synthesis rates in the brain.
An interesting observation in biodistribution studies was the high specific trapping of radioactivity in the pancreas. This may be physiologically meaningful, because 5-HT regulates insulin secretion by β-cells in the islets of Langerhans. 35 Indeed, both in vitro and in vivo studies of our laboratory have shown that serotonin synthesis and trapping of [11C]5-HTP and its metabolites in rat pancreas are specific to the β-cells compared with exocrine cells. 36 So this may be an interesting finding for future studies on imaging of pancreatic β-cells.
In summary, almost all results indicate that assessment of the validity to use [11C]5-HTP-PET as a measure for 5-HT synthesis rates in rat failed to convincingly show alterations in response to various interventions. Drug effects on enzyme and transport activities in the metabolic pathway of [11C]5-HTP cannot always be distinguished, probably causing the aforementioned problem. Kinetic modeling is based on a mathematical approximation, and it may be hard to relate individual k values to a physiologic process. A simplified model, like the 2TCM, may pool multiple metabolic steps into a single mathematical compartment and the data presented here does not allow us to accurately decompose this process. This is probably also the reason why Lindner et al. 25 could find a difference in k3 after NSD 1015 treatment, as they quantified all the different metabolites of [11C]5-HTP post mortem, in brain homogenates. Thus, they knew exactly how much radioactivity belonged to a certain compartment of the kinetic model. A PET camera cannot distinguish different radioactive species, and although K4 seems negligible, other processes like transport and retention of unmetabolized [11C]5-HTP could influence the model parameters. Eventually, this may lead to ambiguity of the individual k values. A major source of variation may be the low uptake of [11C]5-HTP in rat brain.
Although our data indicate that [11C]5-HTP is not useful for measuring serotonin synthesis in rat brain, the tracer may be useful in primates, as inhibitors of central AADC reduce the measured values of k3 and Kacc in monkeys. 33
CONCLUSION
Further validation of [11C]5-HTP for measurement of 5-HT synthesis rates in human brain is definitely of great interest, especially for evaluation of 5-HT synthesis rates in patients with major depression. But based on our current data, [11C]5-HTP and microPET are not suitable for pharmacodynamic studies in the rodent brain.
Footnotes
The authors declare no conflict of interest.
ACKNOWLEDGMENTS
We would like to thank Jurgen Sijbesma for the assistance during the scanning procedure and Hilde K. Dekens, Janet Hessels-Schepers, and Michel de Vries for tracer production. In addition, we would like to thank Ania A Rybczynska for her assistance during the scanning.