
Abstract
The tracer [11C]-α-methyl-L-tryptophan (αMTP) has been used to measure brain serotonin synthesis rates with positron emission tomography (PET). To address questions about the accuracy of the kinetic model, [14C]αMTP was used to directly measure conversion to [14C]-α-methyl-serotonin (αM5HT) in monkeys that had been previously studied with PET and [11C]αMTP. Four male, fasted, isoflurane-anesthetized rhesus monkeys were studied with [11C]αMTP and PET. Immediately after the initial 3-hour scan, a second dose of [11C]αMTP was coinjected with 1 mCi of [14C]αMTP, and additional PET data were collected. Approximately 90 minutes after the second αMTP administration, the animals were killed with an overdose of phenobarbital, and brain samples from 21 regions were taken and analyzed by HPLC. Minimal conversion of αMTP to αM5HT occurred; HPLC analysis of 14C radioactivity showed that greater than 96% of the total counts were in fractions corresponding to the αMTP peak. Brain concentrations of serotonin, tryptophan, 5-hydroxyindole-3-acetic acid, and αMTP also were determined fluorometrically using external quantification. Patlak plots generated from PET images acquired over 3 hours showed no time period of linear increase, and final slopes were not significantly different from zero, consistent with the finding of minimal conversion to [14C]αM5HT. These data indicate that in the 3-hour period after injection, [11C]αMTP is acting predominantly as a tracer of tryptophan uptake, not serotonin synthesis.
Keywords
Based on the work of Diksic et al. (Diksic et al., 1990, 1991; Nagahiro et al., 1990), several groups, including ourselves, have attempted to use [11C]-α-methyl-L-tryptophan (αMTP) and positron emission tomography (PET) imaging for the determination of brain serotonin synthesis rates (Chugani et al., 1997, 1998a, 1998b; Nishizawa et al., 1997, 1999; Muzik et al., 1997; Shoaf et al., 1998). During our analysis of data from anesthetized rhesus monkeys (Shoaf et al., 1998), we became aware of some possible shortcomings with the tracer, whereas others were highlighted by the work of Muzik et al. (1997).
In theory, αMTP first acts as a tracer of tryptophan uptake into the brain. Then, in serotonergic neurons, αMTP is converted to α-methyl-serotonin (αM5HT). Because αM5HT is not a substrate for monoamine oxidase, it accumulates in the brain. Data from rats indicate that the uptake of radioactivity given as [14C]αMTP was irreversible (Missala and Sourkes, 1988). Thus, by measuring the accumulation of radioactivity in the brain over time, it may be possible to calculate the serotonin synthesis rate based on the same model used to calculate glucose utilization with 2-deoxyglucose (Sokoloff et al., 1977). However, there are important kinetic differences between αMTP and 2-deoxyglucose, both in transport and metabolism resulting from differences in the transporter, enzyme kinetics (Vmax and Km), and substrate concentrations.
The model for αMTP or 2-deoxyglucose involves estimation of the rate of uptake (K*) into the trapped compartment, representing αM5HT or deoxyglucose-6-phosphate, respectively. This measurement can be performed once the precursor pool (i.e., the unmetabolized tracer in the brain) reaches equilibrium with that in the plasma. At this time, the Patlak plot becomes linear, and the slope of this line, K*, can be determined (Patlak et al., 1983). However, the half-life of αMTP in the precursor pool to reach equilibrium is much longer than that of deoxyglucose (Muzik et al., 1997), resulting from the lower extraction of αMTP from plasma. Thus, as shown by the nonlinearity, early postinjection data are not suitable for use in estimating K*. Based on PET scan data taken over a 1-hour period after administration of [11C]αMTP to humans, Muzik et al. (1997) estimated the half-life of αMTP in the precursor pool to be 15 to 20 minutes. Therefore, the apparent steady-state between the precursor pool and plasma may not be achieved until approximately 80 minutes (five half-lives). In our previous study in rhesus monkeys, Patlak plot analysis of PET data showed no time periods of linearity over 90 minutes (Shoaf et al., 1998).
Unlike 2-deoxyglucose, which is rapidly phosphorylated to deoxyglucose-6-phosphate, the conversion of αMTP to αM5HT is slow. In rats, Diksic et al. (1990) showed that only 31% of the radioactivity in the dorsal raphe nucleus was present as αM5HT at 60 minutes after injection of [14C]αMTP. Gharib et al. (1999) report that, at 60 minutes after αMTP injection, the percentage of radioactivity present as αM5HT in the raphe dorsalis, raphe centralis, and the mesencephalic reticular formation was 20%, 11%, and 4%, respectively. At 180 minutes, the percentage of αM5HT in each region was 52%, 28%, and 4%, respectively. These results, however, conflict with predictions of the percentage of radioactivity that is metabolized that can be inferred from the αMTP Patlak plots. Estimates of the amount of activity in the trapped or metabolized pool (i.e., αM5HT) can be made by multiplying the estimated Patlak K* by the integral of the plasma input function. Previous estimates of αM5HT from data obtained between 30 and 60 minutes, in humans and monkeys, suggest that αM5HT should account for a considerably higher percentage of the total counts than was found in the rat studies (Chugani et al., 1998b; Shoaf et al., 1998). Patlak plots of PET data from monkeys, between 60 and 90 minutes, provide lower estimates of αM5HT, but the values predicted still are higher than would be expected from the rat data. This inconsistency between measurements of metabolized tracer and the model predictions of serotonin synthesis rate suggests that the model estimates are incorrect, perhaps because the time for the precursor pool to reach equilibrium is significantly longer than previously estimated (Shoaf et al., 1998; Gharib et al., 1999).
We performed a PET study to further examine αMTP as a tracer for serotonin synthesis. Scanning for a longer period of time with a more sensitive instrument would permit maximum accumulation of αM5HT and determination of a truly linear portion of the Patlak plot. Thus, we performed an experiment in which four rhesus monkeys, anesthetized with isoflurane, were scanned for 3 hours in a high-sensitivity three-dimensional PET scanner after the administration of a usual tracer dose of [11C]αMTP. Immediately after the first [11C]αMTP administration, we performed a second PET scan for 1 hour after the administration of a mixture of [11C]αMTP and [14C]αMTP. Since the only way to assess the accumulation of αM5HT is to measure its concentration after an administration of αMTP, the animals then were killed, and brain tissues were sampled for the determination of [14C]αM5HT and [14C]αMTP concentrations. This paired study design also permitted the assessment of any effect of the additional dose of unlabeled αMTP in the second run resulting from the coinjection of [14C]αMTP.
METHODS
Animals
Four male rhesus monkeys were individually housed according to the National Institutes of Health Animal Care and Use Guidelines. All procedures were approved by the National Institute on Alcohol Abuse and Alcoholism Animal Care and Use Committee (protocol LCS-82). Animals weighed 6.9 to 8.2 kg and were 12 to 20 years old. The day before the PET study, the animals were fasted with only water available from 7 PM. On the day of the study, animals were transported to a surgical suite, anesthetized with ketamine (10 mg/kg intramuscularly) and given intramuscular injections of penicillin G procaine/benzathine (0.15 mL/kg) and glycopyrrolate (0.055 mg/kg). An intravenous catheter was inserted in the saphenous vein, and a drip of sterile physiologic saline was started. Sodium pentobarbital (9 to 13 mg/kg intravenously) was administered before the animal was intubated. The animals then were placed under inhalation anesthesia (isoflurane) for the insertion of a femoral artery catheter, which was sutured and taped in place after being flushed with 1 mL of 10 U/mL heparin. For transport to the PET suite, the animals were given another intramuscular dose of ketamine. Once in the PET suite, inhalation anesthesia with isoflurane was resumed. Heating pads were used to maintain body temperature. Electrocardiogram, blood pressure, respiratory rate, and end-tidal PCO2 monitoring were used to regulate the depth of anesthesia. [11C]αMTP was administered at least 2.5 hours after the initial induction of anesthesia with ketamine so any effects of ketamine or pentobarbital would be minimal, and any medication effects would primarily result from isoflurane.
Imaging
A GE Advance scanner (General Electric, Waukesha, WI, U.S.A.) (4.25-mm slice separation, reconstructed resolution approximately 6 mm in all directions) was used with the interplane septa removed. During the two PET procedures, the animals were positioned prone in a stereotaxic frame designed for use in the scanner. A lead shield, approximately 6-mm thick, was placed around the chest of the animal to minimize scatter and random counts from this region.
Scan 1. A transmission scan was obtained for attenuation correction before injection of the tracer. Two injections of 15 mCi of [15O]water were performed, and 60-second scans were acquired. These images were averaged and used for image registration and region of interest placement. A 3-mL sample of arterial blood was taken for the determination of free and total plasma tryptophan. The radiopharmaceutical [11C]αMTP was prepared according to the method of Schmall et al. (1995). The dose of 11 to 15 mCi (specific activity Ci/mmol, mean 187, range 24 to 320) was injected intravenously through the saphenous vein catheter over a 1-minute period using an infusion pump. Scanning continued for 3 hours, and 30 arterial blood samples were drawn for the determination of [11C]αMTP whole blood and plasma concentration curves; each blood sample had a volume of 0.5 mL. Since no metabolites of αMTP are present in blood or plasma samples, samples were directly counted on a Packard Cobra Auto-gamma counter.
Scan 2. The second scan of 1-hour duration was begun 20 to 30 minutes after the completion of the first scan. A mixture of [14C]αMTP and [11C]αMTP was administered intravenously over a 2-minute period using an infusion pump. The αMTP mixture contained 1 mCi of [14C]αMTP (specific activity 56 mCi/mmol, radiochemical purity above 99%, 100% L form; Moravek Biochemicals, Brea, CA, U.S.A.) and 10 to 17 mCi of [11C]αMTP (specific activity, Ci/mmol, mean 152, range 52 to 260) in 15 to 20 mL of a solution of 5 mL of ethanol, 5 mL of water, and the rest, physiologic saline. Twenty-four arterial blood samples were taken and analyzed as described earlier.
Data analysis
Based on the model of Diksic et al. (1990, 1991), the serotonin synthesis rate is calculated as follows: R = K* · Cp/LC, where K* is the net influx constant of αMTP (μL/min/mL), Cp is the free plasma tryptophan concentration (nmol/mL), and LC is the lumped constant with a value of 0.18 for rhesus monkeys (Shoaf and Schmall, 1996). K* was calculated using a variant of the Patlak analysis (Patlak et al., 1983). The tissue concentration data [Ci(t), nCi/mL tissue] from each pixel over the specified time range are fit to the following linear equation:
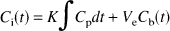
where Cp(t) is the measured plasma concentration of αMTP, Cb(t) is the whole blood concentration, and Ve is the exchangeable tissue volume (mL blood/mL tissue). The fit was performed pixel-by-pixel to estimate K* and Ve, and images of K* were obtained. To compare the data from this study to those obtained in our previous study (Shoaf et al., 1998), we repeated the analysis where we selected 30 to 60 minutes as the linear range.
Brains were outlined on the [15O]water scans and coregistered to the brain of one monkey by the gray scale matching technique (Thévenaz et al., 1995); cubic spline interpolation was used to determine pixel values on the registered scans. Regions of interest (4 × 4 pixels, 2 mm/pixel) were placed on the average water scan, and the K* values for each region of interest were determined using the registered scans.
Curve fitting
Irregular regions of interest were drawn on cortical regions (occipital, parietal, temporal, and frontal) on the [15O]water images, and time-activity curves were generated from the dynamic sequence of [11C]αMTP images. An average cortical time-activity curve was produced from the individual cortical time-activity curves. These tissue data were fit to a four-parameter model (Diksic et al., 1991; Muzik et al., 1997)
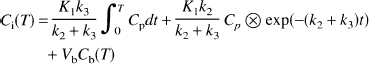
where K1 is the uptake rate constant (mL/min/mL), k2 is the tissue-to-blood clearance constant, k3 is the rate constant of αMTP trapping, and Vb is the tissue blood volume. The first two terms in the model equation correspond to the sum of the trapped and exchangeable radioactivity in tissue, and the third term is the vascular radioactivity. All model solutions included integration of the model over the duration of each scan. Scan data were weighted by the inverse of the square of the data SD. The latter was estimated for each scan as the ratio of the whole-brain mean activity to the square root of the noise-equivalent counts based on the relationship that the image coefficient of variation is inversely proportional to the square root of the noise-equivalent counts (Strother et al., 1990). Fits were performed for time periods 0 to 60 minutes and 0 to 180 minutes for the first scan in each animal. Fits also were performed with k3 fixed to 0 (three-parameter model).
Brain sampling
At 60 minutes after the second αMTP injection, the animal was removed from the stereotactic head frame, 0.8 mL of ketamine (intramuscularly) was administered, and the animal was transported to a pathology laboratory. At approximately 90 minutes after αMTP administration, an overdose of phenobarbital was administered intravenously. Dissection of the brain began 10 to 15 minutes later, after its removal from the cranium, and was completed in 10 to 15 minutes. Samples from 21 different regions (Table 1) were taken and frozen at −80°C.
Indoleamine concentrations (pmol/mg wet tissue)* in rhesus monkey brain
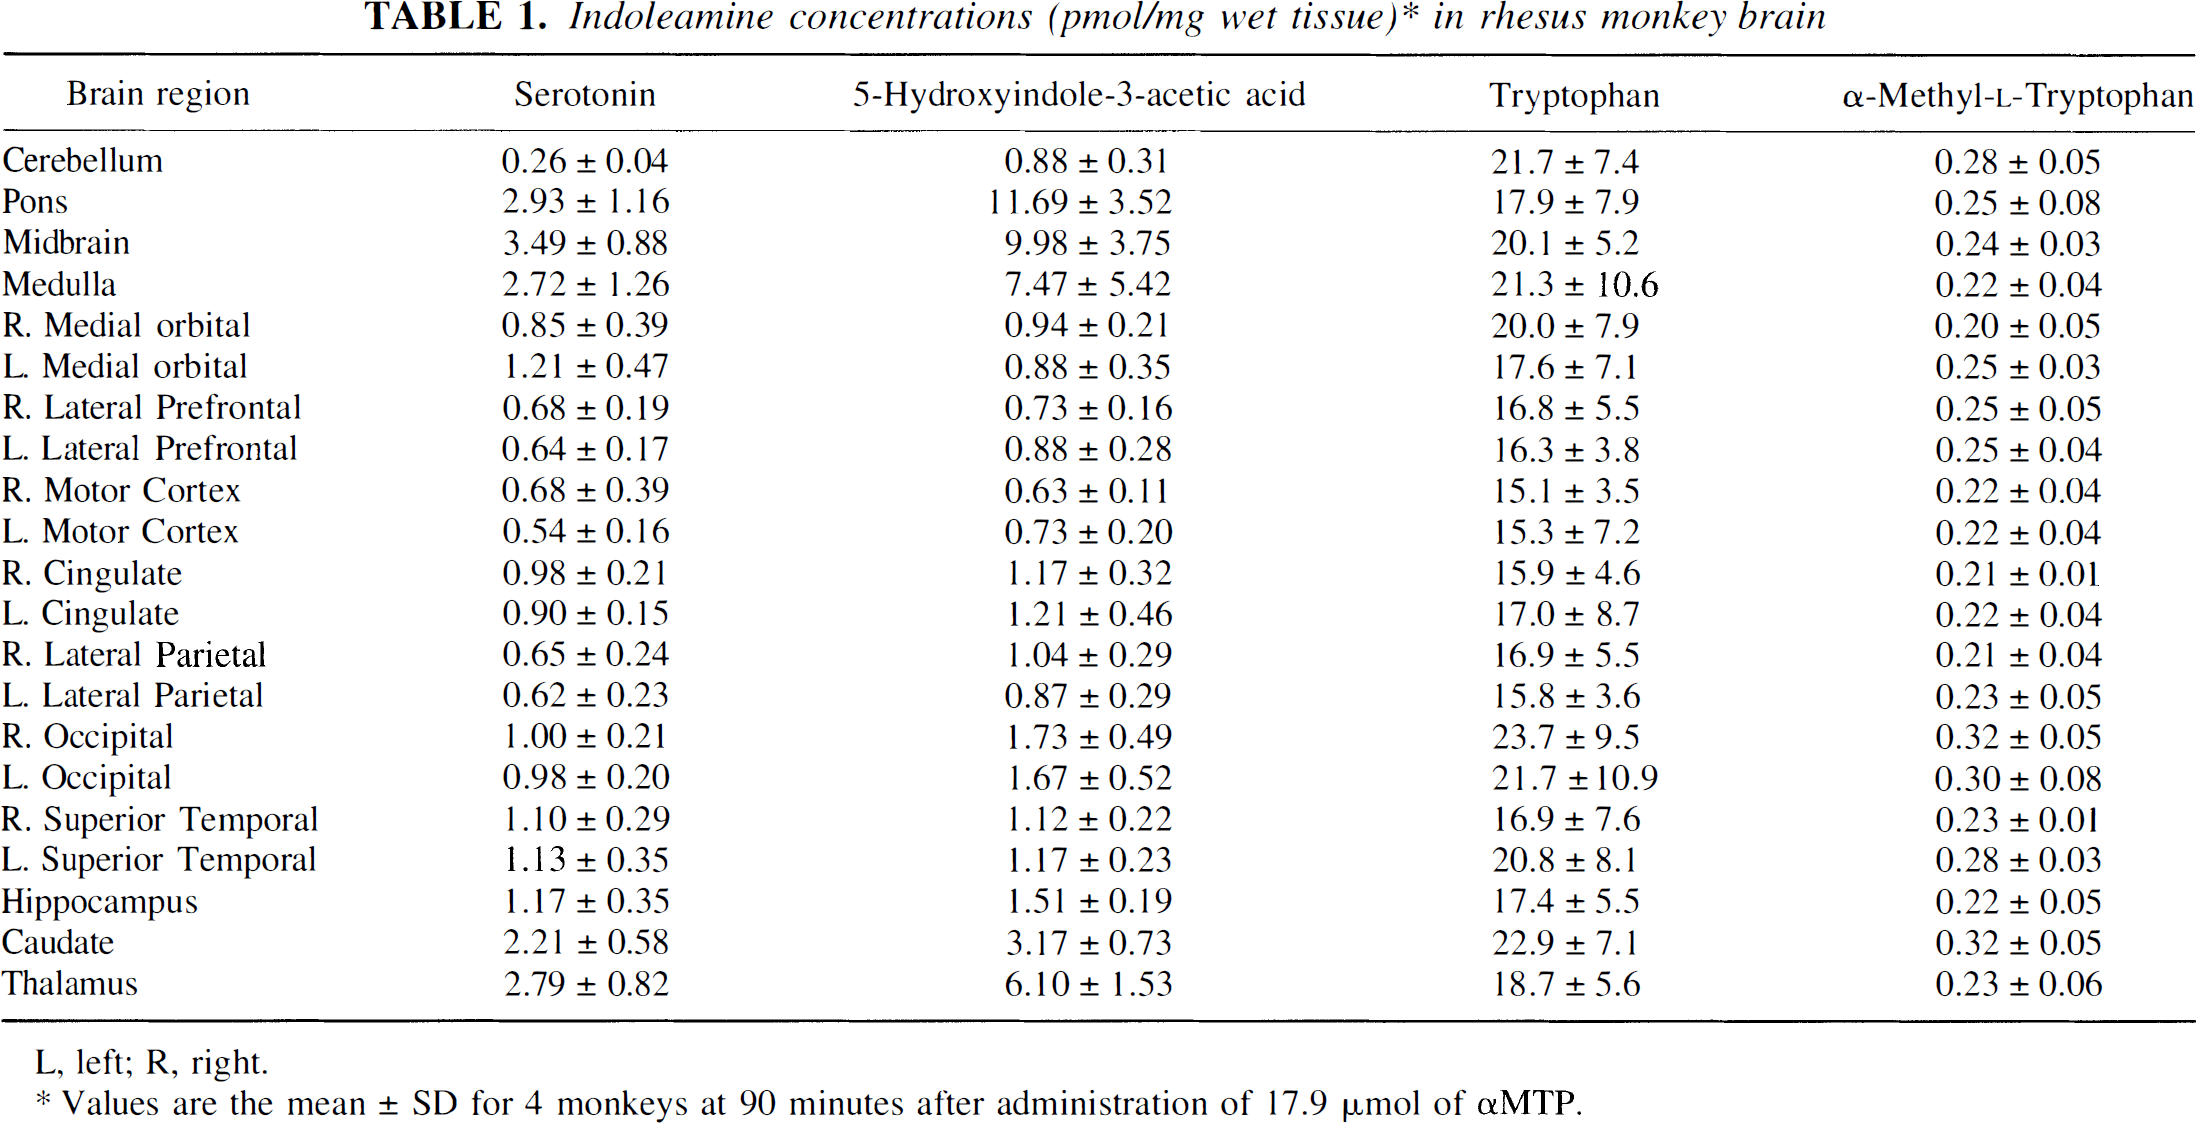
L, left; R, right.
Values are the mean ± SD for 4 monkeys at 90 minutes after administration of 17.9 μmol of αMTP.
Chromatographic assays
Free and total plasma tryptophan concentrations were determined by HPLC with fluorometric detection according to Shoaf et al. (1998).
Brain samples were analyzed for serotonin, α-methyl-5-hydroxytryptophan (αM5HTP), αM5HT, tryptophan, 5-hydroxyindole-3-acetic acid (5-HIAA), and αMTP concentrations using HPLC with fluorometric detection. Since detectable concentrations of 5-hydroxytryptophan (5-HTP) were not expected to be found, the HPLC separation was optimized for the other compounds, and quantitation of 5-HTP was not done.
Brain tissues were homogenized in a volume of buffer consisting of 0.1 N perchloric acid, 1% (volume [v]/v) ethanol, 0.02% ethylenediamine tetraacetic acid (weight/v), equal to the weight of the tissue rounded up to next highest 100 μL. One half of the cerebellum, pons, medulla, and midbrain were homogenized after being sliced down the midline. Tissue weights ranged from 175 to 1500 mg; the median size was 500 mg. The homogenate then was centrifuged at 5000 × g for 10 minutes; the supernatant was removed and placed in a microfuge tube, which then was centrifuged at 12,000 × g for 3 minutes. One hundred fifty microliters of supernatant was injected onto a Nova-Pak C-18 column, 300 × 4.6 mm (Waters, Milford, MA, U.S.A.). The mobile phase consisted of 100 mmol/L citrate, 100 mmol/L sodium acetate, and 0.03 mmol/L ethylenediamine tetraacetic acid buffer, methanol, and 4 N perchloric acid (ratio 94/5.5/0.5 v/v/v) run at 0.9 mL/min. External quantification was used. To determine calibration curves, an aliquot of stock solution of standards in homogenizing buffer (frozen at −80°C until day of assay) were diluted in water and then diluted 1:1 with homogenizing buffer; 150 μL was injected. If the serotonin peak was offscale, remaining supernatant was diluted with homogenizing buffer that had been diluted 1:1 with water, and 150 μL was injected. Fluorometric recoveries of the compounds of interest, except 5-HTP, were determined by spiking rat brain tissues that had been finely diced by razor blade. They then were homogenized as described earlier. The recovery of α-methyl compounds was more than 95%. The recovery of the added nonmethyl compounds was more than 95% (data not shown).
The eluent from the HPLC was collected in 1-minute fractions. Ten milliliters of Bio-Safe II (Research Products International, Corp., Mt. Prospect, IL, U.S.A.) was added to each fraction and counted four different times in a Scintillation counter (Beckman, model LS 6000) for 14C activity. Background counts were subtracted from reported disintegration per minute (DPM) values. Recovery of 14C from brain tissue was determined by spiking samples of finely diced cold monkey brain tissue with [14C]αMTP stock solution, homogenizing as described earlier, and counting the fractions of HPLC eluant. Recovery of [14C]αMTP was more than 96% (data not shown). Recovery of total 14C radioactivity was determined by comparing the total counts in the HPLC fractions to the total counts in the original brain homogenate supernatant and was found to be approximately 95%; the tissue pellet was found to contain less than 2% of the supernatant counts.
RESULTS
Total and free plasma tryptophan concentrations were measured in plasma samples taken before and immediately after the PET scans. Beginning concentrations were 25.9 ± 1.2 and 7.5 ± 2.7 nmol/mL, respectively. Ending concentrations were 24.3 ± 1.6 and 7.9 ± 3.5 nmol/mL, respectively. This confirms that the study was performed under conditions in which tryptophan concentrations were stabilized.
Mean concentrations of serotonin, 5-HIAA, tryptophan, and αMTP (pmol/mg wet tissue) for 21 brain regions are presented in Table 1. Because of the low specific activity of the [14C]αMTP (56 mCi/mmol), 17.9 μmol of αMTP was administered to each animal, and this produced fluorometrically measurable brain tissue concentrations. However, αM5HTP or αM5HT concentrations in all tissues were below the level of detection, 0.2 pmol/mL and 10 pmol/mL, respectively. Tryptophan and αMTP brain concentrations were highly correlated with a range of r = 0.607 to 0.837 (p < 0.001). No other correlations were statistically significant.
Scintillation counting of 1-minute fractions of HPLC eluant revealed that more than 96% of all counts were present in those fractions (20, 21, 22, 23) belonging to αMTP (Table 2). An average of 0.61 ± 0.07% of the counts were present in the solvent front (fractions 3 and 4, labeled as unknown 1). Counts in these fractions also were present after injections of the standard and amounted to less than 1% of the total counts (data not shown). An average of 2.02 ± 0.19% of the counts eluted in fractions 9 and 10 (labeled as unknown 2). Counts in these fractions were also present after injections of the standard and amounted to less than 1% of the total counts (data not shown). Counts in fractions 11 and 12 were assigned to αM5HT (Fig. 1) (note the log scale for y axis).
Percent of total DPMs for peaks in HPLC eluate of rhesus monkey brain regions*
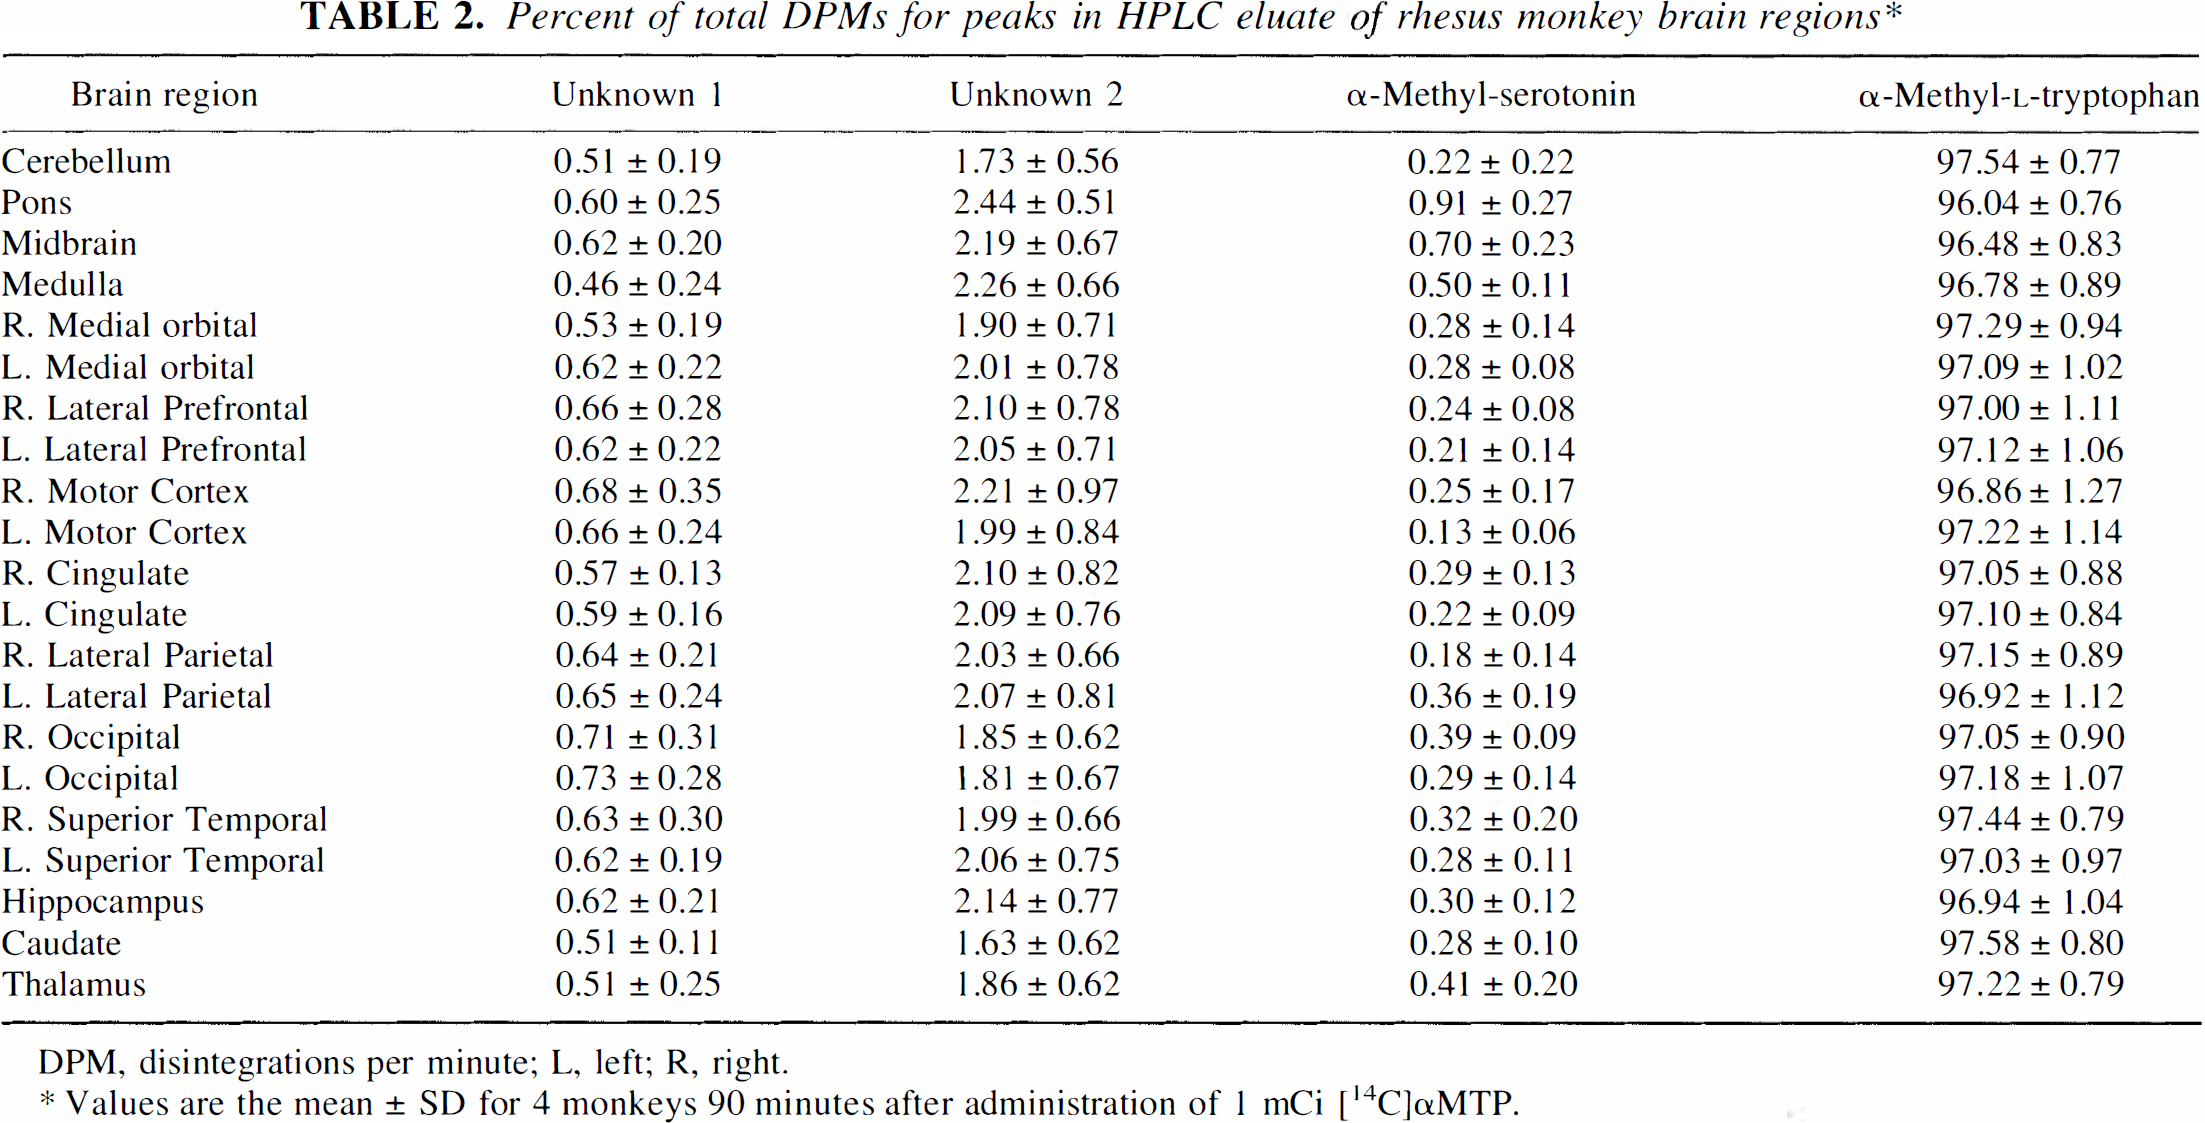
DPM, disintegrations per minute; L, left; R, right.
Values are the mean ± SD for 4 monkeys 90 minutes after administration of 1 mCi [14C]αMTP.
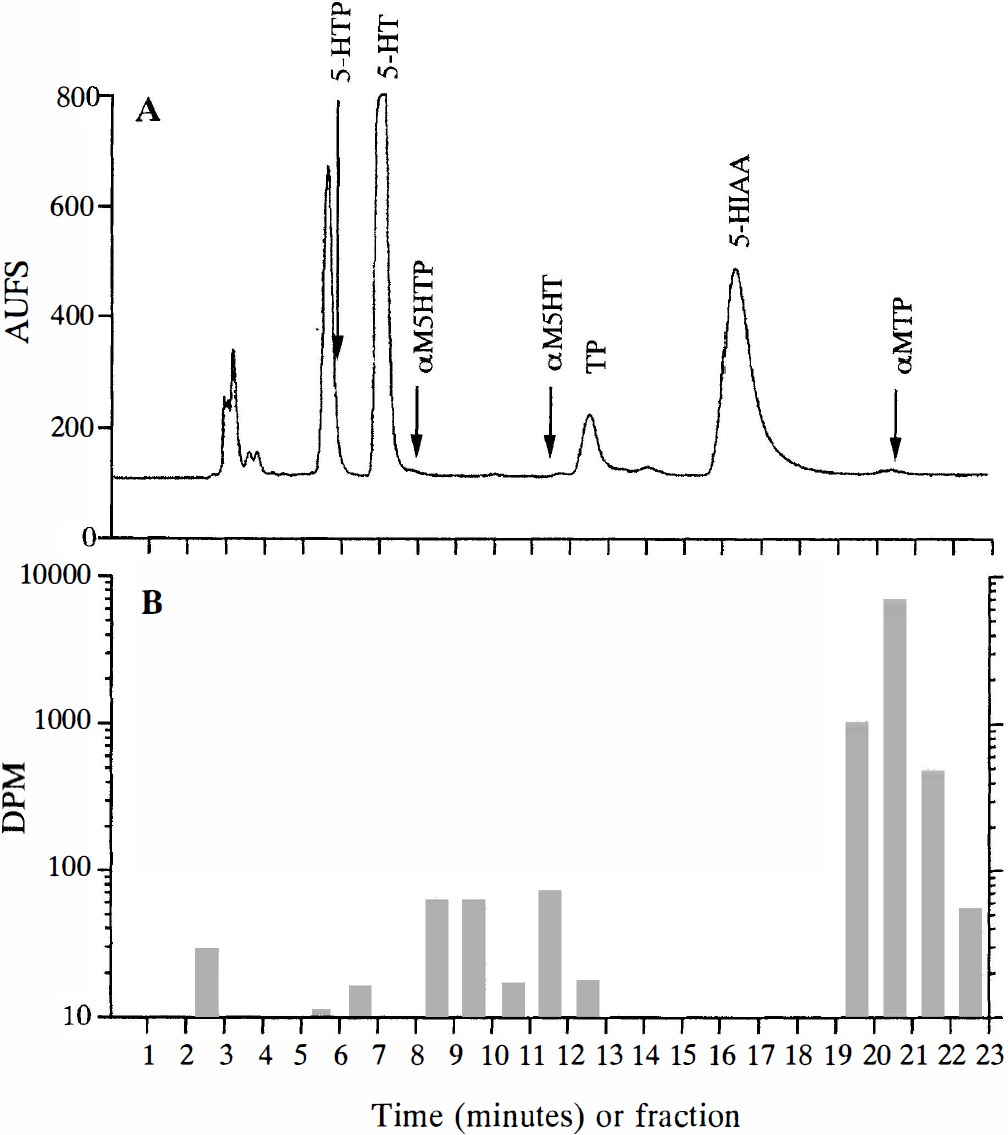
In cortical regions, αM5HT accounts for an average of 0.3% of the total 14C radioactivity. The tissues with the highest radioactivity in fractions corresponding to the αM5HT peak were the midbrain and the pons. The dorsal raphe nucleus (an area reported to have a high serotonin synthesis rate [Diksic et al., 1990)] is a structure centered on the midline approximately 2 mm wide in the midbrain of the rhesus monkey, so determining the percentage of total DPM associated with αM5HT (range 0.47% to 0.96%) in half of the midbrain would have diluted DPM found in the raphe nucleus. In a second analysis, the remaining half of two of the midbrains were dissected into three sections, approximately 2 mm wide, by cuts parallel to the midline. The percentage of total DPM associated with αM5HT in the innermost section was increased compared with that found in the entire half of the midbrain by a factor of two to four (2.1 versus 0.52, and 0.95 versus 0.47). Since the raphe is reported to be approximately 2 mm wide centered on the midline, it is possible that the percentage of measured counts from αM5HT still is 50% lower than what would be measured if the raphe nucleus had been analyzed free of other tissue.
Analysis of K* images
K* values (derived from fits of data 30 to 60 minutes after injection) for the first and second PET scans are presented in Table 3. No significant differences were seen between runs; thus, there was no measurable effect of the additional unlabeled αMTP on the tracer uptake, as expected, or an effect of prolonged anesthesia. None of the regional K* values were significantly different from those given by Shoaf et al. (1998).
K values* from PET data obtained between 30 to 60 minutes
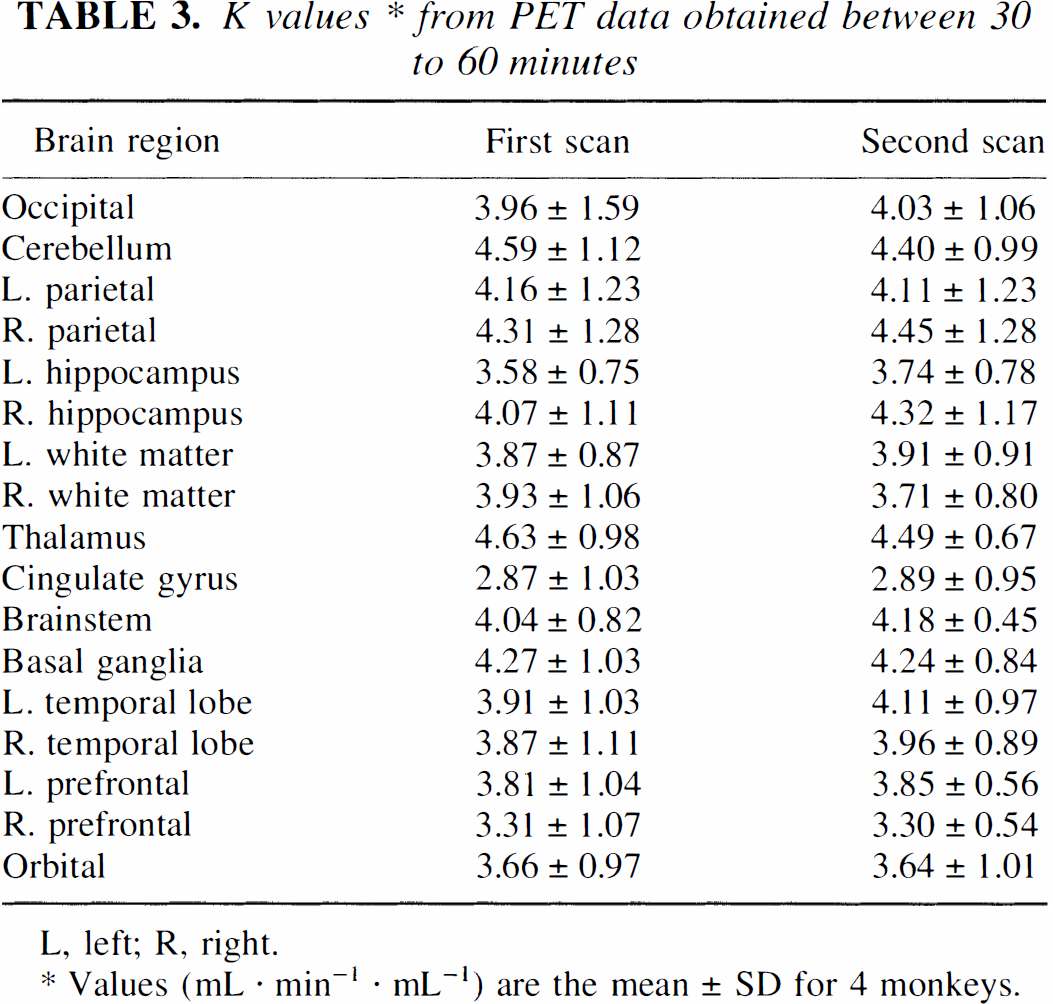
L, left; R, right.
Values (mL · min−. mL−1) are the mean ± SD for 4 monkeys.
Curve fitting
Figure 2 shows an example of a fit to the mean cortical curve using the four-parameter model (solid line) and a three-parameter model with k3 fixed to 0 (dashed line). Fits to the four-parameter model showed a statistically significant improvement over the three-parameter model by the F test (p < 0.01). However, both models show lack of fit, as evidenced by nonrandom residuals. This lack of fit remained, even when only 60 minutes of data were fitted. From the fits of the average cortex curves from 0 to 60 minutes, the parameter values (mean ± SD) were as follows: K1, 0.012 ± 0.003 mL/min/mL; k2, 0.036 ± 0.008 min−1; k3, 0.020 ± 0.010 min−1; Vb, 0.048 ± 0.018 mL/mL; and K*, 4.3 ± 1.7 μL/min/mL. These fitted K* values agreed well with the Patlak fitted values (30 to 60 minutes) of 4.1 ± 1.1 μL/min/mL. These values are similar to those obtained by Muzik et al. (1997) in awake human subjects.
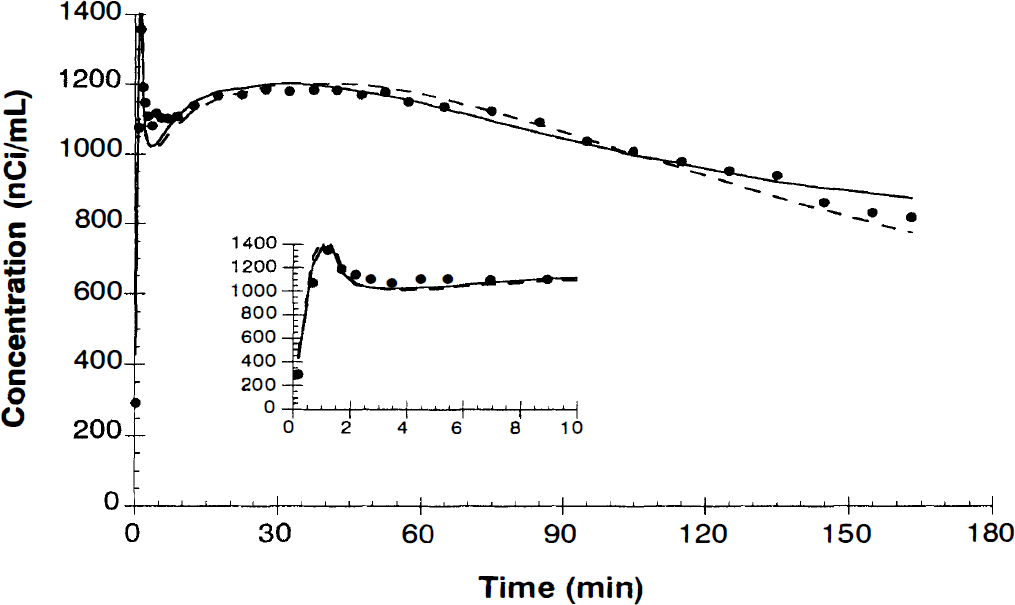
Example of fit of [11C]-α-methyltryptophan ([11C]αMTP) time-activity curve. Symbols are the mean values in cortical regions of interest. The dashed line represents the best three-parameter fit with k3 fixed to 0. The solid line shows the best four-parameter fit with k3 floating. Inset shows first 10 minutes of data on an expanded scale.
Ideally, the fitted parameters would be independent of the duration of the data used for fitting. However, on extending the fitting procedure to 180 minutes, there was a statistically significant change (p < 0.05, two-tailed t test) in all parameters: K1, 0.010 ± 0.002 mL/min/mL; k2, 0.018 ± 0.003 min−1; k3, 0.003 ± 0.001 min−1; Vb, 0.053 ± 0.017 mL/mL; and K*, 1.7 ± 0.7 μL/min/mL. This reflects decreases of 48%, 83%, and 61% in k2, k3, and K*, respectively, suggesting that kinetic parameters including K* values determined from only 60 minutes of data may be significantly overestimated.
Based on the fitted parameters, the model can predict the fraction of the total radioactivity that will be in the trapped pool at any time. From the parameters of the 60-minute fit, the predicted fraction of metabolized tracer (i.e., αM5HTP and αM5HT) at 90 minutes was 76 ± 24%. From the parameters of the 180-minute fit, the predicted metabolized fraction at 90 minutes was much lower, 23 ± 6%. However, both predicted values were much higher than the 14C measured value of 0.3%. This suggests that none of the estimated model parameters (60- or 180-minute values) are valid.
Patlak analysis
Figure 3 shows Patlak plots for 3 hours of scanning data (corresponding to 400 to 450 minutes of transformed time) for each of the four animals (dashed lines) and the average (solid line). Previous analysis of these curves have used the time period of 30 to 60 minutes after injection, which corresponds to approximately 60 to 120 minutes of transformed time. Examination of this portion of the plot (without benefit of the remainder of the curve) could permit the assertion that this is the linear portion of the curve and is suitable for estimation of the uptake rate constant, K*. However, clearly as time proceeds, the Patlak curve continues to roll off, with minimal or no positive slope in the final data values. Thus, Patlak slopes taken from 30 to 60 minutes will substantially overestimate the true tracer uptake rate. Estimation of the final slope using values from 300 minutes of transformed time on, leads to estimates of K* of 0.5 ± 0.7 μL/min/mL, which are not significantly different from zero; the average statistical uncertainty (standard error) of K* from the Patlak fits from 300 minutes of transformed time on was 0.3 μL/min/mL. This final slope value is much lower than the value obtained from 30 to 60 minutes of approximately 4 μL/min/mL.
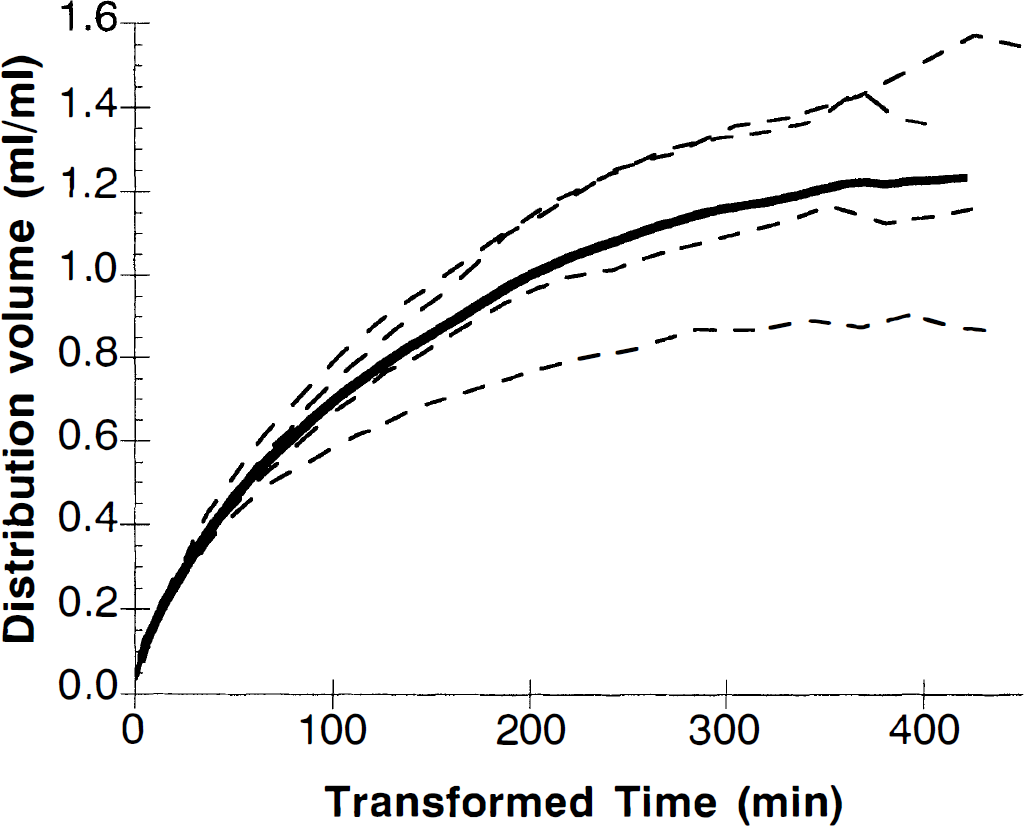
Patlak analysis of [11C]-α-methyltryptophan ([11C]αMTP) study in four rhesus monkeys. The dashed lines represent the mean cortical Patlak curve after interpolation of the four individual curves to a common time base. After the Patlak transformation, 180 minutes of true time corresponds to 400 to 450 minutes of transformed time.
DISCUSSION
In our previous PET study where [11C]αMTP was given to monkeys with CSF 5-HIAA concentrations ranging from 152 to 356 pmol/mL, we found that calculated serotonin synthesis rates were not correlated with 5-HIAA concentration, a marker of central serotonin activity (Shoaf et al. 1998). We also were concerned that (1) Patlak plots did not seem to have any linear portions, and (2) the predicted amounts of trapped radioactivity (e.g., αM5HT concentrations) seemed too high when compared with actual [14C]αM5HT concentrations measured by Diksic et al. (1990). Our doubts about the actual percentage of αMTP converted to αM5HT were confirmed when a rat study (Gharib et al., 1999) found that Patlak estimates would be erroneous because of the slow equilibration of the precursor pool.
In our anesthetized monkeys, we found approximately 2% to 4% of the total radioactivity in the dorsal raphe nucleus was [14C]αM5HT after 90 minutes. This is considerably lower than the 31% (Diksic et al., 1990) or 20% (Gharib et al., 1999) reported for the awake rat 60 minutes after [14C]αMTP administration. It is doubtful that isoflurane anesthesia would suppress serotonin synthesis rates to such a great extent. If serotonin synthesis rate is tightly coupled to αMTP uptake and anesthesia does suppress serotonin synthesis rate, then K* should be lower in anesthetized subjects. However, Chugani et al. (1997) report no differences in the uptake rates of αMTP (K*) in normal adults and children who were scanned without anesthesia or after the administration of either midazolam or phenobarbital (Nembutal). It is more likely that serotonin synthesis rates in larger animals are slower than those in rats and may be suppressed by anesthesia. Low oxygen tension, an inhibitor of tryptophan hydroxylase activity, would not be a problem in these animals, since the isoflurane is carried in 100% oxygen, and PO2 concentrations typically are near 400 mm Hg.
For PET scanning, cortical regions are most easily imaged. Accurate quantification of a region such as the dorsal raphe nucleus cannot be performed because of its small volume. Serotonin synthesis rates in cortical brain regions are reported to be lower than in dorsal raphe nucleus (Nagahiro et al., 1991). We found that αM5HT-associated radioactivity in cortical regions ranged from 0% to 0.63% of total DPM (see Table 1); therefore, only a tiny fraction of the PET signal in cortex is caused by metabolized αMTP.
The 14C data and the terminal Patlak slopes suggest that little [11C]αMTP is being metabolized into [11C]αM5HT. If so, it would be expected that the time-activity data would be well described by a model with a single-tissue compartment and three parameters (K1, k2, and Vb). Although this model does not fit the data extremely well (Fig. 2, dashed line), the fit is not poor. The estimates of the distribution volume (K1/k2) for this model were 0.73 ± 0.18 mL/mL, reasonable values for a substrate of the large neutral amino acid transporter. Furthermore, adding the term k3 for irreversible trapping (Fig. 2, solid line), while showing a statistically significant improvement in the fit, does not solve all of the lack of fit in the data. Because of the lack of fit, the model parameters vary with the fitting period. It is likely that other factors such as tissue heterogeneity and the partial volume effect are contributing to the lack of fit.
Unlike Chugani et al. (1998b), we found no correlation between serotonin concentration and K* values (Fig. 4). We found that the pattern of distribution of serotonin and 5-HIAA concentrations (Table 1) matches that found by Brown et al. (1979) for young adult rhesus monkeys; our values are slightly higher because of the older age of our monkeys. Brown et al. (1979) also report that, for rhesus monkeys treated with NSD-1015 (an amino acid decarboxylase inhibitor), “the accumulation of 5-HTP does not parallel serotonin levels.” Therefore, it may be the case that serotonin concentration is not a good indicator of serotonin synthesis rate.
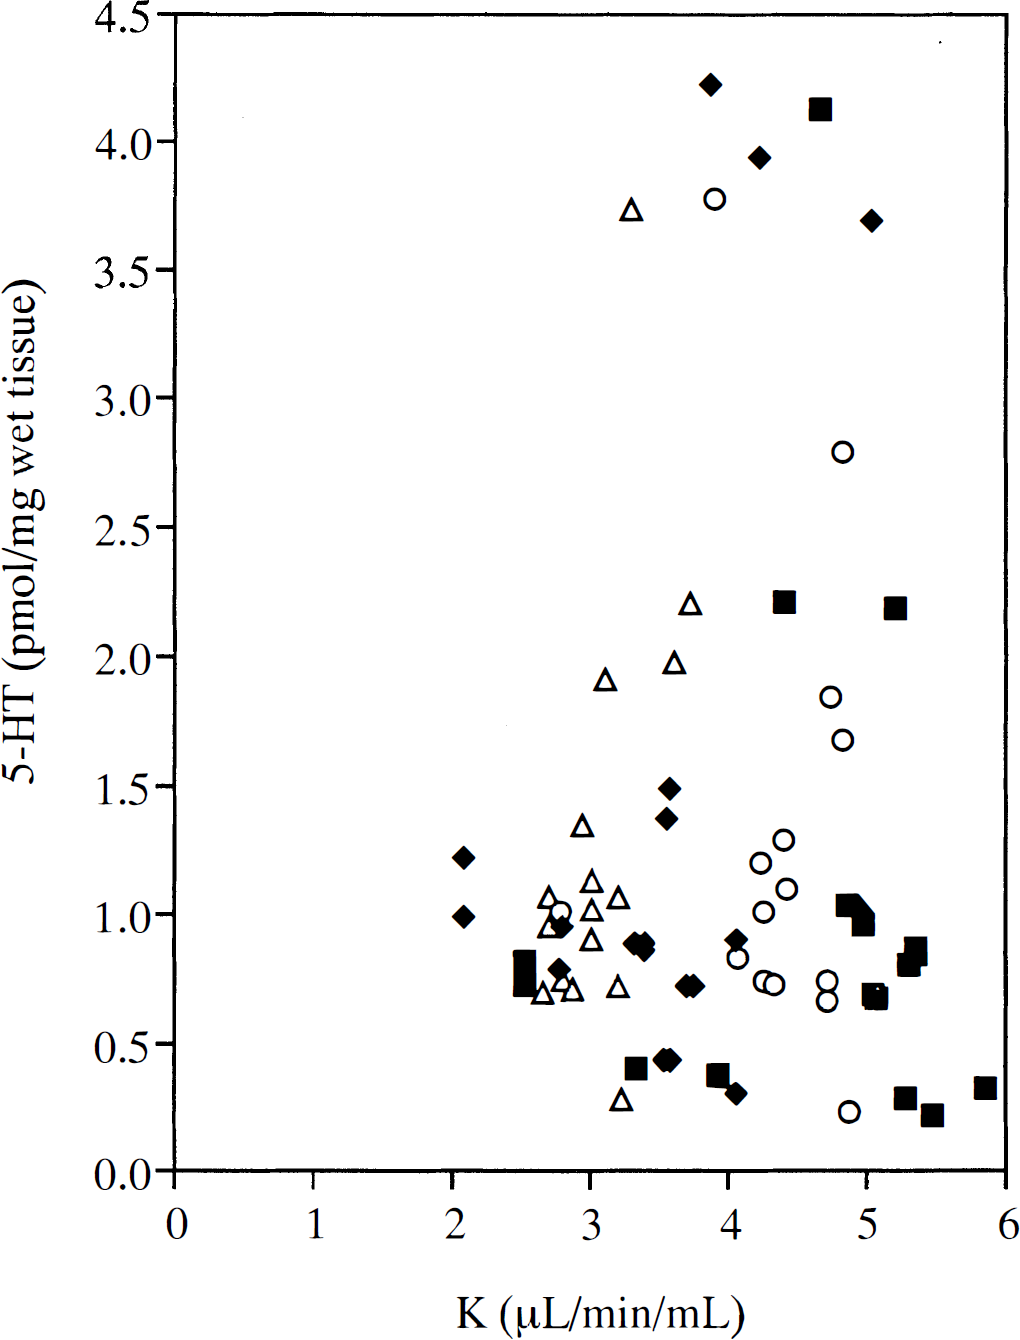
Plot of serotonin concentration (pmol/mg wet tissue) versus K* value (mL/min/mL, determined from 30 to 60 minutes of positron emission tomography data) for four rhesus monkeys; each symbol represents a different animal (see Methods for details).
The net influx of a tracer is measured from the linear portion of a Patlak plot. The plot becomes linear once the reversible compartments (e.g., unmetabolized αMTP) reach equilibrium with the plasma. However, it is often difficult to precisely define the linear portion of a Patlak plot. The rise and rollover of this curve toward its asymptotic slope may be slow, particularly for tracers with low transport rates. The kinetics of αMTP are indeed slow, in part because of the poor blood-brain barrier transport using the large neutral amino acid transporter. Another PET tracer transported in this manner, [18F]fluoro-DOPA, also is analyzed using Patlak plots (Martin et al., 1989) and also demonstrates slow kinetics. A kinetic evaluation of the Patlak plot for [18F]fluoro-DOPA shows that the estimates of the uptake constant K* can be significantly biased if data are used before the unmetabolized pool has reached equilibrium (Yu et al., 1995). Based on the kinetic analysis of the [11C]αMTP data, it appears that the estimates of K* derived from 30 to 60 minutes after injection are significantly overestimated because equilibrium of the pool of tissue [11C]αMTP has not been achieved.
After extending data collection to 180 minutes, we were unable to find a linear portion of the Patlak plot (Fig. 3). The final slope of this curve was small and was not statistically different from zero. These data suggest that the net synthesis rate of αM5HT is small, if the assumptions of the Patlak analysis are correct. There are two major assumptions of the Patlak analysis: first, all [11C]αM5HT is trapped in the tissue during the time course of this study; second, that the measured input function is correct and there are no radioactive metabolites in blood for 180 minutes. If either of these two assumptions is incorrect, this would flatten the Patlak plots and reduce or eliminate the terminal slope. In our previous study, we found no radioactive metabolites of αMTP in plasma (Shoaf et al., 1998). Our interpretation of the Patlak results is validated by the finding that less than 1% of total radioactivity was present as [14C]αM5HT in cortical regions. Thus, we conclude that the synthesis rate of αM5HT is negligible during the 180-minute period of these studies.
In light of the small or nonexistent final uptake rate, the high correlation of αMTP to tryptophan concentrations, and the negligible presence of αM5HT in the tissue, these data demonstrate that [11C]αMTP is simply tracing the uptake of a large neutral amino acid (tryptophan) in a manner similar to [11C]aminocyclohexanecarboxylate (Koeppe et al., 1990) and 3-O-methyl-6-[18F]fluoro-L-DOPA (Doudet et al., 1991). In this case, the Patlak plot shows an initial uptake rate dependent on the capacity and saturation of the large neutral amino acid transporter, and the ultimate equilibrium level (the asymptote in the Patlak plot) is controlled by the relative influx and efflux rates of the transporter, driven by the plasma and tissue concentrations of large neutral amino acids. We conclude that during the time frame of a typical 11C study, [11C]αMTP cannot be used to measure serotonin synthesis rates.
Footnotes
Abbreviations used
Acknowledgements
The authors thank the staff of the NIH PET Department, the surgical group of the NCRR Veterinary Resources Program, the staff of NIH Animal Transportation, and Justin L. Lockman for excellent technical assistance.