
Abstract
There is great interest in positron emission tomography (PET) as a noninvasive assay of fluctuations in synaptic neurotransmitter levels, but questions remain regarding the optimal choice of tracer for such a task. A mathematical method is proposed for predicting the utility of any PET tracer as a detector of changes in the concentration of an endogenous competitor via displacement of the tracer (a.k.a., its ‘vulnerability’ to competition). The method is based on earlier theoretical work by Endres and Carson and by the authors. A tracer-specific predictor, the PET Displacement Sensitivity (PDS), is calculated from compartmental model simulations of the uptake and retention of dopaminergic radiotracers in the presence of transient elevations of dopamine (DA). The PDS predicts the change in binding potential (ΔBP) for a given change in receptor occupancy because of binding by the endogenous competitor. Simulations were performed using estimates of tracer kinetic parameters derived from the literature. For D2/D3 tracers, the calculated PDS indices suggest a rank order for sensitivity to displacement by DA as follows: raclopride (highest sensitivity), followed by fallypride, FESP, FLB, NMSP, and epidepride (lowest). Although the PDS takes into account the affinity constant for the tracer at the binding site, its predictive value cannot be matched by either a single equilibrium constant, or by any one rate constant of the model. Values for ΔBP have been derived from published studies that employed comparable displacement paradigms with amphetamine and a D2/D3 tracer. The values are in good agreement with the PDS-predicted rank order of sensitivity to displacement.
Keywords
Introduction
Positron emission tomography (PET) is an imaging technique of unparalleled molecular specificity, but that specificity is realizable only given the appropriate ligand. Positron emission tomography imaging with receptor-binding tracers is becoming a standard technique for detecting elevation of an endogenous competitor. Thus, it is increasingly important to develop new ligands that are sensitive to displacement. Unfortunately, there is disagreement in the literature as to the relationship between the kinetics of a ligand and its suitability for detecting competition via displacement. Some have looked to the affinity constant, Kd, of a ligand at a receptor site, in the hope of discerning the displaceability of the ligand (for a review, see Laruelle, 2000), but that has not proved fruitful. For some insight into the problem, one need only recognize that how a tracer behaves in vitro in a displacement assay and how it behaves in vivo as a PET tracer are different. In this paper, we seek to codify the relationship between the sensitivity of the PET technique for detecting elevation in endogenous competitor and the kinetic characteristics (i.e., kinetic model parameters) of a potential tracer.
Much has been made of the apparent low sensitivity of PET and SPECT to changes in synaptic dopamine (DA). The perception of low sensitivity to change originated with two papers that compared the changes in extracellular DA (measured directly) to the change in binding potential (BP) determined via emission tomographic imaging (Breier et al, 1997; Laruelle et al, 1997). In both studies, amphetamine doses that caused large percentage increases (>100%) in the extracellular DA concentration (as determined by microdialysis), caused small percentage decreases (<<100%) in binding potential (BP via SPECT or PET). Based on these and other investigations, the sense has emerged among researchers that the sensitivity of PET tracers to changes in endogenous ligand concentration is small and/or unpredictable. Notwithstanding the fact that percentage reduction cannot exceed 100%, any measurement of change should only be considered ‘small’ in the context of its variability. Nonetheless, of the many PET experiments that have been conducted with pharmacological manipulations to increase synaptic DA, the observed changes in binding of a radiotracer have been quite varied. Endogenous DA appears to alter the measured specific binding of some ligands (Hume et al, 1992; Dewey et al, 1993; Hartvig et al, 1997; Mukherjee et al, 1997; Okauchi et al, 2001; Narendran et al, 2004; Slifstein et al, 2004; Mukherjee et al, 2005) but not of others (al-Tikriti et al, 1994; Hartvig et al, 1997; Chou et al, 2000; Okauchi et al, 2001). To explain apparent differences in displaceability of ligands, researchers have posited many explanations, including high- and low-affinity receptor sites, receptor internalization, or inherent differences between agonist and antagonist tracers (Laruelle and Huang, 2001; Narendran et al, 2004).
We believe that a simple competitive binding model—properly applied—can be a fruitful device for explaining and predicting differences in the apparent displaceability of PET ligands. Based only on the assumption of idealized, single-site receptor binding, we present a theoretically supported means of using the kinetic parameters of a tracer to predict its sensitivity to changes in the concentration of an endogenous ligand as measured by PET. In other words, we propose a method for calculating the ‘PET Displacement Sensitivity’ (PDS) of a receptor-binding tracer.
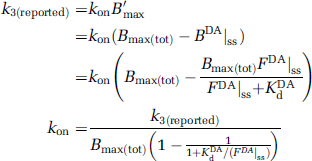
The work we present here is based on earlier work by Endres and Carson (1998), who derived a mathematical expression relating the change in total volume of distribution (ΔV) that is observed when the concentration of an endogenous ligand varies in time during the uptake of a PET receptor tracer. That work, using simulations of a modified two-tissue compartment model, revealed that the observed change in ΔV was dependent on both the time variation in free tracer concentration and the time variation in endogenous ligand concentration. Subsequently, we showed that if the time course of the response of a free endogenous ligand to an identical stimulus differed across subjects, then the observed changes in binding of a PET tracer would differ, even if the increases in total amount of endogenous ligand (e.g., amount of DA released after drug) were identical (Yoder et al, 2004). In our work, we introduced a concept of effective weighted availability (EWA) of receptors to be able to equate different changes in occupancy of receptors via endogenous ligand that would exert equivalent effects on binding potential. A key element of that work was to show that change in binding potential varied linearly with changes in EWA. In the present paper, we extend our earlier work (Yoder et al, 2004) to calculate the PDS of various kinetically characterized ligands that are known from in vitro experiments to compete with endogenous DA for the same binding site. By ‘Displacement Sensitivity’ we mean the amount of reduction in BP for a given tracer, for a standard increase in the occupancy of receptor sites (i.e., decrease in EWA) via an endogenous ligand.
Materials and methods
Effective Weighted Availability: Where it Comes from and How to Use it
In 1998, Endres and Carson introduced a mathematical expression to relate change in total distribution volume, DV, to the kinetics of the tracer being employed (e.g., raclopride) and the endogenous competitor being assayed. It is important to understand that this expression cannot be reduced to a collection of physiologic constants, but must take into account the time-variation in both the free tracer (e.g., raclopride in the free compartment) and the free endogenous competitor (e.g., DA).
The expression introduced by Endres and Carson—rewritten in terms of an arbitrary DA tracer—was
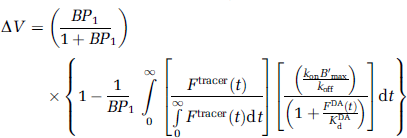
where BP1 is binding potential at steady state, FDA(t) is the concentration of DA in the free DA compartment (see Figure 1). We note that FDA(t) is a constant at steady state (i.e., DA is fixed at baseline); B′max is the density of available receptor sites at steady state. KdDA is the affinity constant for DA at the same receptor site. Ftracer(t) is the concentration of tracer (in molar units) in the free compartment; kon and koff are the association and dissociation rates of the tracer at the receptor site of interest.
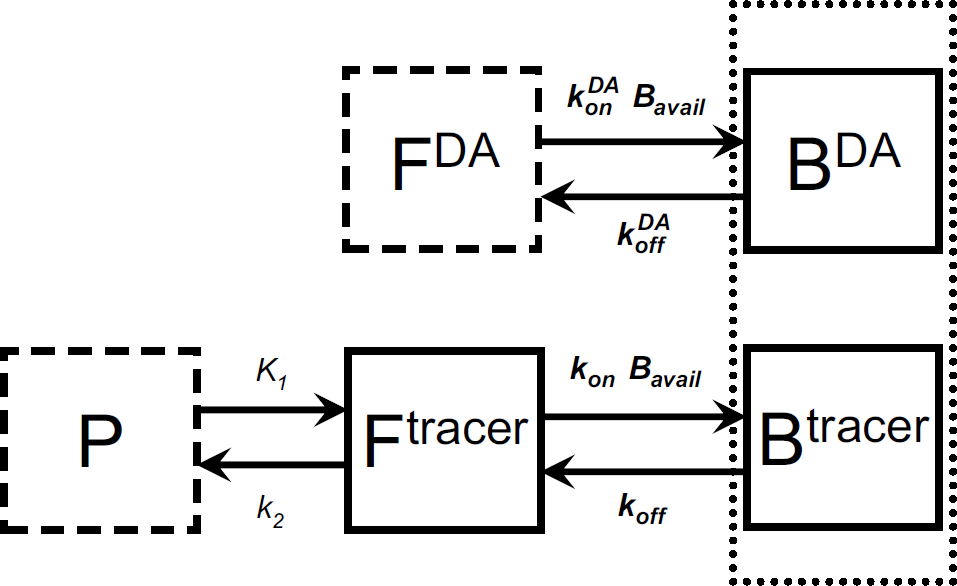
Enhanced endogenous model. Abbreviations are explained in detail in the Materials and methods section. Boxes represent compartments (i.e., state variables) of the model. P=plasma concentration of tracer and FDA=free DA concentration are inputs that must be supplied to solve the model. Dotted box around Btracer and BDA compartments indicates that tracer and DA compete for same pool of binding sites. This model was used to simulate PET data with an accompanying DA perturbation as diagrammed in Figure 3.
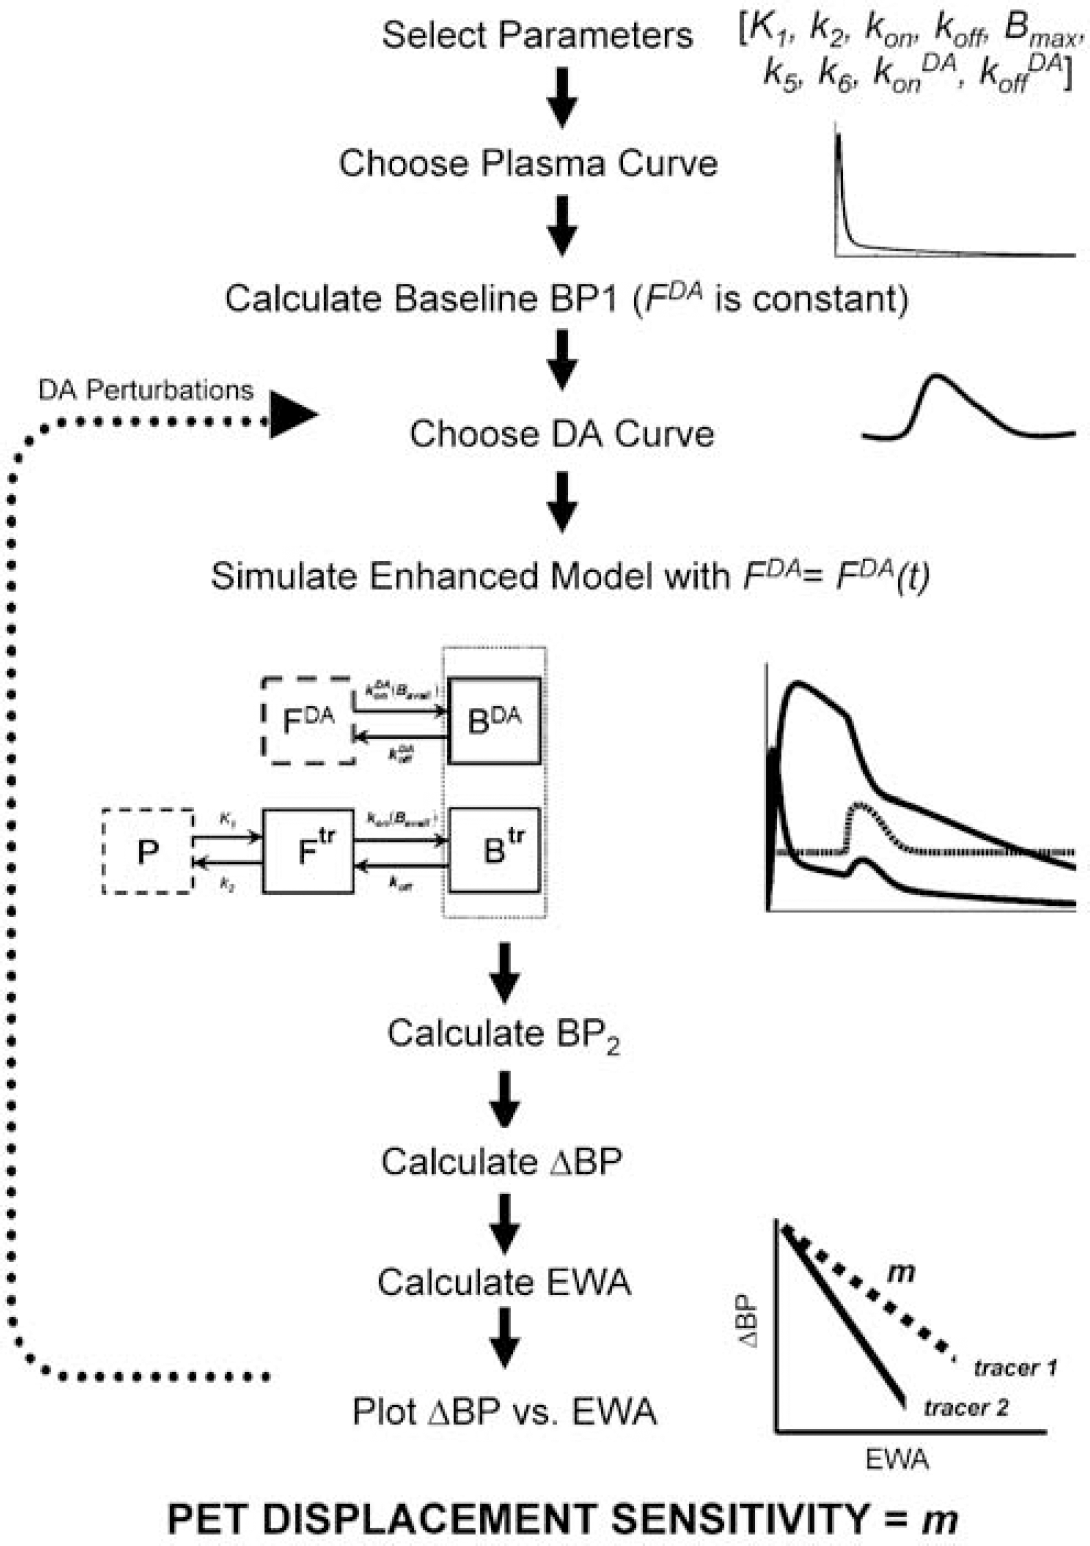
Flowchart of general procedure used to (i) generate simulated PET data; (ii) produce ΔBP versus EWA plot for each tracer; (iii) calculate PDS for each tracer.
To realize how we will use the relationship in Equation (1), one must understand that the free concentrations, Ftracer(t) and FDA(t), cannot be measured directly, neither from tissue regions containing receptors nor from those that do not (i.e., reference regions). In an area where D2/D3 receptors exist, the free tracer concentration is altered by time-variation in free DA. Through simulation of the proper enhanced compartmental model (see Figure 1), however, one can evaluate the expression on the right-hand side of Equation (1), as needed.
In our previous work (Yoder et al, 2004), we reformulated and simplified Equation (1) to
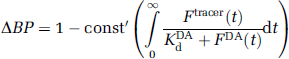
which states that if one can evaluate the term in the parentheses (using the outputs of model simulations) then ΔBP will vary linearly with variations in that term, which we call EWA. In other words,
In our previous work, we focused on the idea that ΔBP was dependent on two time-varying functions (Ftracer(t) and FDA(t)) and from that, we showed through different simulated cases that the amount of DA released and the ΔBP that was induced cannot be disentangled from time-variation in DA concentration.
Calculating the Positron Emission Tomography Displacement Sensitivity
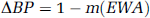
In the present work, we focus on the meaning and use of the term, m, in Equation (3). m is the slope of the relationship between EWA and ΔBP, that is, the degree to which ΔBP changes for an incremental change in EWA. Thus, m is the sensitivity of the commonly calculated index of alterations in specific binding, ΔBP, to changes in receptor availability that are effected by alterations in endogenous ligand concentration. We refer to the sensitivity, m, specifically as the PDS. The PDS for any given PET tracer can be derived by calculating ΔBP values for many different simulated PET time—activity curves containing effects of different DA perturbations, relative to a baseline PET curve created without perturbation. Positron emission tomography curves with perturbations can be simulated using the model diagrammed in Figure 1, given known kinetic parameters, a realistic plasma input function, and a series of hypothetical DA concentration curves (illustrated in Figure 2). The overall procedure is portrayed in the flowchart in Figure 3. Every BP2 value corresponding to a simulated perturbation is paired with the appropriate baseline value (BP1), calculated from a PET curve, absent perturbation, to yield a ΔBP(=(BP1−BP2)/BP1). We have used precisely this approach to calculate the PDS for multiple PET tracers that are presently in common use, and for which we have been able to garner the necessary kinetic parameters from the literature (see Table 1). In the present work, we used two types of DA perturbations, sharp and blunt, at multiple take-off times to probe the response of each tracer to multiple different examples of endogenous DA elevation (see Figure 2). More than 100 different DA perturbations were applied to each tracer. Simulations were done in Matlab (Mathworks) using COMKAT libraries (Muzic and Cornelius, 2001).
Family of DA curves used to simulate PET data with a DA perturbation. The equation used to generate these curves is described in section Derivation of kinetic parameters from literature. For visual clarity, only curves with take-off time td=(1, 2, 3, …, 10) min are displayed. The simulated data sets included curves with td=(1, 2, 3, …, 59) min, as indicated by the ellipses. Left: curves produced with parameters α=1; β=1.2, γ=7000. Right: curves produced with parameters α=2, β=0.8, γ=1000.
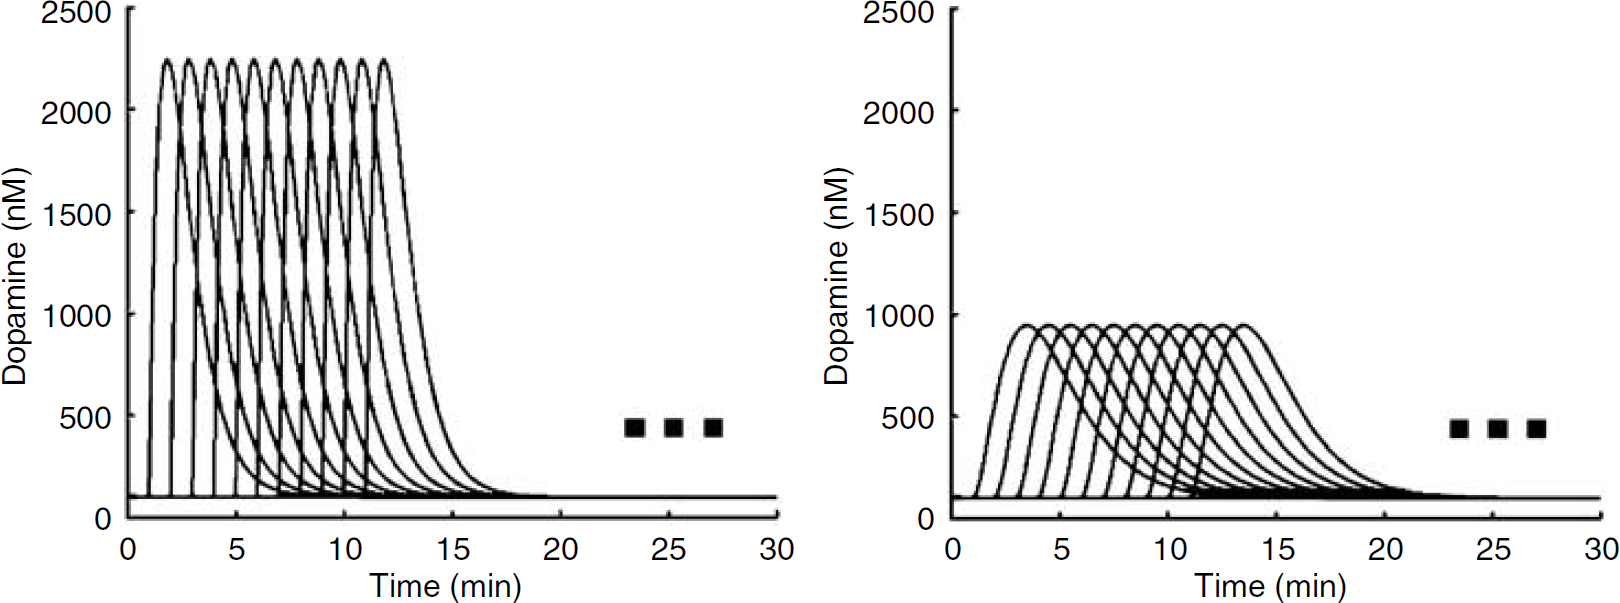
Simulation parameters derived from the literature
Kd calculated from kon and koff.
KdDA calculated from konDA and koffDA.
Bmax(tot) adapted from Yoder et al (2004).
kon calculated from k3 and B′max.
kon calculated from k4 and reported in vitro Kd.
Bmax(tot) adapted from Morris et al (1996).
Using the analytical expression to determine Effective Weighted Availability and ΔBP
In our earlier work (Yoder et al, 2004), we confirmed that a linear relationship existed between EWA and ΔBP by plotting the EWA for multiple simulations (calculated from Equation (1)) versus the corresponding ΔBP (calculated graphically (Logan et al, 1996)). For a review of calculating BP and PET modeling, in general, see Ichise et al (2001). In the present paper, we chose to calculate both the ΔBP and EWA values from Equation (1). While this may seem a bit circular, we felt confident that (a) we had already established the validity of the relationship in Equation (2), and (b) we did not want to examine deficiencies of the Logan plot (e.g., when the system has not achieved steady state), but rather to extrapolate to the theoretically achievable ΔBP. To use Equation (2) to greatest effect, we extrapolated both Ftracer and FDA curves to infinite time and solved each of the integral terms that make up the right-hand side. This would not have been possible if we had used a finite amount of simulated data and the Logan plot to evaluate ΔBP.
Derivation of Kinetic Parameters from Literature
D2/D3 receptors
Several inputs are required to create the simulated PET data. An idealized plasma input function of tracer concentration was utilized to drive the simulations; whole-blood radioactivity was calculated from the plasma concentration, assuming a hematocrit of 0.39. To include the effect of time-varying DA, we needed to specify kinetic parameters to describe the time course of DA concentration as well as binding rate constants for DA at the respective DA receptors. Basal DA concentration was set at 100 nmol/L; association and dissociation rate constants for DA at the D2 receptor, konDA and koffDA, were chosen based on a review by Fisher et al (1995), which makes the heuristic argument that the D2/D3 receptors are 50% occupied at steady state.
Tracer kinetic parameters for each ligand, [K1, k2, kon, koff, Bmax(tot), k5, k6,], were derived from the available literature of bolus injection studies coupled with kinetic modeling. All parameters that we employed are specified, with their sources, in Table 1. Two parameters that we needed, kon, and Bmax(tot), are generally not reported explicitly in the literature because single bolus injections of high specific activity tracer yield the compound parameter k3=konB′max. B′max refers to the concentration of available receptors at steady state whereas Bmax(tot) connotes the concentration of all DA receptors, occupied or not. The latter parameter is the one we need to describe our system because DA levels are changing and thus, all receptors are theoretically in play. When investigators have performed (or referenced) multiple injection studies at multiple tracer specific activities (Morris et al, 1996; Christian et al, 2004), then kon has been estimated. If k3 is reported, we have divided by the value of B′max that is compatible with our choice of Bmax(tot). In other words, if the reported parameter is k3(reported) then,
We have chosen equivalent values for FDA at steady state and KdDA, which translates to 50% occupancy of D2 receptors at steady state. Thus, for papers on D2 tracers which reported k3 values, kon=2k3/Bmax(tot)=k3/22 nmol/L (given the cases where Bmax(tot)=44 nmol/L). The koff for each tracer was taken to be the reported k4 value.
We examined the import of particular parameters by calculating the PDS for multiple theoretical tracers, which differed only in one kinetic parameter such as k2, or one compound parameter such as the equilibrium affinity constant.
Time variation in endogenous free DA concentration was simulated according to

where FDA(basal) is the baseline DA concentration (=100 nmol/L), and td is the time delay (min) of the onset of the function relative to t=0 (injection of tracer) of the simulated scan. Two different families of FDA functions were created as shown in Figure 2. For each family of FDA functions, td=(1, 2, 3, … 59 mins). All simulated PET data were 90 mins in length.
Other dopamine binding sites
To perform simulations of tracers at other binding sites, DA parameters (konDA and koffDA) were adjusted as necessary to achieve the respective affinities of DA at either the D1 receptor or the DA transporter (DAT) (see Table 1). Bmax(tot) for D1 receptors was set to 44 nmol/L, because the striatal concentration of D1 receptors has been reported to be approximately equal to the density of D2 (McCauley et al, 1995). In addition, there is a report from a human imaging study of B′max values for the D1 receptor similar to the D2 value used in the present work (Karlsson et al, 2002). Bmax(tot) was set to 122 nmol/L for DAT according to the results of a multiple injection experiment on cynomolgus monkeys (Morris et al, 1996).
Information about the in vivo KdDA at the D1 and DAT sites in primates is scarce. From a few reports in the literature, we estimated KdDA(DAT)=1,000 nmol/L (Kilty et al, 1991; Kitayama et al, 1992; Giros and Caron, 1993) and KdDA(D1)=500 nmol/L. These values imply that the affinity of DA for each of these molecules is less than it is for D2 receptors. However, to test the effect of mis-estimating the KdDA, we ran additional simulations for D1 and DAT tracers with a second-choice for the KdDA value at each of those binding sites. In effect, we examined the sensitivity of two D1 tracers to detect DA perturbations if the D1 receptors are either 17% or 50% occupied by baseline DA at steady state. Similarly, we examined the sensitivity of two DAT tracers starting from 9% or 50% occupancy (compare Bmax(tot)–B′max to Bmax(tot) values in Table 1). While varying the occupancy level, we tried to stay faithful to the reported values in the literature. For instance, if k3 was the reported parameter, then we adjusted affinity and kon to achieve a particular baseline occupancy level while maintaining the reported parameter value.
Use of Reported Results from AMPH Studies with D2 Tracers
Many different measures of change in specific binding are reported by different groups of investigators. Our standard measure is change in BP (ΔBP) and we have shown previously that it varies linearly with EWA (Yoder et al, 2004). BP is commonly estimated graphically (Logan et al, 1990, 1996; Ichise et al, 2002), or fitted to a simplified model using a reference region as the input function (Lammertsma and Hume, 1996; Gunn et al, 1997). Other measures (ΔV3′, ΔDVR) can be related to ΔBP. In Appendix A, we explain the relationships between commonly measured end points and the index we seek for our present analysis, ΔBP.
Results
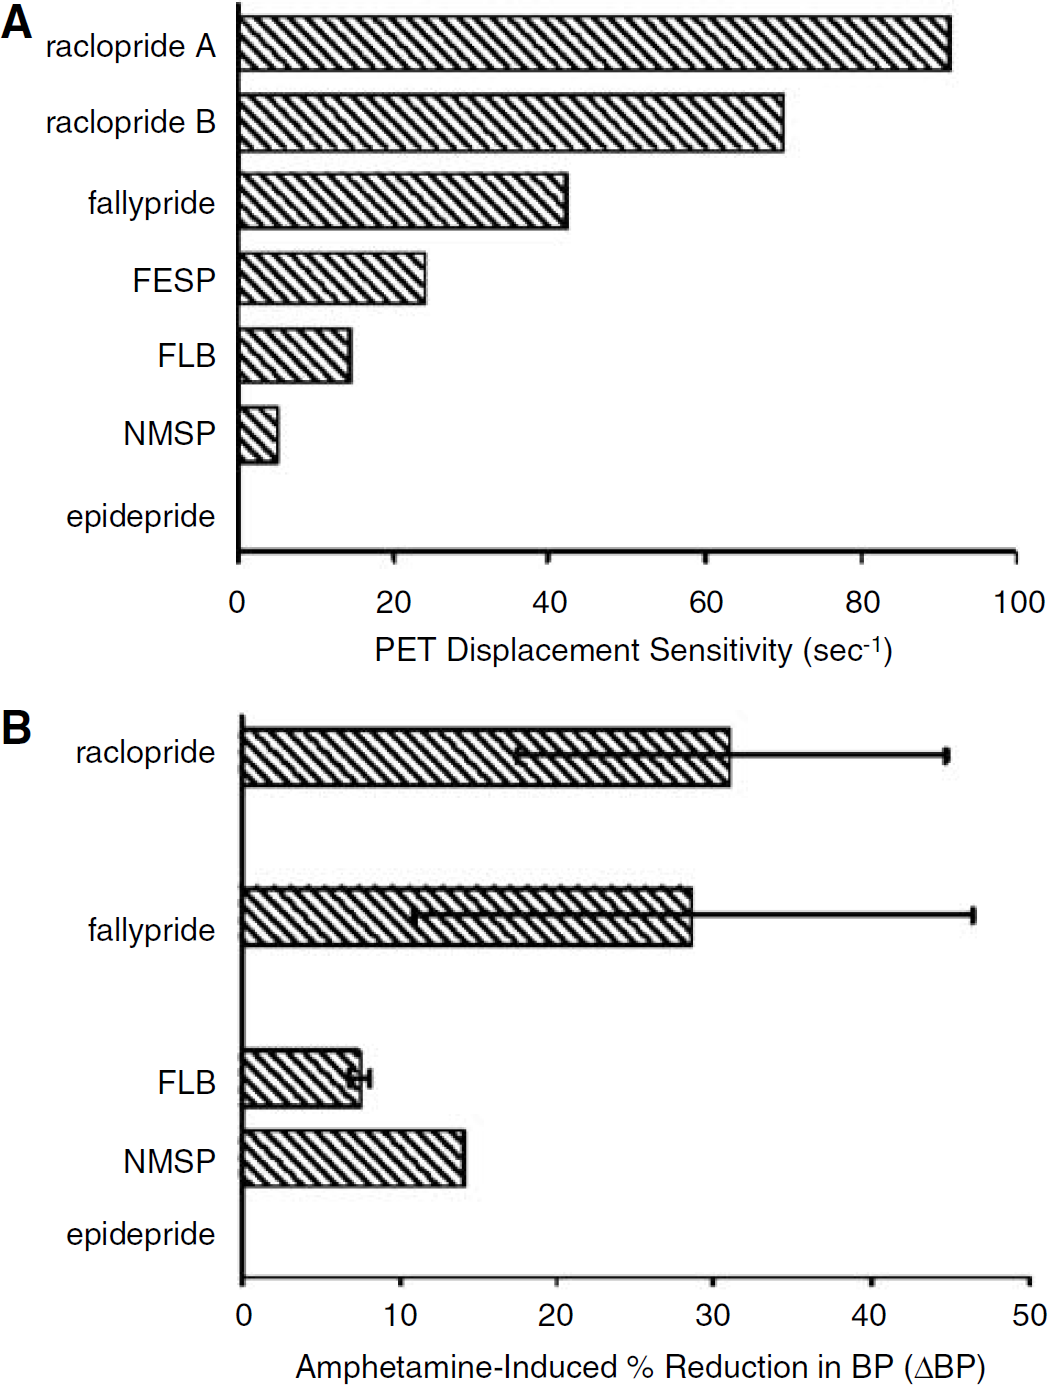
When the procedure outlined in Figure 3 is applied to parameters for common D2/D3 PET tracers and D2/D3 DA receptors, distinct plots of ΔBP versus EWA are generated for each tracer. As described in the methods, this plot yields the slope m, or PDS. Figure 4A shows the results of this PDS calculation for the tracers: raclopride, fallypride, N-methyl spiperone (NMSP), fluoro-ethyl spiperone (FESP), FLB 457 and epidepride. Two complete sets of kinetic parameters for raclopride were available (see Table 1 for sources) so both were plotted. Both sets of raclopride parameters predict that it will have the highest PDS of the common D2/D3 tracers. At the other end of the spectrum, the plot predicts that PET imaging with epidepride will have negligible sensitivity to alterations in DA. FESP, FLB and NMSP appear to have low PDS. According to our analysis, fallypride appears to be the second most sensitive tracer to competition from endogenous DA. The parameters used for fallypride were derived from data in the striatum of non-human primates. It is worth noting that FLB 457 and fallypride are both recently developed D2/D3 ligands and are considered high-affinity tracers (i.e., low Kd). However, on the basis of PDS calculations, we would predict that fallypride would be reasonably displaceable relative to raclopride, whereas FLB 457 would not.
(
Results from comparable in vivo competition studies with D2/D3 PET ligands that used amphetamine (AMPH) to increase endogenous DA
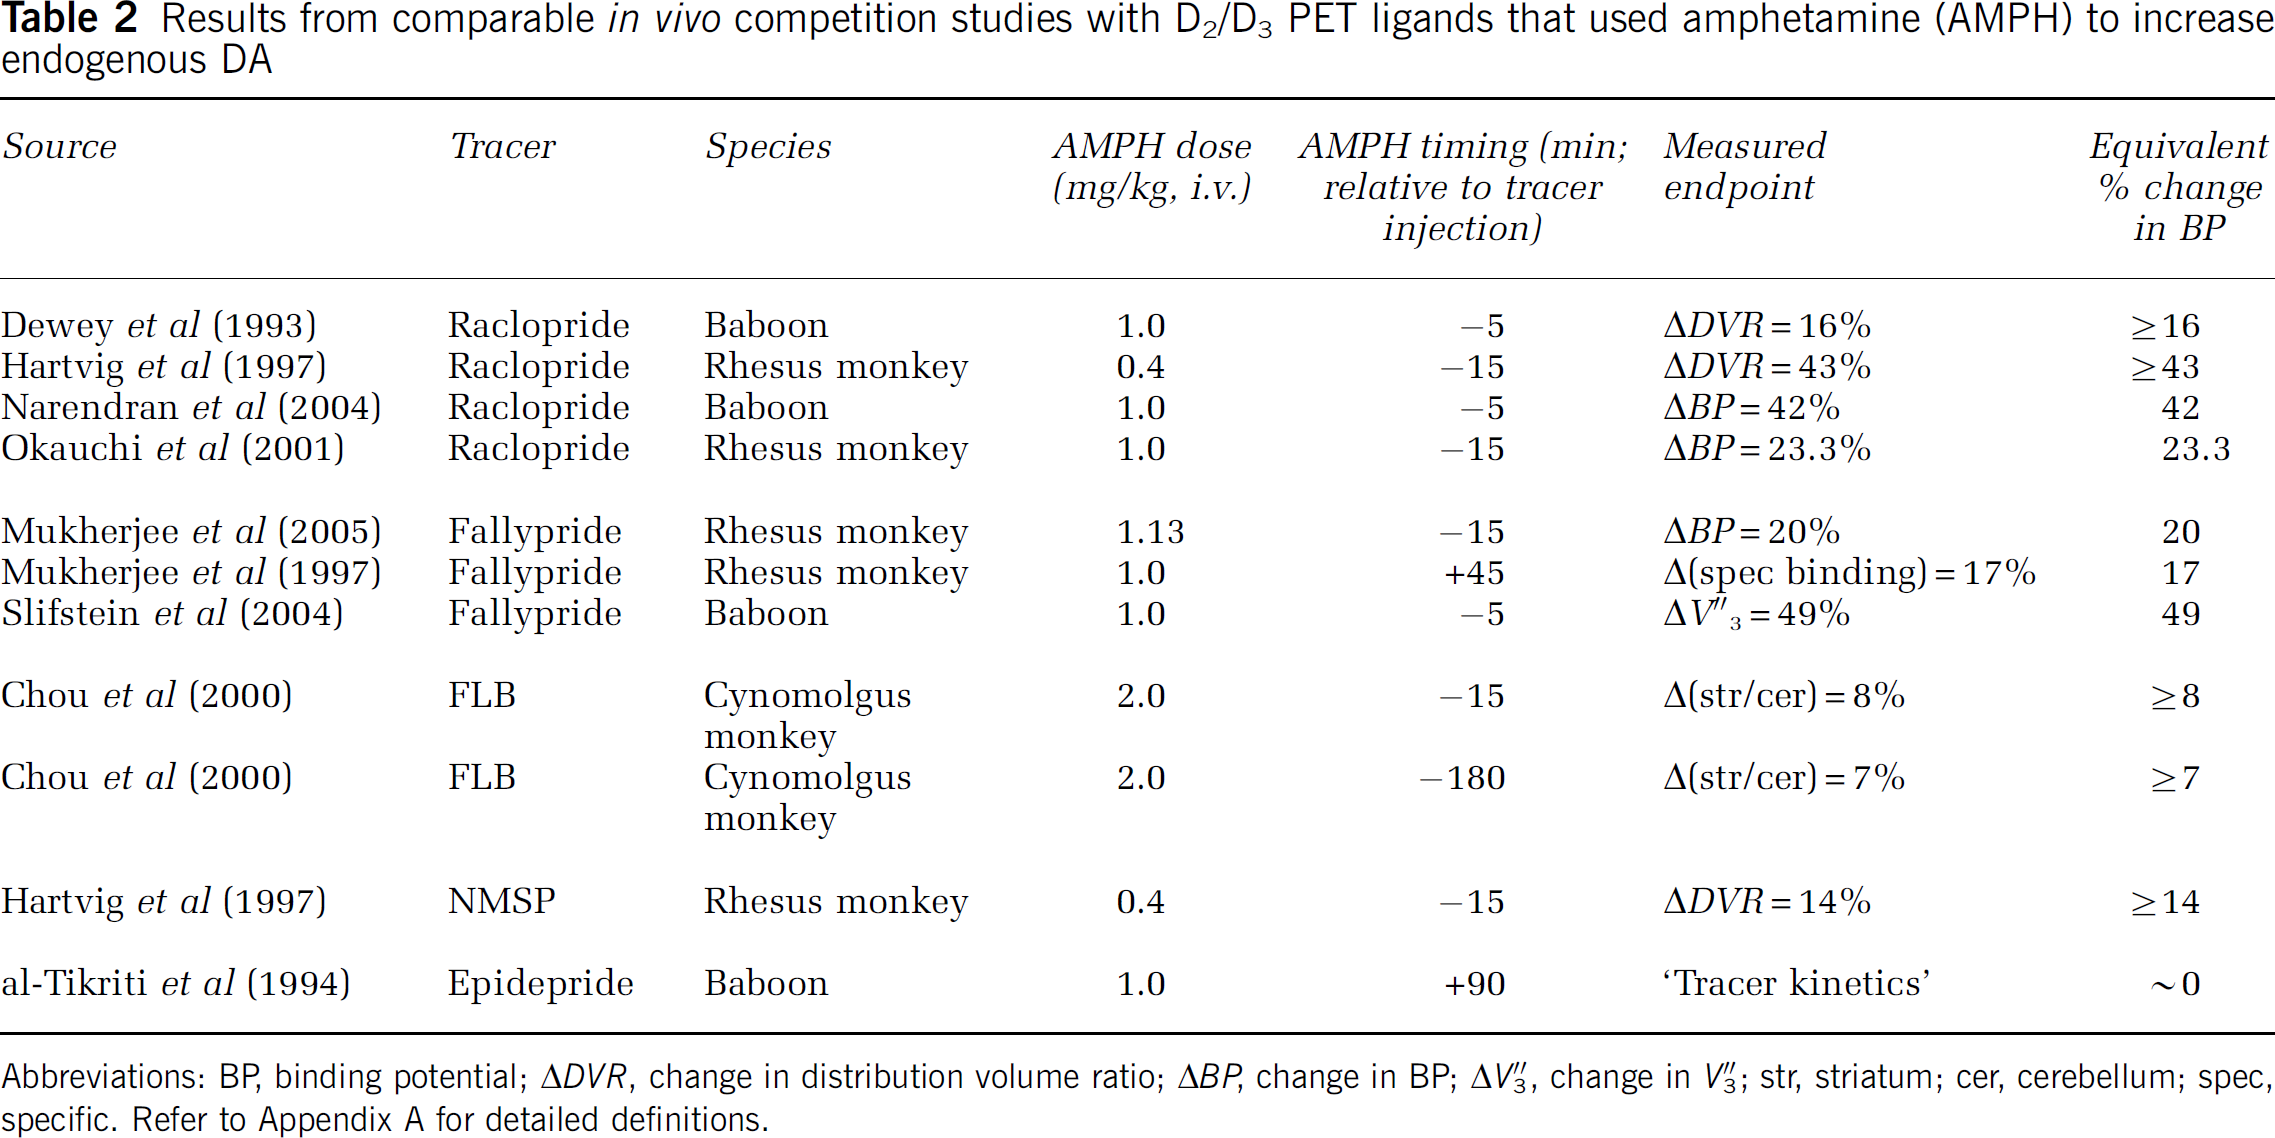
Abbreviations: BP, binding potential; ΔDVR, change in distribution volume ratio; ΔBP, change in BP; ΔV3″, change in V3″; str, striatum; cer, cerebellum; spec, specific. Refer to Appendix A for detailed definitions.
Table 2 is a compilation of results from PET studies of AMPH-induced displacement of tracer from D2/D3 receptor sites in non-human primates. The results are grouped by tracer and the reported end points are translated into an equivalent ΔBP when possible or into a lower limit for the ΔBP when a direct equivalence cannot be stated. To get a sense of the numbers in Table 2, and to facilitate comparison with predictions in Figure 4A, we have averaged the results for each tracer and presented the averages as a bar-graph in Figure 4B. Error bars represent the standard deviation of the results across studies when multiple studies with the same tracer and similar protocols could be found. The error bars do not account for the respective number of animals per study or for the ambiguities associated with studies that reported measures such as ΔDVR instead of ΔBP. There are admittedly many uncertainties attendant with extracting comparable bits of information from disparate studies. Nevertheless, we note that the rank order of ΔBP reported in the studies listed in Table 2 nearly parallels our predictions of PDS based on our simulations of the corresponding tracers. We consider the possible implications as well as the limitations of this type of retrospective analysis below.
Is PDS simply a reflection of affinity? To examine the relationship between affinity and PDS, we altered the association and dissociation rate constants (kon and koff) for raclopride A (see Table 3) but maintained a constant affinity for the tracers at the D2/D3 receptor sites. Thus, we created two theoretical ligands that can be thought of as a fast-kinetic and a slow-kinetic analog but that are otherwise identical to raclopride. Table 3 shows that the PDS is not identical for the three ligands even though they have identical affinities for the binding site. If the desired use of a tracer were to show the largest change in BP for a given DA perturbation, then the data in Table 3 suggest that there would be a slight advantage to imaging with an analog of raclopride that had slower association and dissociation rate constants.
Binding parameters of fast-, and slow-binding raclopride analogs and native raclopride, and their respective PDS values
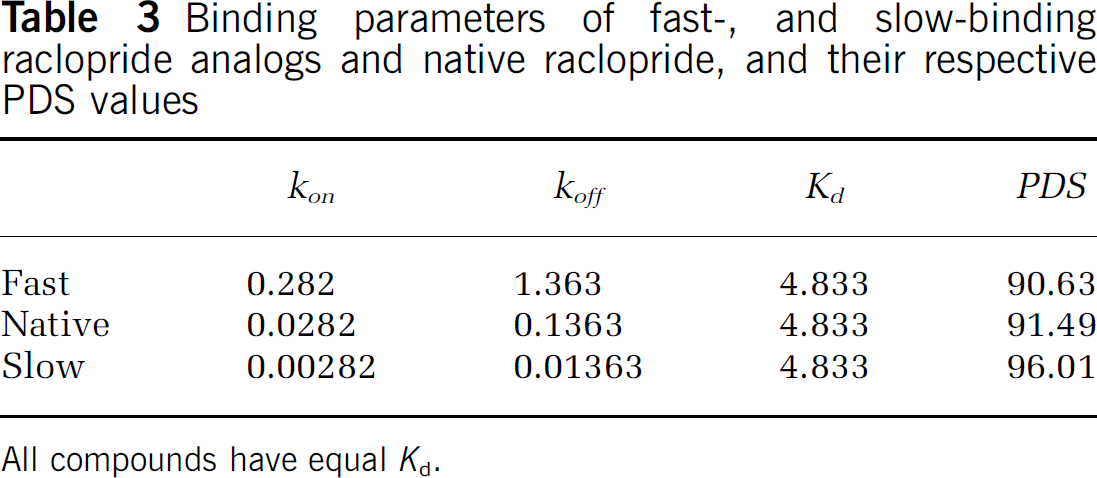
All compounds have equal Kd.
Figure 5 shows that any decrease in k2 will render BP less sensitive to changes in endogenous DA than the BP of the native tracer. When the k2 of a theoretical raclopride analog is decreased to that of epidepride, the PDS of the analog—like that of epidepride—becomes negligible (compare bottom bar of Figure 5 to bottom bar of Figure 4A).
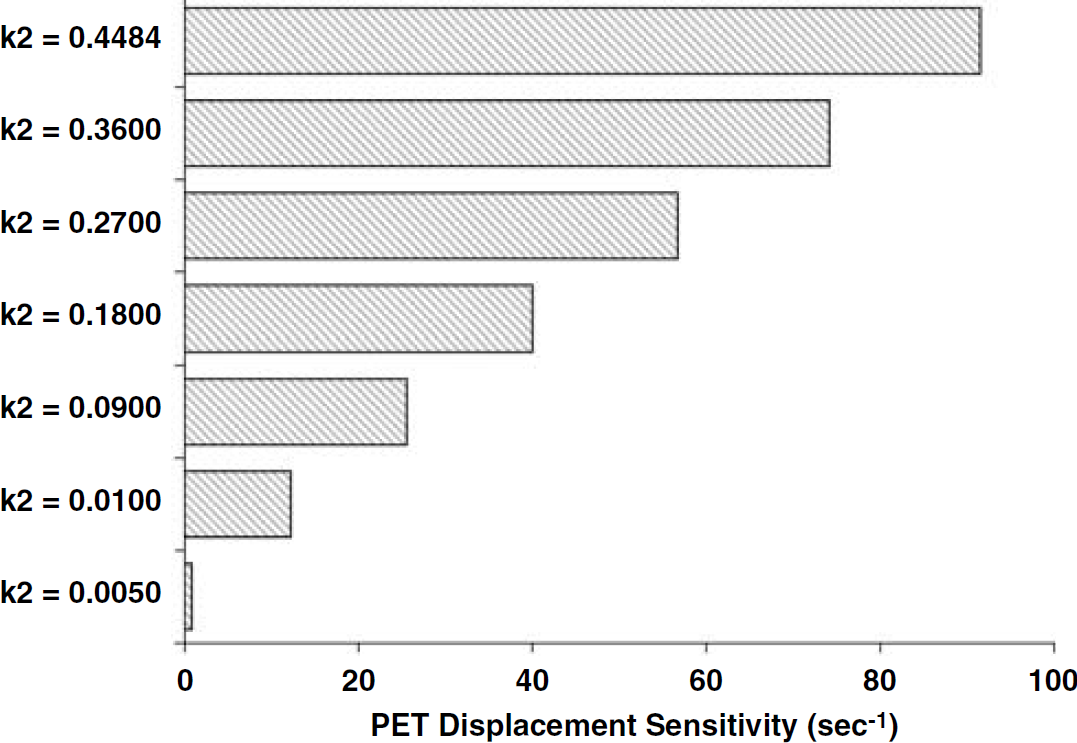
PET displacement sensitivity (secs−1) values for theoretical analogs of raclopride having k2 values smaller than actual raclopride (raclopride ‘A’ was used as the baseline k2 value for this exercise).
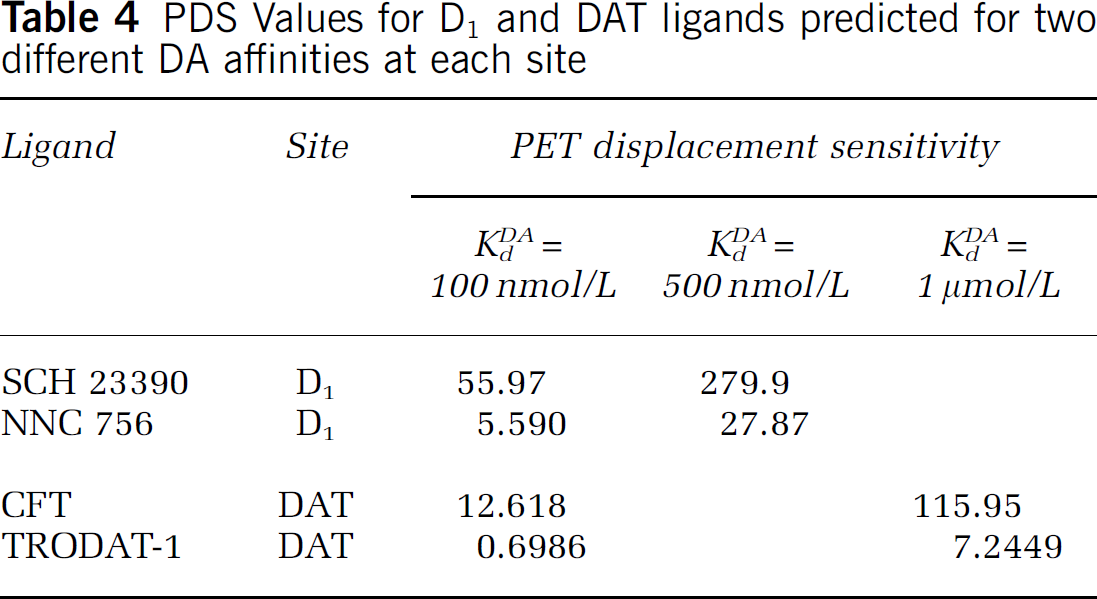
Table 4 summarizes our findings for two tracers that bind to the DA D1 site, and two that bind to the DAT (see Table 1 for sources). In the case of D1, the PDS of SCH 23390 is quite a bit larger than the PDS of NNC 756. For the case of the DAT, we examined the behavior of TRODAT (a SPECT ligand) and CFT. Table 4 shows that the PDS for CFT is clearly larger than for TRODAT. PDS values for D1 and DAT tracers were calculated based on two different estimates of affinity of DA for the binding site of interest (and hence two different baseline levels of DA occupancy). For a given binding site, the relative magnitudes of the PDS values are preserved, regardless of our particular choice of affinity of DA.
PDS Values for D1 and DAT ligands predicted for two different DA affinities at each site
Discussion
A unique strength of PET imaging with receptor tracers is the ability to detect and, ideally, quantify the transient increase of a neurotransmitter in a brain region after pharmacological or cognitive stimulation. The most common measure of change in this context is the compound parameter, change in binding potential (ΔBP). As such, a persistent question among PET researchers has been, ‘exactly what makes a good ligand for showing displacement by an endogenous transmitter?’ In this paper, we have attempted to answer the question by following up on theoretical work that was first performed by Endres and Carson (1998) and later expanded by us (Yoder et al, 2004).
A rearrangement of an enhanced version of the compartmental modeling equations commonly used in PET analysis (Figure 1) yields a mathematical expression that can be interpreted as the sensitivity of a given PET ligand to displacement by an endogenous ligand. We have defined the term PDS, which predicts the ΔBP that will be observed for a comparable change in receptor occupancy caused by time-variation in endogenous competitor concentration. As one might imagine, in a time-varying, non-equilibrium system such as the one describing bolus injection of a PET tracer and accompanying displacement by DA, many factors are needed to predict PDS. Knowledge of all the kinetic rate constants of the tracer, the binding constants of the endogenous competitor (DA), and its time course following perturbation, are necessary to predict PDS. The rate constants of association and dissociation of the tracer at the receptor are certainly important but so too is the efflux constant, k2. The equilibrium dissociation constant, Kd (=koff/kon and known as ‘affinity’), of the tracer for the receptor—by itself—cannot predict a tracer's PDS. If it could, then the theoretical analogs of raclopride that we simulated (each to have the same affinity for the D2/D3 site) would have all had the same PDS. Although variation in kon and koff caused only slight variation in PDS in our simulation exercise (see Table 3), we also showed that sufficient reduction in k2 of raclopride completely abolishes the PDS (Figure 5). This finding can be understood in the context of a non-steady case made up of transient uptake of tracer and transient displacement via DA perturbation. If no newly displaced tracer is allowed to exit the tissue (k2=0), we would not expect to detect the displacement with PET because the total radioactivity concentration of the tissue would remain the same. It is interesting to note that al-Tikriti et al (1994) were unable to detect displacement of epidepride via amphetamine injection. This is exactly what we would predict. The nearly nonexistent PDS of epidepride (Figure 4A) is dominated by a very low k2 value (similar to that shown on the bottom rung of Figure 5). Thus, we must conclude that very low k2 is a fatal kinetic flaw of any potential tracer whose intended use is to be sensitive to changes in endogenous DA. Furthermore, low k2 assures that PDS will be very low, whether the binding rate constant is fast (see epidepride, Figure 4A) or slow (as with the least sensitive k2 analog of raclopride, Figure 5).
The differences in PDS between the hypothetical fast, slow, and (real) raclopride are not great (Table 3). This is probably because for raclopride and its analogs, processes other than association and dissociation from the receptor are the dominant factors in how much change in BP one can provoke by elevating DA. But within this group of iso-affinity variants, the better sensitivity with slower binding and dissociation at the receptor is interesting and perhaps counter-intuitive. This can be understood as follows: two species (free raclopride and free DA) are changing transiently, and are inter-related. The level of free raclopride can be thought of as the shutter of a camera, through which we record changes in DA; that is, changes in binding potential. This analogy comes straight from the Ftracer(t) term in the numerator of Equation (1), which Endres and Carson called the weighting function. When free raclopride concentration is high, the shutter is wide open and sensitivity to DA changes is high. When raclopride concentration is low, the shutter is only partly open and the system (comprised of tracer uptake and ΔBP calculation) is less sensitive to what is happening to DA at that moment. Finally, if kon and koff are fast, free tracer is in rapid equilibrium with bound, and the ‘shutter’ never gets open very wide. For slow kon and koff, the free concentration takes a long time to equilibrate with the bound. During this slow period of equilibration, much of the tracer is ‘backed up’ in the free compartment waiting to be bound, and the ‘shutter’ remains wide open (sensitivity to transient changes in DA remains high).
From the relative magnitudes of their PDS values, we deduce that SCH 23390 would make a better tracer than NNC 756 for showing increased DA at the D1 site. However, we must be cautious in overinterpreting this finding. In absolute terms, it is possible that neither tracer would be good for showing displacement. Further, it may not be possible to compare these results with those of the D2 tracers because there is uncertainty in our estimates of KdDA at the D1 site. By contrast, within a group of tracers that bind to the same site, uncertainty in the estimate of DA affinity at that site appears not to be an issue. For tracers within such a group, we showed that the relative sensitivities of the tracers are preserved, independent of the KdDA estimate (and hence independent of baseline occupancy level). Comparisons between ligands that act at different sites would require precise relative knowledge of the affinity constants for DA at each site. Crosssite comparisons based on PDS calculations are probably not valid at this time.
Estimates of PDS for the DAT site predicted that CFT would have greater potential to register changes in BP as the result of DA changes than would TRODAT. These predictions were also insensitive to choice of affinity for DA, but the same caveat expressed above applies to any attempt to compare DAT to D2 ligands.
The type of predictions we make based on the Endres and Carson equation (Equation (1)) could be extended to bolus/infusion studies (as they did in their 1998 paper). We would merely need to change the shape of the plasma input function in our simulations, or know the shape of the FDA(t) and Ftracer(t) for the bolus/infusion paradigm. We have focused on the two-bolus paradigm because it is a common protocol that is not experimentally complex; however, measurable displacement of tracer has also been showed successfully with bolus/infusion studies (e.g., Breier et al, 1997; Carson et al, 2002; Tsukada et al, 2002; Martinez et al, 2003).
How do the predictions of PDS compare with experimental findings in the literature? The comparison is not straightforward for a number of reasons. One, there is no standard displacement protocol, which would need to include a standard dose and standard timing of the administration of a drug, such as amphetamine (AMPH). Two, researchers report different end points, which although theoretically equivalent, are generally not the same in practice (e.g., ΔV3′ and ΔBP should yield identical results). Three, for obvious reasons, no one has actually calculated EWA. Four, even if a study reports the results of multiple doses of the same DA-releasing drug, there is no way to know how the effects of the respective doses compare in terms of the timing and magnitude of free DA. In other words, there is no way to position experimental reports of displacement properly on the EWA axis of the ΔBP versus EWA plot (see bottom of Figure 3). We note that estimating the free DA function over time from the PET data is the subject of other work by the authors and colleagues (Constantinescu et al, 2005, 2006; Morris et al, 2005). For the purpose of attempting a meaningful comparison between our predictions and findings in the literature, we focus on a circumscribed group of studies. Specifically, we collected and used interpretable findings with quantitative end points resulting from imaging studies with D2 tracers in the presence and absence of doses of AMPH close to 1 mg/kg (see Table 2).
Although the number of comparable displacement/competition PET studies with each of the tracers shown in Figure 4B is limited, they are supportive of our predictions using calculated PDS values. However, the retrospective collection of AMPH studies cited in Table 2 can serve only as a partial test of PDS as a predictor of sensitivity to endogenous DA. PET displacement sensitivity predicts the amount of change one can expect in ΔBP for a given change in EWA. That is, PDS is a slope. But to calculate a slope, one must measure at least two separate points on the ΔBP versus EWA graph. We know from previous work (see Figure 7 of Yoder et al, 2004) that the plot for any tracer runs through the common (theoretical) point, ΔBP=1 at EWA=0. That is, at complete occupancy (no remaining receptor availability), the change in BP is 100%. Table 2 reflects our attempts to identify a second ΔBP value for each tracer from the literature. Unfortunately, we do not know the corresponding EWA coordinate of that second point. The best we can do is assume that each of the studies cited in Table 2 were performed identically, that each of the reported AMPH administrations caused the same alteration in free DA over time which, in turn, lead to the same EWA in each case. Of course, these assumptions are extreme and untestable. Nonetheless, it must be considered encouraging that the rank order of published ΔBP values (for a circumscribed group of AMPH-induced DA release results) nearly recapitulates the predicted rank-order of PDS for D2/D3 tracers. It should also be noted that the PDS predictions made herein, which appear to coincide with experimental findings, follow directly from the compartmental model of uptake and idealized, single-site, competitive binding.
The best test of the PDS would be a comprehensive series of identical PET experiments performed with different tracers—with and without a standard drug perturbation (controlled in both dose and timing). But this is not likely to happen. However, our results suggesting that PDS is a fruitful measure of a tracer's sensitivity to endogenous competition do argue for the routine, and complete kinetic evaluation of new tracers. If multiple injection PET studies in non-human primates (for detailed protocol, see Morris et al (2004)) were incorporated into the standard evaluation of every new tracer, then the resulting kinetic parameter estimates could be used by the PET imaging community to calculate the tracer's PDS score, and to predict the tracer's utility in displacement studies.
In summary, affinity of a tracer for a receptor is an equilibrium phenomenon; however, the uptake and retention of a PET tracer, given as a bolus, is a dynamic process whose explanation requires the solution of a nonlinear kinetic model. The picture becomes even more complicated when time variation in the concentration of an endogenous competitor is induced by the administration of a drug. Therefore, it is not surprising that the affinity constant of a tracer for a receptor, by itself, cannot predict what degree of binding change will be observed during a transient displacement paradigm. With the continued growth of PET as a noninvasive assay of endogenous neurotransmitter elevation in experimental animals and humans, there is an ongoing need for clarity with regard to the proper choice of PET tracer. Our present reformulation and application of original theoretical work performed by Endres and Carson (1998) is, we believe, a step in that direction. Our introduction of the PDS index amounts to the development of a new method of predicting the usefulness of any tracer for PET studies to assay changes in an endogenous species via competitive binding. The PDS of a tracer can be calculated from a properly determined set of kinetic parameters. A meta-analysis of relevant PET studies of amphetamine-induced DA elevation supports the predictive value of the PDS index.
Footnotes
Acknowledgements
The authors also acknowledge helpful discussions with Dr Nat Alpert.
Appendix A—Relationship of Published End points to Δ BP
Many different measures of change in specific binding are reported by different groups of investigators. Here, we attempt to reconcile the respective meanings of the various measured end points and the one we will use, ΔBP.
The standard definition of BP is
which leads to
In the presumed absence of nonspecific binding, many people use the cerebellum as a measure of free tracer, and approximate the expression in Equation (A3) by subtracting it from the striatal activity (which is assumed to contain both bound tracer and the same amount of free tracer as is in the cerebellum):
Those who report percent change in specific binding (Mukherjee et al, 1997) have essentially simplified the right hand side of Equation (A4) further by assuming that the steady-state concentration of tracer in the cerebellum in the control is the same as the steady-state concentration of tracer in the cerebellum in the drug state:
For the purposes of comparison, the best we can say about reported values of ΔSpec. Binding is that it would be equivalent to ΔBP, provided the measurements are taken at equilibrium and the concentration of tracer in the cerebellum in the control state is equal to that in the drug state.
In many cases, unbound tracer is believed to exist in both free and nonspecifically bound (nondisplaceable) states. For this reason, many groups prefer to report their results in terms of the total volume of distribution, which does not require that nonspecific binding be zero. The popular index, V3″ is defined as follows:
where f2 is the nondisplaceable fraction of free tracer. Nonetheless, the percentage change in this term,
is, theoretically, the same as that of ΔBP.
Groups that analyze their binding data via the Logan plot, which yields the distribution volume ratio, DVR, often report percent change in that parameter. In the absence of nonspecific binding,
But percent change in DVR is not quite the same as change in BP:
So reports of ΔDVR must be considered lower bounds for ΔBP.
A measurement comparable to percent change in DVR is sometimes presented as percent change in striatum to cerebellum ratio
which, by the reasoning following Equation (A9), also yields a lower bound for ΔBP.