
Abstract
Cerebral vascular mean transit time (MTT), defined as the ratio of cerebral blood volume to cerebral blood flow (CBV/CBF), is a valuable indicator of the cerebral circulation. Positron emission tomography (PET) and dynamic susceptibility contrast-enhanced magnetic resonance imaging (DSC-MRI) are useful for the quantitative determination of MTT in the clinical setting. The aim of this study was to establish a normal value set of MTT as determined by PET and by DSC-MRI and to identify differences between these methods. Seven healthy volunteers were studied with 15O-PET (H215O and C15O) and gradient-echo echo-planar DSC-MRI at 1.5 T. In the DSC-MRI study with bolus injection of contrast agent, deconvolution analysis was performed. Comparison of gray-to-white matter ratios showed fairly good agreement between PET and DSC-MRI for all parameters (relative CBV, relative CBF, and relative MTT), confirming the validity of relative measurements with DSC-MRI. However, quantitative MTT measured by DSC-MRI was significantly shorter than that measured by PET in cerebral cortical regions (2.8 to 3.0 secs for DSC-MRI versus 3.9 to 4.3 secs for PET) and the centrum semiovale (3.5secs for DSC-MRI versus 4.8secs for PET). These discrepancies may be because of the differences in the intrinsic sensitivity of each imaging modality to vascular components; whereas PET measurement of CBV is equally sensitive to all vascular components, measurement with DSC-MRI originates from the microvasculature in the vicinity of the brain parenchyma. This underlying difference may influence interpretation of MTT determined by PET or by DSC-MRI for patients with cerebrovascular disease.
Keywords
Introduction
Measurement of cerebral circulation by positron emission tomography (PET) has been applied to investigate the pathophysiology of cerebrovascular disease in humans (Gibbs et al, 1984; Powers et al, 1984; Sette et al, 1989). Cerebral vascular mean transit time (MTT) relates to cerebral blood flow (CBF) and cerebral blood volume (CBV) according to the following: MTT = CBV/CBF (Meier and Zierler, 1954) and is a sensitive index of decline in perfusion pressure (Gibbs et al, 1984; Sette et al, 1989). By PET, CBF can be measured with 15O-labeled water (H215O) as a diffusible tracer, which is regarded as the gold standard (Raichle et al, 1983; Kanno et al, 1987; Iida et al, 1989), and CBV can be measured with 15O-labeled or 11C-labeled carbon monoxide (C15O or 11CO) (Martin et al, 1987; Grubb et al, 1978; Phelps et al, 1979).
Recently, dynamic susceptibility contrast-enhanced magnetic resonance imaging (DSC-MRI) with a Gd-based contrast agent has been increasingly applied in cerebral perfusion studies (Calamante et al, 1999). DSC-MRI combined with diffusion MR is frequently used in acute stroke patients to assess the extent and severity of ischemia (Baird and Warach, 1998). When an arterial input function (AIF) is determined, CBF, CBV, and MTT can be calculated by deconvolution analysis (Rempp et al, 1994; Østergaard et al, 1996a, b ). However, absolute quantification of CBF and CBV is not straightforward because of difficulties in absolute scaling of AIF and tissue concentration curves; normalization procedures are required to determine absolute CBF and CBV values (Calamante et al, 2002). Use of empirical scaling factors, which are constant within a study population, have been proposed (Østergaard et al, 1998a, b ). However, normalization for each patient is necessary to obtain reliable CBF and CBV estimates (Lin et al, 2001; Sakaie et al, 2005).
In contrast to CBF and CBV, MTT, calculated as CBV/CBF, is free of scaling problems and can be determined with absolute units (secs) even by DSC-MRI. The usefulness of quantitative MTT (absolute value) in DSC-MRI has been reported in patients with acute ischemic stroke as a threshold for hypoperfusion (Thijs et al, 2001) and in patients with chronic occlusive cerebrovascular disease as an indicator of perfusion reserve impairment (Kikuchi et al, 2002). Although normal MTT values have been reported by DSC-MRI (e.g., Østergaard et al, 1996a; Schreiber et al, 1998; Vonken et al, 1999; Helenius et al, 2003), there is a large discrepancy among reports, and MTT values measured by PET differ (e.g., Ito et al, 2003; Sette et al, 1989).
The aim of this study was to establish a normal value set of MTT as determined by PET and by DSC-MRI and to investigate differences between these methods. By PET, CBF, and CBV were obtained with H2150 and C15O, respectively. By DSC-MRI with injection of a Gd-based contrast agent, CBF was determined with the use of singular value decomposition (SVD) deconvolution with correction for the effect of tracer delay (delay-corrected SVD method) (Ibaraki et al, 2005b, c ). For both studies, MTT was calculated as CBV/CBF. Differences in MTT between DSC-MRI and PET were analyzed.
Materials and Methods
Subjects
Seven healthy men aged 20 to 21 years were recruited and provided written informed consent. Dynamic susceptibility contrast-enhanced magnetic resonance imaging and PET were performed within the same day for each subject at rest with eyes closed. All volunteers were determined to be healthy based on medical history, blood screening tests, anatomic MR imaging of the brain, and MR angiography of the brain. The study protocol was approved by the Ethics Committee of the Akita Research Institute of Brain and Blood Vessels. For these volunteers, the effects of regional tracer delay on DSC-MRI CBF estimates were reported previously (Ibaraki et al, 2005c).
Magnetic Resonance Imaging Procedures
Magnetic resonance imaging was performed with a 1.5-T whole-body scanner (Magnetom Vision; Siemens Medical Systems, Iselin, NJ, USA). Axial fast spin-echo T2-weighted images (TR, 3600 ms; TE, 96 ms; slice thickness, 5 mm; slice gap, 1 mm; 19 slices) were obtained parallel to the anterior commissure–posterior commissure (AC–PC) line. Perfusion data were obtained by single-shot gradient-echo echo-planar imaging (TR, 1000 ms; TE, 66 ms; flip angle, 90°; matrix size, 128 × 128; field of view, 230 mm; slice thickness, 5 mm). At 20 secs after initiating scanning, 10 mL gadodiamide (Omniscan) was injected into the antecubital vein over a period of 3 secs, followed by injection of 10 mL saline. One hundred twenty brain images were obtained with 1-sec repetition time, and 60 sequential frames were extracted (keeping an adequate number of baseline frames before the contrast agent arrived) and were further processed to generate CBV and CBF maps. Each brain image contained five slices that were identical in position to the five slices of the T2-weighted image; one slice covered the cerebellum (1st slice), and the other four slices were of the cerebrum at 0, 12, 24, and 36 mm (2nd to 5th slice) above and parallel to the AC–PC line.
Dynamic Susceptibility Contrast-Enhanced Magnetic Resonance Imaging Data Analysis
Dynamic susceptibility contrast-enhanced magnetic resonance imaging data analysis was performed as described previously (Ibaraki et al, 2005b, c ). Magnetic Resonance signal intensity was converted to tracer concentration by assuming a linear relation between changes in the transverse relaxation rate and tracer concentration. Arterial input function was measured in the brain region covering the insular segment of the middle cerebral artery (MCA) territory by means of a previously reported semiautomatic method (Ibaraki et al, 2005a, b ). Cerebral blood volume was calculated as the ratio of the area under the tissue concentration curve to the area of the AIF. CBF was determined with the use of a delay-corrected SVD method (Ibaraki et al, 2005b, c ). In brief, CBF was determined by standard SVD deconvolution (ØØstergaard et al, 1996b) after time shifting of the tissue curve. Values for regional tracer delay were calculated by pixel-by-pixel least-squares estimation and then used for time shifting. We have shown that delay-corrected SVD provides gray-to-white CBF ratios with less interindividual variation that are close to those measured by PET (Ibaraki et al, 2005c).
Quantitative MTT was determined as CBV/CBF with absolute units (secs) in the region-of-interest (ROI) analysis described below. In the DSC-MRI study, absolute CBF and CBV values could not be determined because of difficulties in absolute scaling of AIF. Therefore, only relative CBF and CBV (ratio to white matter values) are presented.
Positron Emission Tomography Procedures
Positron emission tomography was performed with a Headtome V scanner (Shimadzu Corp., Kyoto, Japan) (Iida et al, 1996), which provides 47 sections with a center-to-center distance of 3.1 mm. The intrinsic spatial resolution was 4.0 mm full width at half maximum (FWHM) in-plane and 4.3 mm FWHM axially. Reconstruction with a Butterworth filter resulted in a final in-plane resolution of approximately 10 mm FWHM. After transmission scanning for attenuation correction, H215O and C15O PET studies were performed.
H215O Positron Emission Tomography Study
H215O PET studies were performed to measure CBF. Dynamic scanning (180 secs) was performed after an intravenous bolus injection of H215O (1.5 GBq). The scan sequence consisted of twelve 5-secs frames and eight 15-secs frames. Arterial input function was obtained with a beta detector system that continuously measured radioactivity in arterial whole blood taken from the radial artery. Delay and dispersion occurring in the beta detector system and the internal arterial line were corrected as described previously (Iida et al, 1986, 1988). According to the one-tissue compartment model, H215O radioactivity in the brain is expressed as follows:

C15O Positron Emission Tomography Study
C15O PET studies were performed to measure CBV (Martin et al, 1987). Static PET scanning was initiated 3 mins after 1 min of continuous inhalation of C15O gas (5 GBq). Scanning was performed for 4 mins. Three arterial blood samples were taken during PET scanning to measure whole-blood radioactivity. The cerebral-to-large vessel hematocrit ratio was assumed to be 0.85 (Phelps et al, 1979).
Region-of-Interest Analysis
Positron emission tomography parametric maps (CBF and CBV) were registered with individual anatomic MR images (T2-weighted images) with the use of SPM (Ashburner and Friston, 1997). Magnetic resonance imaging parametric maps (CBF and CBV) were processed with a Gaussian filter with 10-mm FWHM to match the spatial resolution of DSC-MRI with that of PET. With the use of T2-weighted images and segmented gray matter images (Ashburner and Friston, 1997) as anatomic references, we defined circular ROIs 10 mm in diameter bilaterally for seven brain regions: cerebellum, putamen, thalamus, cerebral cortices in different arterial territories (MCA, posterior cerebral artery (PCA), and anterior cerebral artery (ACA)) (Tatu et al, 1998), and white matter of the centrum semiovale (Figure 1).
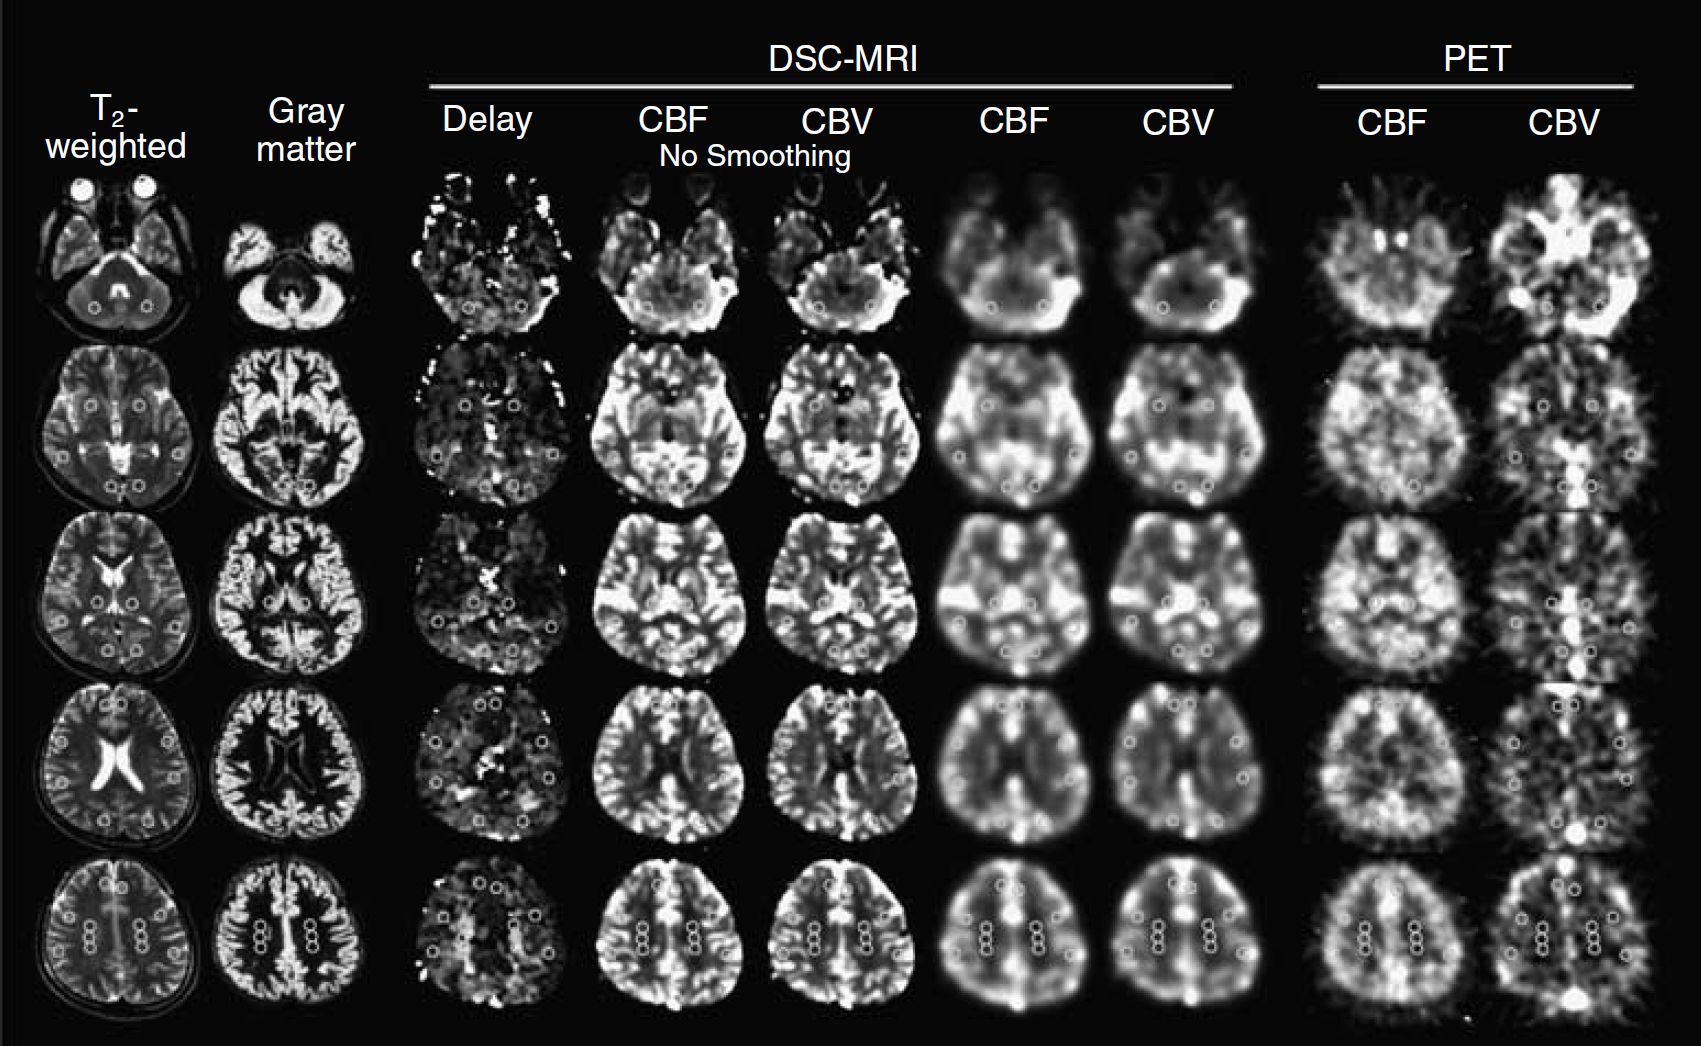
Anatomic MR images and parametric maps obtained with PET and DSC-MRI. Left to right: T2-weighted image, segmented gray matter image generated by partitioning the T2-weighted image, tracer delay measured with DSC-MRI, MRI-CBF, MRI-CBV, MRI-CBF with smoothing, MRI-CBV with smoothing, PET-CBF, and PET-CBV. Circular regions-of-interest were identified in the cerebellum, putamen, thalamus, cerebral cortex, and centrum semiovale. All images were obtained parallel to the anterior commissure–posterior commissure (AC–PC) line. Slice positions are cerebellar level (1st), 0 mm (2nd), 12 mm (3rd), 24 mm (4th), and 36 mm (5th) from the AC–PC line.
For DSC-MRI and PET data analyses, MTTs were calculated for each subject on an ROI basis as MTT = CBV/CBF. Comparison of quantitative MTT between PET and DSC-MRI was made with the paired t-test. Relative measures of CBF, CBV, and MTT, which were calculated as the ratio to white matter value, were also examined. In addition, regional differences in the absolute measures of PET and DSC-MRI were determined by the paired t-test with Bonferroni correction for multiple comparisons. Significance was accepted at P < 0.05.
Results
Comparisons between Positron Emission Tomography and DSC-Magnetic Resonance Imaging
Positron emission tomography and DSC-MRI results are shown in Tables 1 and 2, respectively. Although comparisons were made with the smoothing of DSC-MRI maps, DSC-MRI parameters without smoothing are also shown in Table 2. Quantitative MTT measured by DSC-MRI was shorter than that measured by PET, with the exception of the thalamus. In all of the cerebral cortical regions analyzed and the centrum semiovale, MTT values were significantly lower for DSC-MRI than for PET (Figure 2).
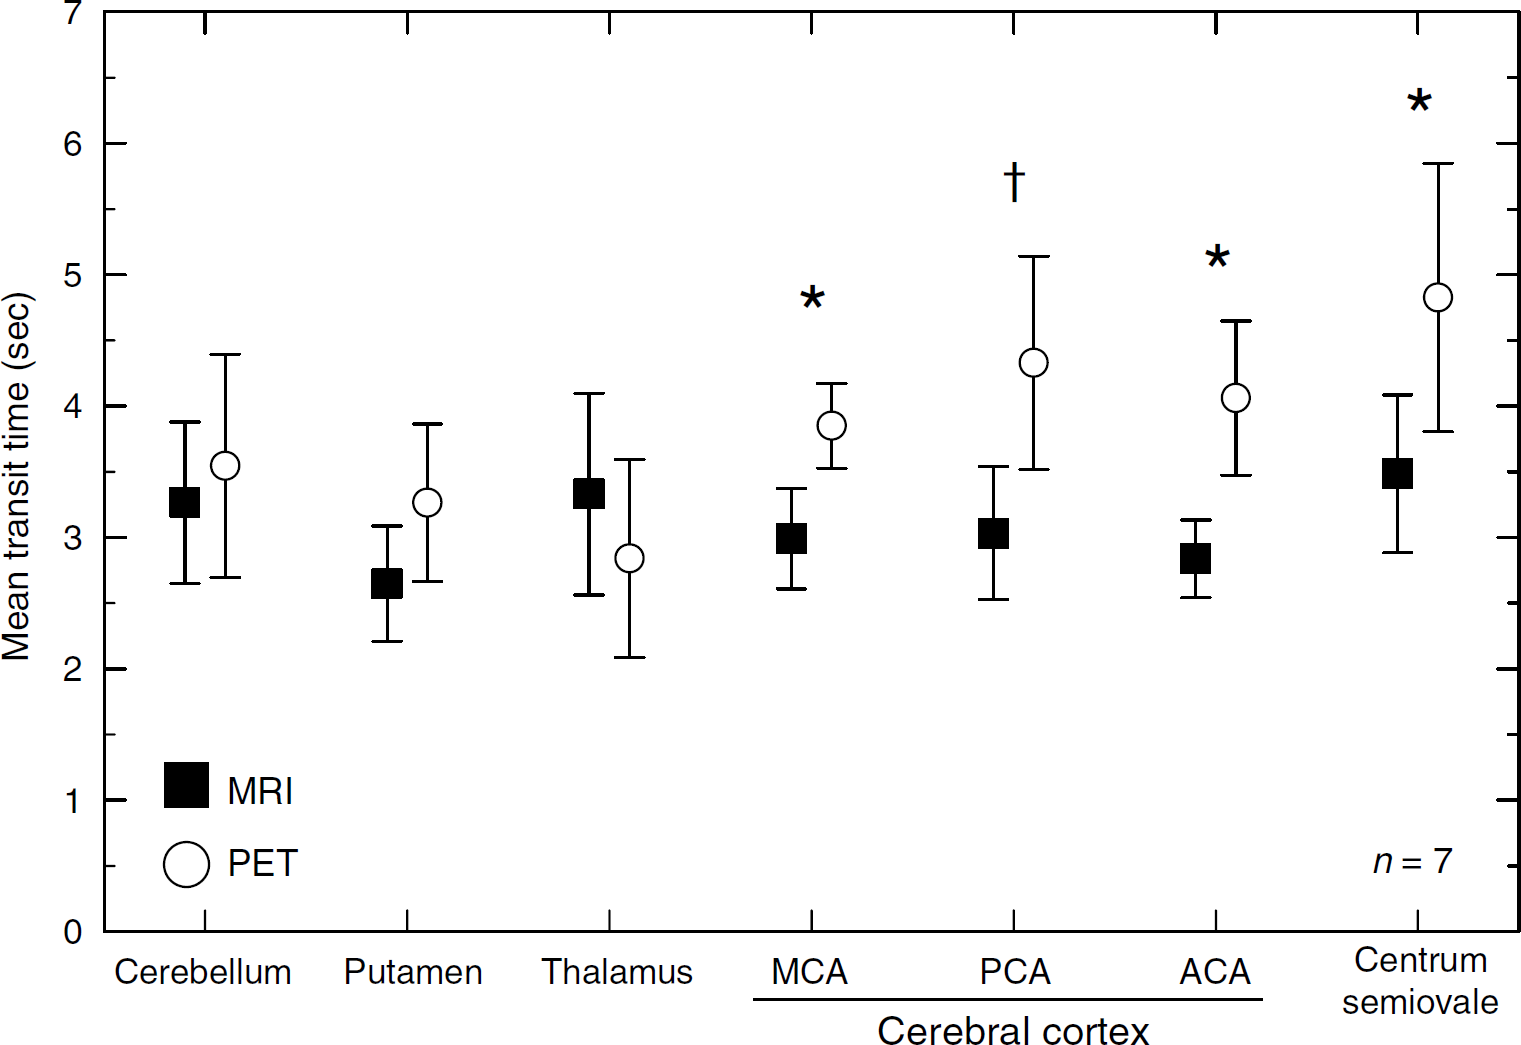
Quantitative MTT measured by PET and DSC-MRI. Significant differences between PET and DSC-MRI (paired t-test): *P < 0.01; †P < 0.05.
Results of PET study
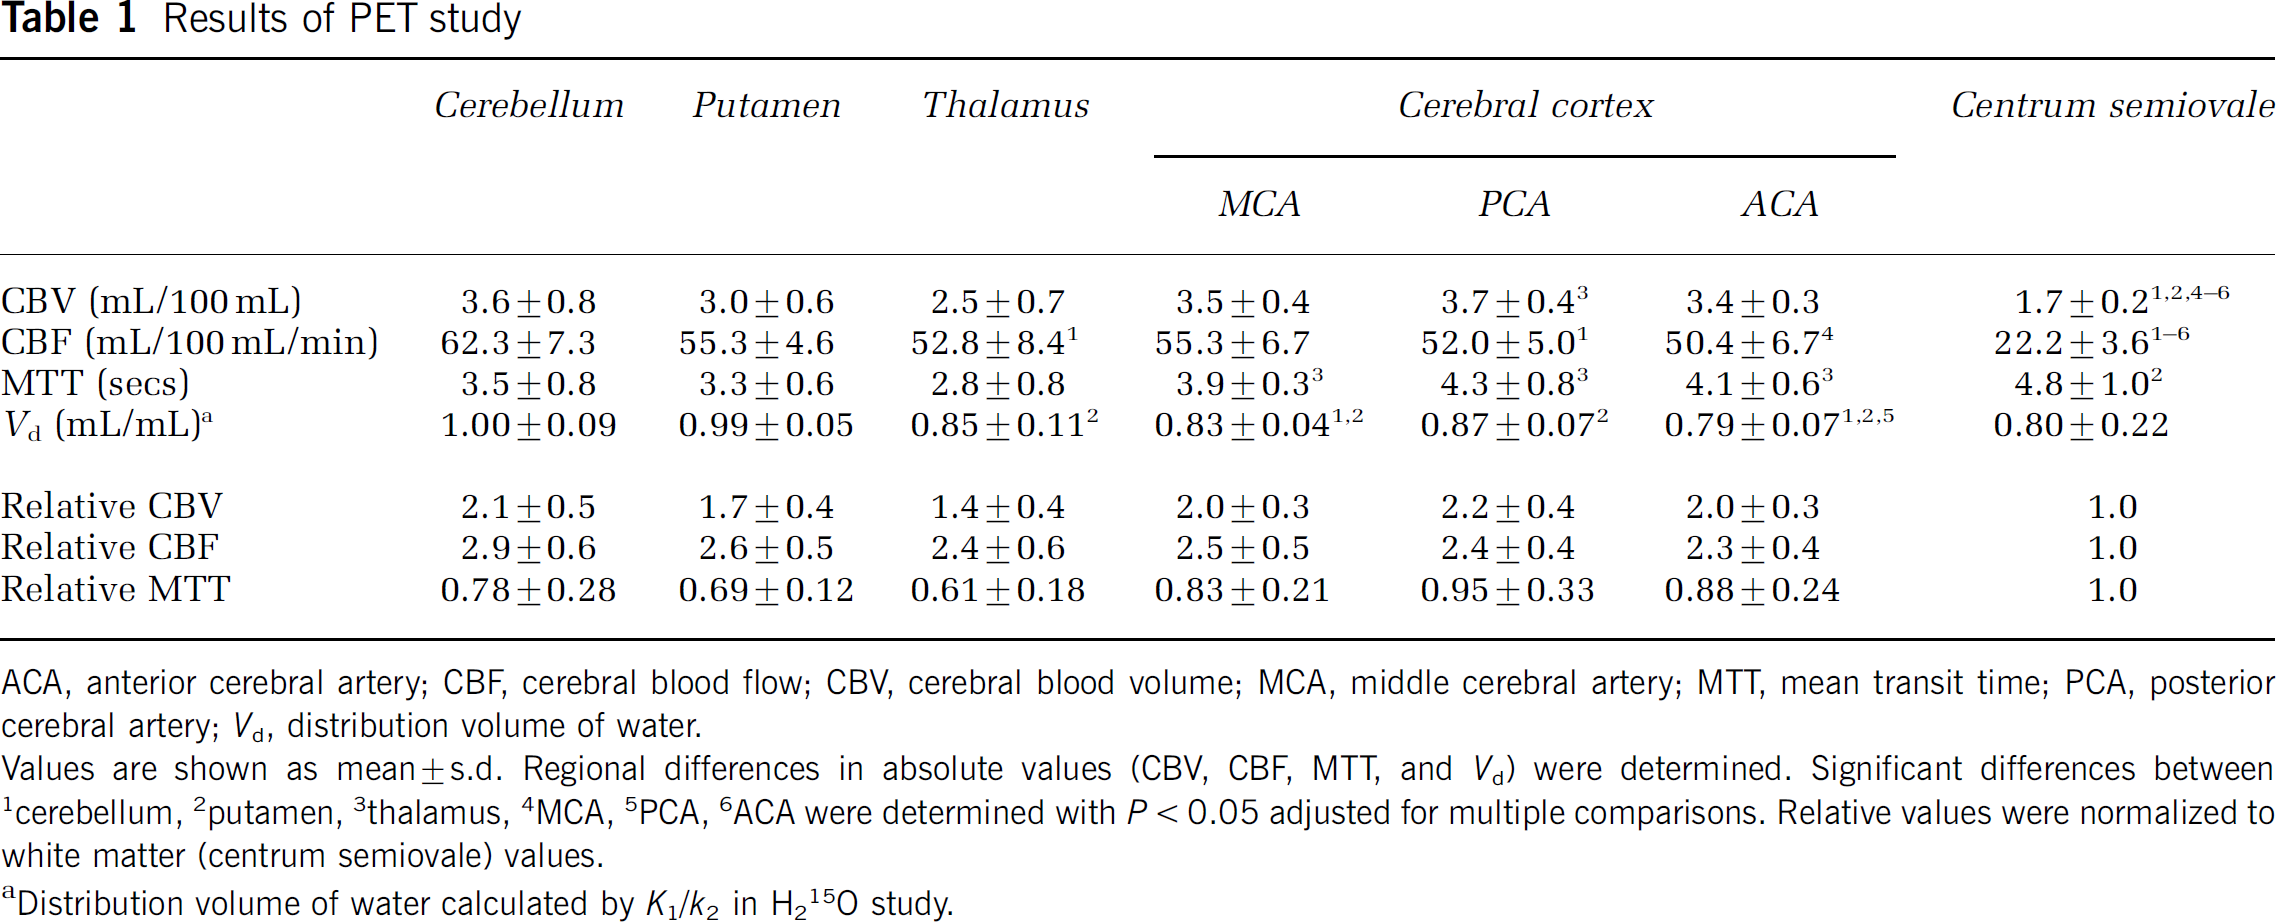
ACA, anterior cerebral artery; CBF, cerebral blood flow; CBV, cerebral blood volume; MCA, middle cerebral artery; MTT, mean transit time; PCA, posterior cerebral artery; Vd, distribution volume of water.
Values are shown as mean ± s.d. Regional differences in absolute values (CBV, CBF, MTT, and Vd) were determined. Significant differences between 1Cerebellum, 2putamen, 3thalamus, 4MCA, 5PCA, 6ACA were determined with P < 0.05 adjusted for multiple comparisons. Relative values were normalized to white matter (centrum semiovale) values.
Distribution volume of water calculated by K1/k2 in H215O study.
Results of DSC-MRI study
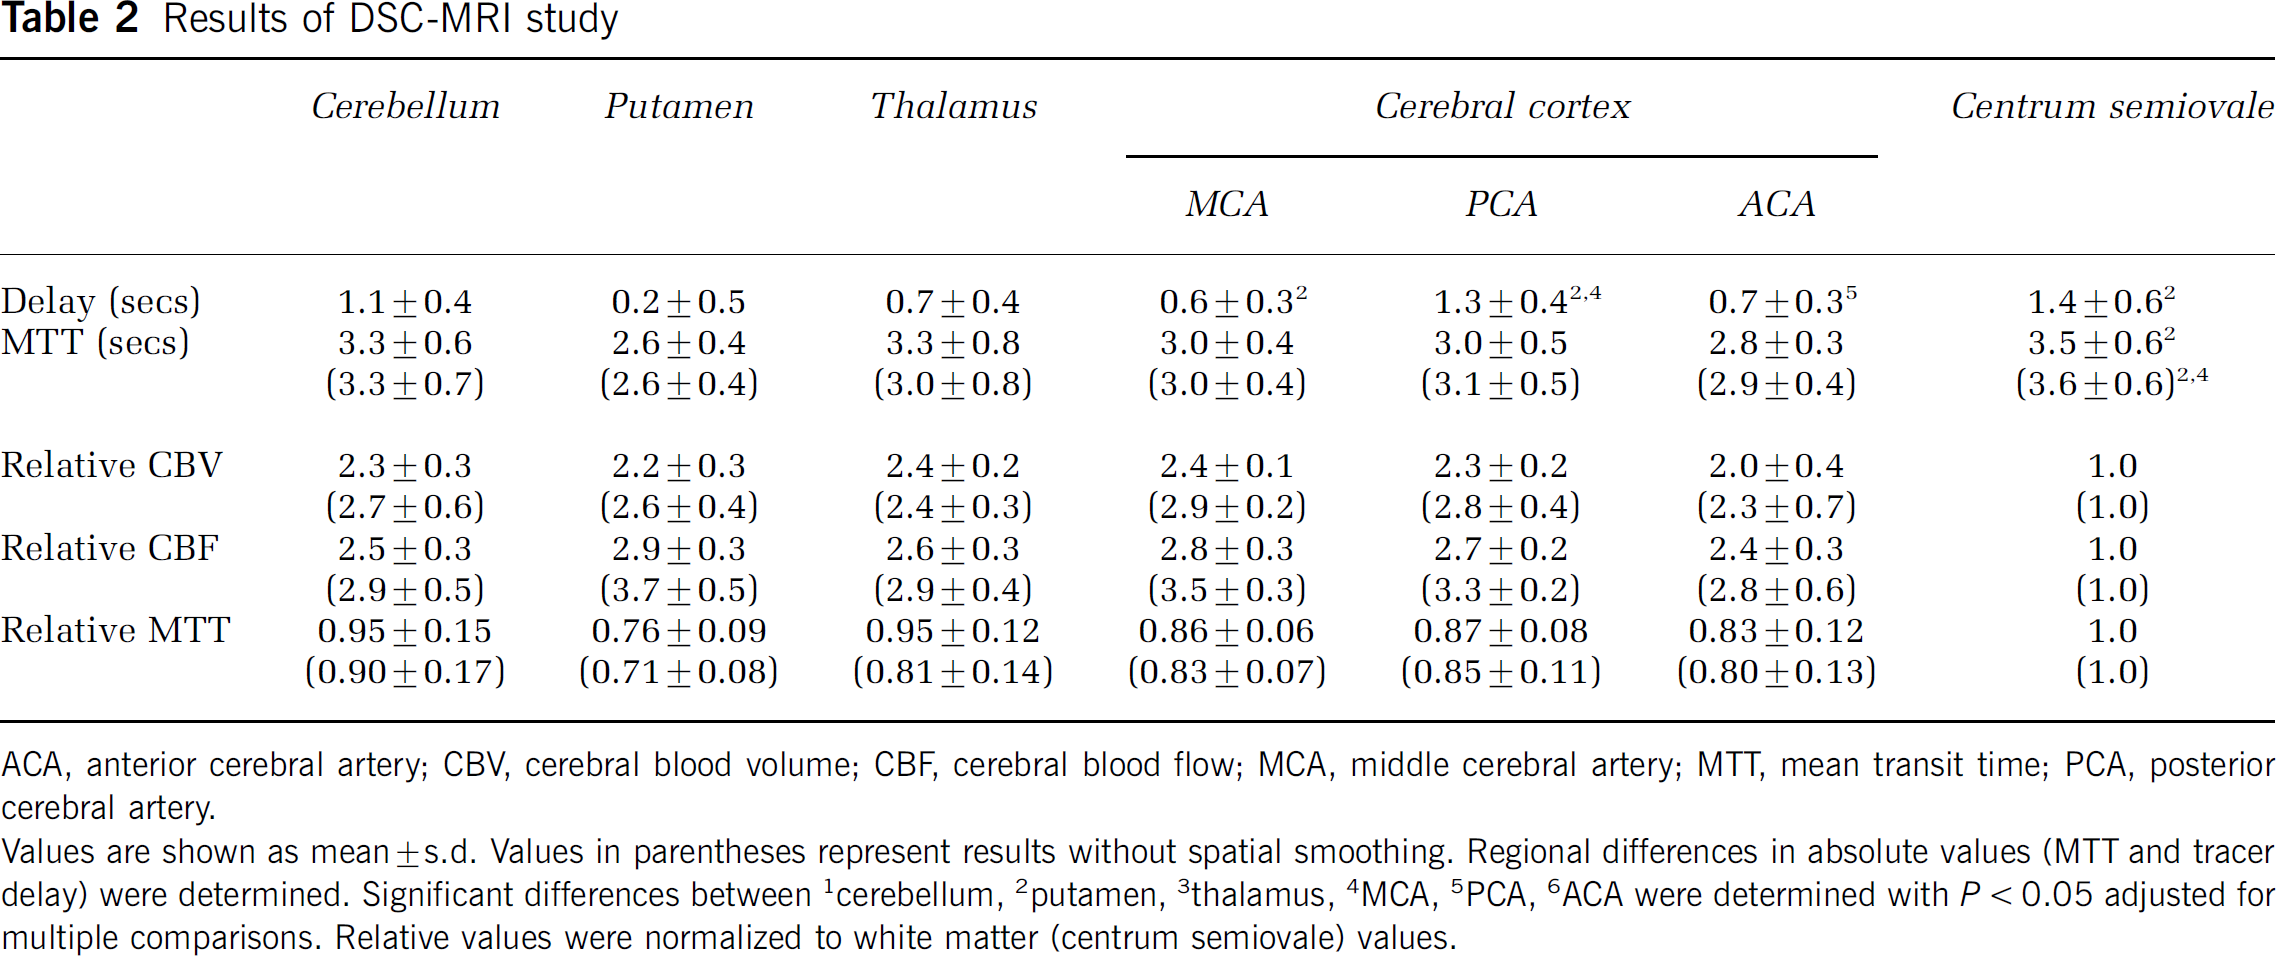
ACA, anterior cerebral artery; CBV, cerebral blood volume; CBF, cerebral blood flow; MCA, middle cerebral artery; MTT, mean transit time; PCA, posterior cerebral artery.
Values are shown as mean ± s.d. Values in parentheses represent results without spatial smoothing. Regional differences in absolute values (MTT and tracer delay) were determined. Significant differences between 1Cerebellum, 2putamen, 3thalamus, 4MCA, 5PCA, 6ACA were determined with P < 0.05 adjusted for multiple comparisons. Relative values were normalized to white matter (centrum semiovale) values.
In contrast to quantitative MTT, significant differences in the relative measures between PET and DSC-MRI were identified in only one or two brain regions. Relative CBF in the cerebral cortex of the PCA territory was significantly greater for DSC-MRI than for PET (Figure 3A). Relative CBV in the thalamus and cerebral cortex of the MCA territory was significantly greater for DSC-MRI than for PET (Figure 3B). Relative MTT in the thalamus was significantly greater for DSC-MRI than for PET (Figure 3C).
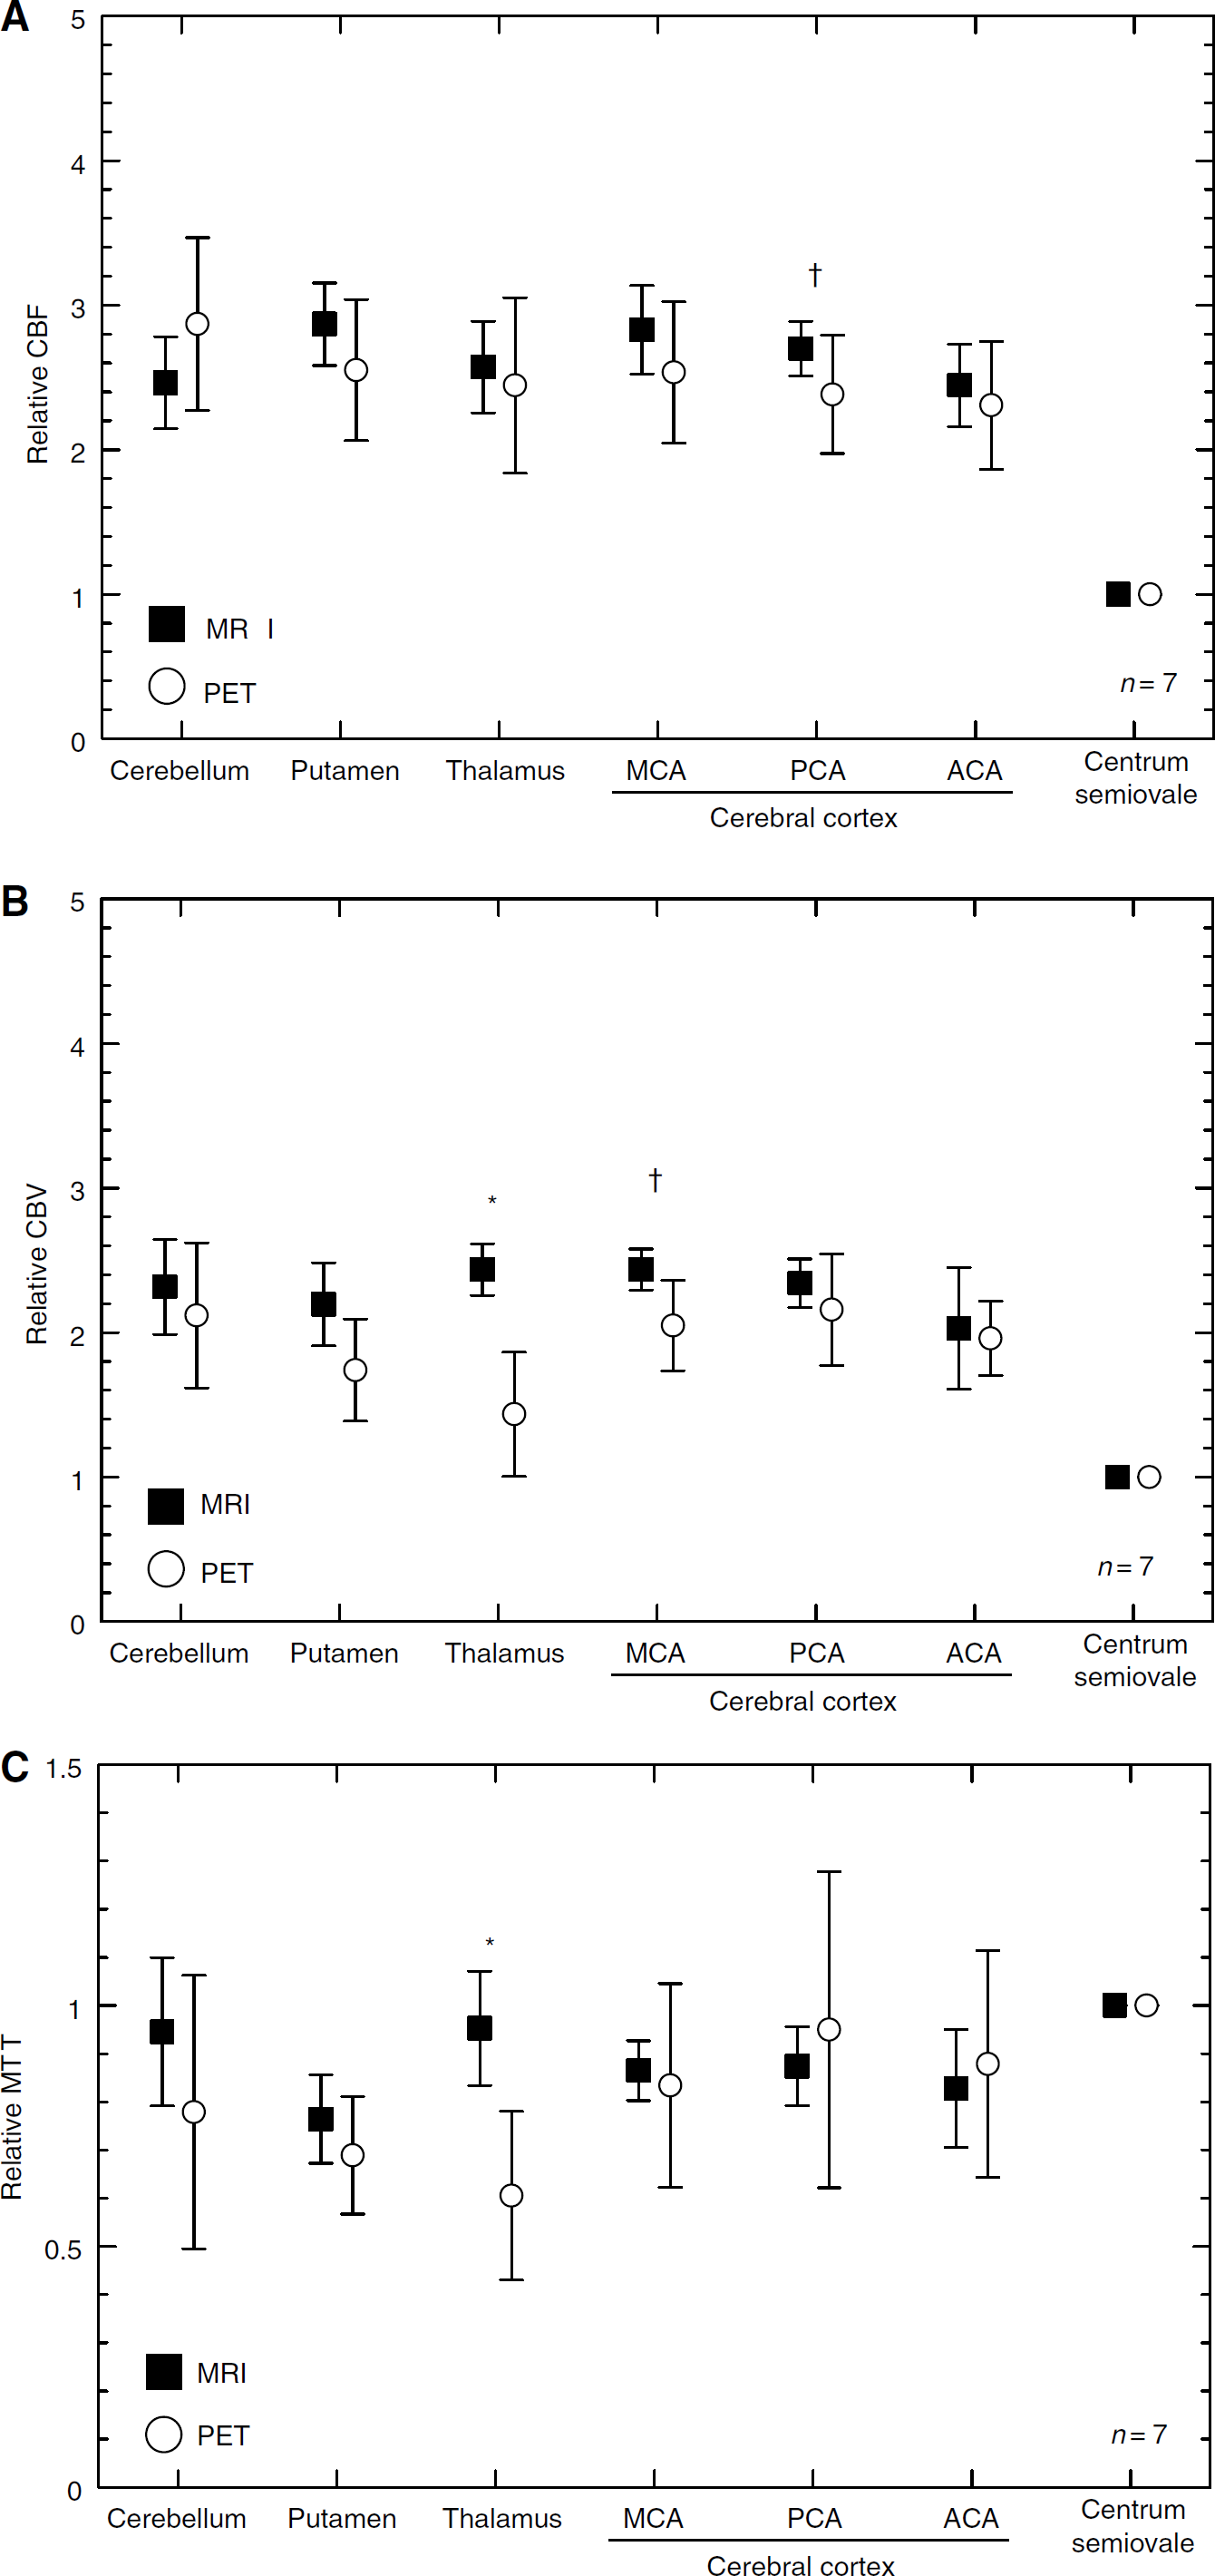
Comparisons of relative measures between PET and DSC-MRI: (
Regional Differences
Mean transit time measured by PET was significantly longer in the centrum semiovale than in the putamen (P < 0.05). Mean transit time measured by PET was significantly shorter in the thalamus than in the cerebral cortical regions analyzed (P < 0.05). Significant differences were not observed among the cerebral cortical regions analyzed.
Mean transit time measured by DSC-MRI was significantly longer in the centrum semiovale than in the putamen (P < 0.05). Significant differences were not observed among the cerebral cortical regions analyzed. Tracer delay measured by DSC-MRI was significantly shorter in the putamen than in the centrum semiovale (P < 0.01) and in the cerebral cortical regions in the MCA (P < 0.05) and PCA (P < 0.01) territories. Among the cerebral cortical regions analyzed, tracer delay was significantly longer in the PCA territory than in the MCA and ACA territories (P < 0.05).
Discussion
We studied cerebral vascular MTT, CBF, and CBV in various brain regions of healthy young adults. Comparison of gray-to-white matter ratios between PET and DSC-MRI showed fairly good agreement for all parameters (relative CBV, relative CBF, and relative MTT), confirming the validity of relative measurements with DSC-MRI. Although DSC-MRI did not provide absolute CBV and CBF values because of scaling problems, we obtained quantitative MTT values calculated as CBV/CBF with absolute units (secs).
To compensate for differences in spatial resolution of PET and DSC-MRI, parametric maps (CBF and CBV) of DSC-MRI were spatially smoothed with a Gaussian filter. This procedure had similar effects on CBF and CBV, and thus MTT was almost the same, irrespective of smoothing, with the exception of the thalamus (Table 1). In the thalamus, smoothing increased the MTT value by approximately 10%. This could be because of contamination of choroid plexus components in the thalamus in ROI analysis (Kao et al, 2003).
Overall, MTT determined by DSC-MRI was shorter than that determined by PET. In the cerebral cortex and centrum semiovale, MTT was approximately 30% less with DSC-MRI than with PET. About regional distribution, MTT was longest in the centrum semiovale for both PET and DSC-MRI. These normal MTT values will comprise a useful set of reference data for use in future clinical PET and DSC-MRI studies. However, error sources in our MTT estimates should be examined.
Mean Transit Time Measured by Positron Emission Tomography
Mean transit time measured by PET was 4.8 secs for the centrum semiovale and 3.9 to 4.3 secs for the cerebral cortex (Table 1), in agreement with a previous PET study (Ito et al, 2003). Slight differences in the cerebellum and putamen may be because of variations in the methods used for CBF quantification (K1—k2 fitting method in the present study versus the autoradiographic method in the previous study).
In contrast to DSC-MRI, PET measurement applies diffusible tracers for CBF quantification. Limited extraction of H215O by brain tissue is known to cause underestimation of CBF (Eichling et al, 1974; Herscovitch et al, 1987). The extraction fraction of H215O in humans is reported to be 0.84, with slight regional variation (Herscovitch et al, 1987), therefore causing a potential 16% underestimation of CBF and a potential 19% overestimation of MTT. However, this effect does not fully account for the differences in MTT between PET and DSC-MRI observed in the present study.
Mean Transit Time Measured by Dynamic Susceptibility Contrast-Enhanced Magnetic Resonance Imaging
Mean transit time measured by DSC-MRI was 2.6 to 3.3 secs for gray matter and 3.5 secs for white matter (Table 2). These results are in accordance with those of other studies that used SVD deconvolution (Table 3). However, there are differences between the SVD method and other deconvolution methods. Deconvolution by Fourier transformation (FT) (Rempp et al, 1994; Østergaard et al, 1996b), which is an intrinsically delay-insensitive method, provides longer MTTs than does the SVD method (Table 3). This is consistent with a simulation study that showed that the FT method results in a large underestimation (approximately 50%) of CBF in the normal flow range (Østergaard et al, 1996b).
Published MTT values measured by DSC-MRI
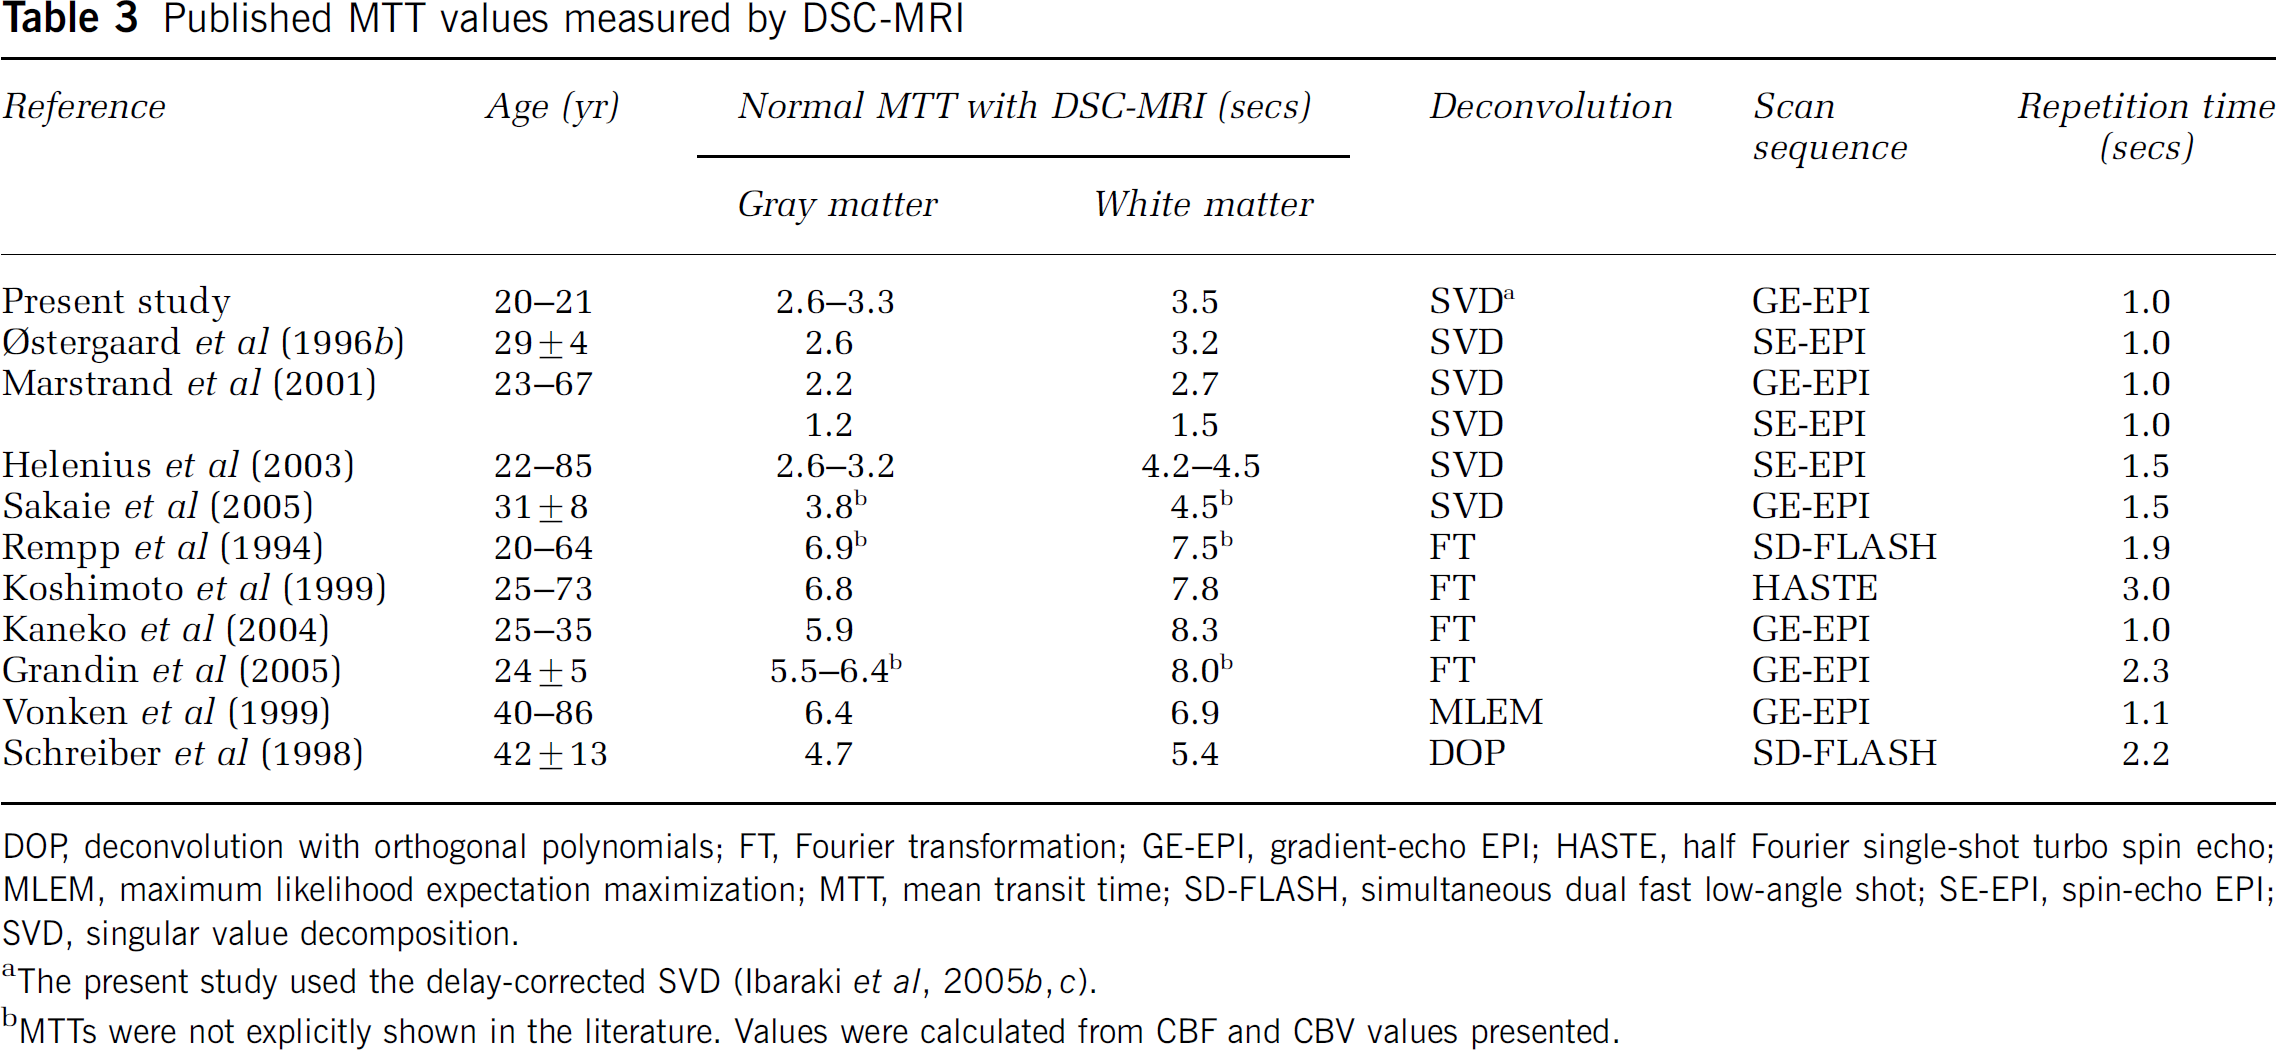
DOP deconvolution with orthogonal polynomials; FT, Fourier transformation; GE-EPI, gradient-echo EPI; HASTE, half Fourier single-shot turbo spin echo; MLEM, maximum likelihood expectation maximization; MTT, mean transit time; SD-FLASH, simultaneous dual fast low-angle shot; SE-EPI, spin-echo EPI; SVD, singular value decomposition.
aThe present study used the delay-corrected SVD (Ibaraki et al, 2005b, c ).
bMTTs were not explicitly shown in the literature. Values were calculated from CBF and CBV values presented.
The reliability of quantitative perfusion MR is open to debate. The reproducibility of absolute CBF and CBV is reported to be worse by DSC-MRI than PET (Carroll et al, 2002; Grandin et al, 2005). The main cause of deterioration is variation of AIF amplitude because of a partial volume effect (Lin et al, 2001; Sakaie et al, 2005). Mean transit time calculated by CBV/CBF is not affected by the partial volume effect and thus may be a more reliable parameter than absolute CBF or CBV. In fact, interindividual variation of MTT determined by DSC-MRI was smaller than that determined by PET (Tables 1 and 2). However, this does not provide direct evidence for the reproducibility of MTT by DSC-MRI, which is essential for clinical application and should be investigated in future studies.
Effect of Hematocrit
Cerebral hematocrit is one of the factors that affect MTT determined by PET and DSC-MRI. In the PET study, CBV was calculated with an assumption of a small (brain)-to-large (radial artery) vessel hematocrit ratio of 0.85 (Phelps et al, 1979). Hematocrit ratios measured in normal brain regions range from 0.69 to 0.88 (Okazawa et al, 1996; Lammertsma et al, 1984; Sakai et al, 1985), suggesting a possible underestimation of CBV and MTT in the present PET study by 20% at most. Therefore, errors in hematocrit ratio do not explain the differences in MTT observed in the present study.
In DSC-MRI studies, MTT measured with a Gd-based contrast agent should be interpreted as plasma MTT rather than blood MTT (Meier and Zierler, 1954). The velocity of plasma is slower than that of RBCs within capillaries (Pries et al, 1986), corresponding to a longer plasma MTT than blood MTT. When a 40% large vessel hematocrit and 0.85 small-to-large hematocrit ratio are assumed, plasma MTT is 10% longer than blood MTT (Pries et al, 1986; Yamauchi et al, 1998). Therefore, to compare MTT obtained by PET and DSC-MRI, it should be converted to blood MTT. However, this conversion increases the differences in MTT between PET and DSC-MRI observed in the present study.
Regional cerebral hematocrit may change with pathologic condition. For example, in patients with occlusive cerebrovascular disease, regional decreases in cerebral hematocrit, which may be associated with greater decreases in plasma velocity than in RBC velocity, has been reported (Yamauchi et al, 1998, 1999). In PET studies, the assumption of constant hematocrit ratio will cause underestimation of CBV and MTT in such brain regions. Dynamic susceptibility contrast-enhanced magnetic resonance imaging with a plasma tracer will provide longer MTT values than true blood MTT values. Therefore, changes in cerebral hematocrit have opposing effects on MTTs as determined by PET and DSC-MRI and may complicate interpretation of MTT in cerebrovascular disease.
Sensitivity to Vascular Components
Positron emission tomography and DSC-MRI have different sensitivities to vascular components. Whereas C15O PET measurement of CBV is equally sensitive to all vascular components (arteries, capillaries, and veins), measurement with DSC-MRI originates from the microvasculature in the vicinity of the brain parenchyma, where the contrast agent induces magnetic-field inhomogeneity resulting in decreased MR signal. This is represented in CBV and CBF maps for each modality (Figure 1). Cerebral blood flow and CBV maps obtained with DSC-MRI are similar to each other, but in the PET study the CBV map is quite different from the CBF map. Cerebral blood volume measured with C15O PET shows larger values on the outside of the cortical surface than in the brain parenchyma. About sensitivity to vascular components, MTT obtained with DSC-MRI may be shorter than MTT obtained with PET.
The extent to which MTT measured by DSC-MRI is shorter than that measured by PET may reflect the proportion of the vascular volume that is detected by DSC-MRI depending on scan sequence (Boxerman et al, 1995; Kiselev, 2001). A DSC-MRI study in pigs showed that when absolute scaling was introduced to match CBF values between PET and DSC-MRI, absolute CBV obtained with spin-echo-type sequence was 40% to 50% of that obtained with PET, indicating that MTT measured by spin-echo DSC-MRI is 40% to 50% of that measured by PET (Østergaard et al, 1998b). These authors speculated that spin-echo DSC-MRI is sensitive to vessels smaller than 30 to 40 μm in diameter that occupy ~ 50% of the total vascular volume. Our present study showed that MTT measured by gradient-echo DSC-MRI is approximately 70% of that measured by PET, or approximately 60% if the small-to-large hematocrit ratio is assumed to be 0.69 as in the study of Østergaard et al (1998b), indicating that gradient-echo DSC-MRI detects a larger proportion of the vascular volume and is more sensitive to vessels of larger diameter than spin-echo DSC-MRI. This finding is consistent with theoretic calculations (Boxerman et al, 1995; Kiselev, 2001) and results of human study and animal experiment (Simonsen et al, 2000; Marstrand et al, 2001). This property of DSC-MRI suggests that MTT determined by DSC-MRI changes with alterations of cerebral vessels even when the CBV/CBF ratio remains constant, complicating interpretation of MTT in cerebrovascular disease involving vasodilatation, vasoconstriction, or alteration of vascular components.
In conclusion, we showed that normal MTT measured with DSC-MRI is shorter than that measured with PET. The difference may be attributed to differences in intrinsic sensitivity of each imaging modality to vascular components. Positron emission tomography and DSC-MRI may measure different types of vascular transit time, depending on their intrinsic sensitivities. This underlying difference may influence interpretation of MTT determined by PET or by DSC-MRI for patients with cerebrovascular disease.
Footnotes
Acknowledgements
We thank the technical staff of Akita Research Institute of Brain and Blood Vessels, particularly Shigeki Sugawara, for performing the PET experiments. This research was supported in part by a Grant-in-Aid for Young Scientists (16790751) from the Ministry of Education, Culture, Sports, Science and Technology of Japan.