
Abstract
Previous neuron and glial cell culture studies of excessive poly (ADP-ribose) polymerase (PARP-1) activation found NAD+ depletion, glycolytic arrest, and cell death that could be avoided by exogenous tricarboxylic acid cycle (TCA) metabolites, especially pyruvate (pyr). Pyruvate neuroprotection has been attributed to cytosolic NAD+ replenishment, TCA metabolism, and antioxidant activity. We investigated the first two mechanisms in respiring cerebrocortical slices after a 1-h H2O2 exposure to activate PARP-1. H2O2 was followed by a 4-h recovery with oxy-artificial cerebrospinal fluid superfusion having either: (1) no glucose (glc) or pyruvate; (2) 10 mmol/L glc only; (3) 10 mmol/L pyruvate only; (4) both 10 mmol/L glc and 10 mmol/L pyruvate. Poly-ADP-ribosylation was quantified from Western blots and immunohistochemistry. Perchloric acid extracts were quantified with 14.1 T 31P nuclear magnetic resonance spectroscopy. Just after H2O2 exposure, ATP and NAD+ decreased by ≈50%, PCr decreased by 75%, and the ADP/ATP ratio approximately doubled. ATP and NAD+ changes, but not PCr changes, were nearly eliminated if PARP inhibitors accompanied the H2O2. Recovery with both pyruvate and glc was better than with glc alone, having higher ATP (0.161 versus 0.075, P < 0.01) and PCr levels (0.144 versus 0.078, P < 0.01), and higher viable cell counts in TUNEL and Fluoro-Jade B staining. Two-dimensional [1H-13C] HSQC spectra showed metabolism during recovery of 13C glc or pyr. Pyruvate metabolism was primarily via pyruvate dehydrogenase, with some via pyruvate carboxylation. Pyruvate superfusion of PARP-injured brain slices helps replenish NAD+ while providing metabolic fuel. Although this augments recovery, a strong antioxidant role for pyruvate has not been ruled out.
Introduction
For approximately 20 years, it has been known that hyperactivation of poly (ADP-ribose) polymerase-1 (PARP-1, E. C.2.4.2.30), an enzyme abundant in cell nuclei, occurs in response to DNA damage from conditions such as hypoxia, ischemia, hypoglycemia, and free radical injury (Schraufstatter et al, 1986; Suh et al, 2003; Ueda and Hayaishi, 1985). Recent review articles summarize in vivo and in vitro associations between PARP-1 hyperactivation from DNA damage and subsequent severe cell injury and death (Chiarugi, 2005; Virag and Szabo, 2002). Articles specific for PARP-1's influence in central nervous system injury and protection (Chiarugi, 2005; Eliasson et al, 1997; Endres et al, 1997) describe that as in other tissues, PARP-1 inhibition in the central nervous system during numerous types of stress reduces injury and death. Given the large number of studies that showed impressive in vivo protections by PARP inhibitors, including those showing enhanced protection in genetically engineered PARP knockout animals (Hagberg et al, 2004), it is easy to appreciate the importance of developing pharmacological interventions for PARP-1 inhibition. However, because energy failure has been strongly implicated in PARP-1-related injury, it is important to know whether metabolic manipulations exist that are protective despite PARP-1 activation.
Mechanistic explanations of PARP-associated injury emphasize the depletion of NAD+ (β-nicotinamide adenine dinucleotide) (Berger, 1991; Cochrane, 1991; Ying et al, 2002). Activated PARP-1 cleaves NAD+ into nicotinamide and ADP-ribose, and attaches ADP-ribose polymers onto various nearby nuclear proteins, including itself, which causes self-inactivation (Virag and Szabo, 2002). It has been suggested that in healthy cells having only small amounts of DNA damage, poly-ADP-ribosylation efficiently starts the process of DNA repair by recruiting appropriate proteins that act after poly-ADP-ribose glycohydrolase (PARG, E.C.3.2.1.144) removes the poly-ADP-ribose units, undoing PARP's work (Bonicalzi et al, 2005; Malanga and Althaus, 2005).
It has been hypothesized that in cells having heavily damaged DNA, intense overconsumption of NAD+ is triggered by back-to-back action of PARP-1 and PARG, that is, by futile cycling that has PARP repeatedly attaching ADP-ribose units as PARG repeatedly removes them (Berger, 1991). Energy metabolism can be disrupted by excessive consumption of NAD+, a key redox participant in cytosolic glycolysis. NAD+'s redox couple, NADH, is a key participant in mitochondrial ATP production that can potentially be affected by associated decreases in NAD+. Additionally, NAD+ restoration adds to energy depletion, because four ATP molecules are required to resynthesize one NAD+ (Zhang et al, 1994). The futile-cycle hypothesis is supported by results of monolayer neuron and astrocyte cell culture experiments (Ying et al, 2005, 2002), which found that PARP hyperactivation by N-methyl-N-nitrosoguanidine or H2O2 led to cytosolic NAD+ depletion, glycolytic arrest, and cell death from energy failure. More significantly, cell death in those studies was prevented or reversed by administration of PARP inhibitors or tricarboxylic acid cycle (TCA) substrates such as pyruvate, glutamine, and α-ketoglutarate.
Because acute brain slice preparations provide tissue conditions closer to those found in vivo, we used them to further investigate energy failure hypotheses underlying injury after PARP activation. One expectation was that phenomena would at least approximately resemble those found in cell culture studies, but with differences in important details of NAD+ decreases, glycolytic arrest, and prevention/rescue by TCA substrates.
Materials and Methods
Materials
Reagents were purchased from Sigma Chemical Co (St Louis, MO, USA), except where noted.
Perfused Brain Slice Preparation and Experimental Design
Respiring cerebrocortical slices from 7-day old (P7) neonatal Sprague-Dawley rats were obtained, recovered, and maintained according to a previously described protocol (Hirai et al, 2002; Litt et al, 2003; Zeng et al, 2004) that was approved by the UCSF Committee on Animal Research. Individual experiments used 20 slices (350 μm thick) from 10 P7 rats, were at 37°C at an artificial cerebrospinal fluid (ACSF) flow rate of 10–15 mL/min, and maintained at constant PCO2 (40 mm Hg), PO2 (600 to 650 mm Hg), and pH (7.4).
Figure 1 shows a schematic diagram for one experiment. After 3 h of metabolic recovery, PARP activation was induced by 1 h of oxidative stress, produced by superfusion with 2 mmol/L H2O2 in glucose-free artificial cerebrospinal fluid (Davis et al, 1998). The H2O2 exposure was followed by 4 h of recovery (from t = 1 to 5 h) with four groups of different well-oxygenated superfusates: (1) only glucose (10 mmol/L); or (2) only pyruvate (10 mmol/L); or (3) 10 mmol/L glucose together with 10 mmol/L pyruvate; (4) no glucose or pyruvate. ACSF with pyruvate was prepared immediately before use, because of the known dimerization and transformation of pyruvate in solution, first to pyruvate hydrate (2,2-dihydroxypropanoic acid), which happens in minutes (≈20% conversion), and then to parapyruvate (γ-methyl-γ-hydroxy-α-ketoglutaric acid) ≈25% at 24 h (Montgomery and Webb, 1956). Slice sampling was taken at t =0, 1, and 5 h as indicated in Figure 1. Removed slices were washed rapidly in 4°C normal saline, frozen immediately in liquid nitrogen (LN2), and stored at −80°C for subsequent processing.
Twenty brain slices were obtained for each experiment, and then treated as shown in this schematic diagram, where earliest times are to the left. Five predetermined times are indicated. For the primary protocol, slices were removed at the three times marked by arrows.
In two additional experimental groups, PARP inhibition was investigated by augmenting the superfusate with either 3-aminobenzamide (3AB) or 3,4-dihydro-5-[4-(1-piperidinyl)butoxyl]-1(2 H)-isoquinolineone (DPQ). Administration of 3AB or DPQ started 1 h before the H2O2 insult (t = −1 h) and stopped simultaneously with H2O2 termination (t = 1 h). Additional slice sampling was performed at t =20 mins during H2O2 exposure. Additional control studies were done, including slice superfusion with no oxidative stress, with and without various PARP inhibitors and metabolic substrates.
Western Blots of Poly (ADP-ribose)
Three frozen slices from each time point (≈3 × 50 mg wet weight) were placed in an ice-cold lysis buffer (20 mmol/L HEPES-KOH at pH 7.5, 10 mmol/L KCl, 1.5 mmol/L MgCl2, 1 mmol/L ethylene diaminetetraacetic acid (EDTA), 1 mmol/L ethylene glycol-bis (2-aminoethyl ether)-N,N, N',N'-tetraacetic acid (EGTA), 0.1% sodium dodecyl sulfate, 1 x Protease inhibitor cocktail). The mixture was sonicated and centrifuged (10,000g) at 4°C for 20 mins. The supernatant was used as the whole-cell protein extraction. Proteins were separated by sodium dodecyl sulfate-polyacrylamide electrophoresis on a 4% to 12% Bis Tris gel (Invitrogen, Carlsbad, CA, USA). Separated proteins were transferred from the gel to a polyvinylidine difluoride membrane (Millipore, Bedford, MA, USA), which was then incubated for 1 h in a blocking buffer containing 5% blotting grade nonfat dry milk in 0.1 mol/L sodium phosphate buffer (pH 7.4). Next, the membrane was incubated overnight with mouse anti-PAR monoclonal antibody 4335-MC (Trevigen, Gaithersburg, MD, USA) diluted 1:1,000, washed, and incubated for 1 h with a 1:10,000 dilution of peroxidase conjugated anti-mouse IgG (Amersham Life Science, Piscataway, NJ, USA). Bound antibody was visualized by chemiluminescence (Amersham Life Science, Piscataway, NJ, USA). β-Actin was measured as a check on protein loading. Poly (ADP-ribose) was quantified from optical densities (OD) obtained by the program Kodak ID 3.5.3 for molecular weights between 80 and 270 kDa. After quantifying the OD of β-Actin as an internal control, the following and OD ratios were determined for each time point: (poly (ADP-ribose))/(β-actin). Measured intensities for different blots on different days were normalized using quantifications of bands from a reference lane on each blot that always came from the same source and always had the same amount of protein.
Immunohistochemistry of Poly (ADP-ribose)
Sections 8 μm thick were incubated in 3% H2O2 at room temperature for 5 mins, blocked with 1% bovine serum albumin for 30 mins, and then blocked with 10% normal horse serum for 60 mins. After overnight incubation at 4°C with a monoclonal anti-PAR antibody (Trevigen, Gaithersburg, MD, USA) diluted 1:500, slice sections reacted for 1 h at room temperature with biotinylated horse anti-mouse IgG (Vector Laboratories, Burlingame, CA, USA) diluted 1:1,000. Excess antibody was removed and the bound antibody was visualized with the ABC streptavidin detection system and 3,3'-diaminobenzidene (Vector Laboratories, Burlingame, CA, USA). Nuclei were counterstained with methyl green solution (Zymed, South SF, CA, USA).
Enzymatic NAD+ Assay
Total intracellular NAD+ in brain slices was measured using a previously described enzymatic recycling assay (Szabo et al, 1996; Ying et al, 2001) with minor modifications. For each time point, NAD+ was measured separately in three slices, and the average was taken as the value for that time point. The enzymatic recycling method starts with conversion of all NAD+ to NADH, this being performed with alcohol dehydrogenase (Roche Diagnostic, Indianapolis, IN, USA). NADH reduces 3-(4,5-demethylthiaol-2-yl)-2,5-diphenyl tetrazolium bromide (faint yellow) to formazan through an intermediate, phenazine methosulfate, which makes the mixture dark yellow. Optical density measurements at 560 nm were made of rate reductions, after calibrating against NAD+ standards. Results were normalized to total protein concentration as determined by bicinchonic acid method.
Perchloric Acid Extraction of Metabolites and Sample Preparations for Nuclear Magnetic Resonance Studies
Seven frozen slices from each time point were pulverized in LN2. The resulting fine powder was placed in 7 mL of 12% perchloric acid (PCA) at 4°C. Our previously described procedure for PCA extraction was followed (Espanol et al, 1998), and final extracts were then lyophilized (BenchTop 2K Lyophilizer, Virtis, Gardiner, NY, USA). Each lyophilized sample was dissolved in 450 μL of 99.9% D2O. Centrifugation then followed, and a 300 μL aliquot of supernatant was removed. One microliter of 700 mmol/L 3-(trimethylsilyl)-tetradeuterosodium propionate (TSP) was added as an internal nuclear magnetic resonance (NMR) reference. After pD was adjusted to 7.0 to 7.4, the extract was transferred into a 5-mm Shigemi NMR tube (Shigemi Co, Tokyo, Japan) and 1H and 13C NMR spectroscopy were performed. Before 31P spectroscopy EDTA was used to chelate and remove line-broadening cations; 2 μl of 330 mmol/L methylene diphosphonate (MDP) was added as a 31P NMR reference; and the pD was again adjusted to 7.0 to 7.4.
31P Nuclear Magnetic Resonance Spectroscopy at 14.1 T
Nuclear magnetic resonance (NMR) studies were performed in the UCSF Magnetic Resonance Laboratory using a 14.1-T (600-MHz) Varian UNITY spectrometer with an INOVA console and a customized, multinuclear Z-SPECT radiofrequency probe that was optimized for this project (3NG600-8, Nalorac Division of Varian, Martinez, CA, USA). Basic one-pulse, 90° tip-angle RF sequences were used for obtaining 1H spectra at 599.92 MHz and 31P spectra at 242.86 MHz. The extra homogeneity provided by the Shigemi NMR tubes and the Varian INOVA shimming software typically resulted in spectral line-widths of 0.004 parts per million (p.p.m.) full width at half-maximum (FWHM) for 1H water protons and 0.01 p.p.m. FWHM for the 31P of phosphocreatine. Phosphorous spectra were obtained with proton decoupling and a 1-s interpulse delay during 8-h runs.
Figure 2A shows a typical high-energy phosphate spectrum from well oxygenated control slices. The phosphocreatine (PCr) resonance, which has been assigned to a frequency of 0 p.p.m., is at the left edge, and β-NTP at the right edge. Figures 2B–2E show higher magnification images of portions of Figure 2A. The notation ‘NTP’ and ‘NDP’ is conventionally used in in vivo and low-resolution 31P NMR spectroscopy to represent the nucleoside triphosphates and diphosphates that occur with any of four different bases: adenine, cytosine, guanine, and uracil. In in vivo and low-resolution spectroscopy chemical shifts for any one phosphate are too close to resolve for different bases. At low spectral resolution, one typically has one broad β-NDP peak, with contributions to it coming from β-ADP, β-CDP, β-GDP, and β-UDP. Figures 2B and 2C show that the high spectroscopic resolution of our 14.1 T system allows the very small chemical shift differences for certain different bases to be resolved. Figure 2D shows a doublet resonance for both the α and β phosphates of NAD+. NAD+ quantifications were derived from the integrated NMR signal intensity for the β phosphate doublet centered at ≈−8.40 p.p.m., as that region in our spectra did not have any other significant background resonances. As can be seen in the Figures 2C and 2D, NAD's α phosphate doublet sits in a region crowded by other peaks, which in brain tissue are known to include UDP-diphosphates (Lutz et al, 1997). Figure 2E shows the apparent triplet (overlapping doublet) resonance for β-ATP, with minimal background contributions from UTP and CTP. ADP was quantified by integrating the clearly separated signal for α-ADP (Figure 2C), while ATP was similarly quantified from β-ATP. Relaxation time corrections were not introduced, as the same NMR pulsing sequence was used for all runs and the goal of the analysis was primarily to detect large differences from control.
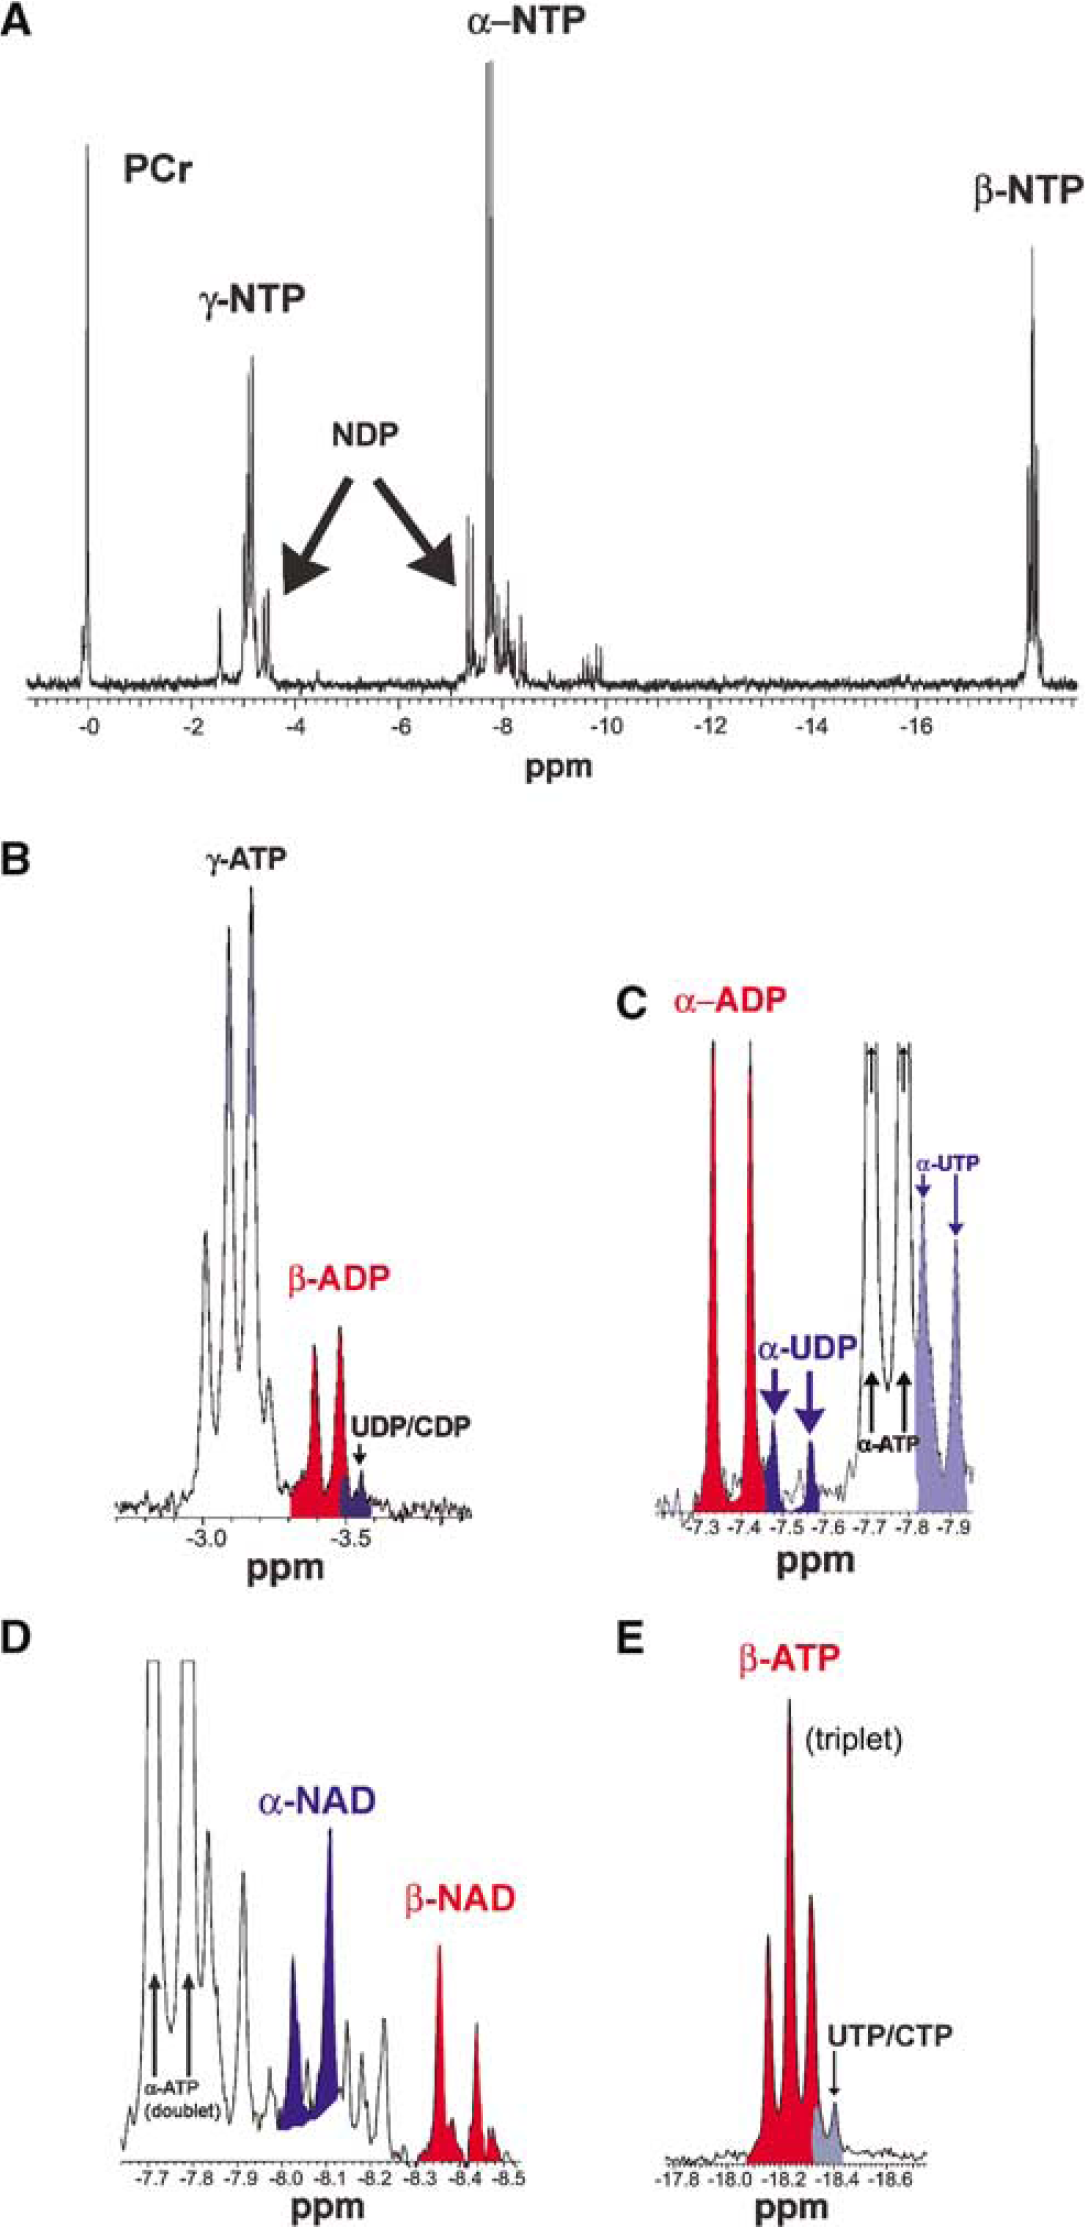
Enlarged sections are presented (
Indirect Detection of 13C Metabolites with Two-Dimensional Heteronuclear Single Quantum Coherence Spectroscopy
Special studies were carried out at 25°C using a different 14.1 T Varian UNITY-INOVA spectrometer equipped with an actively shielded 5-mm triple resonance cryogenic probe with a Z-axis pulsed field gradient coil (1H at 600MHz, 13C at 150.9MHz). Sensitivity-enhanced hetero-nuclear single quantum coherence spectroscopy (HSQC) spectra were obtained (Kay et al, 1992; Palmer et al, 1991). Transients were acquired with a 1-sec relaxation delay, 8 scans per increment, a 1H spectral width of 7,200 Hz (acquisition time of 142 ms) and a 13C spectral width of 15,000Hz with a maximum evolution time of 133 ms. The NIH programs NMRPipe and nmrDraw (Delaglio et al, 1995) were used to process spectra to yield pure absorption mode spectra. Apodization was applied using sine-squared window functions in the 1H and 13C dimensions. Resulting two-dimensional (2D) spectra were then analyzed and displayed with SPARKY (TD Goddard and D G Kneller, SPARKY 3, University of California, San Francisco, CA, USA). TSP was used as a chemical shift standard, with lactate referenced to 1.33 p.p.m. (1H) and 21.3 p.p.m. (13C).
In Situ Labeling of DNA Fragmentation and Fluoro-Jade B Staining
Manifestations of cell death were sought using fluorescent in situ terminal deoxynucleotidyl transferase-mediated uridine 5'-triphosphate-biotin nick end labeling (TUNEL staining). Sections were first permeabilized in 0.1% Triton X-100 in phosphate-buffered saline (PBS) for 8 mins. TUNEL reaction mixture was obtained by adding terminal deoxynucleotidyl transferase to nucleotide mixture, as instructed by the manufacturer's manual (Roche Diagnostics, Mannheim, Germany). Each section was then incubated with 50 μL TUNEL reaction mixture in a humidified chamber at 37°C in dark for 60 mins. After rinsing with PBS, sections were counterstained nuclei with 0.5 μg/mL propidium iodide (PI). Propidium iodide was used after fixation to permeate all cells. Propidium iodide here did not provide vital staining. Wavelengths for fluorescence were excitation at 488 nm with emissions > 515 nm for fluorescein; and excitations < 535 nm with emission at about 615 nm for PI.
Nonviable neurons were identified by Fluoro-Jade B (FJB) staining (Schmued and Hopkins, 2000), and conterstained by 0.0002% 4',6-diamidino-2-phenylindole dihydrochloride (DAPI). The tissue was then examined using a microscope with blue (450 to 490 nm) excitation light and detected with emissions > 515 nm. DAPI counterstained nuclei were visualized when excited by ultraviolet (330 to 380 nm) light.
Quantifications and Statistical Analysis
Quantifications of positive cells in TUNEL staining and FJB staining were performed by taking images in five regions of slice sections at a magnification of 400 x. Cell counts were obtained by counting nuclei for healthy and injured neurons and glia. Counts of positive cells, given in the results as percentages of total numbers of cells, were performed for regions below the pial layer but above the injury layer.
All data are shown as mean ± s.e. Data in Figures 3, 5 were compared using unpaired t-tests. Data in Figure 6 were assessed by analysis of variance followed by the Fisher's protected least significant difference post hoc test, with P-values less than 0.05 were considered statistically significant.
(
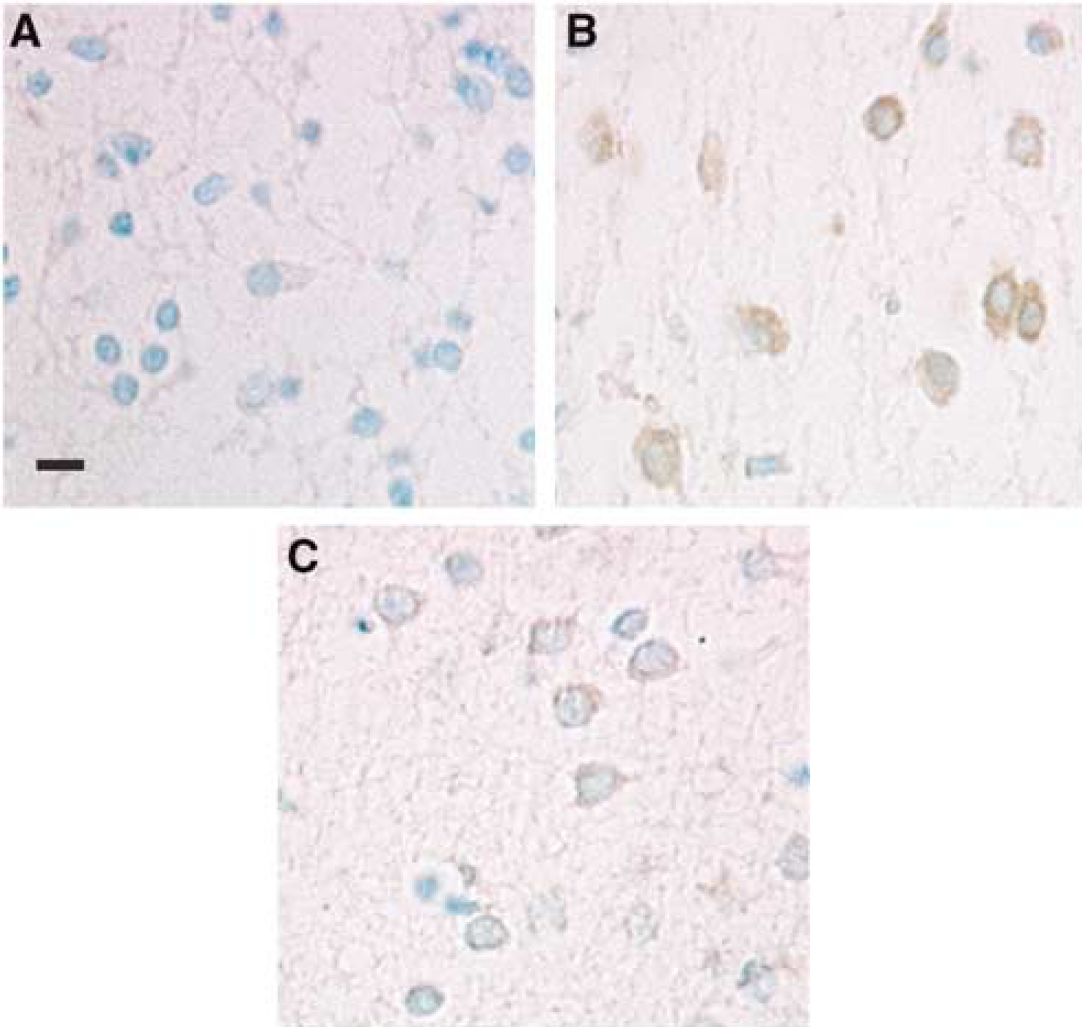
Immunohistology images showing 3AB's inhibition of H2O2 induced poly (ADP-ribose) formation in brain slices. Poly (ADP-ribose) immunoreactivity (brown) is shown in 8 μm thick section from representative slice taken at t = 1 h. Nuclei were counterstained with methyl green. For (
(
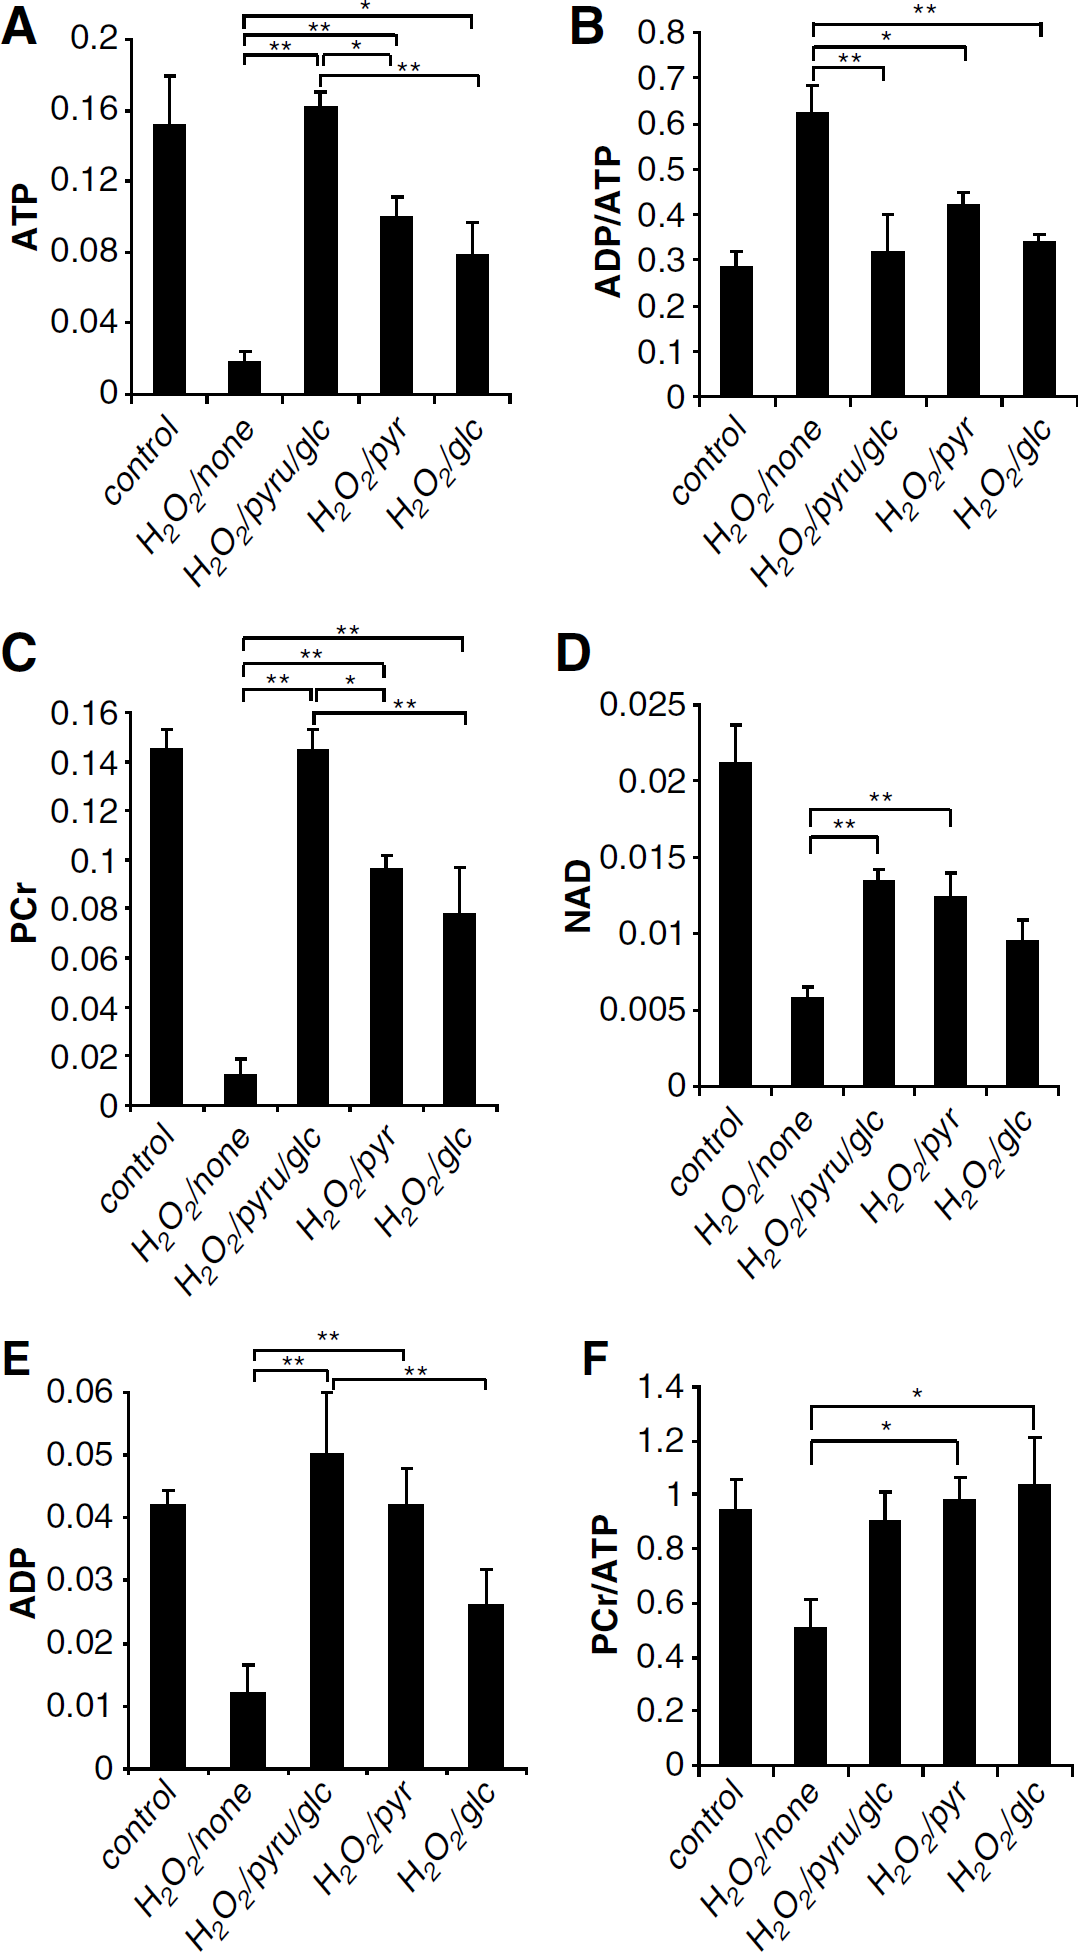
NAD+ and high-energy phosphate outcomes at t =5 h with different substrates during recovery after H2O2 insults. Using no glycolytic substrate produced an outcome that was significantly worse than that of each of the other three groups. Using both pyruvate and glucose was better than using glucose alone. Recovery with both pyruvate and glucose came closest to fully restoring all of the plotted variables. Averages are given as mean±s.e., *P < 0.05, **P < 0.01, n = 3 per group. Pyr, pyruvate; Glc, glucose; None, no pyruvate or glucose.
Results
Poly (ADP-ribose) Detection after Poly (ADP-Ribose)-Polymerase 1 Activation
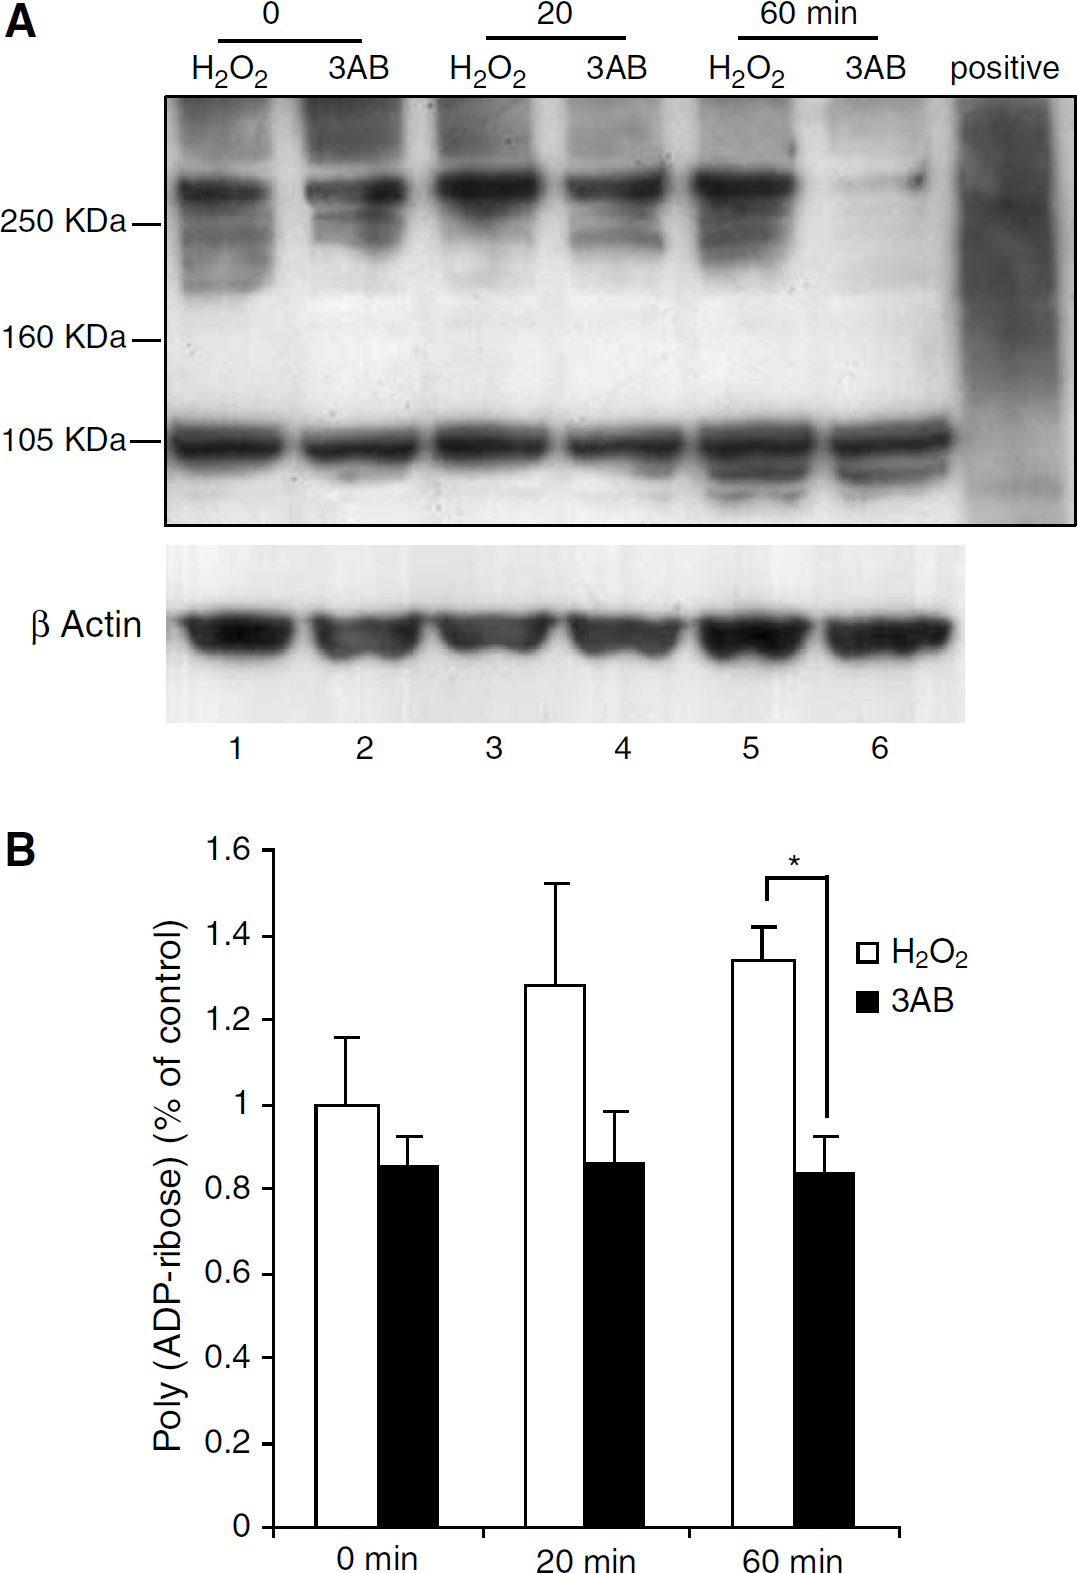
Figure 3 presents Western blot results for poly (ADP-ribose) staining during special experiments that examined PARP-1 inhibition during 60 min exposures to 2 mmol/L H2O2. Increased poly (ADP-ribose) appears as a diffuse increase in PAR immunoreactivity in the range 80 to 270 kDa, the poly (ADP-ribose) range exhibited in Trevigen's poly-ADP ribosylated protein control samples from Escherichia coli. Such is clearly evident in Figure 3A at t =20 mins and t =60 mins (columns 3 and 5 from the left). The PARP-1 inhibitor 3AB significantly reduced PAR-polymer formation (columns 4 and 6 from the left). Numerical values in Figure 3B for the ratio (poly (ADP-ribose))/(β-Actin) were 1.25 ± 0.14 at t =20 mins, compared with 0.9 ± 0.13 in 5 mmol/L 3AB-treated slices; and 1.35±0.15 at t =60 mins compared with 0.86 ± 0.11 (P < 0.01) in 3AB-treated slices. Additional parallel control experiments were performed under well-oxygenated conditions with no H2O2 exposure. Poly (ADP-ribose) staining versus time showed basic PARP activity that had similar poly (ADP-ribose) intensity as column 1 (data not shown).
Figure 4 shows poly (ADP-ribose) as brown immunostaining in slices removed at t =1 h, that is, at the end of the H2O2 exposure. Figure 4A shows mild brown staining in control slices that were not treated with H2O2 or 3AB, indicating basic PARP activity in our brain slices. The dark brown staining in Figure 4B provides evidence of intense PARP activation during the H2O2 treatment. Poly (ADP-ribose) accumulations are seen in both cytosolic and nuclear regions. Reduced poly (ADP-ribose) staining in Figure 4C demonstrates the inhibition of PARP activation in slices pretreated with 3AB.
NAD+, ATP, ADP, and PCr after Poly (ADP-Ribose)-Polymerase-1 Activation
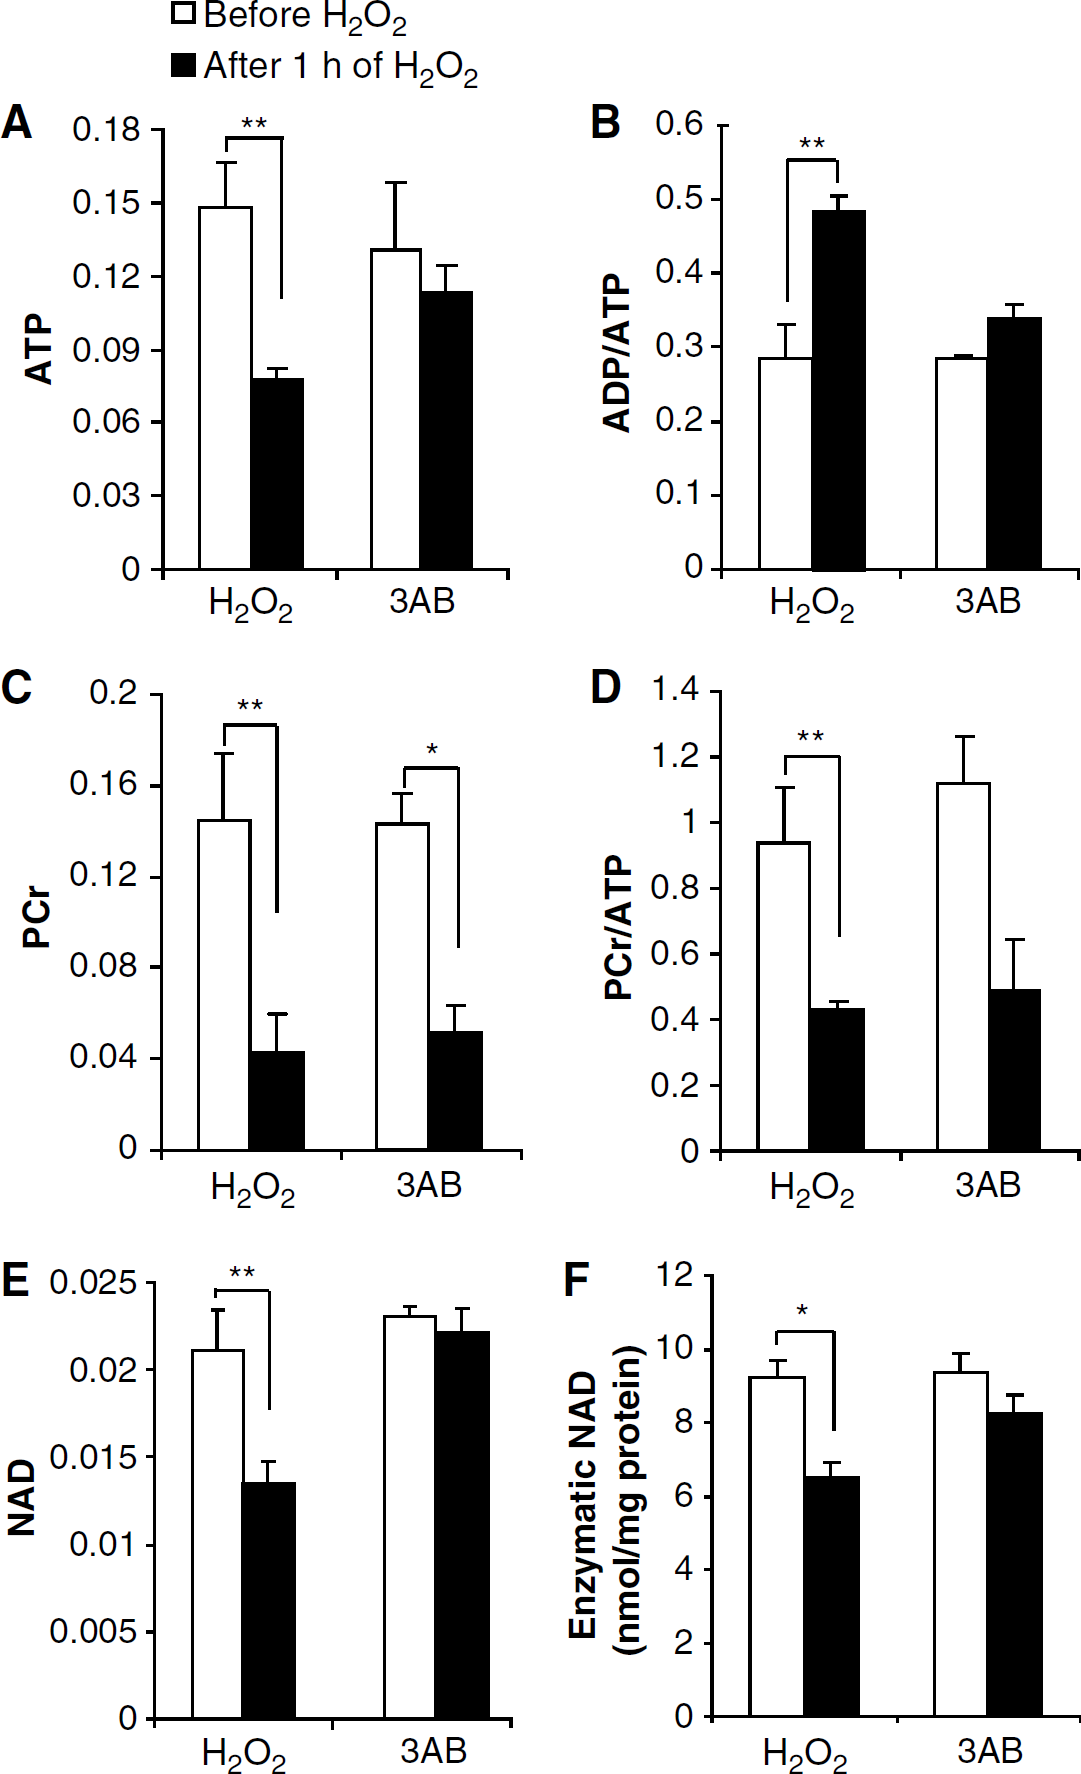
Figures 5A–5E gives comparisons of high-energy phosphate ratios for the beginning and end of H2O2 exposures, with ATP, ADP, NAD+, and PCr signal intensities first being compared with that of MDP, and then being compared with each other. Although relaxation time corrections are needed for obtaining true concentration ratios for different metabolites, such corrections are not needed for obtaining ratios of the same metabolite at different times, as in Figure 5. The results showed that ATP, PCr, NAD+ dramatically decreased (0.148 versus 0.078, 0.145 versus 0.043, and 0.0211 versus 0.0135 respectively, P < 0.01) and ratio of ADP/ATP was increased (0.284 versus 0.485, P < 0.01) after H2O2 insults. Such high-energy phosphate changes were prevented by the PARP inhibitor, 5 mmol/L 3AB. Figures 5E and 5F show a comparison of NAD+ quantifications found by different methodologies: integration of NMR signal intensities and enzymatic determinations as in Ying et al (2002) study. Similar results were obtained when NAD + was significantly consumed after 1 h treatment of 2 mmol/L H2O2 and NAD+ reduction can be prevented by 5 μmol/L 3AB pretreatment. Additional parallel experiments were carried out with 50 μmol/L DPQ and same protection was found (data not shown).
NAD+ and High-Energy Phosphate Outcomes at 5h with Different Substrates during Recovery
Figure 6 shows NMR outcomes for four groups, each having a different nutrient administration in the recovery period (between t = +1 and +5 h): (0 glc, 10 mmol/L pyruvate), (10 mmol/L glc, 0 pyruvate), (10 mmol/L glc, 10 mmol/L pyruvate), and (0 glc, 0 pyruvate). Not shown are NMR control data where unstressed brain slices were superfused for 4 h without any metabolic substrates and slices energy was well reserved.
The use of no glycolytic or TCA substrate during recovery significantly produced the worst outcome for all measures (P < 0.05). In contrast, recovery with the pyruvate–glucose combination came closest to fully restoring all plotted variables. Moreover, using pyruvate–glucose combination was better than using glucose alone for achieving higher ATP and PCr levels (0.161 versus 0.075 and 0.144 versus 0.078, P < 0.01).
Confirmation of Pyruvate and Glucose Metabolism in Heteronuclear Single Quantum Coherence Spectroscopy Spectra
Figure 7 shows the superposition of corresponding sections from two 2D [1H-13C] HSQC NMR spectra. Each spectrum appears as a contour plot of three-dimensional peaks coming up out of the paper towards the reader. 1H chemical shifts (p.p.m.) are along the x-axis, with higher values at the left. 13C chemical shifts (p.p.m.) are along the y-axis, with higher values towards the bottom. The familiar lactate peak does not appear because it is off scale to the upper right at (1.33 p.p.m., 21.3 p.p.m.). Both spectra were obtained from slices taken at t =5h, with purple contours plotted for the case where [U-13C]glucose was administered in the post-H2O2 recovery period, and green contours plotted for the use of [3-13C]pyruvate in the post-H2O2 recovery period. Multiple peaks within the projections of the aspartate-C3 and malate-C3 resonance areas along the 13C axis, as well as the wide doublet structure in the succinate resonance projection along the 1H axis, arise from there being one or more additional, neighboring 13C nuclei on these metabolites. Background contributions from naturally abundant 13C compounds are negligible.
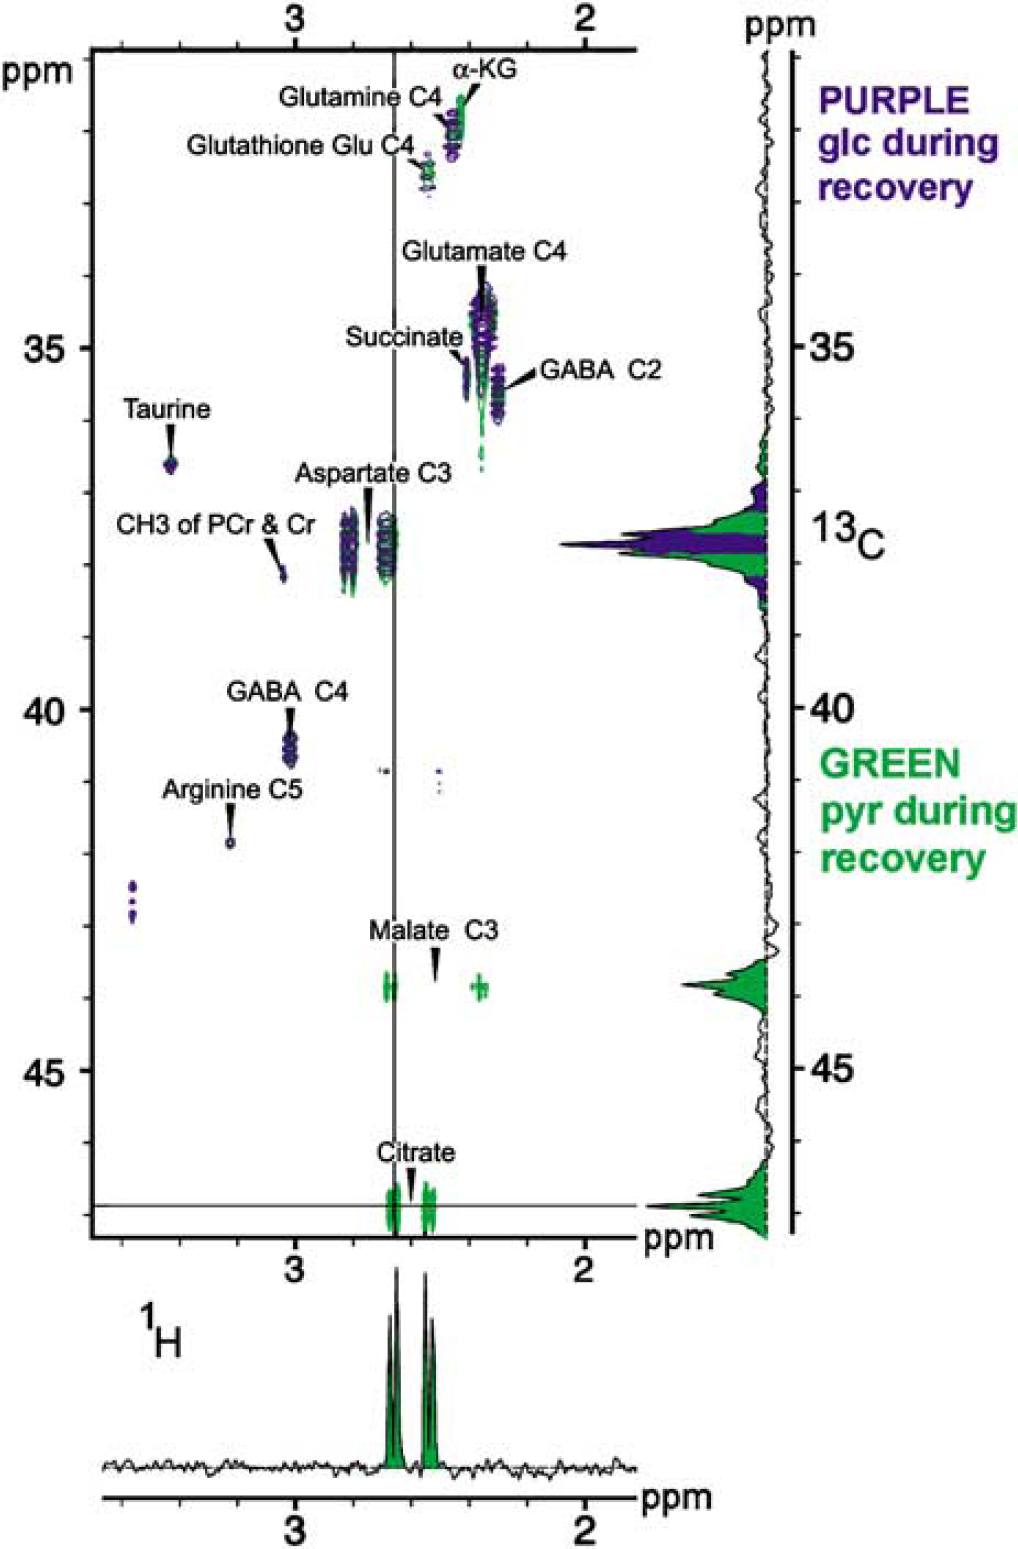
An overlay of two representative HSQC spectra is presented, each coming from slices removed at the end of the 4-h recovery period after H2O2 exposure. Parts per million (p.p.m.) frequency units are used for each axis, with 13C chemical shifts plotted vertically, and 1H chemical shifts plotted horizontally. A 2D NMR plot presents 3D information about resonance peaks rising up out of the plane of the figure at different (1H, 13C) chemical shift coordinates, where these correspond to chemical shift values of adjacent (coupled) 1H and 13C atoms. For example, methyl protons on C3 of lactate are known to have a 1H chemical shift of 1.33 p.p.m., while lactate's C3 is known to have a 13C chemical shift of 21.3p.p.m. Thus, an upward cone for lactate C3 (not shown in the figure) occurs with p.p.m. coordinates of (1.33, 21.3). For each rising peak contours around it are shown for different heights, representing intersections of the peaks with planes parallel to the plane of the 1H and 13C axes. Purple data are from a run where [U-13C]glucose alone was given in the recovery period. Green data are from a run where [3-13C]pyruvate alone was given in the recovery period. Because glucose metabolism produces [1,2,3-13C]pyruvate from [U-13C]glucose and feeds it into the TCA cycle, green tracings would always overlap with a purple tracing if the metabolic fate of exogenously given [3-13C]pyruvate were identical to that of glycolytic pyruvate. Green resonance peak tracings for malate, succinate, and α-ketoglutarate can be seen that do not overlap with purple resonances, indicating that these metabolites of pyruvate are produced at a far greater rate than occurs with normal glucose metabolism. Corresponding 1D spectra are shown as projections along the 13C and 1H axes. Purple and green colors were used to fill in the 13C projection for aspartate C3, indicating that it was produced by both pyruvate and glucose. The multiplet structures seen in 13C projections indicate the presence of more than one isotopomer with a 13C at the designated position, which can come from recycling of metabolites as well as from complex contributions from the use of [U-13C]glucose. Although an analysis of isotopomer compositions provides important information, this is not necessary for discerning the macroscopic differences that prove exogenous pyruvate was metabolized.
This plot qualitatively shows that 13C spin labels from exogenous glucose and pyruvate were metabolized and incorporated into TCA cycle compounds, and that there was metabolite recycling. Isotopomers (a word formed from ‘isotope’ and ‘isomer‘) are molecules having atomic configurations that are identical except for their isotope composition. For example, particular compounds can be composed with different populations of 12C and 13C isotopes, as in the isotopomers [3-13C]pyruvate and [2,3-13C]pyruvate. Molecular locations with isotopomer sets produced from [U-13C]glucose were often the same as locations having isotopomer sets produced from [3-13C]pyruvate. The isotopomer compositions of the sets, however, are not identical. Figure 8, which shows an overlay of the separate 2D spectra found for glucose and pyruvate recoveries, illustrates that aspartate-C3, glutamate-C4, and GABA-C2, for example, had isotopomer multiplets with both recovery substrates. However, exogenous administration of pyruvate resulted in additional 13C isotopomer sets, such as those for citrate, malate, and α-ketoglutarate. Labeling of these metabolites is known to occur from pyruvate metabolism through pyruvate carboxylase, an enzyme associated with glia but not with neurons. In addition, we used the UT-Southwestern Rogers NMR Center program TCASIM (http://www4.utsouthwestern.edu/rogersnmr/software.htm) to confirm that pyruvate carboxylase would produce the 13C isotopomers that occurred after [3-13C]pyruvate administration, but not after [U-13C]glucose administration.
(
Immunohistochemistry and Cell Viability for Different Recovery Substrates
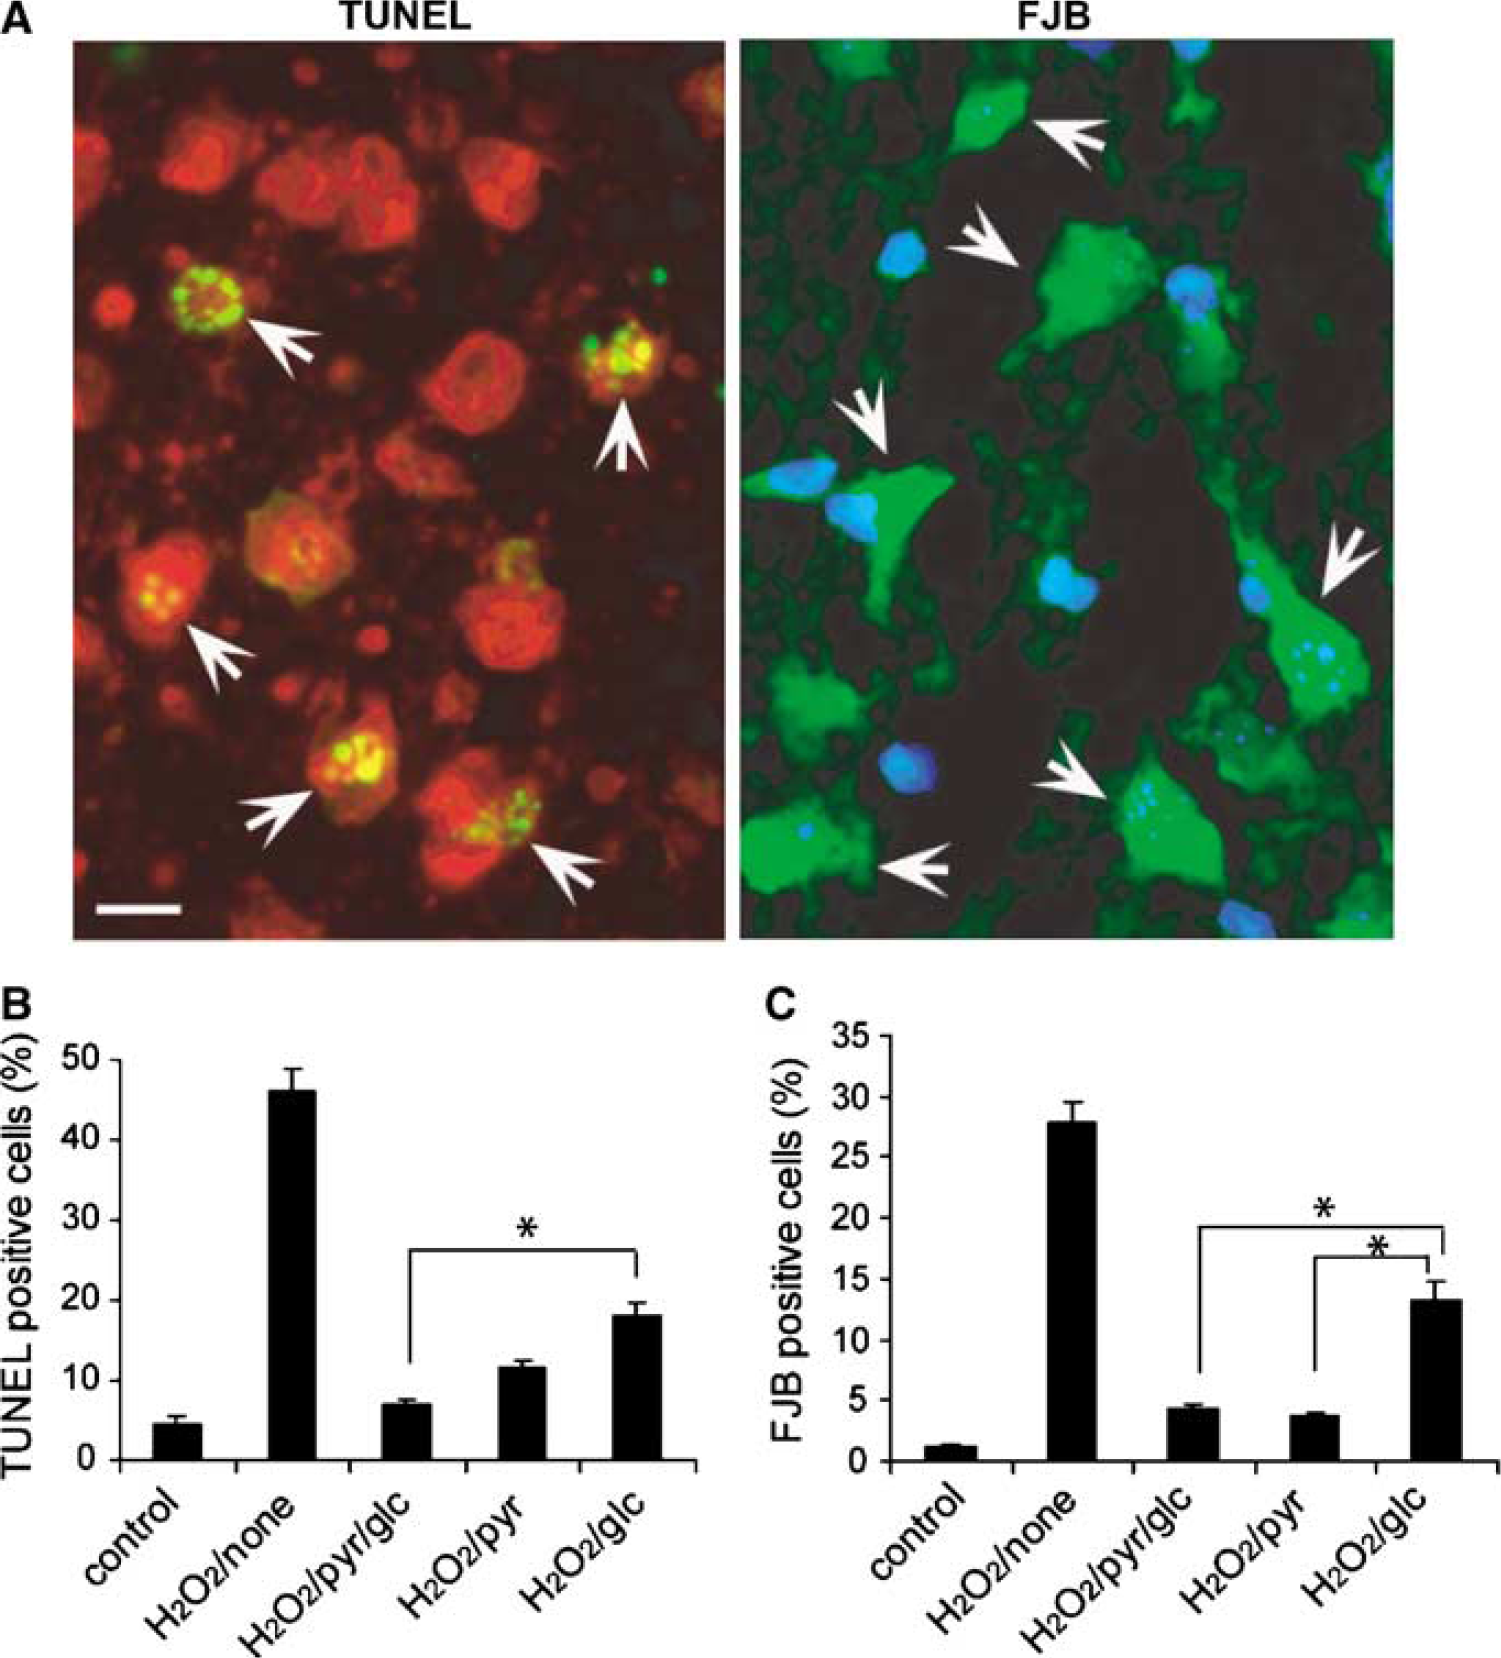
Figure 8A shows representative cellular morphology, both for TUNEL-positive cells (left) and for FJB-stained neurons (right). Images for TUNEL staining consisted of an overlay of green fluorescence from the TUNEL stain and red fluorescence from PI. Images for FJB-stained neuron were an overlay of green fluorescence from FJB-staining and blue fluorescence from DAPI. Punctate patterns inside TUNEL-positive cells (marked with arrowheads) arise from shrunken, fragmented nuclei. Green fluorescence of FJB is especially bright in dead or dying neurons. The smallest percentage of TUNEL-positive cells occurred with the pyruvate–glucose recovery (Figure 8B, P < 0.05), while the largest percentage of FJB-stained dead neurons occurred with the glucose-only recovery solution (Figure 8C, P < 0.05). Differences between the glucose-only group and the glucose–pyruvate group were statistically significant (P < 0.05).
Discussion
By all measures (Figures 6 and 8) slice recovery was best with the pyruvate–glucose mixture. However, while pyruvate alone appears just as good as pyruvate–glucose for replenishing NAD+ (Figure 6D), pyruvate alone is not as good as pyruvate–glucose for replenishing ATP (Figure 6A, P < 0.05). A likely explanation is that exogenous pyruvate helps replenish NAD+ by cytosolic conversion to lactate via lactate dehydrogenase. Excessive lactate, being at a metabolic dead-end, passes to the extracellular space and gets washed away. This conversion is known to be important when TCA metabolism fails to produce sufficient NAD+ from NADH, for example during hypoxia. Besides replenishing the NAD+ needed for gylcolysis, exogenous pyruvate also serves as a direct TCA cycle substrate, one that bypasses glycolysis, adding to whatever ATP production there was from glucose. Pyruvate is known to enter TCA cycle through pyruvate dehydrogenase, which produces acetyl-CoA. Acetyl-CoA flux into the TCA cycle, being quite low in slices compared with levels in the active in vivo brain, should easily be driven higher. In glia, pyruvate can also enter the TCA cycle via a second, independent pathway, through conversion by glial pyruvate carboxylase to oxaloacetate (Alano et al, 2004; Izumi et al, 1994; Matsumoto et al, 1994). This requires ATP utilization, which is another potential reason for ATP being lower during rescue by pyruvate alone. In both glia and neurons, pyruvate can enter the TCA cycle via a third pathway, carboxylation via Malic Enzyme (EC 1.1.1.40). In one in vitro neuron study, Malic Enzyme's carboxylation of pyruvate was found to account for approximately 30% of the metabolism of endogenous pyruvate (Hassel, 2000, 2001; Hassel and Brathe, 2000). All the above point to metabolic rescue mechanisms for exogenous pyruvate.
We included 2D [1H-13C] HSQC NMR spectra in this paper (Figure 7) to show the metabolism of exogenous [3-13C]pyruvate in our system. In previous studies by others and us, exogenous fructose-(1,6)-bisphosphate (FBP) administered after hypoxia/ischemia was found to augment ATP levels and speed recovery. The original mechanistic hypothesis was that exogenous FBP entered cells as a glycolytic substrate. However, earlier studies carefully looked for and could not find evidence for metabolism of exogenous FBP in brain cells (Bickler and Buck, 1996; Espanol et al, 1998; Kelleher et al, 1995). In this study, as in a study where [3-13C]pyruvate was given to isolated mitochondria (Offermann et al, 1992), composite 13C peaks were seen for TCA metabolites of [3-13C]pyruvate such as citrate, α-ketoglutarate, glutamate, citrate, and malate. Our similar detection of such labeled compounds, as well as the rapid appearance of [3-13C]lactate in cell extracts, confirmed the metabolism of exogenous pyruvate. A full analysis of the 13C isotopomer compositions is beyond the scope of this paper.
Changes in the high-energy phosphates PCr, ATP, and ADP after H2O2 exposure were typical for energy failure (Figure 5), and then typical 4 h later for energy recovery (Figure 6). The creatine phosphokinase (CPK) reaction, PCr + ADP + H+ ↔ Cr + ATP, suggests that a decrease in PCr will be among the earliest responses to the increase in ADP and H+ (acidosis) that is associated with inadequate ATP production (Gyulai et al, 1985). That normal levels of ATP can be maintained until PCr is almost gone has long been known (Gyulai et al, 1985) and also verified in vivo with 31P NMR spectroscopy (Litt et al, 1986). Acidosis alone, however, can drive the CPK reaction to the right, causing PCr to decrease while other reactions sustain normal levels of ADP and ATP. Thus, in Figure 5 the statistically significant decrease in PCr and increase in the ADP/ATP ratio that occurred with H2O2 alone represents early energy failure plus some amount of accompanying acidosis. In contrast, early energy failure is not involved in the statistically significant decrease in PCr and relatively unchanged ADP/ATP ratio that occurred with H2O2 in the presence of 3AB. Because the sum of PCr and Cr was approximately constant for the 3AB runs (as determined by 1H spectroscopy, data not shown), the PCr decrease that occurred in the presence of 3AB must have been at least in part due to an acidosis, something that could have been caused by even a small amount of PARP activation (Affar el et al, 2002). In Figure 6 the higher values of PCr/ATP and lower values of ADP/ATP represent energy recovery.
However, Figure 6 showed pyruvate's effect being more marginal rather than spectacular. Heterogeneity among cells and their responses might account for this. All cells in a slice contributed to measurements of high-energy phosphates and NAD+. If one attributes cell death to inadequate TCA cycle substrates, then a small response to exogenous pyruvate could result if cells with the biggest NAD+ depletions were also less capable of using pyruvate. Such could be the case if neurons were more sensitive to glycolytic arrest than glia, which have an additional pathway (pyruvate carboxylase) for pyruvate to be converted to a TCA cycle intermediate.
While our findings are similar to those in experiments with cultured neurons and astrocytes (Ying et al, 2002), intracellular energy depletion in our brain slices was not as severe. Additionally, in our brain slice study but not in the cited cell culture studies, treatment with glucose alone caused substantial brain slice recovery after PARP activation. Poly (ADP-ribose)-polymerase activation was more direct and specific in in vitro studies, because intercalating compounds such as N-methyl-N-nitrosoguanidine were used to efficiently nick nuclear DNA. Immunohistology showed that some PARP activation occurred from blade trauma at the slice edge where it separated from the brain. This accounts for the background poly (ADP-ribose) immunopositivity seen in Figure 3 for the two t = 0 lanes, which were for slices not exposed to H2O2.
We appreciate that PARP activation is not only mechanism by which H2O2 kills cells. Additional mechanisms for H2O2-induced cell death include direct injury by secondary radicals coming from ironmediated formation (Balla et al, 1990; Starke and Farber, 1985), and direct inhibition of caspase activity (Hampton and Orrenius, 1997). Poly (ADP-ribose)-polymerase actions are also intertwined with many nonmetabolic mechanisms known to be important in hypoxic/ischemic injury, such as those relating to apoptosis, rescue kinases, and inflammatory mediators (Chiarugi and Moskowitz, 2003; Narasimhan et al, 2003; Yu et al, 2003; Yu et al, 2002). Although we chose the highest H2O2 concentration that permitted recovery in our preliminary experiments, the existence of many ways for H2O2 to cause injury makes it plausible that PARP activation was not severe enough to completely shut down gylcolysis. We also appreciate that because of delayed neuron death, our TUNEL and FJB death markers at t =5 h did not identify all neurons destined to die. Our focus was clearly on early mechanisms.
The general agreement in Figure 5 between NMR and enzymatic quantifications of NAD+ is not surprising, as each used PCA extracts that were identically prepared. As in other PARP studies, we have focused on total NAD+ quantifications. Regrettably, we did not have enough metabolic information to consider redox ratios, which are crucial to bioenergetic viability. It has long been known that many intricacies permit cells to maintain a cytosolic [NAD+]/[NADH] ratio appropriate for supplying lots of NAD+ to glycolysis, while also maintaining an approximately 10-fold smaller mitochondrial ratio appropriate for supplying NADH to the electron transport chain (Newsholme and Start, 1973). Future 2D NMR experiments with 13C-labeled nutrients might help provide insight into cytosolic and mitochondrial [NAD+]/[NADH] ratios, which in the cytosol are proportional to the pyruvate/lactate ratio, and which in mitochondria are proportional to the acetoacetate/3-hydroxybutyrate ratio (Newsholme and Start, 1973).
Improvement by exogenous pyruvate could also have come from its antioxidant properties. A recent review of protection by ethyl pyruvate (Fink, 2003) cited studies of potent, nonenzymatic radical scavenging by pyruvate and other compounds that similarly have an α-keto carboxyl group (DeBoer et al, 1993; Desagher et al, 1997). In brain slice studies by others, free-radical protection has been found after having the superfusate contain ascorbate, an antioxidant, or edaravone, a new radical scavenger (Brahma et al, 2000; Okuda-Nakano et al, 2006). Had pyruvate in our study been coadministered with H2O2, a big antioxidant effect would have been a concern, because pyruvate's α-keto carboxyl group reacts very efficiently with H2O2 to form CO2 and H2O. However, H2O2 was stopped before starting pyruvate/glucose rescue superfusion, so that any and all of pyruvate's antioxidant effects were confined to the recovery period. An interesting experiment to be performed would have been recovery with a superfusate containing glucose and an antioxidant.
In summary, it is possible to use oxidative stress to induce PARP activation and associated energy failure in robust, well-superfused, well-oxygenated brain slices. Exogenously given pyruvate does enter the TCA cycle, and when added to glucose after H2O2, it improves recovery from PARP-associated energy impairment. Although it is possible to pharmacologically target several molecular mechanisms known for PARP-related injury and survival in the paradigm that was studied, substantial benefits can also come from focusing on basic metabolic manipulations.
Footnotes
Acknowledgement
The authors are very grateful to Dr Moriz Mayer for expert technical assistance related to NMR spectroscopy.