
Abstract
Mucosal tolerance to E-selectin has been shown to prevent stroke and reduce brain infarcts in experimental stroke models. However, the effective E-selectin dose range required to achieve mucosal tolerance and the precise mechanisms of neuroprotection remain unclear. We sought to examine the mechanisms of cytoprotection using gene expression profiling of tissues in the setting of mucosal tolerance and inflammatory challenge. Using spontaneously hypertensive rats (SHRs), we achieved immune tolerance with 0.1 to 5 μg E-selectin per nasal instillation and observed a dose-related anti-E-selectin immunoglobulin G antibody production. We also show the distinct patterns of gene expression changes in the brain and spleen with the different tolerizing doses and lipopolysaccharide (LPS) exposure. Prominent differences were seen with such genes as insulin-like growth factors in the brain and downregulation of those encoding the major histocompatibility complex class I molecules in the spleen. In all, mucosal tolerance to E-selectin and subsequent exposure to LPS resulted in significant tissue changes. These changes, while giving an insight to the underlying mechanisms, serve as possible targets for future studies to facilitate translation to human clinical trials.
Introduction
Immunologic tolerance to antigens of vascular or central nervous system origins like E-selectin and myelin basic protein has been shown to improve outcomes in animal models of stroke (Becker et al, 1997; Chen et al, 2003; Takeda et al, 2002). However, the precise mechanisms of neuroprotection induced by mucosal tolerance are unclear. Ischemic brain injury in stroke is associated with the elaboration of prothrombotic and proinflammatory proteins as well as endogenous stress proteins. These proteins may serve as antigens that direct regulatory T cells to vessels and brain parenchyma within the injured region. Mucosal tolerance involving repeated treatment with low-dose antigen generates antigen-specific regulatory T cells (Treg) and induces an organ-specific immunosuppression on Treg re-encounter with the same antigen; mucosal tolerization by intranasal instillation of E-selectin that is expressed on luminal endothelium during local vessel activation is a case in point (Takeda et al, 2002).
Although, such immune suppression is thought to be mediated by interleukin (IL)-10 and tumor growth factor (TGF-β) secreted by T-lymphocytes (Weiner, 2001), the precise mechanisms that govern this therapeutic approach have remained largely unexplored. Elucidation of these mechanisms would facilitate the translation of mucosal tolerance onto clinical trials. First, we determined the dose range within which E-selectin tolerance was achievable in spontaneously hypertensive rats (SHRs) and examined the antibody profiles in blood with the different doses. Next, we used microarray analyses to study the gene expression profiles of the brain and spleen of the pretolerized animals with or without systemic inflammatory challenge with a single dose of lipopolysaccharide (LPS). Such a provocative dose of LPS has previously been shown to produce cerebral vascular activation with induction of proinflammatory cytokines (Takeda et al, 2002; Quan et al, 1999).
Using SHRs for the studies, our hypotheses were as follows: (a) within a certain E-selectin dose range, suppression of delayed-type hypersensitivity (DTH) reaction would be achieved, (b) antibody profiles would vary with the different E-selectin tolerizing doses, (c) the gene expression profiles of tissues obtained after tolerization would show differences between E-selectin tolerized and control (phosphate-buffered saline (PBS)) groups, and (d) the gene expression patterns of tissues from animals that had undergone tolerization and subsequent exposure to LPS for 2 and 6 h would show differences between the E-selectin and control groups.
Materials and methods
Animals
This investigation conforms to the Guide for the Care and Use of Laboratory Animals published by the US National Institutes of Health (NIH Publication No. 85-23, revised 1996) and was approved by the National Institute of Neurological Disorders and Stroke Animal Care and Use Committee. We used 10- to 13-week-old SHRs (Charles River Laboratory, Wilmington, MA, USA) and spontaneously hypertensive rat—stroke-prone rats (SHR-SP) (kind gift of Y Yamori, Kyoto University, Kyoto, Japan) weighing 250 to 350 g. They were kept in the animal facility for at least 3 days to acclimatize before entering the study. The active treatment group received E-selectin (Novavax, Rockville, MD, USA), while the control group received PBS. The study group animal allocations are shown in Figure 1. Male and female rats were equally distributed to the different study groups. After tolerization with or without LPS challenge 1 week after the last intranasal treatment, SHRs in the microarray arm were deeply anesthetized and decapitated; their brains and spleens were rapidly removed and placed in RNA later™ (Ambion, Austin, TX, USA). The samples were stored at −80°C until further studied.
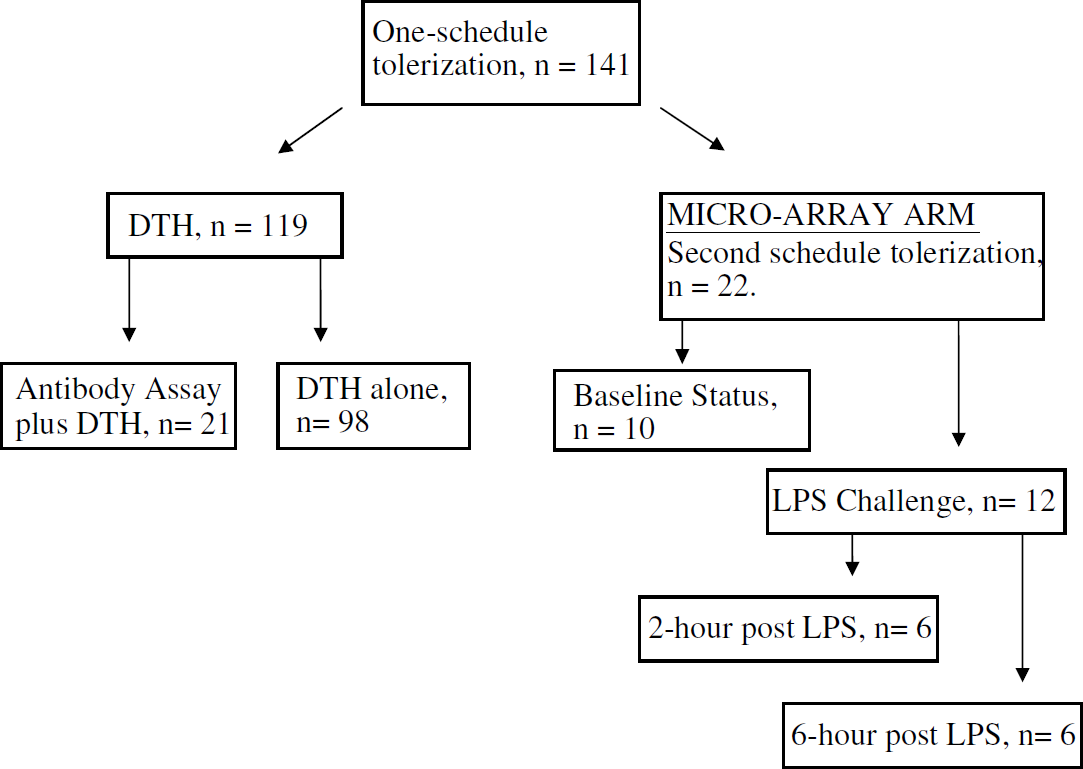
Allocation of animals according to study group. Study animals (n = 141) received one schedule of intranasal tolerization with E-selectin or PBS. Delayed-type hypersensitivity studies were performed assess antibody generation (n = 21) or efficacy of E-selectin doses (n = 98). The other animals (n = 22) were treated on a second tolerization schedule and used for the microarray studies.
Tolerization
We instilled intranasal E-selectin (0.01, 0.1, 0.5, 1, 5, and 50 μg/40 or 50 μL) or PBS (40 or 50 μL) according to their respective groups, with the animals under brief anesthesia with 5% isoflurane in 30% O2/70% N2O. Each course of tolerization consisted of intranasal instillation every other day for 5 times (over 10 days). The animals in the DTH arm received single-course tolerization, while the microarray arm received a second course of tolerization beginning 3 weeks after concluding the first tolerization schedule.
Antibody Testing
Blood was withdrawn from the tail vein before tolerization and 1 week after last dose of E-selectin for antibody studies. The serum was stored at −70°C till analyzed at the Novavax Inc. facility. Sera were tested by dot-blot binding assay using purified recombinant E-selectin protein (0.0001 to 1 μg) and control antigens (1 μg), which included purified recombinant human prostate-specific antigen and GP 100 proteins.
Delayed-Type Hypersensitivity
At 2 weeks after the last tolerization dose, we immunized the animals with subcutaneous injection of E-selectin 75 μg/200 μL PBS plus CFA (Sigma-Aldrich, St Louis, MO, USA) to base of their tails. We measured ear thickness 2 weeks after immunization and administered a challenge ear-lobe injection with E-selectin, 50 μg/100 μL PBS. After 48 and 72 h, we remeasured the ear thickness.
The degree of suppression of DTH ear swelling was compared between the PBS- and E-selectin-tolerized animals.
Lipopolysaccharide Challenge
After the second schedule of tolerization (microarray arm of study), we administered to some of the rats (n = 12) a 1 mg/kg dose of LPS (from Escherichia coli, serotype 055:B5; Sigma-Aldrich, St Louis, MO, USA) in a 1 mg/mL concentration by intraperitoneal injection. The remaining SHRs in the microarray study arm that did not receive LPS formed the microarray baseline group (n = 10).
RNA Isolation from the Brain and Spleen
The RNA from the tissues was extracted using the TRIzol (Invitrogen Life Technologies, Grand Island, NY, USA) RNA isolation method according to the manufacturer's protocol summarized as follows: (1) the tissues were homogenized in TRIzol (1 mL to 100 mg tissue) and incubated at 15°C to 30°C for 5 mins. (2) For phase separation, chloroform was added (0.2 mL/mL of TRIzol) to the homogenate, tubes shaken for 15 secs, incubated at room temperature for 2 to 3 mins, and centrifuged at 10,000g for 15 mins at 4°C. (3) For RNA precipitation, the aqueous phase was transferred to a fresh tube, isopropyl alcohol (0.5 mL/1 mL of TRIzol) added, incubated at room temperature for 10 mins, and centrifuged at 10,000g for 10 mins at 4°C. (4) For RNA wash, the supernatant was removed, 75% ethanol added to the pellet and the mixture was centrifuged at 7, 500g for 5 mins at 4°C. (5) To redissolve the RNA, the pellet was air-dried for 5 to 10 mins, dissolved in RNase free water and incubated for 10 mins at 55° Cto 60°C. The RNA was stored at −70°C until further use.
Microarray Analysis
The microarray experiment was designed to compare E-selectin tolerized with PBS-treated control SHRs, using gene expression profiles of the brain and spleen at baseline and after exposure to LPS, at 2 and 6 h. In addition, we examined a tolerizing dose response on gene expression profiles at baseline by comparing two separate dose groups (E-selectin 5 and 0.1 mg) with the PBS group. All samples for this arm of the study came from SHRs brought into the animal facility on the same day at ≈ 14 weeks of age, received their treatments, and eventual tissue harvest on the same days. The SHRs in the experimental group were tolerized with bovine recombinant E-selectin (Lot # 3402; Novavax Inc., Rockville, MD, USA).
We processed the RNA for microarray analysis according to the manufacturer's instructions (Affymetrix, Santa Clara, CA, USA). The processing involved synthesis of double-stranded complementary DNA (cDNA) from the total RNA, synthesis, and fragmentation of biotin-labeled cRNA. Further processing involved hybridization to arrays; washing, staining, and scanning of the resultant images. We used R230A Gene Chip arrays, which contained oligonucleotide probes for over 12,000 transcripts. Then, we determined the average gene intensity values with Affymetrix Microarray Suite 5.0 (MAS 5.0). The gene intensity values and statistical analyses between groups were performed using the mAdb system (developed by NCI and SRA International and modified for NINDS at NIH). In addition, we normalized the samples to the median value of each chip and used only genes with present calls in all samples for further analysis. We also performed t-test and analysis of variance (ANOVA) analyses using the mAdb software. The mAdb system provided access to gene ontology (GO) annotations, which give information on cellular location, molecular function, and biologic process of gene products using controlled vocabularies (ontologies).
Real-Time Quantitative Polymerase Chain Reaction (qPCR)
First-strand complementary DNA synthesis: We synthesized cDNA from total RNA in a 96-well microtiter plate format using the Super Script™ III First Strand Synthesis system for Reverse Transcriptase PCR (Invitrogen Corporation, Carlsbad, CA, USA). For the first-strand cDNA synthesis, 5 ng of total RNA served as the template with RNase OUT™ (Invitrogen Corporation, Carlsbad, CA, USA) included in the reaction to prevent degradation of the target RNA by contaminating ribonucleases. Incubations were performed in a thermocycler at the following conditions: 50°C for 50 mins followed by 85°C for 5 mins and the addition of RNase H for 20 mins at 37°C.
Analysis of gene expression by qPCR:This analysis was performed using Taq Man probes (Applied Biosystems, Foster City, CA, USA) according to the manufacturer's instructions in 10 mL final volumes in 384-well microtiter plates. The thermocycling conditions using an Applied Biosystems ABI-7900 SDS were as follows: 50°C for 2 mins, 95°C for 10mins, and 40 cycles of 95°C for 15 secs and 60°C for 1 min. Four spleen genes, four brain tissue genes, and an 18s endogenous control gene were purchased using Applied Biosystems Assay-on-Demand program; their sequences are proprietary in nature. Quantification of mRNA was achieved using the normalization of a particular sample to a reference sample and to the endogenous control, using the comparative Ct method (user bulletin no. 2, Applied Biosystems, December 1997). The targeted mRNA expression was normalized to the 18s expression (Cheng et al, 2004), and the relative expression was calculated back to the untreated controls (reference sample) for each cell type. The resultant graph displays the analyzed results in a format showing their expression relative to not only an endogenous control but also a reference sample.
Statistical Analyses
The DTH suppression analysis was performed with one-way ANOVA comparing the different treatment groups. The microarray results were further uploaded, stored, and analyzed using NINDS mAdb and EXCEL (Microsoft). Two-sample t-tests (unequal variance) and one-way ANOVA were used for analyzing categories such as Control (PBS-treated) versus Treated (E-selectin 0.1 or 5.0 mg doses), different dose treatments, and different time points. Additional filters included missing value filters that required genes to be present in all (100%) arrays per group. The level of statistical significance was set at 0.05, except the microarray analysis that was set at 0.005.
Results
Delayed-Type Hypersensitivity Studies
We performed 5 separate DTH studies with a total of 119 rats (18 SHR-SPs in 1 study and 101 SHRs in 4 studies). On combining the 5 studies, significant DTH suppression (mean ear thickness differences from baseline to 48 h after challenge, P < 0.01) was achieved with E-selectin doses between 0.1 and 5 mg as shown in Figure 2. A similar pattern of ear thickness difference was registered at 72 h, although with a trend to DTH suppression with the E-selectin 50 mg tolerizing dose (P = 0.04). There were no significant differences between the 48- and 72-h measurements within each group.
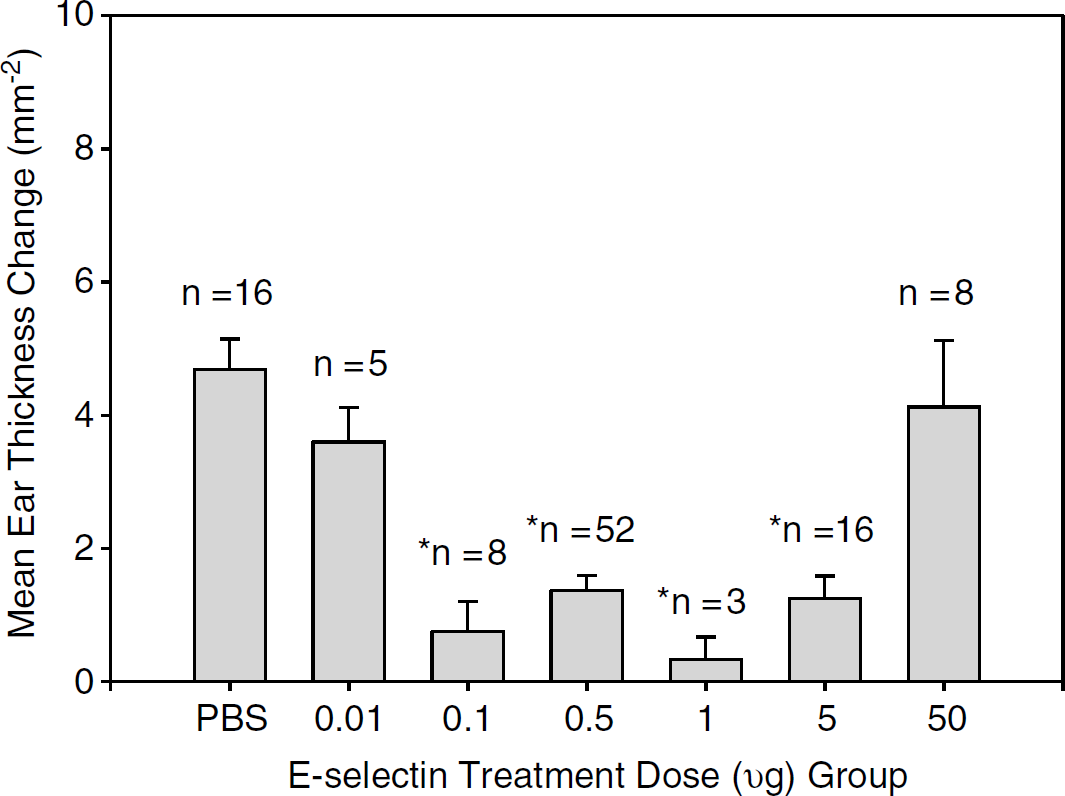
Pooled analysis ot DTH suppression at 48 h by treatment group. Animals were treated with PBS or varying doses of E-selectin, then immunized and challenged with E-selectin to induce DTH. Suppression DTH was achieved by mucosal tolerance induced with E-selectin doses of 0.1 to 5 μg. Values are mean±s.e.m. *Significantly different from PBS group at P < 0.01 by analysis of variance (ANOVA) analysis. DTH = delayed-type hypersensitivity.
Antibody Assays
We obtained pre- and post-treatment sera from SHR—SPs (n = 8) that were tolerized with recombinant human E-selectin. None of the pretreatment sera from the animals developed anti-E-selectin antibodies. The 3 SHR—SPs tolerized with the 0.1 mg dose developed no post-treatment anti-E-selectin antibodies, while those treated with the 5 μg dose did.
We also tested sera from SHRs (n = 13) tolerized with bovine E-selectin. Again, none of the pretreatment sera had anti-E-selectin antibodies. The SHRs (n = 6) tolerized with 0.01 or 0.1 μg doses did not develop immunoglobulin (Ig)G antibodies. Tolerization with the 5 mg dose resulted in 2 of 3 animals being positive for IgG titers at 1/500 dilution, while all 4 SHRs treated with the 50 mg dose became positive at IgG titer levels of 1/120 or 1/200. At none of the dose levels was an IgM titer observed for E-selectin.
Microarray Studies
Brain
Gene expression at baseline and 6 h after lipopolysaccharide challenge: In an ANOVA analysis of 12 arrays from 4 groups comprised of PBS and E-selectin (5 mg) groups, at baseline and 6 h after LPS challenge, 57 genes were differentially regulated. Of these, 20 are known genes that are shown in Table 1.
Mean expression intensity of brain genes at baseline and 6 h post LPS among the PBS and E-selectin groups
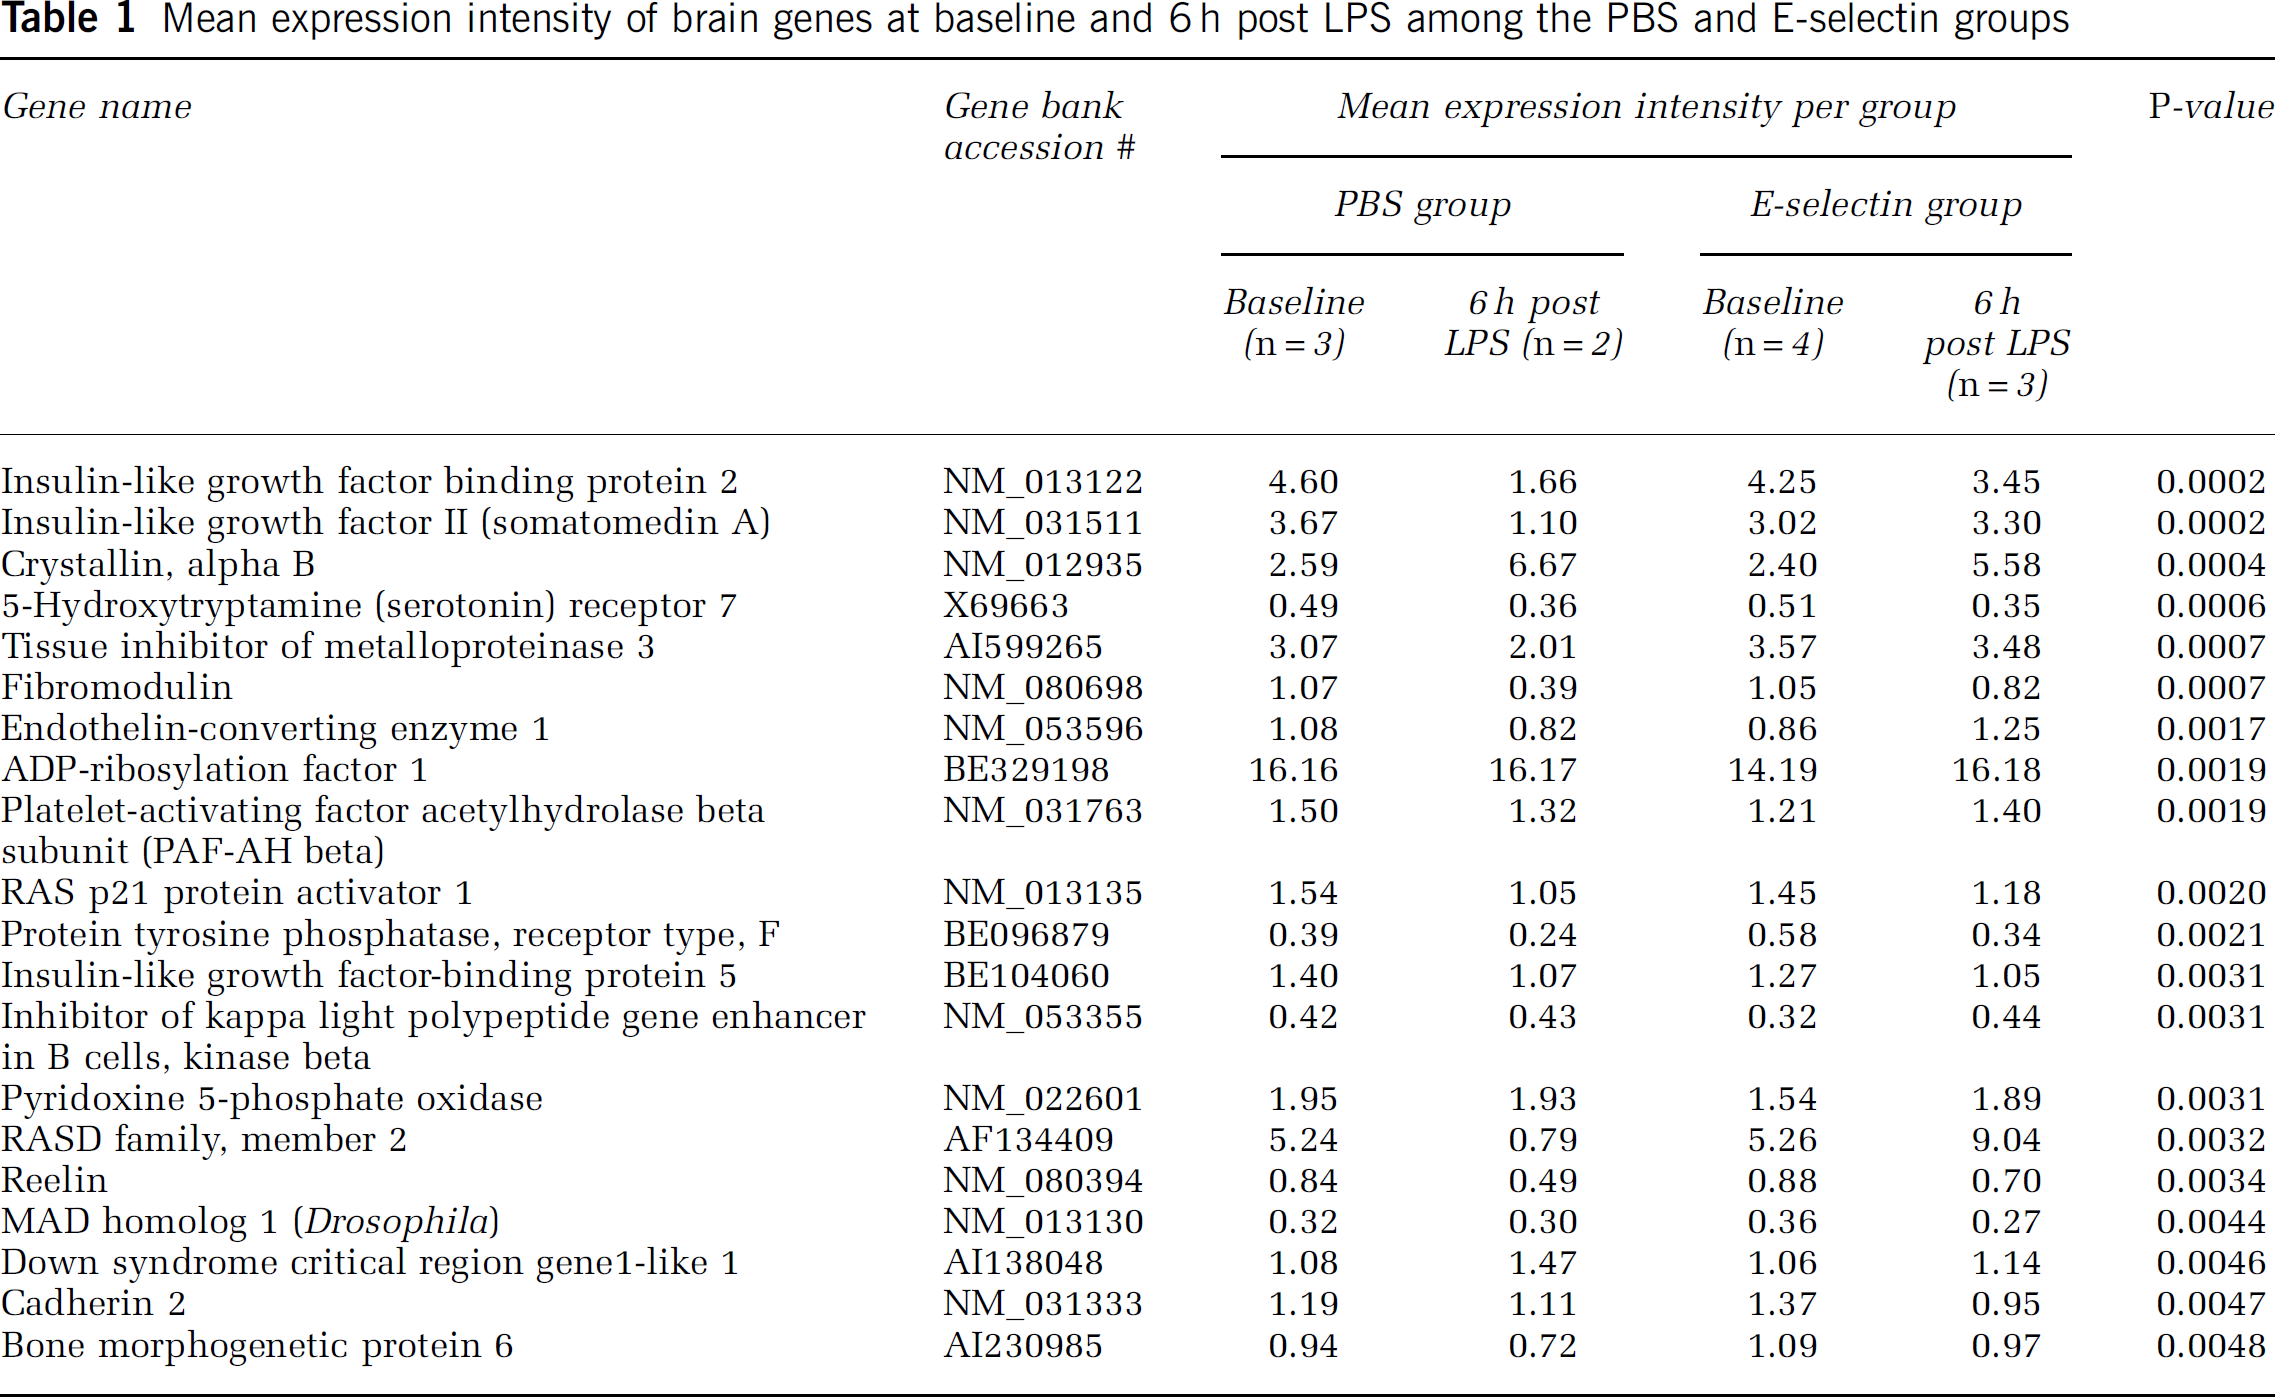
Gene cluster differences noted between the treatment groups at 6 h after LPS challenge involved the following genes: insulin-like growth factor 2 (IGF2), IGF-binding protein 2 (IGFBP2), tissue inhibitor of metalloproteinase 3 (TIMP3), fibromodulin, and bone morphogenic protein 6. Bone morphogenic protein 6, which is related to TGF-β, was relatively upregulated in the E-selectin groups.
Other notable but nonsignificant differences include downregulation of interferon gamma receptor by E-selectin treatment at both time points (baseline and 6 h post LPS) compared with corresponding PBS-treated groups (P = 0.0080), and interferon-inducible guanylate-binding protein 2 (GBP2), with about sevenfold downregulation with E-selectin treatment 6 h after LPS stimulation (P = 0.0086). A multidimensional scaling procedure after the ANOVA analysis displays the aggregate gene expression differences among the groups in Figure 3. Of interest, the E-selectin gene was slightly upregulated with tolerance, but there was no significant difference in the gene across all groups with and without LPS challenge.
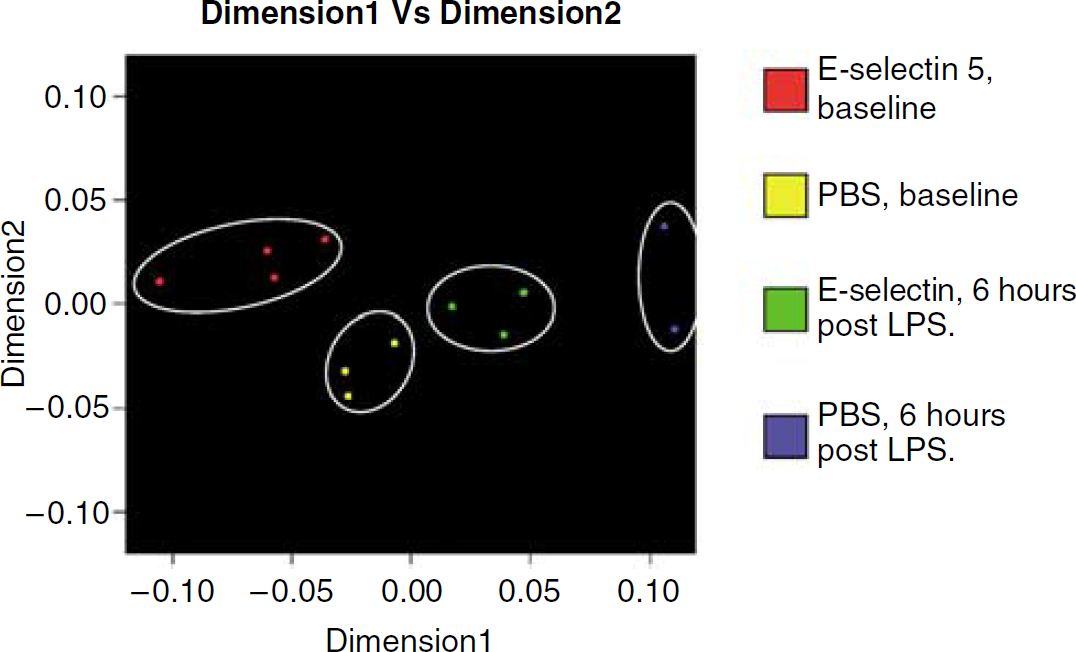
Multidimensional scaling analysis after analysis of variance (ANOVA) analysis of the brain at baseline and at 6h post lipopolysaccharide (LPS) for phosphate-buffered saline (PBS) and E-selectin (5 μg) treatment groups. Differences in the aggregate expression of brain genes among the treatment groups were showed with genes shown to be differently expressed at P < 0.005 by ANOVA analysis.
The expression patterns for some inflammation-related genes were examined and found to have a trend toward differential expression, although nonsignificant, among the treatment groups. These genes include those related to interleukins, inter-ferons, transforming growth factors, matrix metalloproteinase, and signal transducer and activator of transcription (STAT). Tumor necrosis factor expression was not identified in any of the arrays analyzed comprising a total of 7,742 genes.
Brain baseline after tolerization without lipopolysaccharide challenge: Comparing the PBS treated and the E-selectin (5 mg) groups at baseline, 28 genes were differentially expressed at P < 0.005, with 9 (32%) upregulated in the E-selectin group. Of the 28, four are known genes, namely ADP-ribosylation factor 1, triosephosphate isomerase 1, complement component 1 (q subcomponent, beta polypeptide), and damage-specific DNA binding protein 1. These four genes were downregulated with E-selectin tolerization. Only triosephosphate isomerase 1 had GO annotation and is involved in cell growth and/or maintenance.
Does the tolerizing dose matter at baseline?: When both E-selectin groups (0.1 and 5 mg) were combined (as both induce tolerance) and compared with the PBS group at baseline, 32 genes were differentially expressed (Figure 4). Ten of the 32 genes (31%) were upregulated in the E-selectin group. However, comparing the separate groups (PBS, E-selectin 0.1, and E-selectin 5 μg) by ANOVA analysis yielded 254 differentially expressed genes. Despite having similar degrees of DTH suppression, the two E-selectin doses when separately compared with the control group showed remarkable differences in the gene expression profiles. For example, matrix metalloproteinase 2 (72 kDa type IV collagenase) and catalase are downregulated by E-selectin 0.1 μg, while the 5 μg treatment upregulated them.
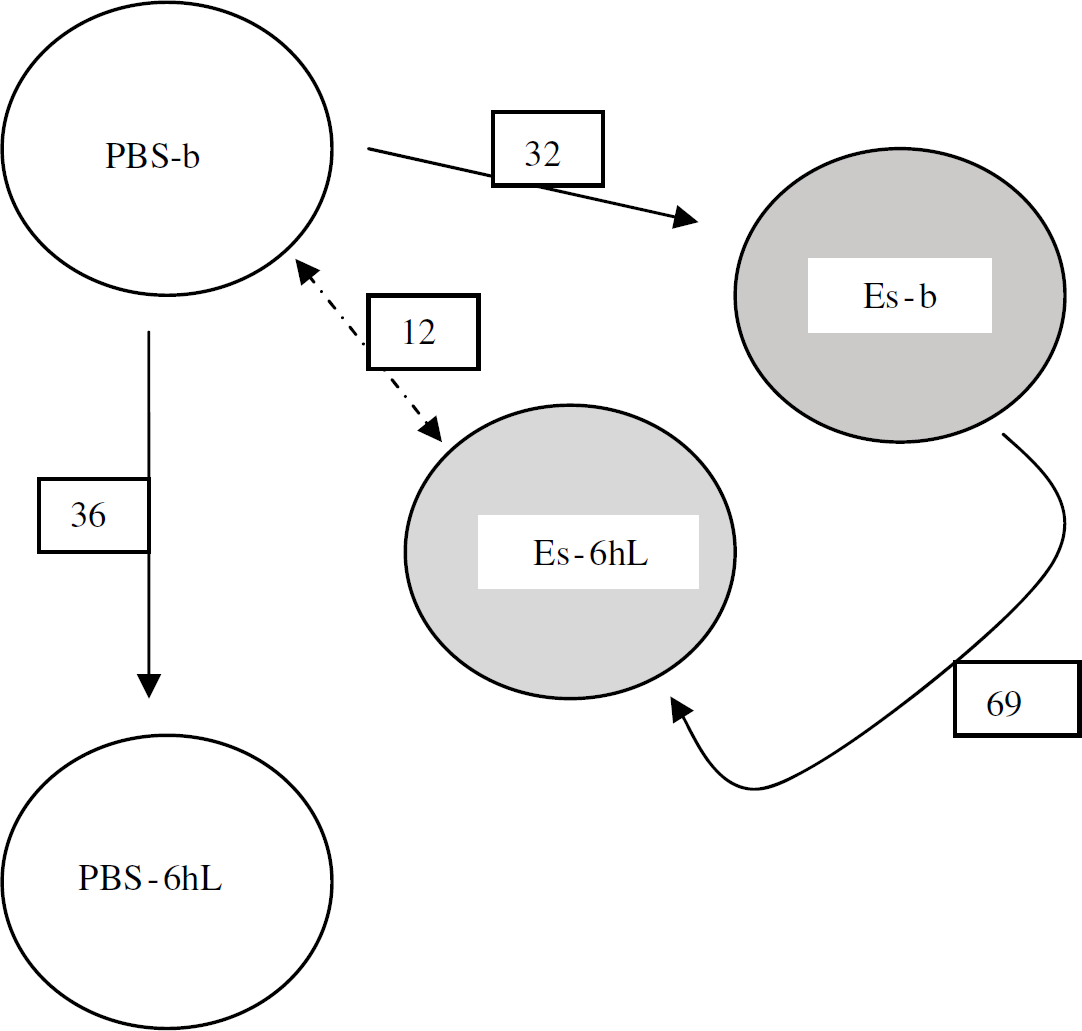
Numbers of differentially expressed genes in the brain compared among study groups. The gene expression differences of the brain were compared between the PBS-b (phosphate-buffered saline group at baseline) group and other treatment groups to show the numerical transcript differences induced by E-selectin tolerization and lipopolysaccharide (LPS) challenge. PBS-b, PBS 6 h after LPS (PBS-6hL), E-selectin at baseline (ES-b), and E-selectin 6 h after LPS (Es-6hL). Of note, metallothionein (MT 1A) was upregulated 13-fold 6 h after LPS challenge.
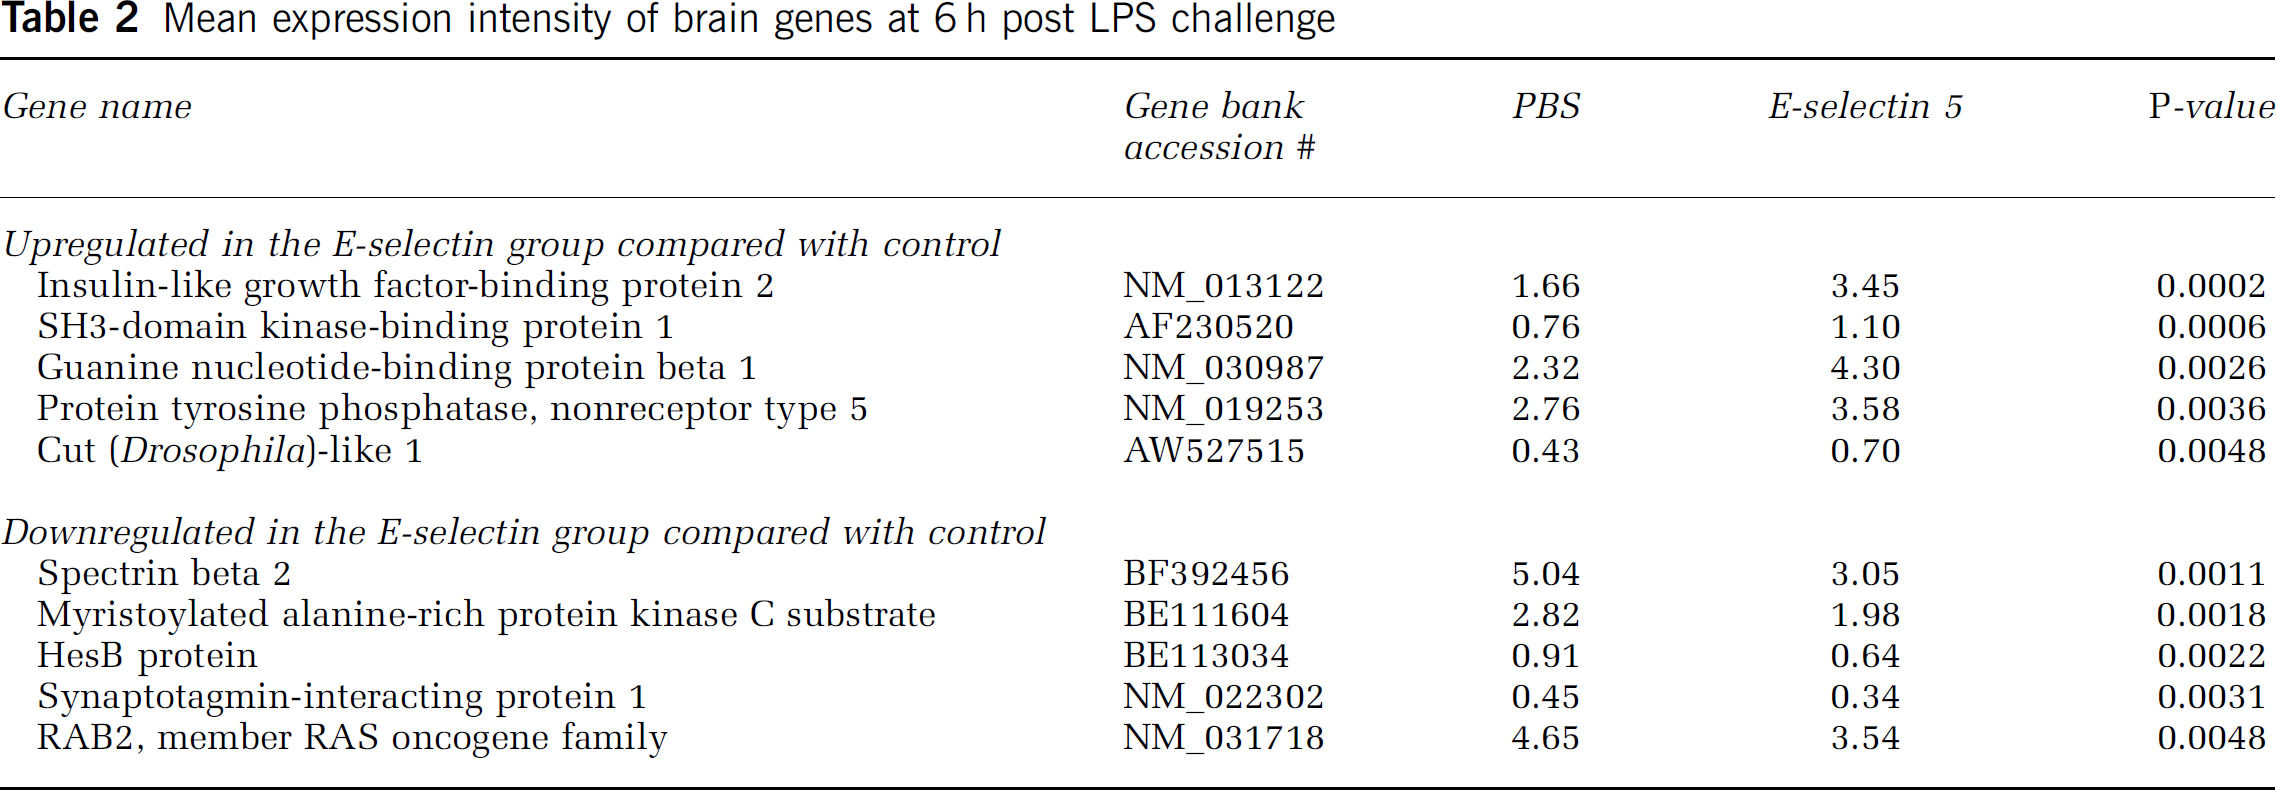
Six hours after peripheral lipopolysaccharide challenge: At 6 h after LPS challenge, 26 genes were differentially expressed between the E-selectin (5 μg) and PBS treatment groups. Of the 26 genes, 10 (shown in Table 2) are known with 2 being involved in cell growth and maintenance, namely myristoylated alanine-rich protein kinase C substrate marcks, and protein tyrosine phosphatase (PTP), nonreceptor type 5. The former was down-regulated (P = 0.0018), while the latter was upregulated (P = 0.0036) by E-selectin tolerization. At this time point, some of the genes mentioned earlier in the global group analysis (gene expression at baseline and 6 h after LPS challenge) were upregulated with prior E-selectin tolerance induction. These include: IGFBP2 (twofold, P = 0.0002, IGF-2 (somatomedin A, threefold, P = 0.009), and TIMP3 (1.7-fold, P = 0.0143). The 6-h analyses were performed with the exclusion of one of the brain arrays (PBS treated 6 h post LPS) because of high background noise resulting in unbalanced group comparisons.
Mean expression intensity of brain genes at 6 h post LPS challenge
Other brain analyses: The PBS groups at baseline and at 6 h of LPS challenge were compared to evaluate the influence of the peripheral inflammatory stimulus to the rat brain in the absence of a tolerizing protein treatment. Of the 36 differentially expressed genes (Figure 4), 18 are known genes (10 were upregulated and 8 downregulated with LPS).
The comparison of the E-selectin 5 mg groups at baseline and at 6 h after LPS showed 69 differentially expressed genes (Figure 4). Thirty-one of these are known genes, of which 18 were upregulated and 13 downregulated with LPS. Only calbindin 2 had more than a twofold (2.3-fold downregulation). None of the significantly expressed genes in the PBS groups was noted in these E-selectin treatment groups. Metallothionein 1A was upregulated only 1.9-fold compared with 13-fold in the PBS groups.
If the PBS baseline group is equivalent to the nontolerized state, how does the E-selectin group at 6 h post LPS compare with it? Only 12 significant genes are differentially expressed between the two groups (Figure 4). Six (50%) of the genes were upregulated. Four are known genes, of which two (trg and carboxy-terminal domain-binding SR-like protein rA4) were upregulated in the E-selectin group, while granzyme K and prolactin receptor were downregulated.
Real-time qPCR for brain genes: For verification of the microarray gene expression changes, we analyzed four genes (IGF2, TIMP3, GBP2, and C1qb) from the brain samples using real-time qPCR. The comparative pattern of expression with the microarray for IGF2 is shown in Figure 5A. To determine the agreement rate between the qPCR, we compared each treatment group expression to PBS at baseline group (PBS-b), and to its counterpart treatment group at the same time point of LPS exposure. The qPCR and microarray expression of the brain genes examined showed an average of about 81% agreement.
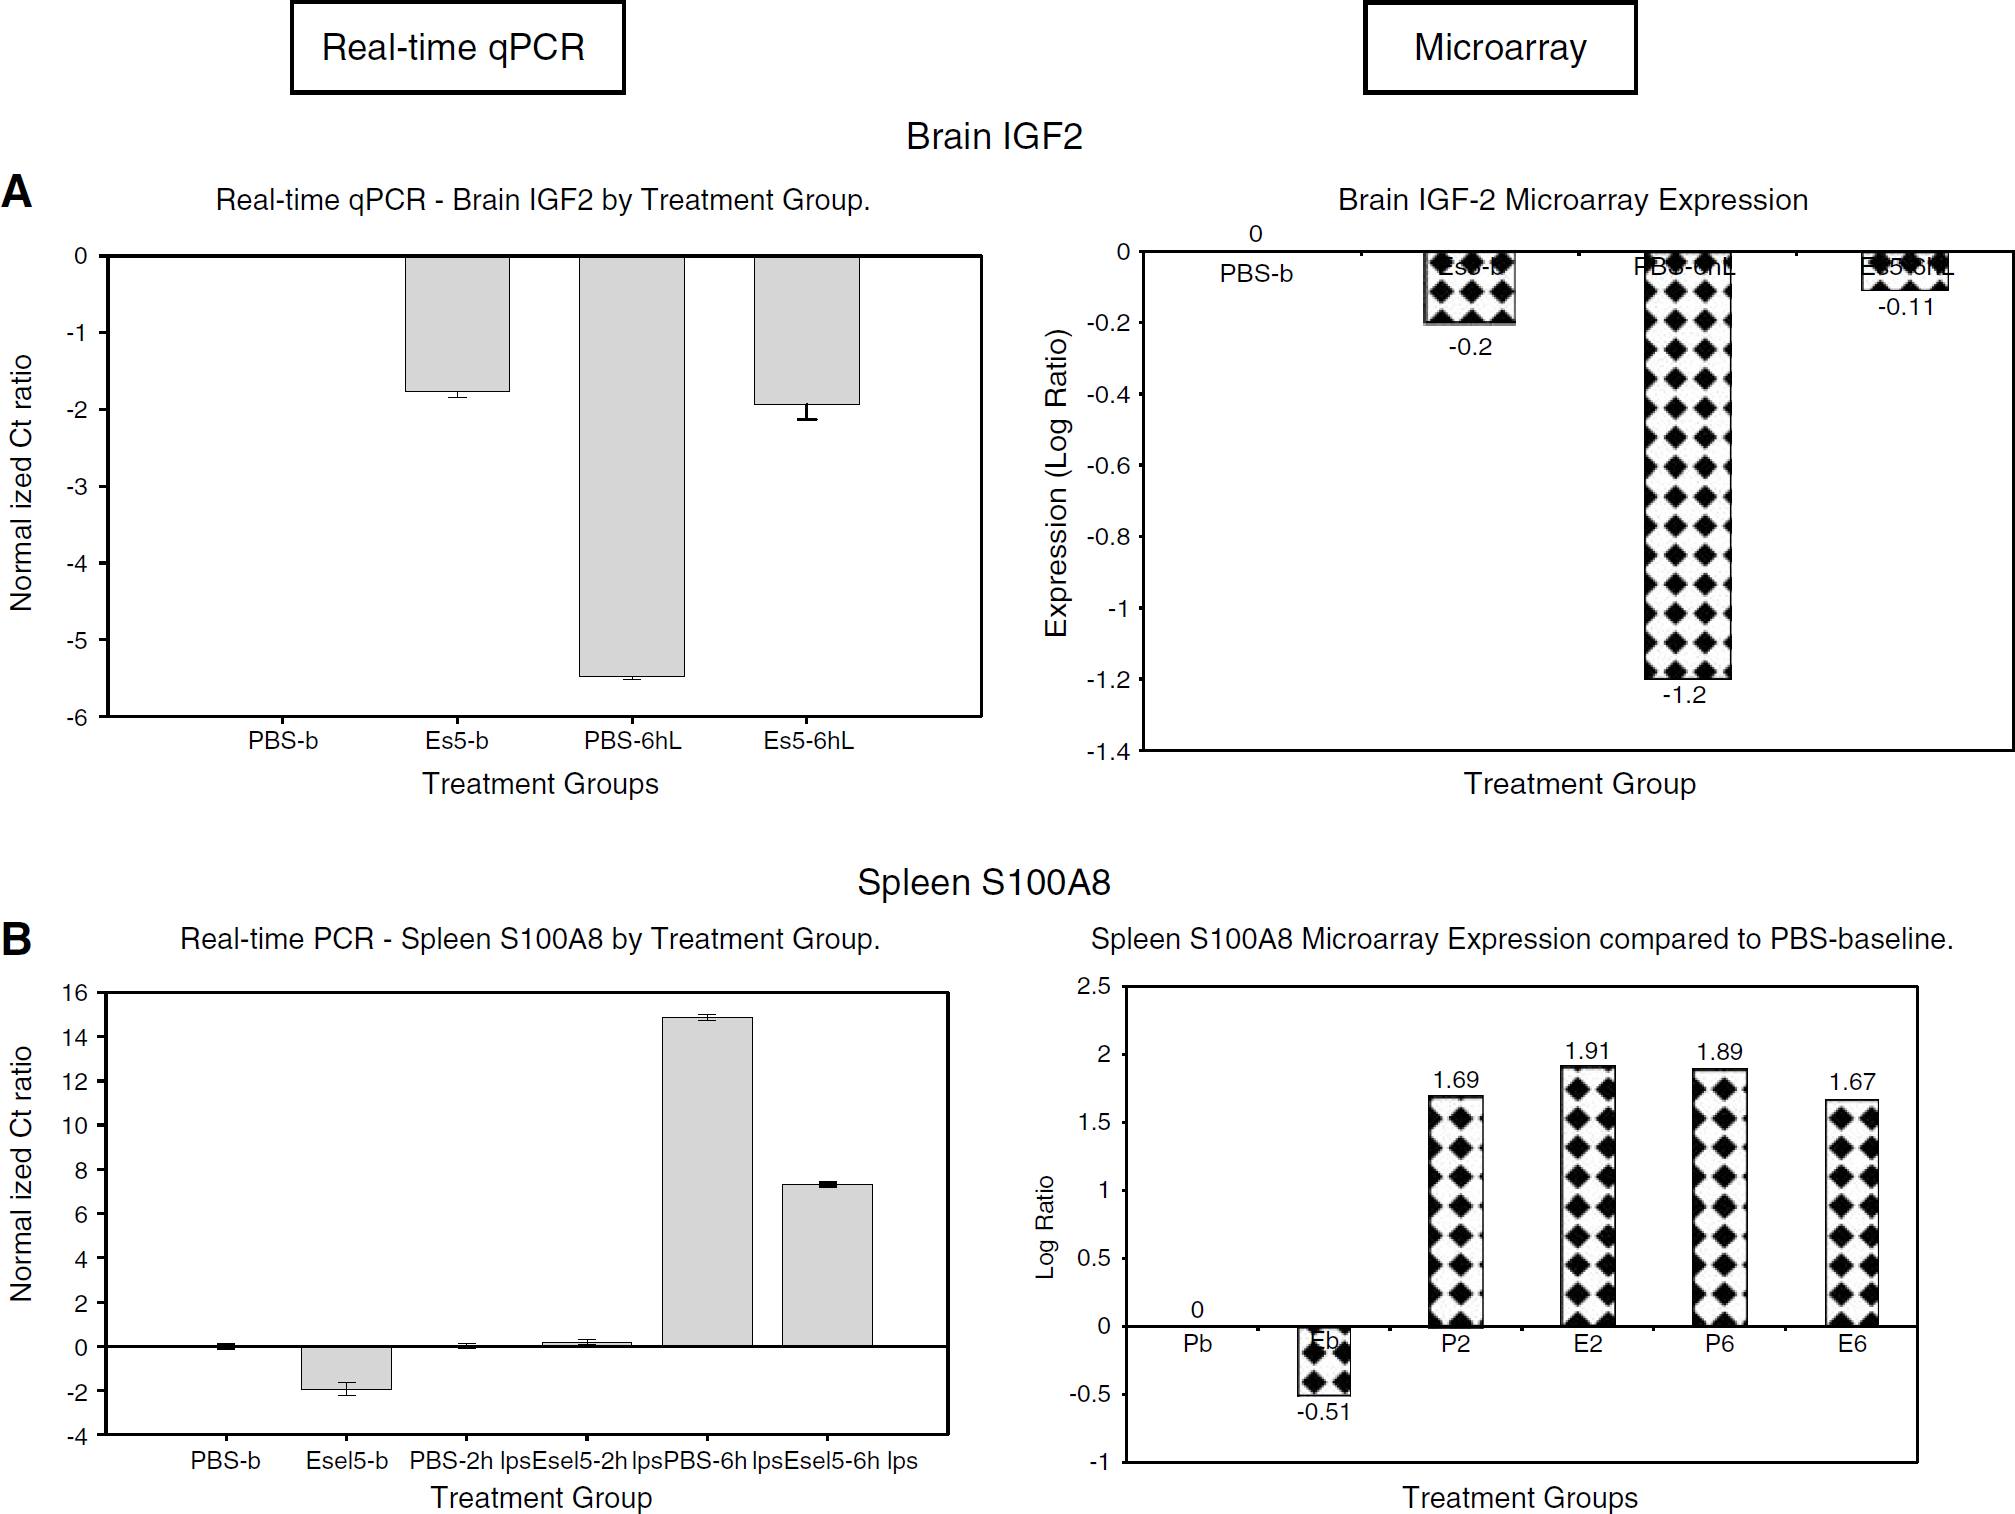
Real-time quantitative polymerase chain reaction (qPCR) and microarray expression of selected genes in brain insulin-like growth factor (IGF)2 (
Spleen
Overall spleen response to tolerization with and without inflammatory challenge: The spleen analysis included 21 arrays from 7 study groups (3 arrays per group) as follows: (a) the 3 baseline groups (PBS, E-selectin 0.1 μg, and 5 μg doses), (b) the 2-h post LPS challenge groups (tolerized with PBS and E-selectin 5 μg), and (c) the 6-h post LPS challenge groups (tolerized with PBS and E-selectin 5 μg). From an input data set containing 1,907 known genes (from 5,535 genes present in all group arrays), 423 were differentially expressed (ANOVA analysis, P < 0.005). Of the 423 differentially expressed genes, 88 were expressed at a P-value of 0.0001 (Figure 6). Of note, the E-selectin tolerized group showed a marked increase in expression of inflammation-related genes at 2 h after LPS challenge. However, 6 h after LPS, the expression levels of these inflammatory genes fell below those of the PBS tolerized animals. We observed this pattern with such genes as S100A8, S100A9, IL-1β, and chemokine (C—X–C motif) ligand 10.
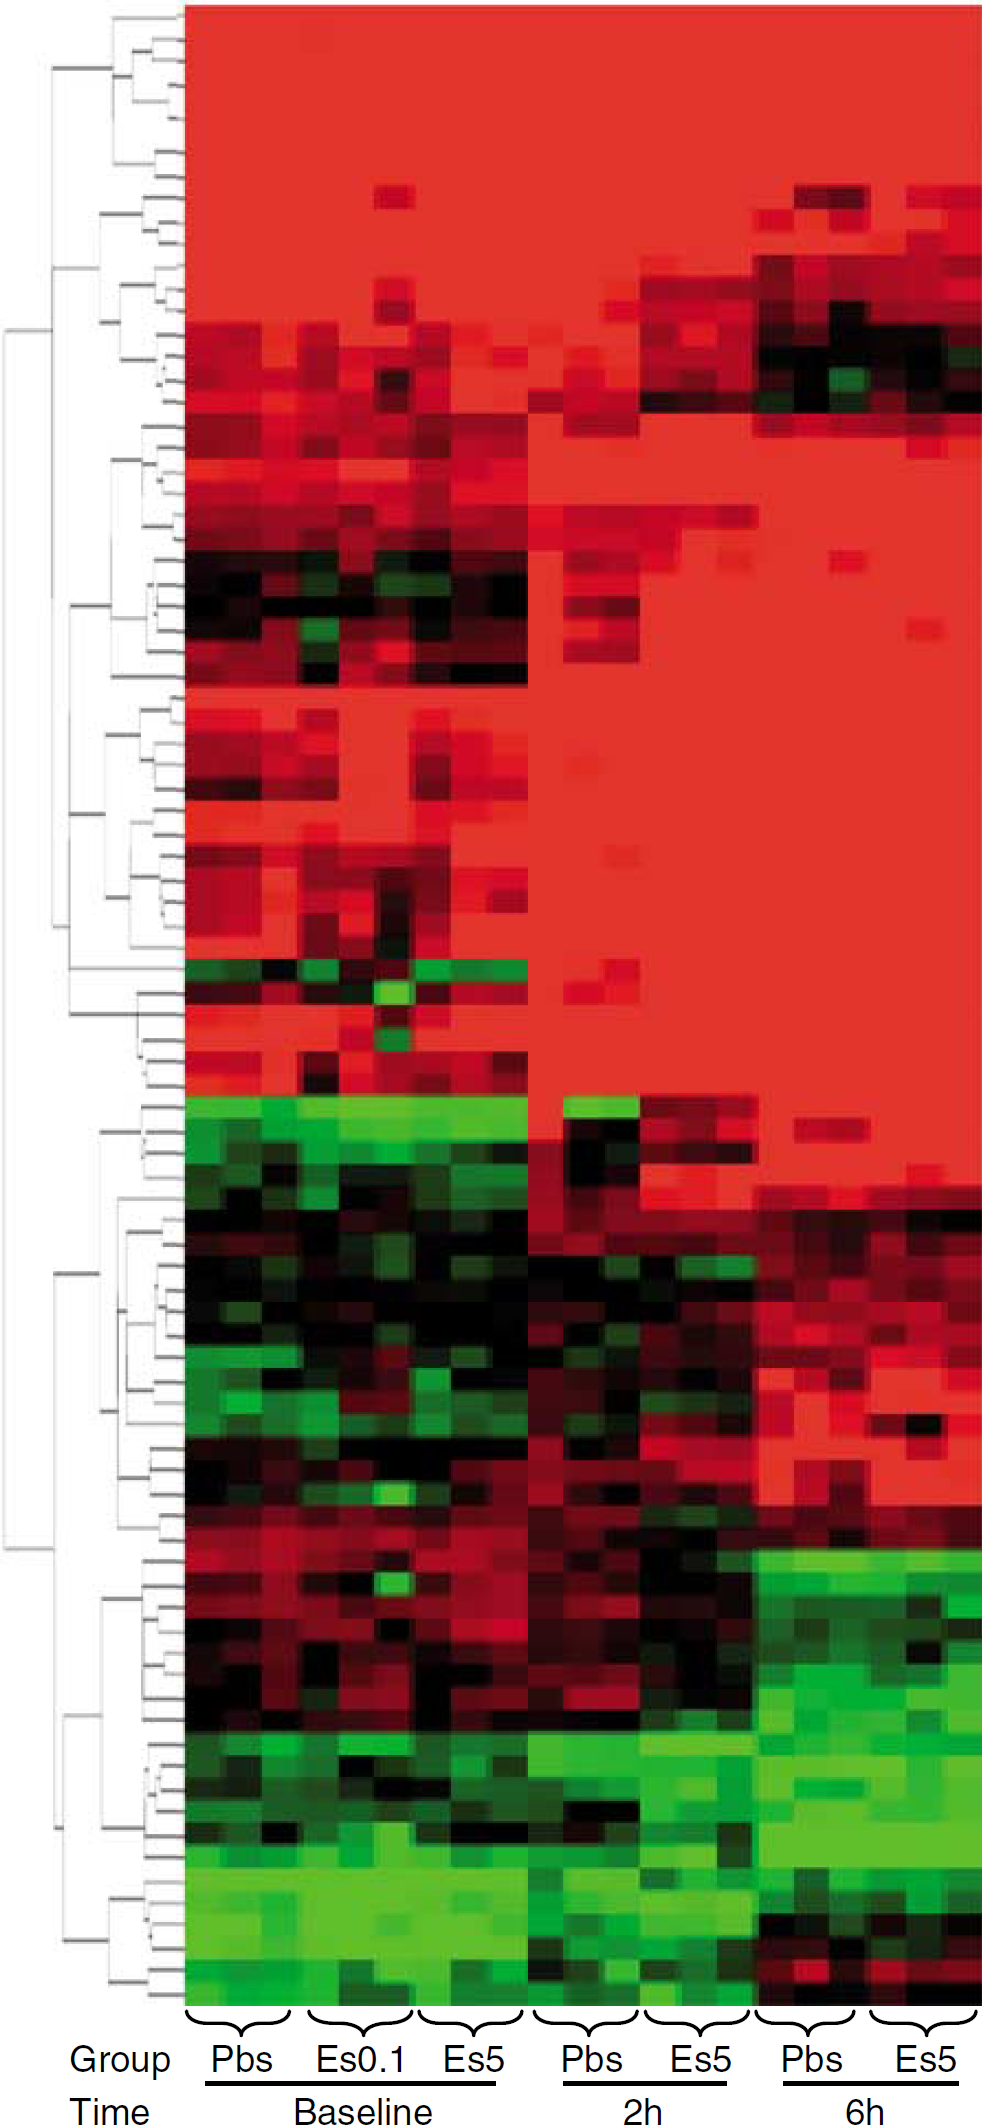
Spleen arrays of all groups (at baseline, at 2 h, and at 6 h post lipopolysaccharide (LPS)), hierarchical clustering by Euclidean distance of 88 differentially expressed genes at P < 0.0001. Differences in clustering of splenic genes by treatment group were showed after the one-way analysis of variance (ANOVA) analysis.
Further, we compared the spleen expression from the PBS and E-selectin 5 μg (excluding the 0.1 μg dose group as LPS challenge was not given to this dose group). At 6 h after LPS challenge, an enormous change in gene expression was seen in the spleen as shown by the significant differential expression of 924 genes, of which 353 are known. The marked gene expression changes at 6 h after LPS occurred irrespective of the treatment agent with little intertreatment differences (PBS versus E-selectin) compared with earlier time points. Among the known gene transcripts that changed from baseline to 6 h post LPS, 97 had GO annotation. A number of the genes are involved with inflammation and immune modulation. Again, the S100 proteins (S100A8 and S100A9) are prominent (both with P < 0.00001). Also noted are the genes for chemokine (C—X—C motif) ligand 12, chemokine receptor (LCR1), P-selectin, IL-1&bT, and complement component 5 (receptor 1).
Spleen baseline after tolerization: The differentially expressed genes after mucosal tolerance induction can be evaluated as potential biomarkers of immune tolerance in general. Among 5,535 genes present in all arrays from the 3 baseline groups (PBS, E-selectin 0.1 μg, and E-selectin 5 μg), 11 of the 24 differentially expressed genes are known (Table 3). These differences represent a dose-response variation considering that each E-selectin dose group (0.1 or 5 mg) served as a separate comparison group to the control PBS group. Two of the noted genes, RT1 class Ib and CD94 antigen (downregulated with tolerance induction), are involved in the regulation of major histocompatibility complex (MHC) class I-related antigen presentation to the natural killer (NK) cell complex.
Mean expression of spleen genes at baseline by treatment group
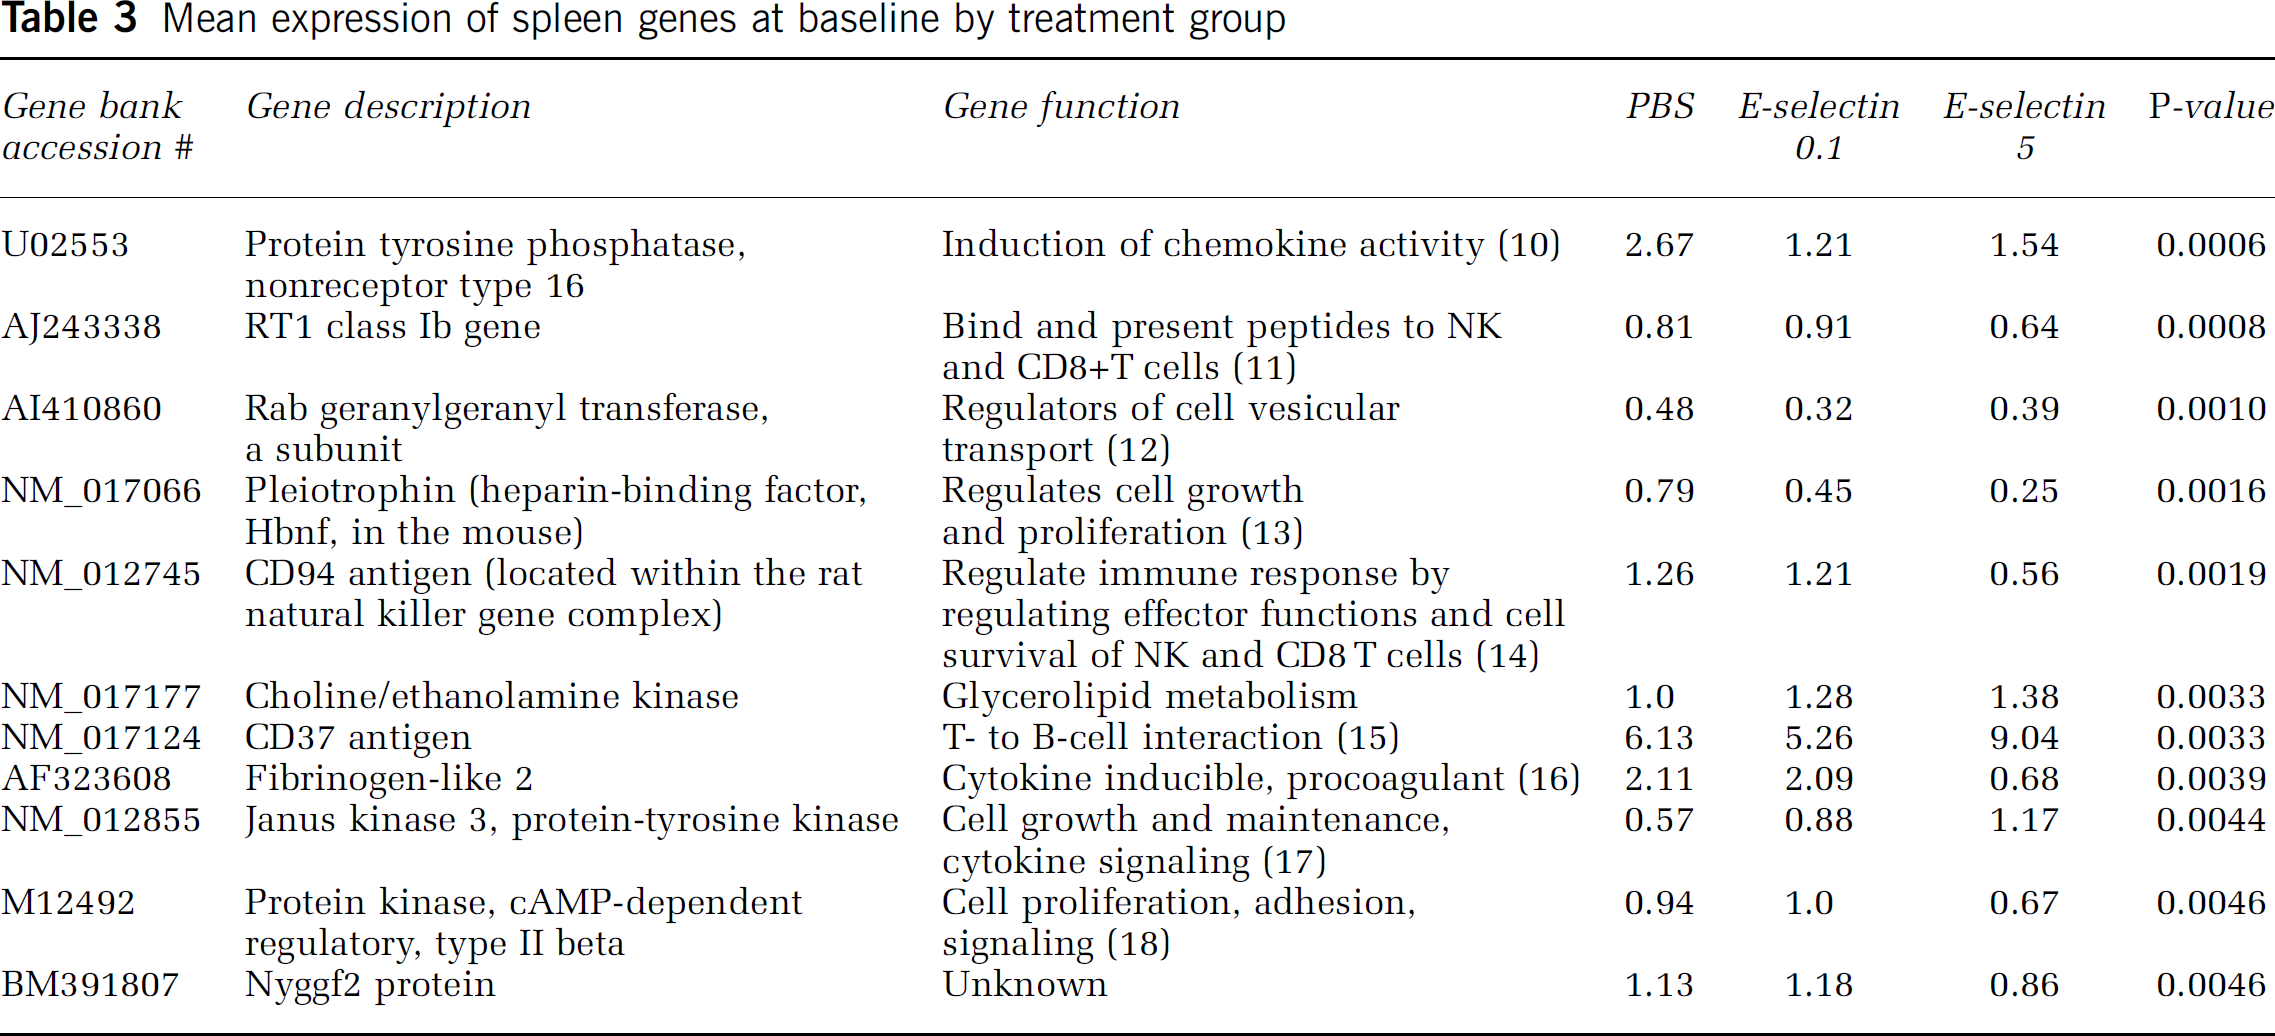
We observed gene expression differences with the different E-selectin doses. Compared with the PBS group, E-selectin 0.1 μg slightly downregulated the gene for CD37 antigen, while E-selectin 5 μg upregulated it. This gene plays a role in T- to B-cell interaction (Knobeloch et al, 2000); it may be involved in antibody production with the higher tolerization dose. In addition, treatment with E-selectin 5 μg downregulates RT1 gene, while E-selectin 0.1 μg upregulates it. Only the E-selectin 5 μg dose downregulated the genes for protein kinase (cAMP-dependent regulatory, type II beta) and Nyggf2 protein.
As both E-selectin doses confer immune tolerance, the PBS group was compared with the combined E-selectin groups at baseline, yielding 13 differentially regulated genes (P < 0.005). E-selectin treatment with either 0.1 or 5 μg led to clear upregulation of choline/ethanolamine kinase (1.3-fold, P =0.0005), Janus kinase 3 (Jak3, protein-tyrosine kinase, 1.8-fold upregulation, P =0.0016), and SH3-domain-binding protein 5 (BTK-associated, 1.3-fold, P = 0.0016), while nonreceptor type 16 PTP, diphos-phoinositol polyphosphate phosphohydolase type II, and Rab geranylgeranyl transferase (a subunit, P = 0.0023) were downregulated.
Janus kinase 3 is involved in cytokine signaling (Leonard and O'Shea, 1998). BTK-associated SH3-domain binding protein overexpression reduces B-cell antigen receptor-mediated apoptosis (Yamadori et al, 1999), calcium mobilization, and inositol 1,4,5-trisphosphate production, and may be involved in cytokine gene activation (Wiltshire et al, 2002).
Protein tyrosine phosphatase, downregulated twofold (P = 0.0003) by immune tolerance, is involved in the induction of chemokine activity (Heinonen et al, 2004). The T-cell PTP is a modulator of inflammatory signals and macrophage function and acts as a negative regulator of cytokine-associated signal transduction through members of JAK and STAT families (Heinonen et al, 2004).
Two hours after peripheral lipopolysaccharide challenge: At 2 h after LPS, 62 known genes (11 with GO annotation) had significantly different expression between the E-selectin tolerized and control groups. Of these, 5 are involved with cell growth/maintenance (4 of the 5 genes were downregulated). Fibronectin 1, downregulated 1.8-fold in the active treatment group (P = 0.0019), is produced by macrophages, smooth muscle, and endothelial cells, and is involved in cell adhesion in inflammatory processes. Its suppression affects infiltrating leukocytes and plays an important role in the maintenance of tolerance in transplant recipients by depressing local expression of Th1 cytokines (IL-2 and interferon-γ), which otherwise facilitate acute graft rejection (Coito et al, 2000). Other down-regulated genes in the E-selectin tolerized group include: retinoblastoma-like 2 (1.6-fold), dodecenoyl-coenzyme A delta isomerase (1.5-fold), and PKC-βb1 (1.4-fold).
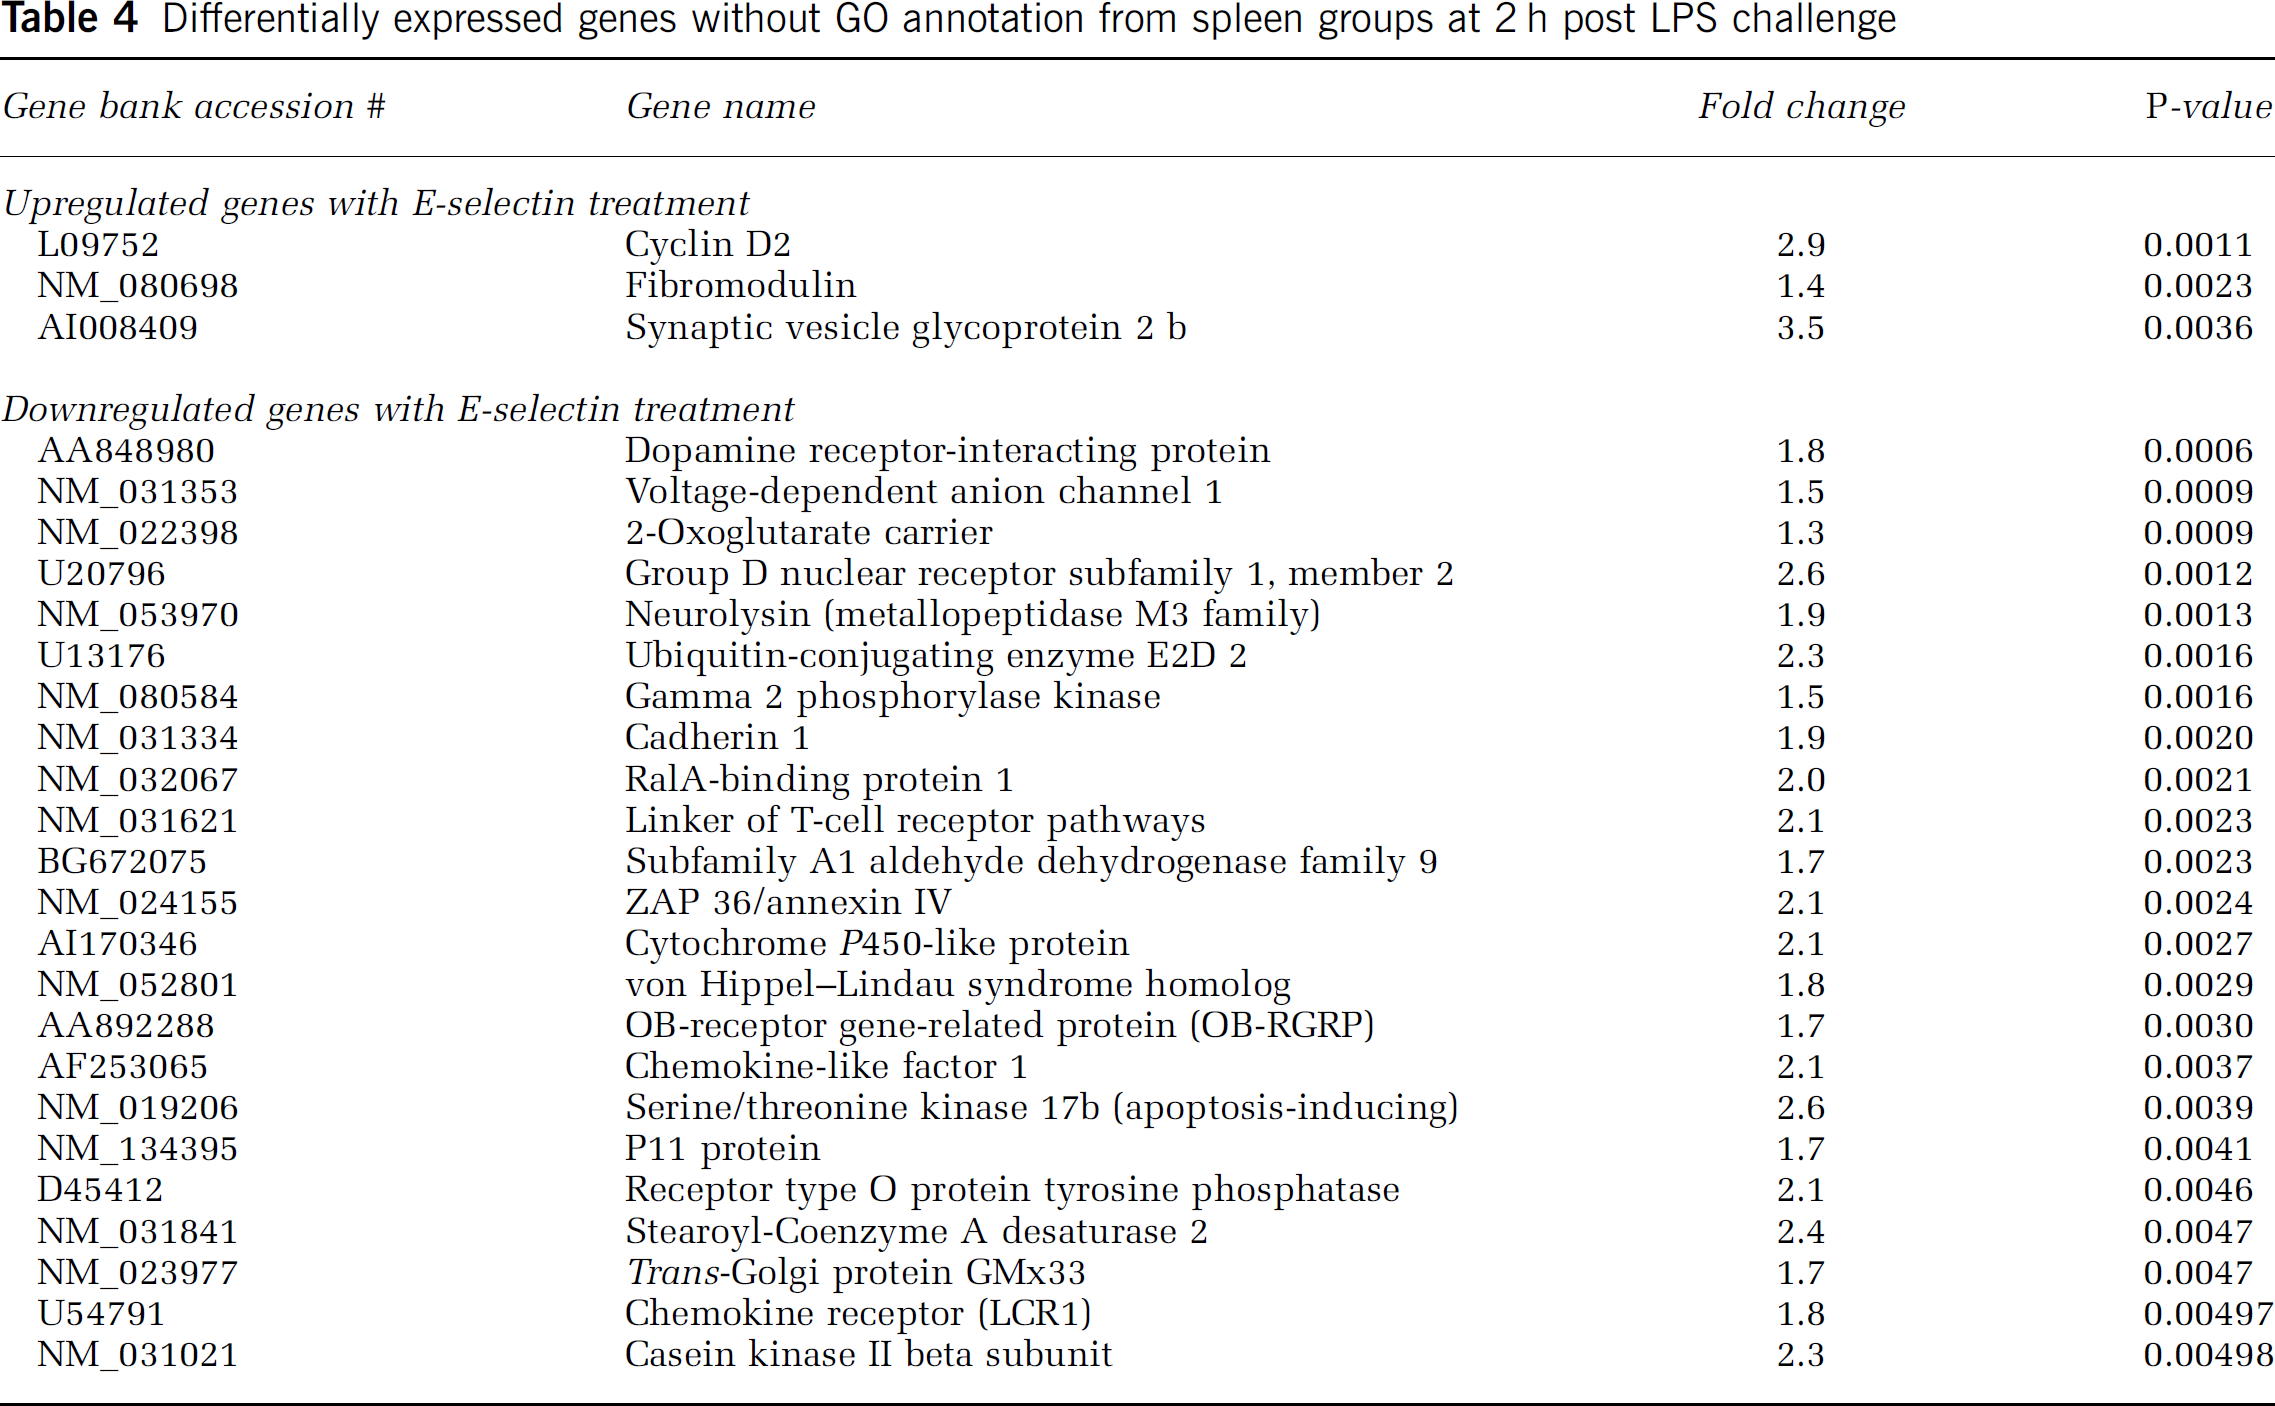
Three genes associated with cell communication were downregulated in the E-selectin group. These include fibronectin 1 and PKC-β, which are also involved with cell growth regulation. Both genes are linked with chemotaxis and cell adhesion in inflammatory response. The third gene, type O PTP receptor, was downregulated 1.4-fold. The genes without GO annotation but significantly different between the 2 treatment groups at 2 h are shown in Table 4 with their respective fold-change differences.
Differentially expressed genes without GO annotation from spleen groups at 2 h post LPS challenge
Six hours after peripheral lipopolysaccharide challenge: At 6h after LPS challenge, the differentially expressed genes were 11 transcribed sequences that included no known gene. Some genes with nonsignificant differences between group expressions include: (A) those upregulated in the E-selectin group, such as member A acidic nuclear phospho-protein 32 family (1.9-fold), nucleoporin 155 kDa (1.7-fold); 1.6-fold, aldehyde dehydrogenase; and 1.5-fold, B-type phosphofructokinase, Surfeit 1, cyclin H, phospholipase A2, activating protein; and (B) downregulated genes such as RT1 class Ib gene, adipsin, RAB26, member RAS oncogene family, and nuclear factor, IL-3, regulated (1.5-fold).
Real-time qPCR for spleen genes
The four genes from the spleen samples that were analyzed by real-time qPCR were S100A8, CCL5, P-selectin, and Jak3. The comparative pattern of expression for the S100A8 gene is shown in Figure 5B. From the spleen genes examined, we obtained an agreement rate of about 58% between the qPCR and microarray data.
Discussion
Repetitive intranasal administration of small doses of E-selectin had previously been shown to induce immune tolerance in stroke-prone rats (Takeda et al, 2002). In the present studies, we achieved immune tolerance within a dose range of 0.1 to 5 μg E-selectin. This treatment modality resulted in differential expression of genes both in the brain and in the periphery (spleen). The differences were apparent before and after the LPS challenge. E-selectin tolerance resulted in downregulation of at least 68% of the significantly expressed genes in the brain. The study also showed that in addition to modifying immune mechanisms, mucosal tolerance influences other biologic functions such as antioxidant activity that may help explain its capacity to cytoprotect brain.
Earlier studies have shown that induction of mucosal tolerance to E-selectin prevents ischemic and hemorrhagic stroke in SHR-SPs (Takeda et al, 2002). Subsequent studies showed that this means of immunomodulation reduces infarct size by about 38% at 48 h after permanent middle cerebral artery occlusion (Chen et al, 2003). A similar infarct size reduction was observed in SHR-SP rats with adoptive transfer of splenocytes from E-selectin tolerized donor rats. Furthermore, CD8-positive cells were decreased in the brains of the E-selectin tolerized animals (Chen et al, 2003).
The decrease in CD8-positive cells may be related to the MHC class I downregulation seen in our studies. Our results suggest that through the downregulation of the genes of RT1 class Ib and CD94 antigen, MHC class I suppression is involved in induction mucosal tolerance. The MHC molecules present peptide fragments of intracellular proteins, but in certain circumstances can present ‘exogenous' proteins, especially of viral origin (Blumberg, 1998; Hewitt, 2003). It follows that at least at certain doses, the E-selectin is taken up and processed by antigen-presenting cells with subsequent downregulation of the MHC I molecules. This may result in decreased activation of cytotoxic T-lymphocytes or NK cells that would normally be stimulated by the antigen-presenting cells. Given that NK cells prominently induce Th1 response (Martin-Fontecha et al, 2004), it may be that Th2 cytokines induced by mucosal tolerance aid the peripheral downregulation of the MHC I molecules. In addition, CD94 is expressed on differentiated Th1 but not Th2 cells (Meyers et al, 2002) increasing the likelihood that its suppression in our studies may relate to Th1 suppression. Of note, the antigen-presenting pathway of acquiring some antigens by MHC class Ib molecules (or nonclassical MHC class I like) overlaps with that of MHC class II molecules (Blumberg, 1998). Further studies will determine if the downregulation of MHC I molecules is because of cytokine signaling or cell-cell interaction.
The potential role of S100 family proteins in immune tolerance and inflammation is intriguing. Two members of this family show prominent differential expression between tolerized and nontolerized animals. The myeloid-related proteins (MRPs), S100A8 and S100A9, are calcium-binding proteins expressed mainly by cells of myeloid origin and they mediate a number of biologic functions. These functions include antinociceptive and proinflammatory activities (Ryckman et al, 2003). Since S100A8 and S100A9 play a role in the inflammatory response to LPS (Vandal et al, 2003), their greater upsurge at 2 h in the E-selectin-treated group suggests an enhanced early inflammatory activity with pretolerization. This early upregulation of inflammatory genes in the tolerized animals may lead to increased leukocyte migration or potentiate chemotaxis to attract protective myeloid cells. However, their reduced level at baseline and at 6 h post LPS in the E-selectin groups suggests a dampening of proinflammatory activity accompanies immune tolerance induction. These MRPs have shown promise as markers of inflammatory activities in autoimmune processes such as Crohn's disease, rheumatoid arthritis, and multiple sclerosis (Bogumil et al, 1998), and could be explored in stroke.
In the brain, the gene expression changes from the baseline to 6 h after LPS were substantial. It appears that prior tolerization to E-selectin protects the baseline gene expression background that supports homeostasis. Hence, only 12 genes differentiate the E-selectin group at 6 h post LPS from the PBS group at baseline. An interesting scheme of events unfolds here as seen in Figure 4. It takes 32 genes to bring the gene expression profiles of the PBS group at baseline to a state of immune tolerance in response to intranasal E-selectin and another 69 genes to reach the final 6 h post LPS stage, where only 12 genes separate the E-selectin tolerized and LPS-challenged gene expression profile from that of the PBS baseline state. This is in contrast to the nontolerized PBS group at 6 h post LPS in which 36 genes differ from the PBS gene expression profile at baseline.
Our studies show that the reprogrammed gene expression response to inflammation induced by prior immune tolerization resembles the reprogramming noted in ischemically preconditioned animals subjected to cerebral ischemia (Stenzel-Poore et al,. With inflammatory stimuli induced by LPS or ischemia in preconditioned animals, the gene expression responses in the tolerized animals are distinct from those in animals that have not been tolerized. However, our study of immunomodulation differs substantially from that of ischemic preconditioning in terms of the identity of the regulated genes. The differences are likely because of the different tolerization modalities, injury induction, sampling methods, and animal species. Interestingly, both studies show upregulation of the metallothionein gene with injurious ischemia or LPS challenge and this gene was not as prominently expressed with either method of tolerance induction. MT 1A gene encodes for a small metal-binding protein that is thought to protect against oxidative stress induced by reactive oxygen species that may be cytokine stimulated and of leukocyte origin (Palmiter, 1998). Although MT 1A is expressed throughout the body, it is specifically upregulated by astrocytes after neuronal injury (Chung et al, 2004
The brain studies in our set of experiments also highlight the importance of IGFs and their IGFBPs in the setting of injury. Although IGF-1 has been extensively shown to be involved in brain cell recovery in ischemic insults, IGF-2 has not undergone much study in the setting of immune tolerance induction. Although tolerance induction slightly downregulates IGF-2 at baseline, it blocks the massive downregulation that LPS challenge otherwise induces within 6 h. Other studies have showed upregulation of IGF-2 several days after hypoxic-ischemic injury to the developing rat brain suggesting its involvement in repair processes (Beilharz et al, 1995). Our finding of profound downregulation of IGF-2 with injury in the PBS group is consistent with another study where its expression by Northern blot analysis was found to be depressed at 4 h and beyond after traumatic rat brain injury (Giannakopoulou et al, 2000). Insulin-like growth factor-1 and IGF-2 appear to have similar functions albeit some differences. In our studies, IGF-1 mRNA expression is similar to the pattern seen with IGF-2, although without a statistically significant difference between treatment groups (result not shown). In the clinical setting, acute stroke in elderly patients has been associated with low levels of IGF-1, which also predicts poor outcome such as mortality in these patients (Denti et al, 2004). In animal models of stroke, treatment with IGF-1 or its analogs reduces infarct volume, improves functional outcome, and increased progenitor cell proliferation (Dempsey et al, 2003; Liu et al, 2001; Schabitz et al, 2001; Zhao et al, 2005). Our data add to the rationale for further investigation of the potential benefits of IGFs and IGFBPs in cerebral ischemia and immunomodulation. This is especially important as the brain genomic changes may be related to the peripheral changes through the IGF pathway. Brain IGF mRNA induction may come from microglial expression that is induced by Th2 cytokines produced by the tolerized T cells (Butovsky et al, 2005). In our study, the tolerized states of the peripheral T cells that are destined for the brain are most likely represented in the spleen.
This study has limitations when extrapolating its results to specific brain injuries such as stroke. They include our use of a systemic inflammatory stimulus (LPS) instead of focal vascular occlusion, small sample size per group, and limited sensitivity of microarray studies as shown by our inability to confirm all of the gene expression changes by real-time qPCR. Nonetheless, similar agreement rates between microarray and qPCR evaluations have been reported in other studies (Stenzel-Poore et al, 2003). Assessment of immunomodulation may be better performed by evaluating differences in infarct volumes and clinical scores in addition to the microarray assessments. However, such a comprehensive evaluation would be technically challenging considering the small amounts of tissue and RNA that would be available for microarray processing. These limitations notwithstanding, our study provides a robust platform for the evaluation of the numerous interactions that occur with many related genes in the setting of immunomodulation and injury. It has provided an avenue to simultaneously study central nervous system and systemic changes in gene expression while comparing different treatment arms. We thus provide patterns of changes seen with immune tolerance induction and an early (within 6 h) response to an inflammatory challenge.
The temporal pattern of spleen genomic expression in the first 6 h after a systemic inflammatory stimulus follows a biphasic response that includes (a) an early expression supporting an inflammatory response (as shown by the 2-h spike of the S100, IL-1β and chemokine (C—X—C motif) ligand 10 messages) as a result of the preceding immune tolerance induction, and (b) a later anti-inflammatory response as a result of the immune deviation with Th2 cytokine expression. Inflammation that leads to the activation and elimination of autoreactive T cells is likely to be beneficial in early ischemia and a cytokine switch in later phases of ischemia is likely to be useful for reparative processes. The inflammatory cascade that follows an injurious or ischemic event is complex and needs careful study of the temporal sequence from the time of onset. The dual role (beneficial versus harmful) of inflammation in a single setting may be a reason for the failure of anti-inflammatory agents in stroke patients to show benefit in clinical trials (Emerich et al, 2002). This calls for careful evaluation of the markers of inflammation that could delineate harmful versus beneficial such as Th1 versus Th2 lymphocyte activity.
Nonetheless, it appears immune tolerance induction results in the formation of ‘immunologic synapses' or discrete T-cell receptor-ligand interaction that results in rapid and efficient recruitment of immunomodulatory T cells on exposure to injury (Minton, 2004; Stinchcombe et al, 2001; Watson and Lee, 2004), which in turn leads to downregulation of MHC class I molecules and suppression of cytotoxic T cell-induced neurotoxicity or apoptosis. This mechanism involves the active participation of PTP, JAK, and IGF pathways among a host others. Our study opens new avenues to further examine the chemotactic responses associated with the expansion of Tregs with immune tolerance induction (Iellem et al, 2001; Valmori et al, 2005; Yamazaki et al, 2003), as well as to evaluate small molecule therapies found to induce immunomodulation (Youssef et al, 2002).
For translation into the clinical area, markers highlighted can be evaluated in cerebral vascular disease as potential biomarkers of disease or targets of therapy. There is a great potential for immune tolerance induction in stroke prevention, either primary or secondary. For it to be useful in the acute setting of stroke, it has to be shown that commencing tolerization will induce changes early enough to influence eventual recovery. This is of importance considering that other investigators have shown continued periinfarct inflammation by specialized brain imaging several weeks after the stroke event (Gerhard et al, 2000).
In all, we have showed that mucosal tolerance to E-selectin can be achieved within a dose range that produces significant gene expression changes in the brain and spleen before and after the induction of a systemic inflammatory response. These changes provide a focus for further studies to increase our understanding of the protective mechanisms of mucosal tolerance and emphasize possible targets of opportunity in the setting of brain ischemia.
Footnotes
Acknowledgements
We thank Novavax Inc. (Rockville, MD, USA) for the dot-blot assays used in obtaining the antibody profiles and provision of the E-selectin treatment protein.