
Abstract
We hereby propose a novel approach to the identification of ischemic stroke (IS) susceptibility genes that involves converging data from several unbiased genetic and genomic tools. We tested the association between IS and genes differentially expressed between cases and controls, then determined which data mapped to previously reported linkage peaks and were nominally associated with stroke in published genome-wide association studies. We first performed gene expression profiling in peripheral blood mononuclear cells of 20 IS cases and 20 controls. Sixteen differentially expressed genes mapped to reported whole-genome linkage peaks, including the
Keywords
Introduction
Stroke is the third leading cause of death in the developed world and is even more disabling than lethal; survival results in persistent neurological impairments and physical disabilities with a high socio-economic cost. Stroke is a complex disease, resulting from the interplay of numerous environmental and genetic risk factors. Current knowledge regarding the genetics of stroke is limited and identification of the susceptibility genes represents the clearest path to a better understanding of its etiopathogenic mechanisms.
In the present study, we propose a novel multifactorial approach that combines genomic profiling with linkage and association studies to dissect the genetic underpinnings of stroke. The usefulness of microarray expression analysis is often greatly hampered by the overwhelming amount of information generated combined with the fact that genes with the greatest levels of differential expression or significance are not necessarily the most important to further investigate. The use of intersecting data derived from other powerful and unbiased resources (e.g., linkage screens and genome-wide association studies (GWAS)), represents the first step toward a more efficient method of identifying susceptibility genes.
To our knowledge, there are no published studies investigating gene expression changes in humans that specifically increase the risk for a stroke event. The reported profiling studies in humans were performed either during the acute phase or in the first months after the stroke event (Moore et al, 2005a, 2005b; Tang et al, 2006; Baird, 2007; Xu et al, 2008; Sharp et al, 2011), and thus these studies address the stroke severity and/or recovery mechanisms more than the risk of the stroke event.
To investigate the genetic architecture of familial stroke, three whole-genome linkage screens have previously been performed. The initial linkage peak on chromosome 5q12 was identified in Icelandic families (Gretarsdottir et al, 2002) and was replicated in northern Sweden (Nilsson-Ardnor et al, 2005), with additional linkage evidence for loci on 1p34, 5q13, 7q35, 9q22, 9q34, 13q32, 14q32, 18p11, and 20q13 (Nilsson-Ardnor et al, 2007). Follow-up of two Icelandic studies on stroke (Gretarsdottir et al, 2003; Helgadottir et al, 2004) has sparked intense and on-going investigation and debate regarding whether
The recent advent of GWAS has enabled genome-wide investigations of stroke, mostly in case–control data sets. The first IS GWAS tested the association of over 400,000 single-nucleotide polymorphisms (SNPs) in 249 Caucasian IS cases and 268 controls (Matarín et al, 2007); no SNPs reached genome-wide significance, but the ones with the strongest associations merit further investigation. A second GWAS was performed in 188 Japanese IS cases and 188 controls using 52,608 gene-based tagging SNPs. This study was followed by validation in large Japanese samples and sequencing; an association was identified between lacunar infarction and SNP 1425G/A in the protein kinase C η (
The only family-based genome-wide scan for IS was conducted on 1,345 Framingham Heart Study participants from 310 pedigrees (Larson et al, 2007). Four major cardiovascular disease (CVD) outcomes (e.g., major atherosclerotic CVD, which includes myocardial infarction, coronary heart disease, death, and stroke) were analyzed and several associations reached
Given the discrepancies in the findings among GWAS, it is clearly necessary to validate their most significant results (above and below genome-wide significance level) in independent data sets, as well as by other approaches, such as the one proposed here (combination of genetics and genomic profiling), to pinpoint the real genetic players in stroke etiology.
Materials and methods
Study Subjects
The Portuguese and Spanish stroke cases and controls used in this study were ascertained and collected as described previously (Krug et al (2010) for Portuguese samples, Montaner et al (2006) for Spanish cases, and Domingues-Montanari et al (2010c) for Spanish controls). All participants were adults and Caucasian. Spanish patients were classified into causative subtypes according to the Trial of Org 10172 in Acute Stroke Treatment classification (Adams et al, 1993).
More stringent inclusion and exclusion criteria were applied to individuals participating in the genomic expression profiling study; IS patients were required to have suffered only one stroke episode, at least 6 months before the blood collection, and controls could not have a family history of stroke. Participants with severe anemia or active allergies were also excluded.
The study was approved by the ethics committees of the participating institutions. All participants were informed of the study and provided informed consent.
Gene Profiling Studies
Whole blood samples were obtained by venipuncture and collected in BD Vacutainer CPT tubes (BD, Franklin Lakes, NJ, USA). These samples were centrifuged to isolate peripheral blood mononuclear cells (PBMCs), which were then washed twice and their RNA was stabilized using RNAlater (Qiagen, Hilden, Germany) within 3 hours after sample collection. Total RNA was extracted using the RNeasy Mini kit (Qiagen). High-quality total RNA, 3.5
The generated intensity array data were analyzed together with their respective CDF file from Affymetrix on the Partek software (Partek Incorporated, St Louis, MO, USA). The imported CEL files were subjected to background correction, normalization, and summarization using the robust multichip average algorithm. Analysis of variance was used to identify the differentially expressed genes among cases and controls, taking into account known experimental (type, sex, and age) and study design (geographic origin and scan date) covariates (
Gene expression profiling was conducted and reported in accordance with the minimum information about a microarray experiment (MIAME) criteria (Brazma et al, 2001). The Gene Expression Omnibus (GEO) accession number for the data is GSE22255.
With the Partek software, principal component analysis was performed to visualize the relative position of each individual in a low-dimensional space, and hierarchical clustering analyses were used to determine the expression patterns across the samples. As these visualization tools cannot correct for study design batch effects, we removed the effects of the geographic origin of the participants and the scan date of the microarrays using the batch-remove tool implemented in the Partek software before visualization. Principal component analysis was performed with the correlation dispersion matrix and normalized eigenvector scaling, and hierarchical clustering was performed with the correlation distance metric and centroid linkage method.
Gene ontology was executed using the Gene Function Enrichment tool from the dChip 2009 software (http://biosun1.harvard.edu/complab/dchip/), with a gene
Quantitative real-time polymerase chain reaction confirmation of some of the microarray results was not performed because of an insufficient amount of RNA still available for several of the controls and patients used in this study.
Genotyping
Tagging SNPs in
For validation purposes, 10 SNPs in
Association Analyses
For all genotyped SNPs, deviations from Hardy–Weinberg equilibrium (
The associations between IS risk and specific classes of alleles/genotypes/haplotypes were tested using a standard
Results
Gene Expression Profiling
To investigate the gene expression differences between IS cases and controls in the nonacute phase of stroke, we compared the genetic profiles of PBMCs from 20 IS cases (from whom the samples were collected at least 6 months after the first and only stroke event) and 20 controls. The principal demographic, clinical, and lifestyle characteristics of the expression profiling study participants are shown in Table 1. The control and case groups were age- and sex-matched, and only the frequency of diabetes was significantly higher in IS patients than in controls (
Characterization of the samples used in the gene profiling study
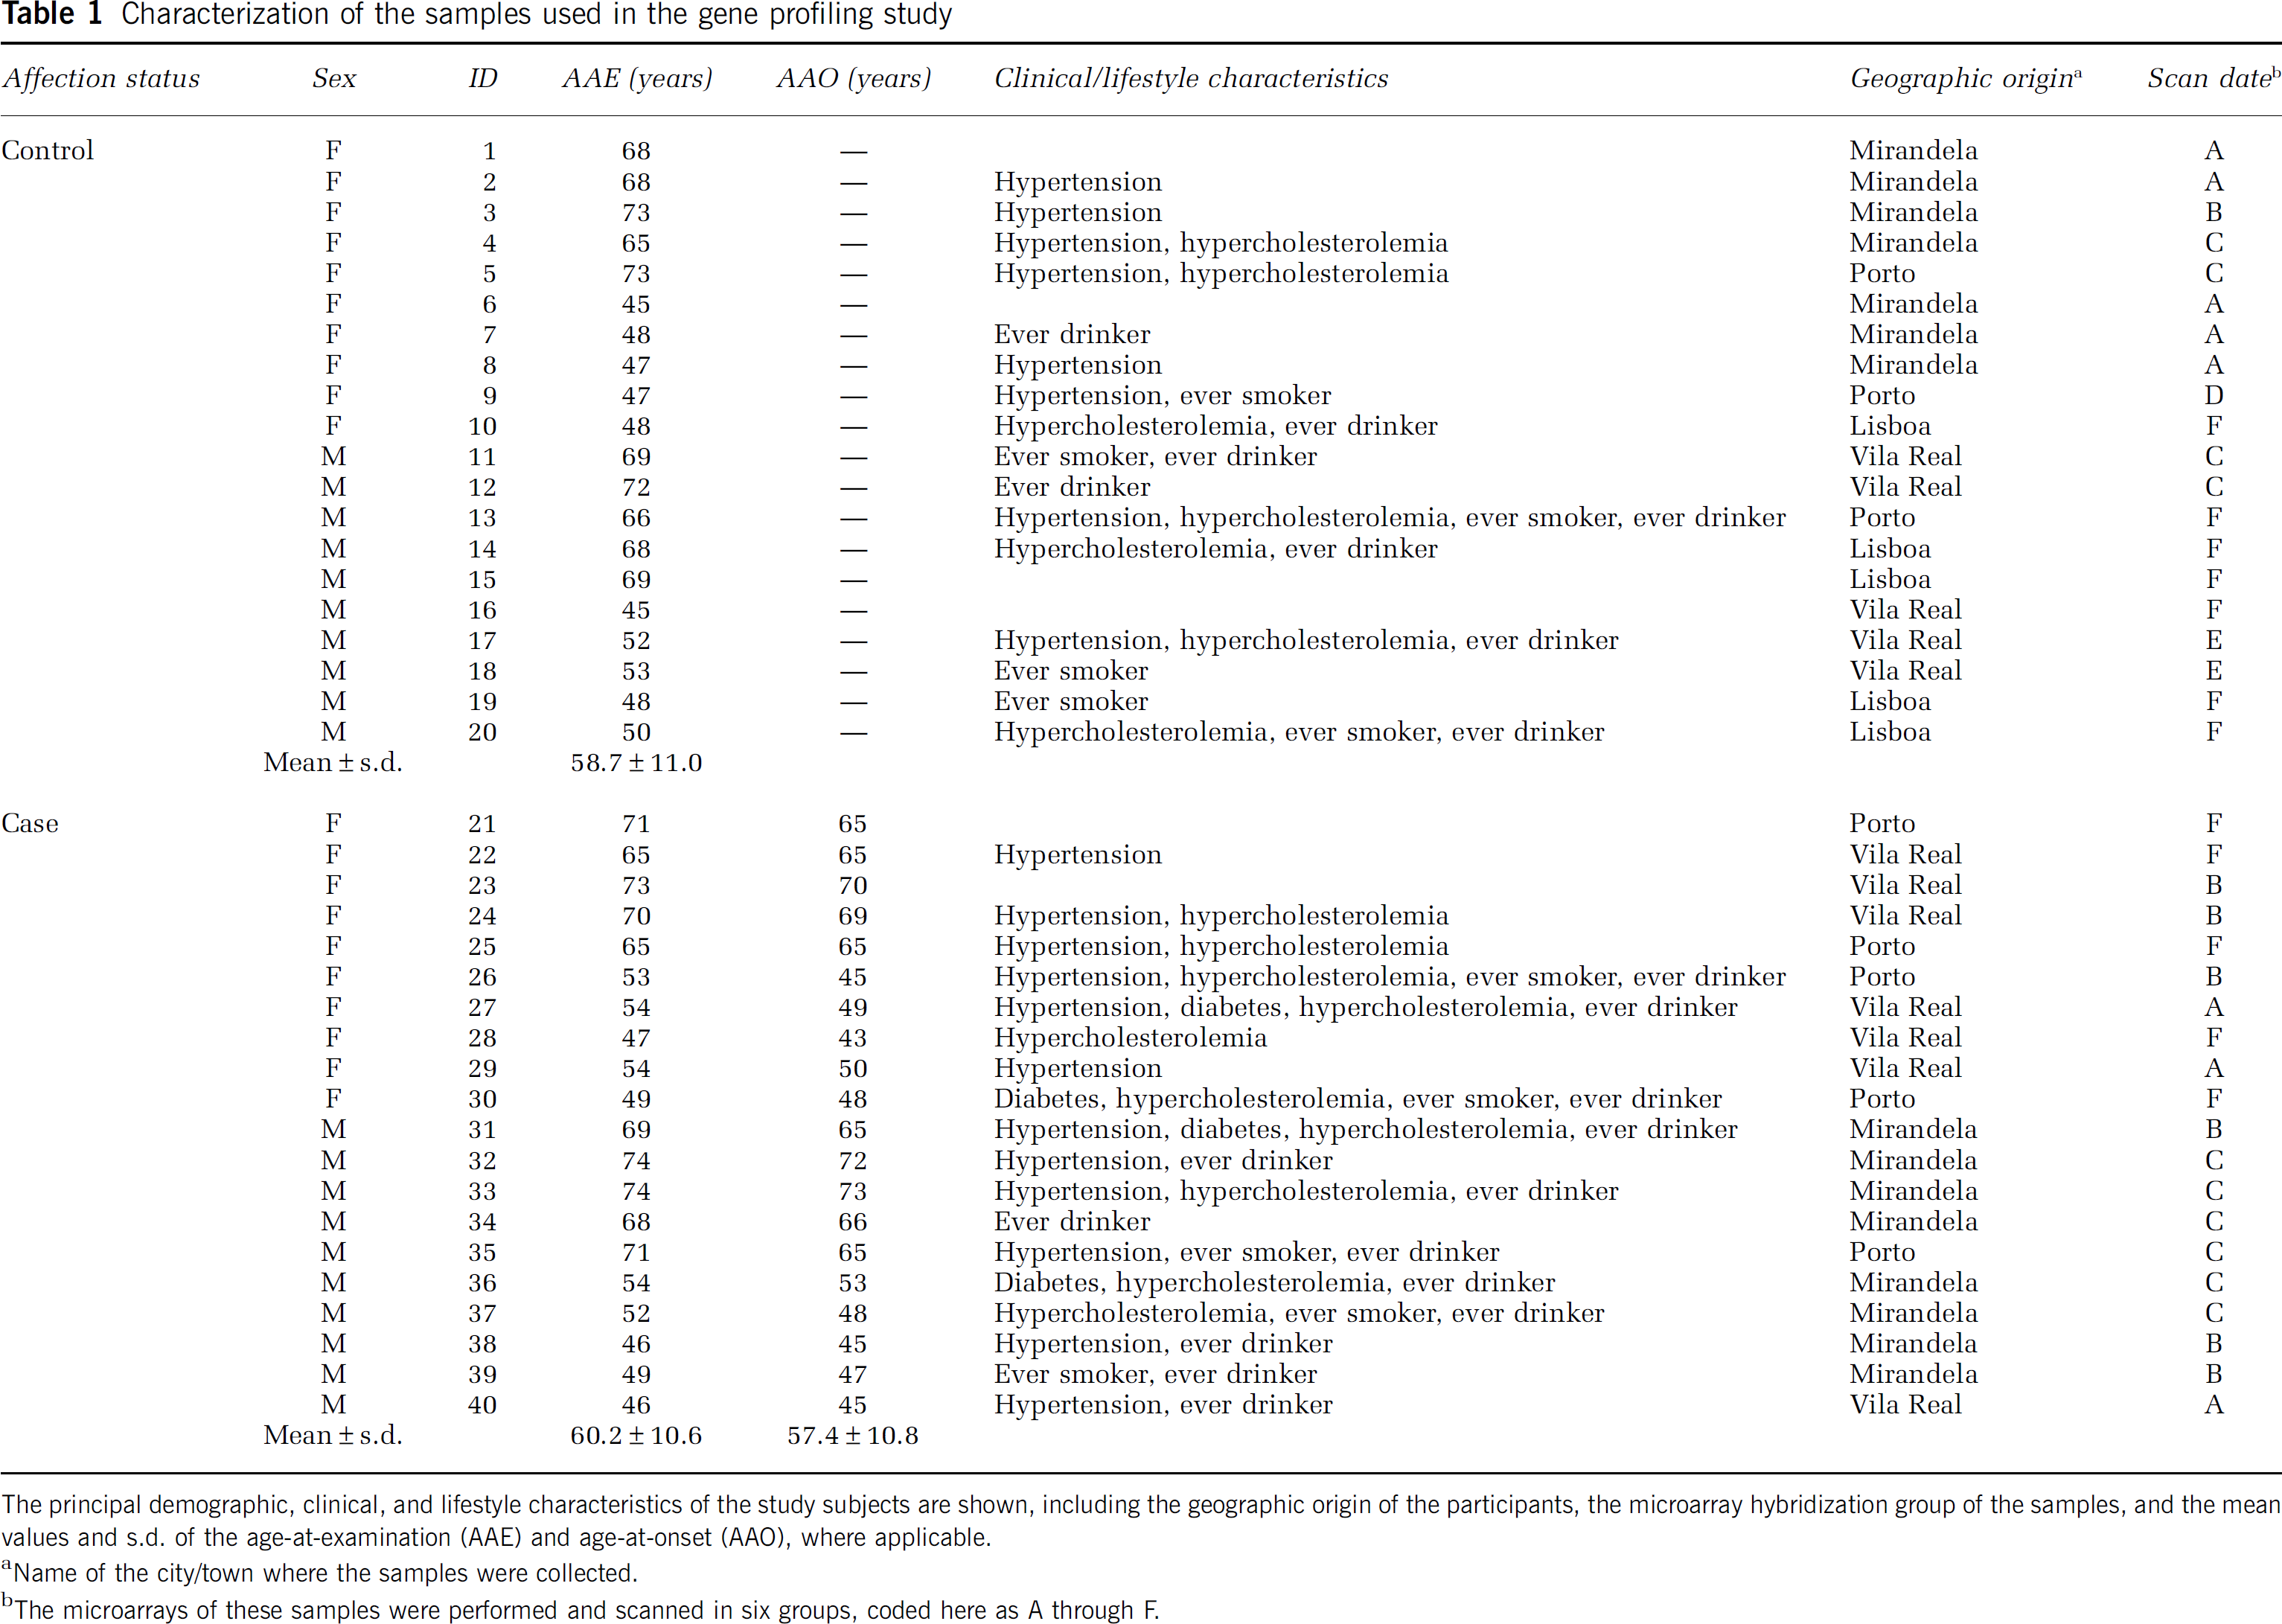
The principal demographic, clinical, and lifestyle characteristics of the study subjects are shown, including the geographic origin of the participants, the microarray hybridization group of the samples, and the mean values and s.d. of the age-at-examination (AAE) and age-at-onset (AAO), where applicable.
Name of the city/town where the samples were collected.
The microarrays of these samples were performed and scanned in six groups, coded here as A through F.
Total RNA from each individual was hybridized to an Affymetrix GeneChip Human Genome U133 Plus 2.0 microarray and all of the hybridized arrays met quality scores. The average±s.d. of present calls and of background for all the arrays were 44.8%±1.6% and 45.3%±5.7%, respectively.
Using analysis of variance on the normalized expression data, 709 probe sets (representing 580 genes) were found to be differentially expressed among IS cases and controls, with a threshold of 1.2-fold change and a
The 3D principal component analysis plot obtained using probe sets with
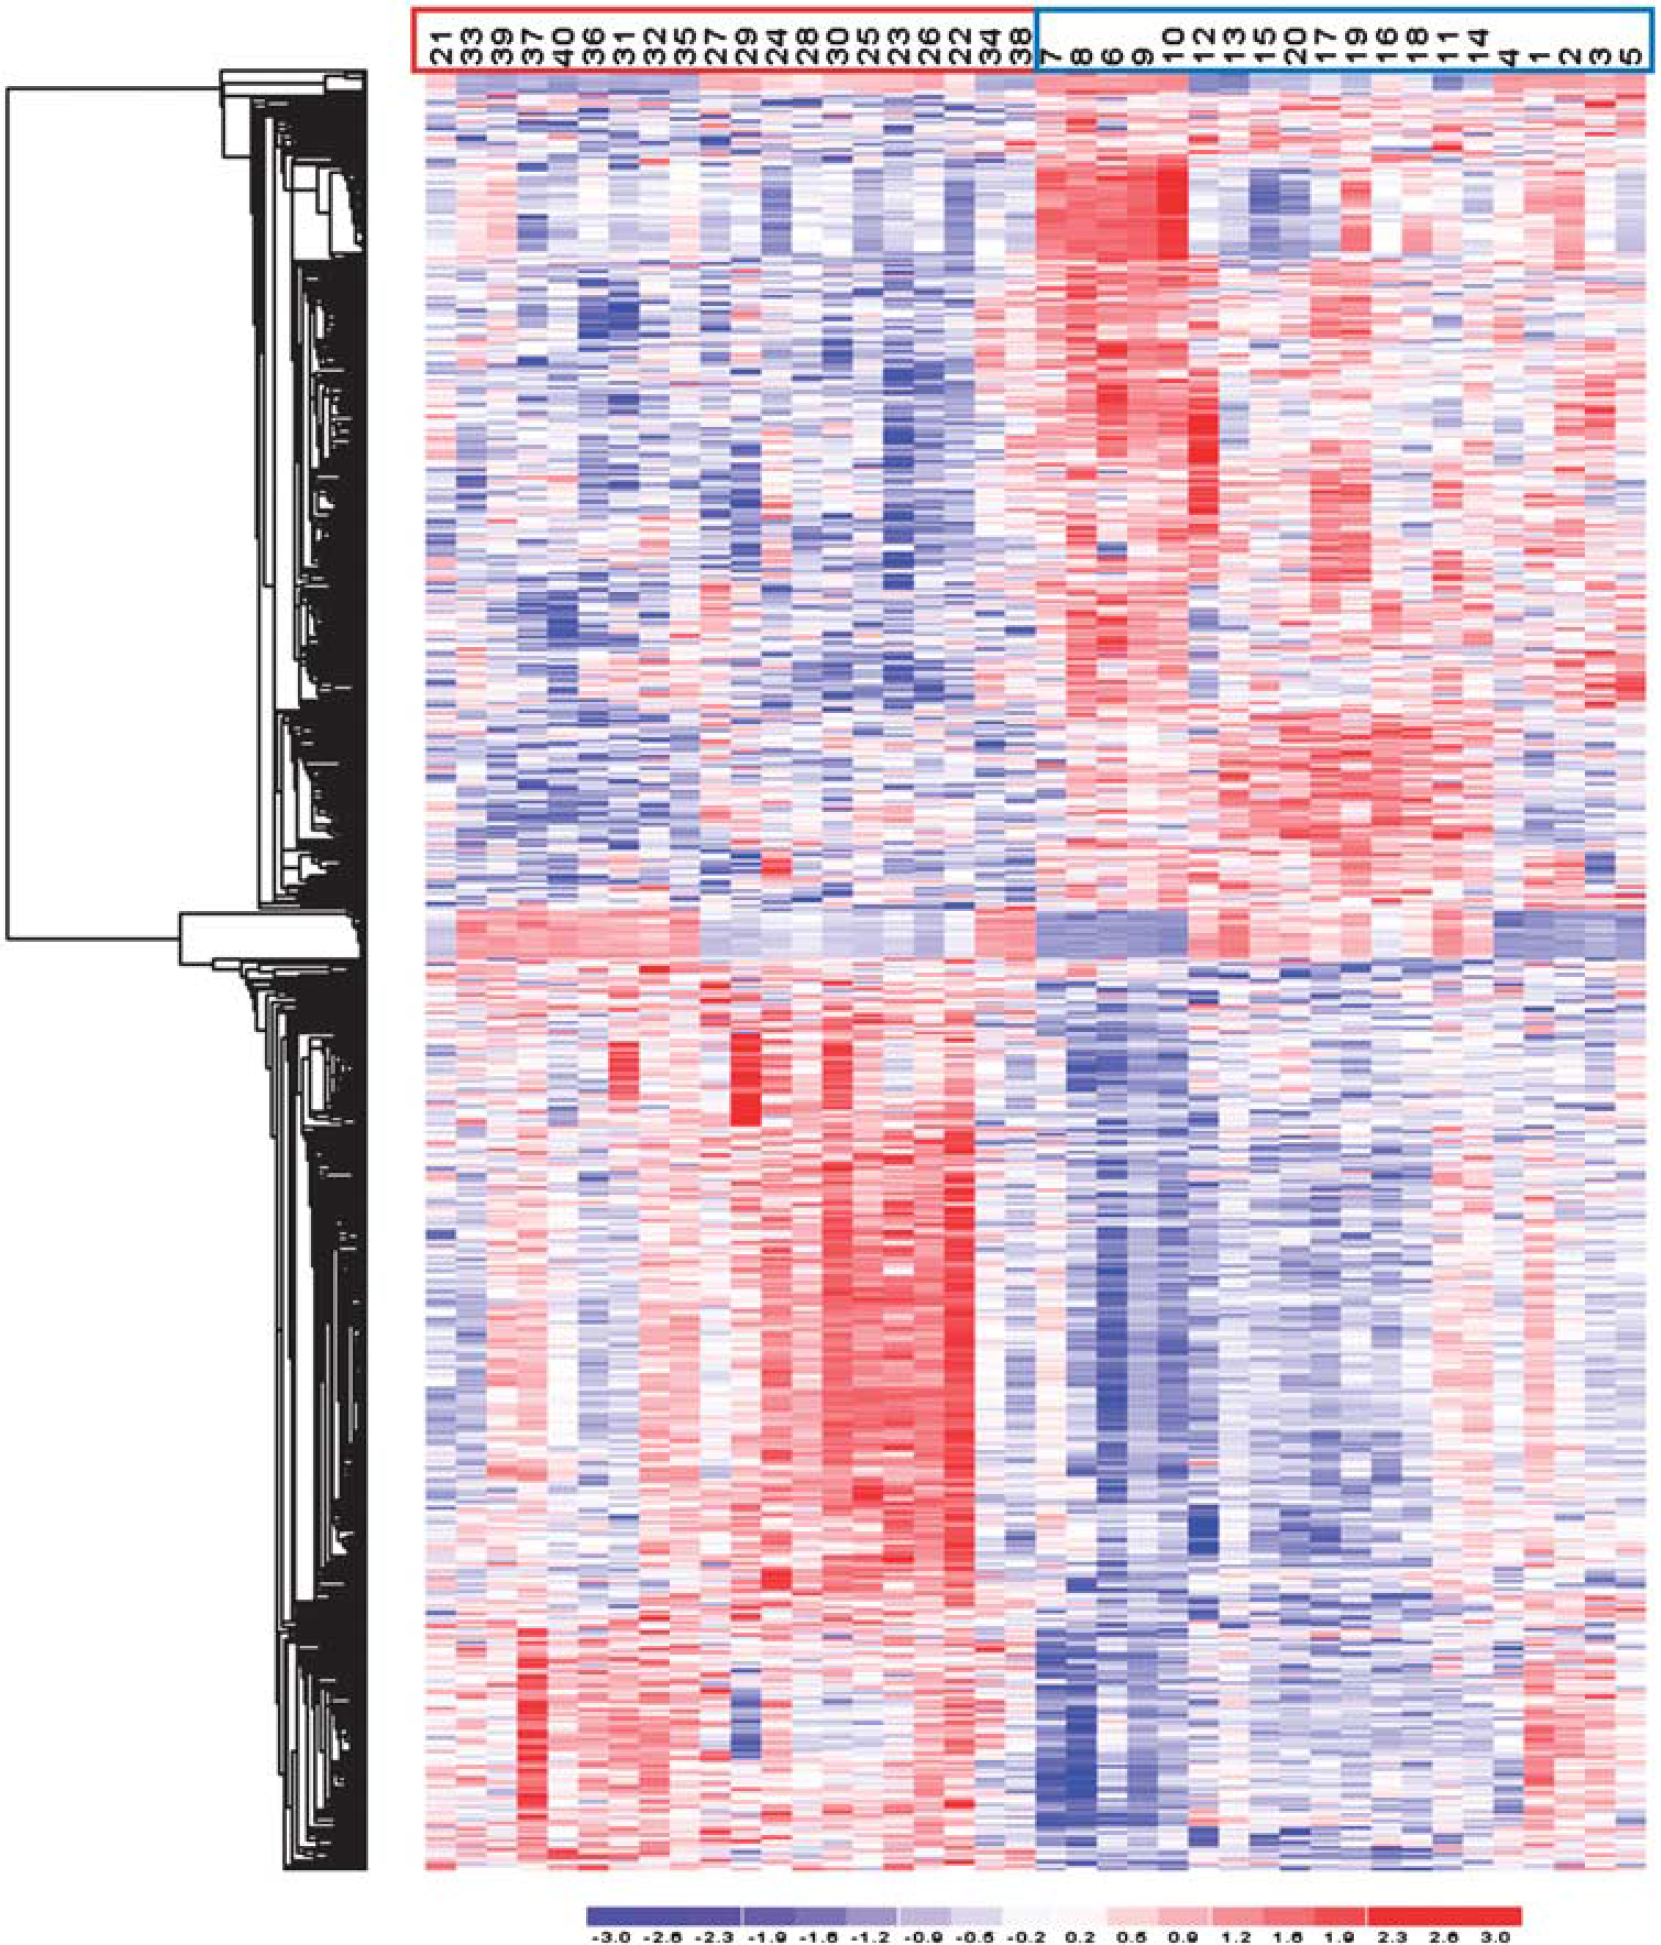
Illustration of the expression pattern differences among ischemic stroke (IS) cases and controls. Hierarchical clustering analysis of analyzed samples, using the 709 probe sets differentially expressed among IS cases and controls, with a threshold of a 1.2-fold change and a
When analyzing the 580 differentially expressed genes for their function (Supplementary Table 4), we found a significant overrepresentation (1.0 × 10⁻⁹<
Convergence of Expression with Linkage and Genome-Wide Association Studies
To prioritize genes to be tested for association with stroke susceptibility, we intersected our expression results with those from published whole-genome linkage screens and GWAS for stroke. We found that 16 differentially expressed genes (Table 2) represented by specific probe sets (‘_at’ suffix) mapped to previously reported linkage peaks on chromosomes 1p34, 5q12, 9q22, 9q34, 13q32, 14q32, and 20q13 (Gretarsdottir et al, 2002; Nilsson-Ardnor et al, 2007). One of these 16 prioritized genes was
Prioritized genes
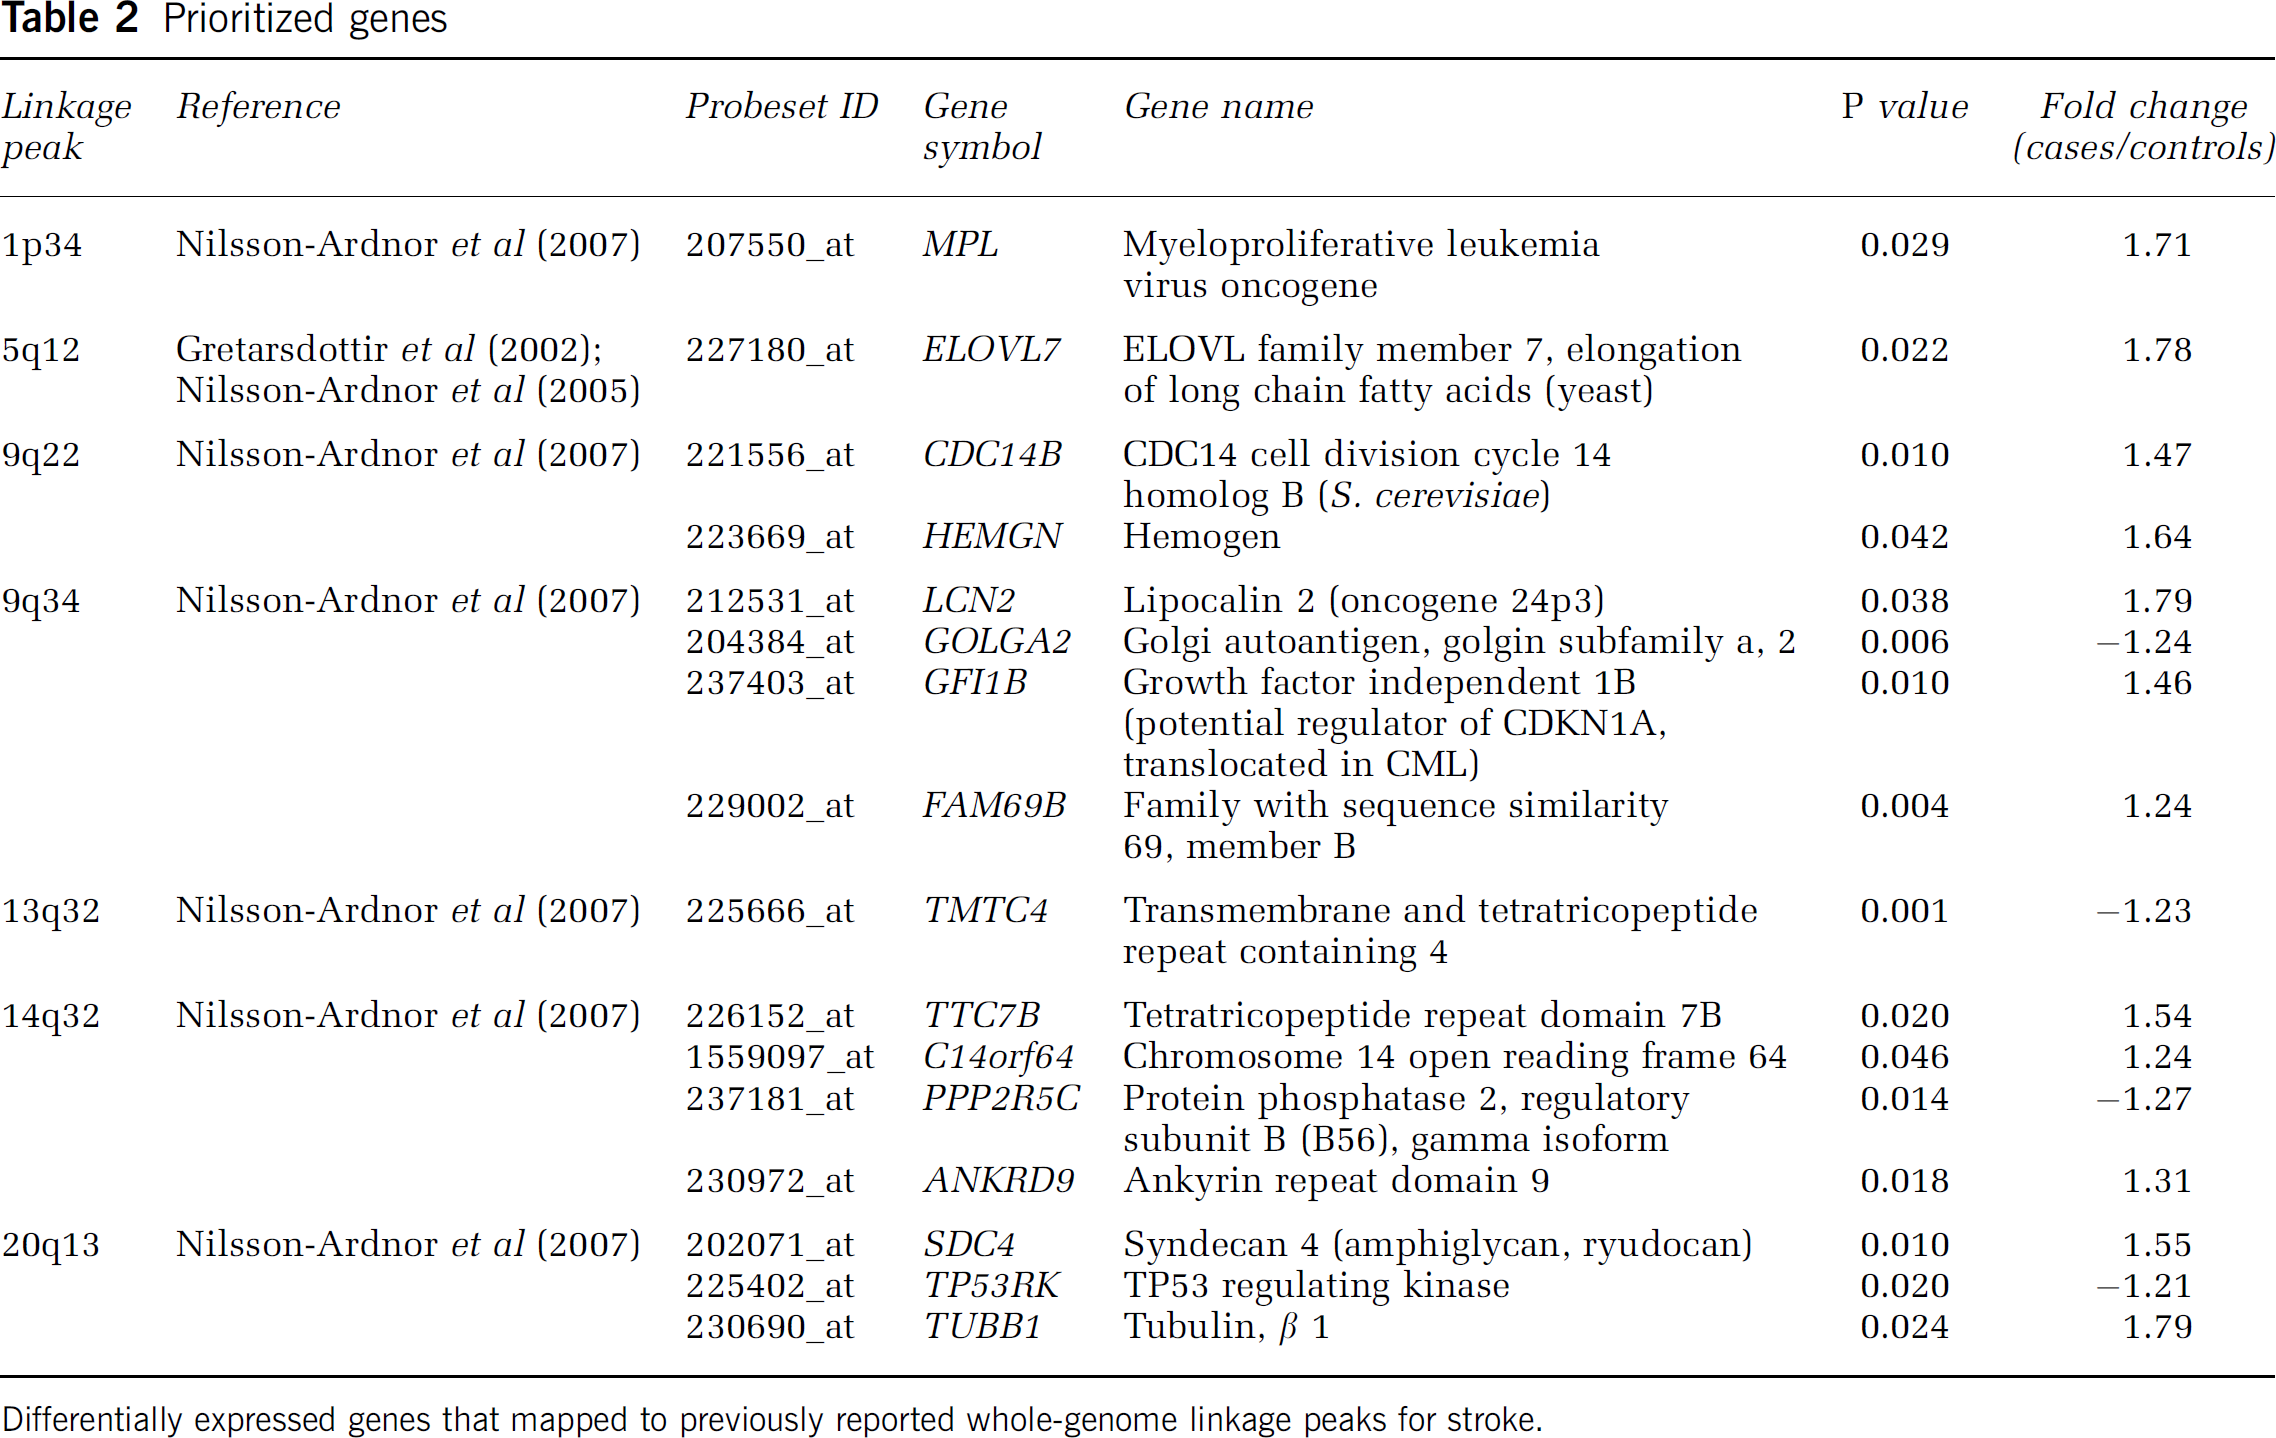
Differentially expressed genes that mapped to previously reported whole-genome linkage peaks for stroke.
TTC7B Association Study
To investigate the role of
The principal demographic and clinical characteristics of the Portuguese study participants (565 unrelated IS patients and 520 unrelated healthy individuals) are shown in Supplementary Table 6. As expected, male-to-female ratio, and frequencies of hypertension, diabetes, ever smoking, and ever drinking were significantly higher in IS patients than in controls. The age-at-examination was deliberately significantly higher in controls relative to patients to minimize misclassification biases. Since the sex, ever smoking, and ever drinking were correlated (correlation factors near 0.5), only the hypertension, diabetes, and ever smoking were included in the analyses adjusted for covariates.
The top plot in Figure 2 depicts the allelic, genotypic (crude and adjusted), and top haplotype association results from the Portuguese data set (represented by open circles connected by lines). The pairwise LD plot (bottom picture of Figure 2) shows little LD between most of the 46 SNPs studied. Three polymorphisms (SNPs 15, 31, and 36) demonstrated allelic associations with IS, while six SNPs were associated with IS in unadjusted (SNPs 5, 15, 19, 33, and 36) and/or adjusted (SNPs 5, 7, 19, 33, and 36) genotypic tests (recessive model). Only SNP 36 was associated in all tests performed, with
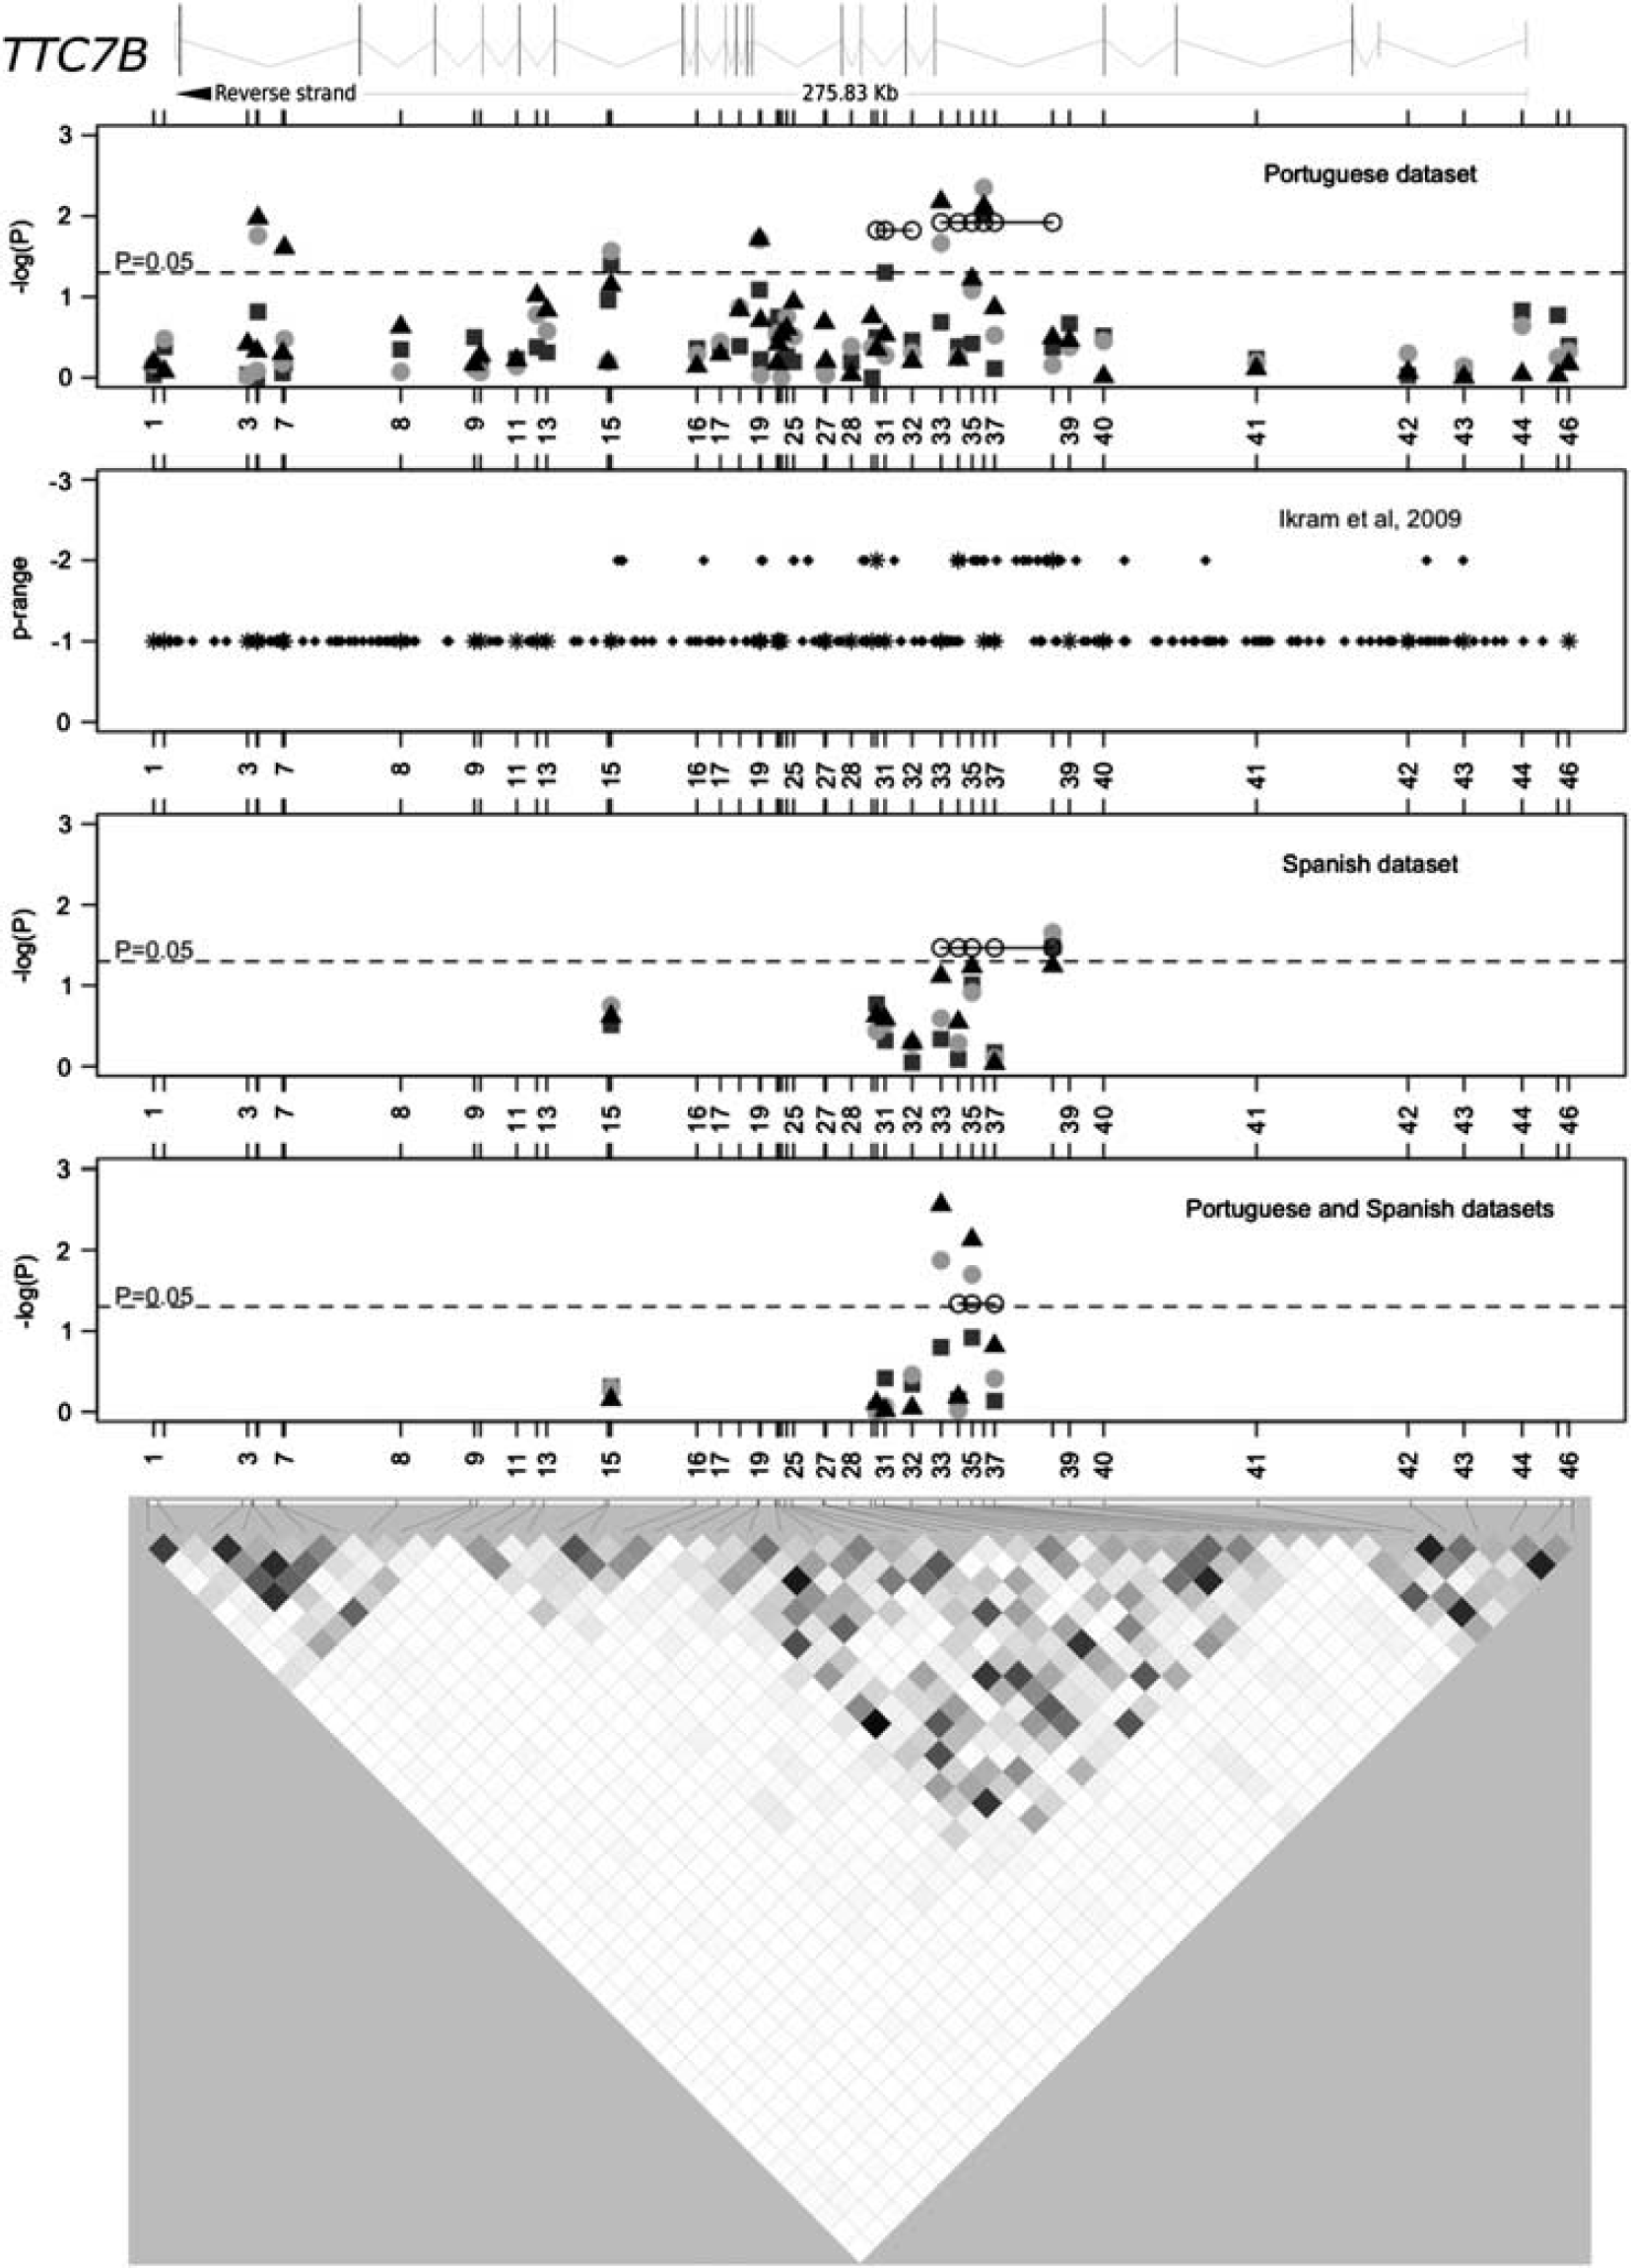
Association results and pairwise linkage disequilibrium (LD) among all genotyped polymorphisms for
We analyzed 259 polymorphisms investigated in the IS GWAS conducted by Ikram et al (2009) that were identified in the
TTC7B Replication Study and Combined Analysis
Since our association findings did not withstand the conservative Bonferroni's multiple testing correction, we performed a replication study in an independent Spanish sample. Single-nucleotide polymorphisms associated individually (SNPs 15, 19, 31, 33, and 36) and/or defining an associated haplotype (SNPs 30–38) were assayed in the Spanish data set. Single-nucleotide polymorphisms 19 and 36 failed quality controls and could not be tested. Gender, hypertension, diabetes, dyslipidemic status, and cigarette smoking were observed at significantly different frequencies between the 570 Spanish IS cases and the 390 Spanish controls (Supplementary Table 7). Since the gender and cigarette smoking were correlated (correlation factor near 0.5), the covariates in the adjusted analyses in this data set were hypertension, diabetes, cigarette smoking, and dyslipidemic status. The Spanish cases were classified according to the Trial of Org 10172 in Acute Stroke Treatment subtype classification system; 38.5% were cardioembolic, 30.5% were atherothrombotic, 30.8% were lacunar, and 0.2% were undetermined. Single-nucleotide polymorphism 38 was significantly associated with IS risk in allelic (
A joint analysis of the Portuguese and Spanish data sets (fourth plot in Figure 2) strengthened the previous findings. Single-nucleotide polymorphism 38 was out of Hardy–Weinberg equilibrium in the combined controls (
Discussion
With the ultimate goal of uncovering novel genetic risk factors for IS, we converged the results of several genome-wide approaches (an expression study, whole-genome linkage studies, GWAS) to identify high-priority genes for further analyses. Whole-genome strategies have the tremendous advantage of being unbiased by preconceived etiopathogenic models of disease; however, they typically generate an overwhelming amount of information and the top hits are not necessarily the only interesting leads to follow-up. By intersecting the findings of multiple studies, we compiled several independent lines of evidence supporting the involvement of a gene in the disease pathogenesis. This study demonstrated an altered gene expression profile in PBMCs of IS patients sampled at least 6 months after their first and only stroke episode, relative to controls. We found that
The first convergence factor in the present report was an mRNA expression profile of PBMCs of age- and sex-matched cases and controls. The underlying hypothesis was that genes that were differentially expressed in a pertinent tissue were likely to be involved in the disease process. Blood constitutes a clinically relevant tissue since it is readily accessible. Additionally, it is biologically relevant for stroke since the complex immune and homeostatic responses to the vascular injury that cause the stroke event are likely to be reflected in the expression profiles of circulating PBMCs (Sharp et al, 2011). It is important to note that the some of the published whole-genome expression studies conducted for stroke in humans (Moore et al, 2005a, 2005b), in animals (Tang et al, 2001), and the current study were performed on PBMCs, while most of the other published studies have been performed on whole blood (Tang et al, 2006; Zhan et al, 2010; Barr et al, 2010) using PAXgene tubes and at times Nugen amplification methods. The use of PBMCs rather than whole blood has the advantage of increased detection sensitivity due to the very high levels of globin mRNA in erythrocytes, which represent ∼95% of all blood cells.
Previous studies analyzed the expression profiles from PBMCs collected during the acute or convalescent phases of IS to understand the cascade of events precipitated by a stroke and its recovery (Moore et al, 2005a, 2005b; Tang et al, 2006; Larson et al, 2007). Here, we searched for genetic factors that predispose individuals to IS, and therefore our cases were sampled at least 6 months after the first and only IS. Several studies suggest that neurological and functional recovery after stroke, even in patients with severe and very severy strokes, reaches a plateau after 6 months (Jørgensen et al, 1995; Toschke et al, 2010). Six months was therefore estimated to be a sufficient time window to allow the PBMCs to return to their ‘resting’ expression profiles. One drawback of this strategy is that the expression of genes that render patients more prone to stroke may be normalized by the use of secondary prevention drugs, such as antiplatelet agents and statins.
Hierarchical clustering and principal component analyses (Figure 1; Supplementary Figure, respectively) showed a very good separation between cases and controls, based on differentially expressed genes. After a sensitivity analysis, we selected genes for follow-up studies based on a low threshold 1.2-fold change, which was deemed to be appropriate for a late-onset disease such as stroke, where small changes in expression over a long period of time are expected to result in the phenotype. Some of the differentially expressed genes (e.g.,
The gene
Even though our results did not retain significance following the conservative Bonferroni's correction for multiple testing, our association findings were strengthened by validation in multiple independent data sets. The recurrent nonreplication of genome-wide significant association findings in the stroke genetics field (ISGC and WTCCC2, 2010) suggests that there may be false positives, and that association results below the genome-wide significance level must be evaluated cautiously if they have not been replicated; corroboration of results in other studies may lead to more reproducible conclusions. For example, several of the most significant findings in the only IS GWAS that attained no genome-wide significant results have been replicated (Domingues-Montanari et al, 2010b; Ding et al, 2010). We therefore consider that the modest association of
Although the association signals clustered to the central region of the gene, no single SNP or haplotype in
Future work must be directed toward replicating these findings in other stroke samples as well as in other related vascular phenotypes. Additionally, studies should focus on elucidating the biochemical functions of
Footnotes
Acknowledgements
The authors are deeply grateful to all study participants, to the Affymetrix Core Facility and genotyping unit at the Instituto Gulbenkian de Ciência, and to the neurologists and nurses of the Stroke and Laboratory Units of Vall d'Hebron Hospital for their contributions. The Neurovascular Research Laboratory takes part in the Spanish stroke genetics consortium (GeneStroke), the international stroke genetics consortium (ISGC), and in the Spanish stroke research network (RENEVAS RD06/0026/0010).
Disclosure/conflict of interest
The authors declare no conflict of interest.
References
Supplementary Material
Please find the following supplemental material available below.
For Open Access articles published under a Creative Commons License, all supplemental material carries the same license as the article it is associated with.
For non-Open Access articles published, all supplemental material carries a non-exclusive license, and permission requests for re-use of supplemental material or any part of supplemental material shall be sent directly to the copyright owner as specified in the copyright notice associated with the article.