
Abstract
Diffusion anisotropy changes in stroke lesions less than 24 h after onset have been reported to be elevated, decreased, or both. To address these mixed findings, we sought to characterize temporal changes of diffusion anisotropy by analyzing anatomically distinct ischemic white matter (WM) regions at 3 time phases within the first 34 h of ischemic stroke onset in 26 stroke patients (2 to 5 h, N = 7; 7 to 14 h, N = 11; 18 to 34 h, N = 8). Mean diffusivity (Trace/3 apparent diffusion coefficient (ADC)), fractional anisotropy (FA), and T2-weighted signal intensity were measured for major and subcortical WM in lesions defined by a > 30% drop in Trace/3 ADC. Major WM tract lesions with mean decreases of ~40% in relative (r) Trace/3 ADC showed an increased rFA of 1.11 ± 0.18 (P < 0.01) during the hyperacute phase (2 to 5h), whereas rFA declined to 0.90 ± 0.20 (P < 0.01) and 0.88 ± 0.12 (P < 0.01) in the acute (7 to 14 h) and subacute (18 to 34h) phases, respectively. Of those patients with lesions in major WM, 4 of 8 patients ≤ 7 h showed elevated rFA as opposed to none of the remaining 13 patients after 7 h. A greater proportion of the evaluated WM regions-of-interest (ROI) in the hyperacute phase revealed increases in rFA (60%), whereas conversely large proportions of ROIs (55% and 59%) in the acute and subacute phases showed reduced rFA. Similar anisotropy changes were noted in subcortical WM regions in the gyri.
Introduction
The reduction of the apparent diffusion coefficient (ADC) of water within minutes after the onset of cerebral ischemia has made diffusion-weighted (wt) imaging (DWI) an indispensable clinical tool for the highly sensitive and specific diagnosis of stroke (Hjort et al, 2005; Moseley et al, 1990; Warach et al, 1992). The apparent diffusion coefficient remains low for the first few days after the onset of stroke symptoms, pseudonormalizes around 1 week (although this can occur earlier with successful reperfusion; Marks et al, 1999), and then is elevated at chronic time points (Beaulieu et al, 1999; Fiebach et al, 2002; Schlaug et al, 1997; Warach et al, 1995). Diffusion-wt imaging of stroke typically uses data from three diffusion directions to minimize the effects of diffusion anisotropy in ordered tissue such as white matter (WM) and yields maps of mean diffusivity ('Trace ADC') that are quite uniform between gray matter (GM) and WM. Conversely, diffusion tensor imaging (DTI), which measures diffusion in a minimum of six directions (Basser et al, 1994a, b), is better suited for a more comprehen-sive evaluation of diffusion changes in ischemic WM, and in particular by the degree of diffusion directionality of water within the tissue microstructure (i.e., anisotropy) (Pierpaoli et al, 1996; Sotak, 2002). A rodent study showed that fractional anisotropy (FA) is elevated during the first hour of ischemia, but then begins to decline over the remaining time course (Carano et al, 2000). Similar reports of experimental ischemia have showed that diffusion anisotropy is either elevated early on (Does and Gore, 2000) or preserved for 24 h after onset, after which it decreases progressively (Song et al, 2003). Diffusion anisotropy, unlike ‘Trace ADC', which remains consistently low during the first few days after stroke onset, may provide a means of distinguishing, even coarsely, time of onset after stroke.
Many attempts have been made at using DTI, in particular indices of diffusion anisotropy, to characterize the progression of ischemic lesions within 24 h and to predict the severity of the ischemic insult and outcome after stroke in humans (Green et al, 2002; Harris et al, 2004; Munoz Maniega et al, 2004; Ozsunar et al, 2004a; Schaefer et al, 2003; Sorensen et al, 1999; Sotak, 2002; Yang et al, 1999). However, studies reporting changes in FA have been variable with either reductions (Munoz Maniega et al, 2004; Sorensen et al, 1999), elevations (Schaefer et al, 2003), a mixture of changes (Green et al, 2002; Ozsunar et al, 2004a, b ; Yang et al, 1999), or no change (Harris et al, 2004). Elevations of 8% to 45% in FA have been noted to occur from < 4 h up to 24 h after symptom onset (Green et al, 2002; Ozsunar et al, 2004a; Schaefer et al, 2003; Yang et al,1999). Interestingly, similar studies have also reported FA reductions of 2% to 44% in individual patient data from 4 h up to 27 h after symptom onset (Green et al, 2002; Yang et al, 1999). Although biologic variability is certainly plausible, the wide discrepancy in FA results after stroke onset may be analytical in nature, arising from the practice of sampling larger regions-of-interest (ROI) that encompass different types of WM tracts or both WM and GM areas within the ROI in the ischemic core (Green et al, 2002; Harris et al, 2004; Ozsunar et al, 2004a; Schaefer et al, 2003) and/or that patient data from ≤ 24 h was grouped for analysis, thereby obscuring any time-dependent trends (Munoz Maniega et al, 2004; Sorensen et al, 1999).
The purpose of this study was to characterize changes of diffusion anisotropy in the early phases of human stroke by focusing on discrete WM tracts within the infarcts (because of differences in normal FA values of various WM regions; Pierpaoli et al, 1996), and separating patient data into 3 distinct time phases after stroke, namely hyperacute (2 to 5 h), acute (7 to 14 h), and subacute (18 to 34 h).
Materials and methods
Patients
In all, 26 patients (15M, 11F; mean age = 66 ±17 years) presenting with a nonhemorrhagic acute ischemic stroke within 34 h of onset were enrolled in the magnetic resonance imaging (MRI) study after computed tomography scanning and standard treatment (Table 1). Only patients with known times of onset were included in this study. In total, 10 patients were administered with drug treatment within 3 h of symptom onset (38%), including 8 patients with intravenous tissue plasminogen activator (rt-PA), 1 patient with rt-PA and the neuroprotectant, ONO-2506 (Merck & Co., Whitehouse Station, NJ, USA), and 1 patient who was entered into the SAINT-II trial involving a 72-h intravenous infusion of Cerovive (AstraZeneca Pharmaceuticals, Wilmington, DE, USA). Magnetic resonance imaging protocols were approved by the Human Research Ethics Board and written informed consent was obtained from all patients or their next of kin.
Characteristics of patient population
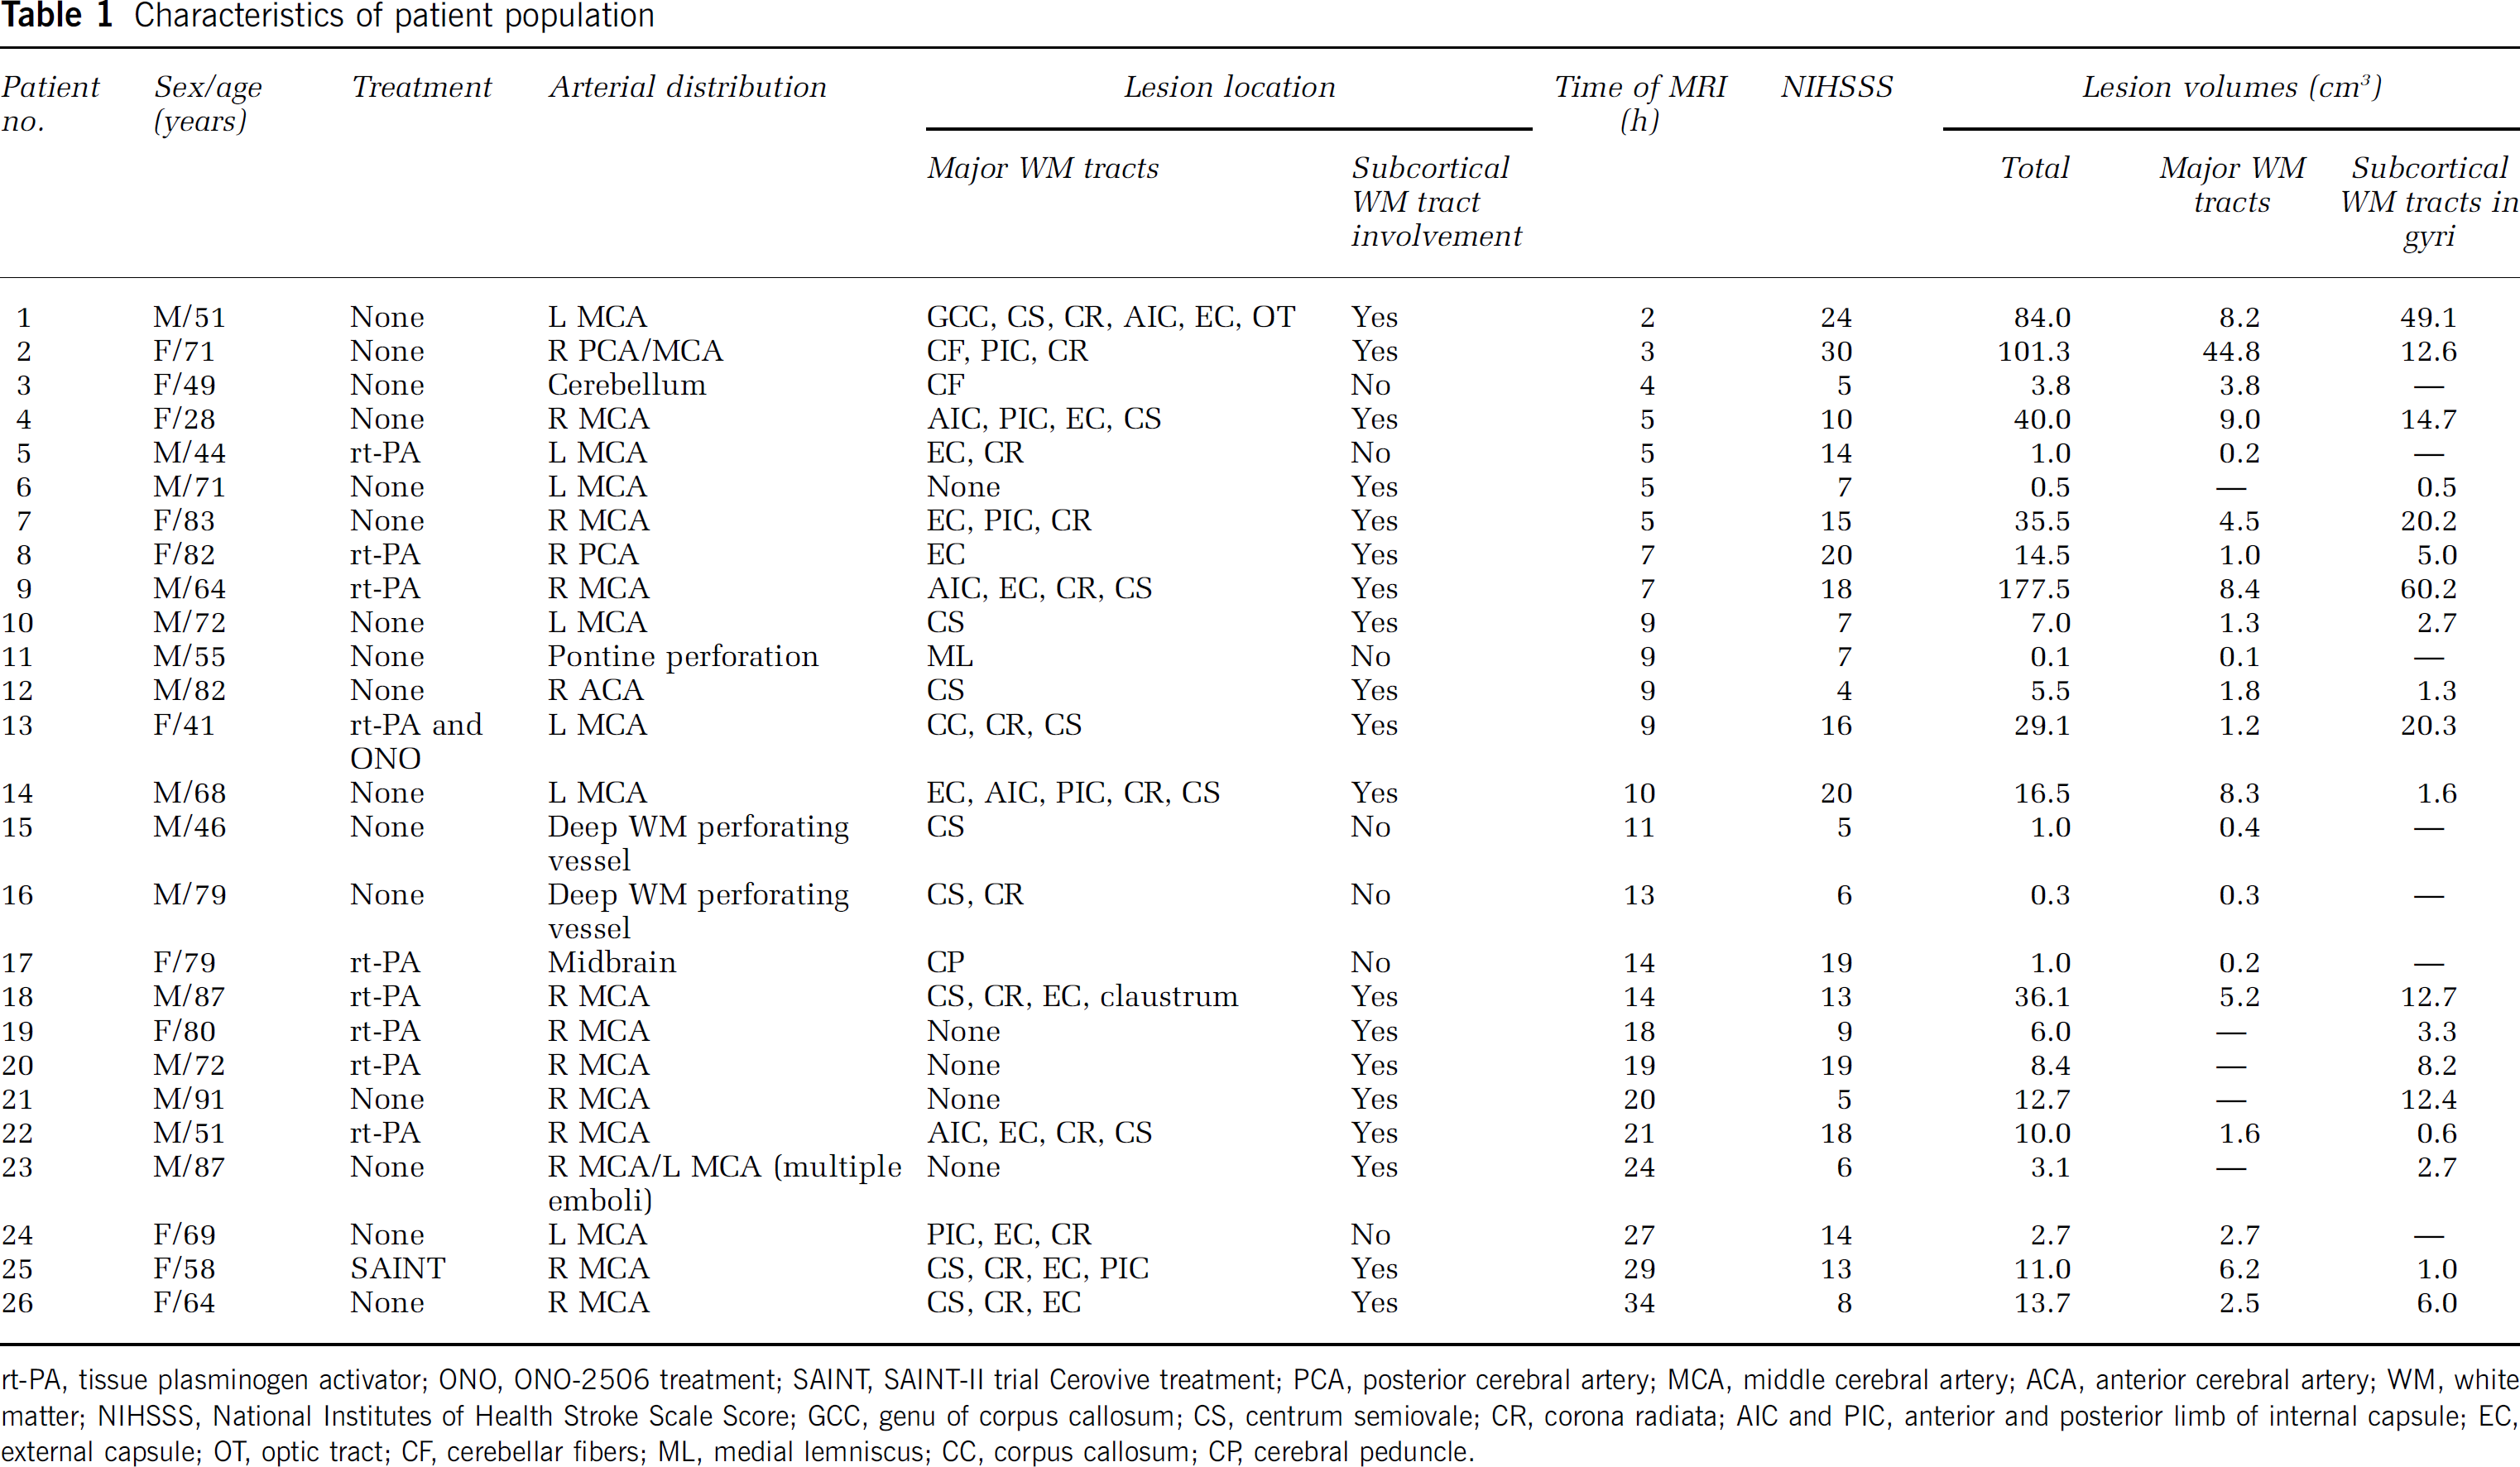
rt-PA, tissue plasminogen activator; ONO, ONO-2506 treatment; SAINT, SAINT-II trial Cerovive treatment; PCA, posterior cerebral artery; MCA, middle cerebral artery; ACA, anterior cerebral artery; WM, white matter; NIHSSS, National Institutes of Health Stroke Scale Score; GCC, genu of corpus callosum; CS, centrum semiovale; CR, corona radiata; AIC and PIC, anterior and posterior limb of internal capsule; EC, external capsule; OT, optic tract; CF, cerebellar fibers; ML, medial lemniscus; CC, corpus callosum; CP, cerebral peduncle.
Magnetic Resonance Imaging Acquisition and Postprocessing
Diffusion tensor imaging was part of a 20-min stroke protocol performed on a 1.5 T Sonata scanner (Siemens Medical Systems, Erlangen, Germany). Single-shot diffusion-wt, twice-refocused spin-echo echo planar imaging (EPI) was used for DTI with: TR/TE/NEX = 3.2 sec/88 ms/8, 96 × 128 matrix zero-filled to 256 × 256, 22 cm field of view (FOV), 6/8 phase partial Fourier, and twenty 5-mm-thick contiguous axial slices aligned with the anterior and posterior commissures, b = 0 sec/mm2 and six sets with b = 1000 sec/mm2. Additionally, an inversion recovery, spin-echo EPI set of images (EPI-GMWM) that has excellent GM/WM contrast (Wolansky et al, 1999) was also acquired to assist with ROI placement in the WM (TR/TE/TI/NEX = 5.5 sec/57 ms/200 ms/4, and an identical matrix, FOV, and slice coverage as DTI). The acquisition time was 3 min and 04 sec for DTI and 57 sec for EPI-GMWM. Raw data were postprocessed off-line to yield maps of the eigenvalues λ1, λ2, and λ3, Trace/3 ADC, and FA using MRVision (Winchester, MA, USA). The eigenvalues yield directional ADC values along the length of the fiber tracts or perpendicular to them (λ2, λ3) and FA is a parameter highlighting deviations from isotropic diffusion and ranges from 0 for perfect isotropic diffusion to 1 for highly anisotropic diffusion.
Regions of Interest Analysis
Discrete WM regions within the acute ischemic lesion (defined by > 30% drop in Trace/3 ADC relative (r) to the contralateral side) were traced using a free-hand ROI with the aid of the EPI-GMWM images and FA maps. A semiautomated procedure was used to threshold the ADC maps and all ROI traces were crossreferenced with b = 0 sec/mm2 images to avoid inclusion of obviously visible cerebrospinal fluid. The ROIs for all patients were rigorously drawn by the same nonmasked individual (YAB). Measurements of FA, λ1, λ2, λ3, and T2-wt signal intensity (measured on b = 0 sec/mm2 images) of the corresponding WM in the normal contralateral hemisphere were used as a reference. Individual tracts had to be measured separately given the wide range of absolute FA values in normal WM. For example, major central WM tracts such as the corpus callosum, internal capsule, etc. show an FA range of 0.41 to 0.72, whereas peripheral subcortical gyral WM areas have FA values of 0.37 to 0.42 in healthy elderly controls (Bhagat and Beaulieu, 2004). Relative (ipsilateral/contralateral) values were computed per ROI to combine data from different tracts within and between individuals. Absolute FA values even of specific tracts from different patients could not be combined because of the known variability of FA with age (28 to 91 years in our cohort) (Moseley, 2002). All slices showing the lesion were analyzed as this provides a more representative measure of the diffusion parameters than on a single slice alone. Data were separated into categories of major WM tracts and peripheral subcortical WM (in the gyri). Relative values for each ROI measurement per patient were averaged over all patients within a distinct time phase, with respect to the 2 tissue categories, to facilitate group comparisons between the hyperacute (2 to 5 h), acute (7 to 14 h), and subacute (18 to 34 h) phases of stroke. Selection of the range of times after onset for the 3 phases was arbitrary, with 6 h being the cutoff for the hyperacute group. The percentage of total ROIs showing changes in rFA were calculated per patient (also averaged over all patients per time phase), where significant increases or decreases were considered to be ± 10% of contralateral values. Intermediate values within this range were regarded as showing no relative change in FA.
Statistical Analysis
Paired t-tests were used to analyze differences between the ipsilateral and contralateral Trace/3 ADC, FA, λ1, λ2, λ3, and T2-wt signal intensity (P < 0.05). Linear regression analyses were performed with Pearson's correlation coefficient and significance level of the F-test to assess correlations between rT2-wt signal intensity versus rFA across the entire time course. Results were considered statistically significant at levels of P 0.05.
Results
In all, 14 patients had involvement of both major and subcortical (in the gyri) WM tracts, and out of the remaining 12, 7 had only major WM tracts and 5 had only subcortical gyral WM areas within the Trace/3 ADC-defined infarct (Table 1). Figure 1 displays example image sets containing EPI T2-wt (mean signal-to-noise ratio (SNR) of 92 ± 11 in normal subcortical WM on b = 0 sec/mm2 images), DWI, Trace/3 ADC, and FA images from the hyperacute (2 h) and acute (14 h) phases of stroke onset. Although regions of elevated FA are apparent, albeit subtle in the hyperacute group (see Figure 2), quantitative ROI analysis is required to investigate the FA differences within the lesion relative to the homologous contralateral WM structure.
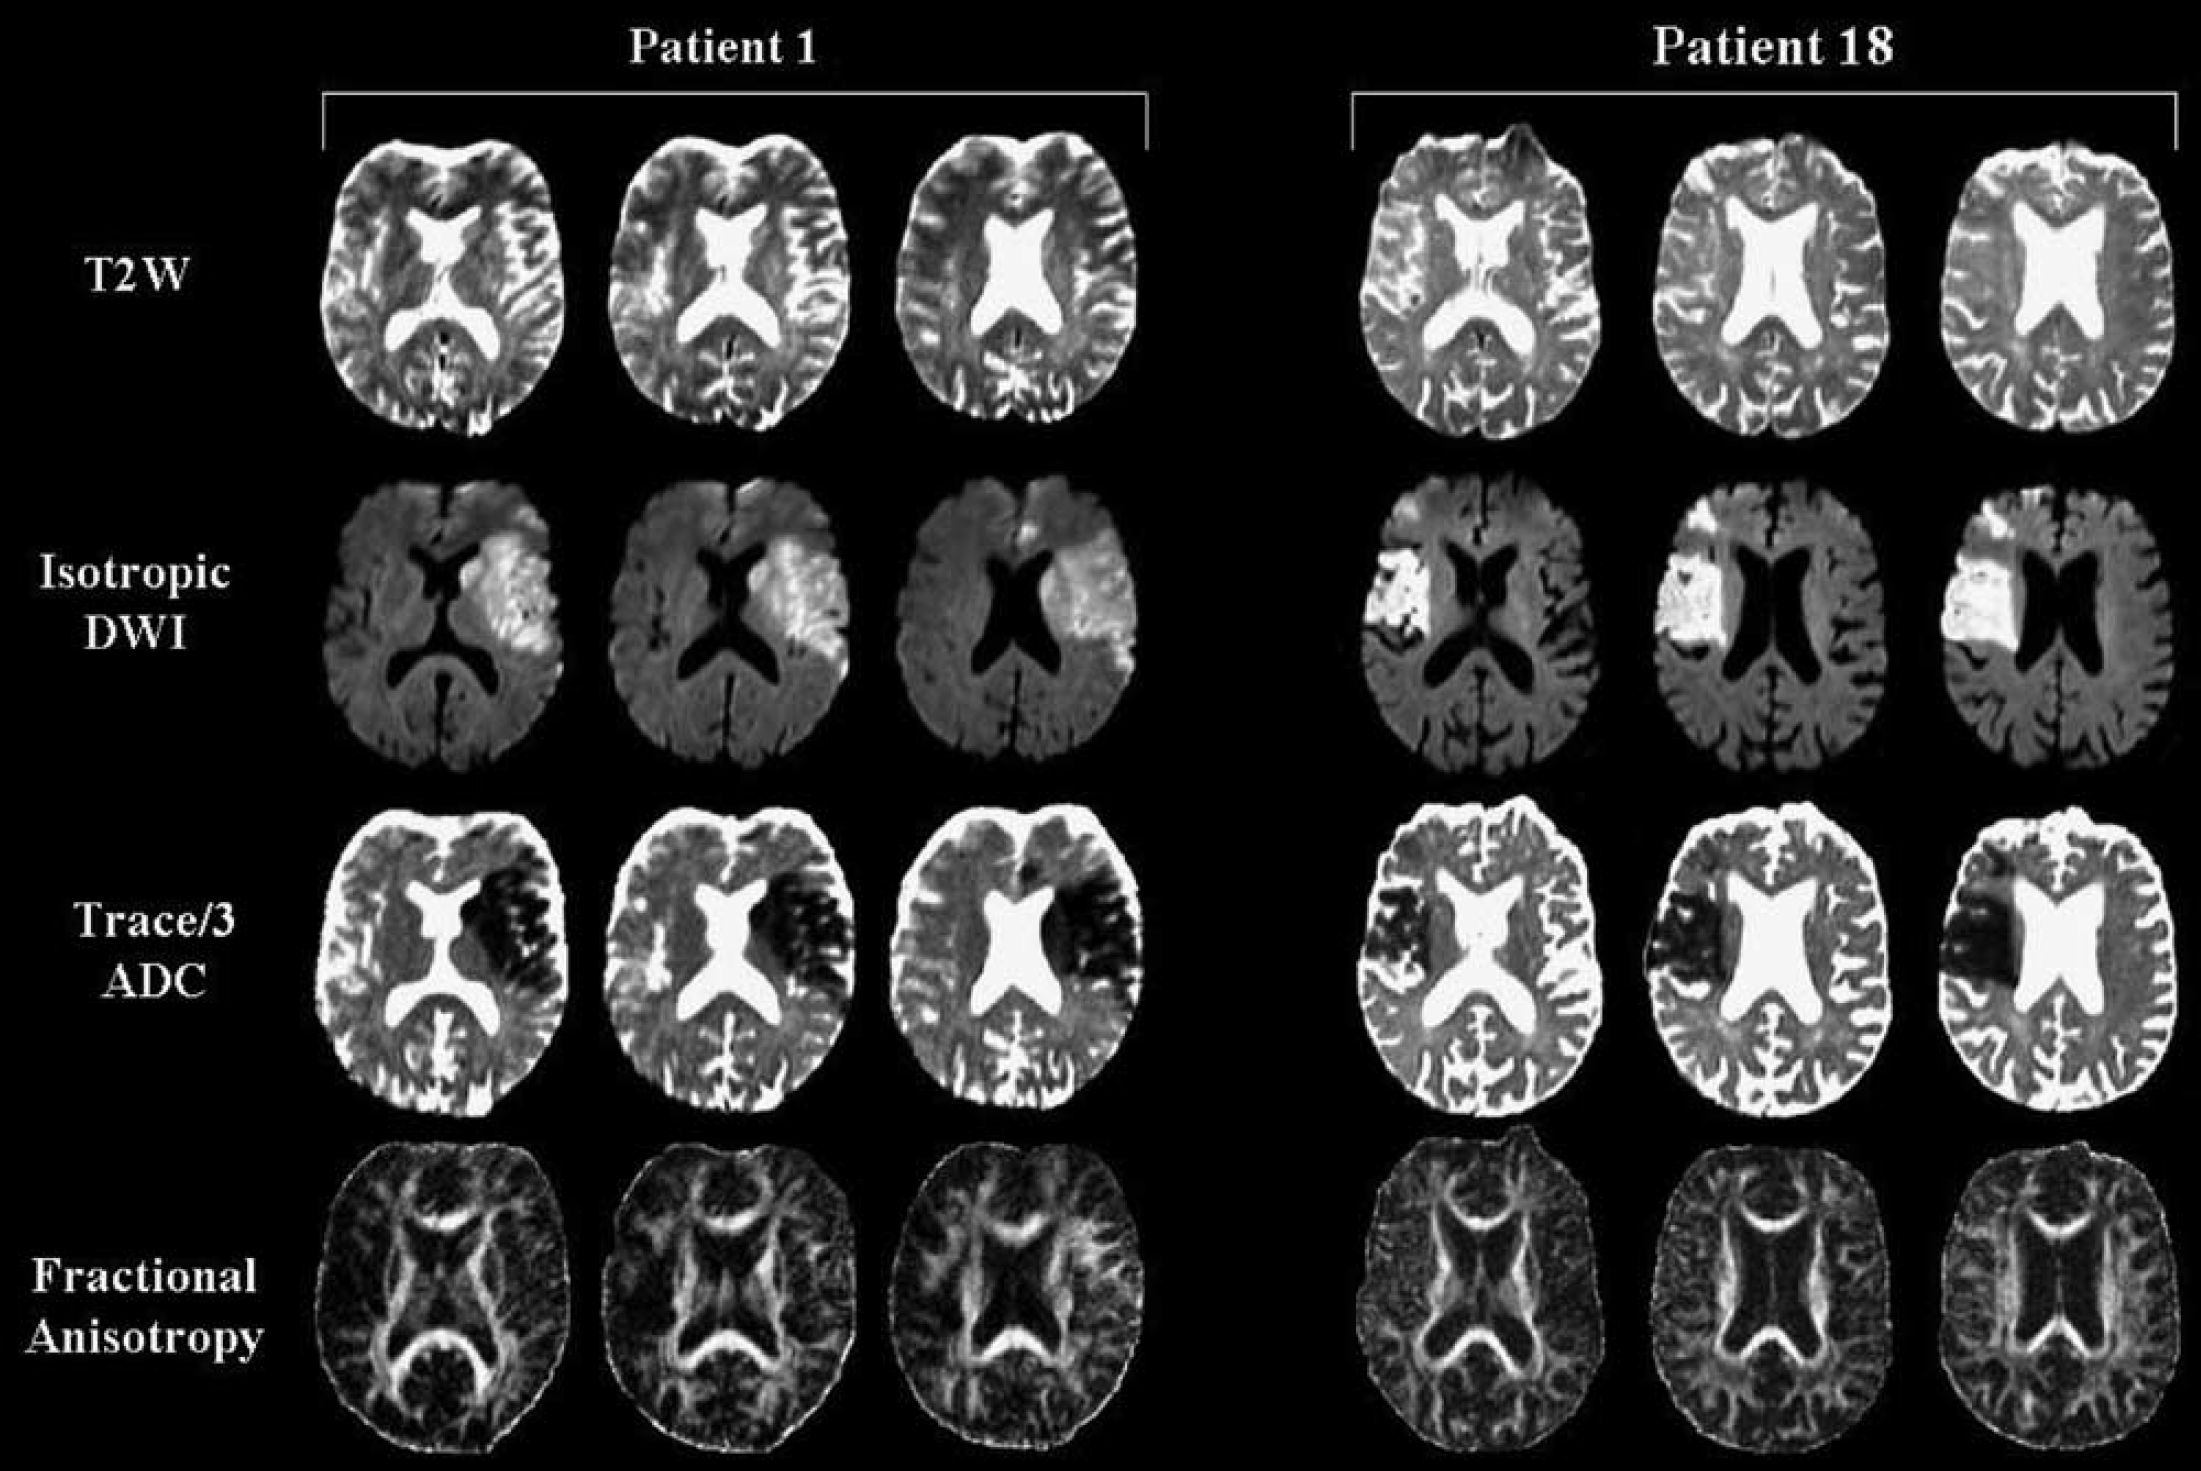
T2-weighted images (T2W; b = 0 sec/mm2), isotropic diffusion-weighted images (DWI; b = 1000 sec/mm2), Trace/3 apparent diffusion coefficient (ADC) maps, and fractional anisotropy (FA) maps from 2 patients depicting hyperacute (patient 1; 2 h postsymptom onset) and acute (patient 18; 14 h postsymptom onset) infarcts in the middle cerebral artery distribution involving major white matter (WM) tracts and subcortical WM regions (refer to Table 1). Over 19 slices in patient 1 (51-year-old male patient), 75% of the major WM regions-of-interest (ROIs) evaluated showed an increase in rFA, whereas 25% showed reductions in rFA. For subcortical WM in patient 1, 88% of the ROIs showed an increase in rFA, 3% showed reductions, and 9% remained constant. In contrast, over 11 slices in patient 18 (87-year-old male patient), 0% of the ROIs evaluated for major WM tracts revealed an increase in rFA, whereas 57% showed reductions, and 43% remained constant. For subcortical WM in patient 18, 7% of the ROIs showed increases in rFA, 64% showed decreases, and 29% remained constant.
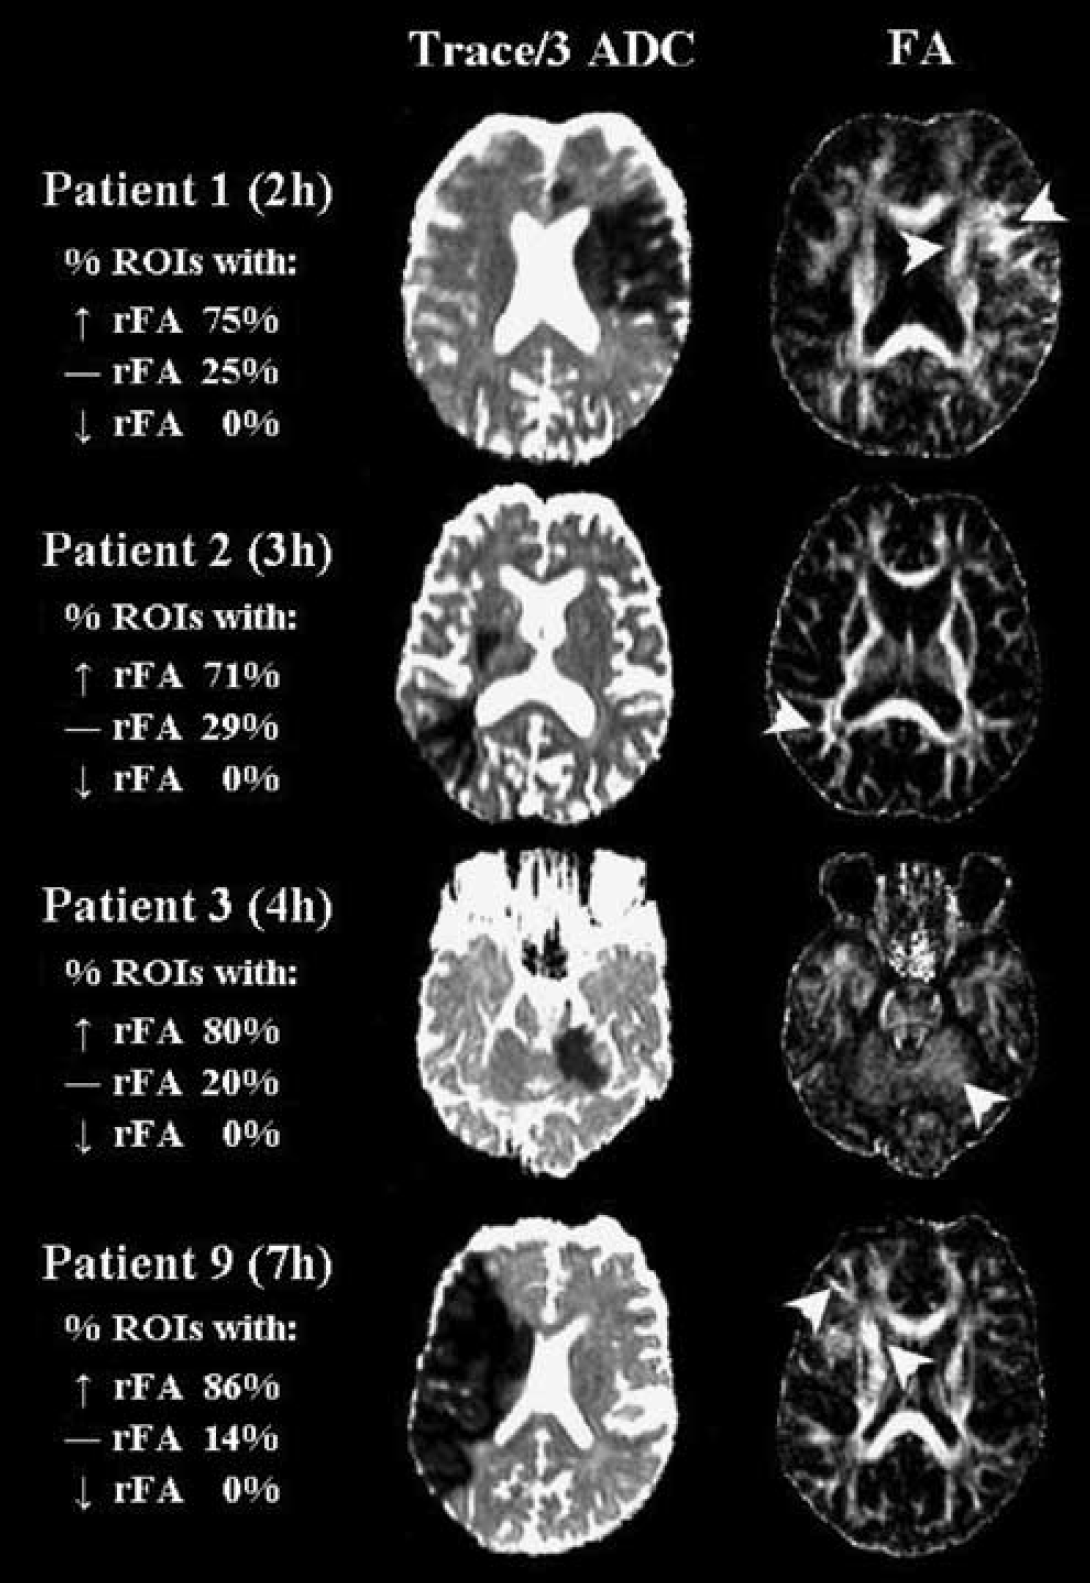
Trace/3 ADC and FA maps from four patients with elevated relative (r) FA values in major white matter tracts ≤ 7 h postsymptom onset. The arrowheads point to regions within the ischemic core where FA values were greater than those on the normal contralateral side. The percentage of regions of interest (ROIs) with increased (↑), decreased (↓), or constant (―) rFA values are listed for major white matter (WM) tract lesions only. The mean rFA values were 1.19 ± 0.18 (patient 1), 1.14 ± 0.10 (patient 2), 1.25 ± 0.27 (patient 3), and 1.24 ± 0.09 (patient 9). Note that the contrast of the FA maps has been made extreme to visualize the elevated FA.
The absolute mean Trace/3 ADC values of the infarcts and the corresponding normal contralateral regions for major WM tracts were 0.45 ± 0.08 × 10⁻³ mm2/sec and 0.76 ± 0.07 × 10⁻³ mm/sec in the hyperacute phase, 0.46 ± 0.09 × 10⁻³ mm2/sec and 0.81 ± 0.08 × 10⁻³ mm2/sec in the acute phase, and 0.48 ± 0.10 × 10⁻³ mm2/sec and 0.78 ± 0.08 × 10⁻³ mm2/sec in the subacute phase, respectively. Similar ipsilateral and contralateral Trace/3 ADC values were observed for subcortical WM (in the gyri) as well. The absolute FA values in the normal contralateral hemisphere were 0.38 ± 0.05 for the external capsule, 0.50 ± 0.08 for the anterior limb of the internal capsule, 0.57 ± 0.06 for the posterior limb of the internal capsule, 0.50 ± 0.09 for the corona radiata, 0.42 ± 0.08 for the centrum semiovale, and 0.36 ± 0.07 for subcortical gyral WM tracts. Subsequent ipsilateral FA values from lesions are presented as relative values to these because of the different WM tracts within the ischemic lesion.
Diffusion Anisotropy in Major White Matter Tracts
The time course of relative FA (i.e., rFA, ipsilateral FA/contralateral FA) and rTrace/3 ADC changes in 21 patients with lesions involving major WM tracts is displayed in Figures 3A and B. Although Trace/3 ADC was consistently low (~40% decrease), an increase in rFA was observed in the first 3 patients between 2 and 4 h after onset. Of the 3 patients at 5 h after onset, 2 showed constant rFA values and 1 showed reduced rFA. Of the 2 patients at 7 h after onset, 1 showed elevated rFA and the other reduced rFA values; however, no elevations in mean rFA were noted in the major WM tracts of any patient after 8 h postsymptom onset (Figure 3A). Lesions showed an average rFA of 1.11 ± 0.18 (P < 0.01) during the hyperacute (2 to 5 h) phase (Figure 4A), whereas in the acute (7 to 14 h) and subacute (18 to 34 h) phases, rFA declined to 0.90 ± 0.20 (P < 0.01) and 0.88 ± 0.12 (P < 0.01), respectively. It is interesting to note that 60% of the evaluated WM ROIs in the hyperacute phase showed an increase in rFA as opposed to only 17% or 0% of the ROIs evaluated at the acute and subacute phases, respectively. Furthermore, 55% and 59% of the ROIs showed reductions in rFA at the acute (7 to 14h) and subacute (18 to 34h) phases, respectively, as opposed to only 7% at the hyperacute (2 to 5 h) time point.
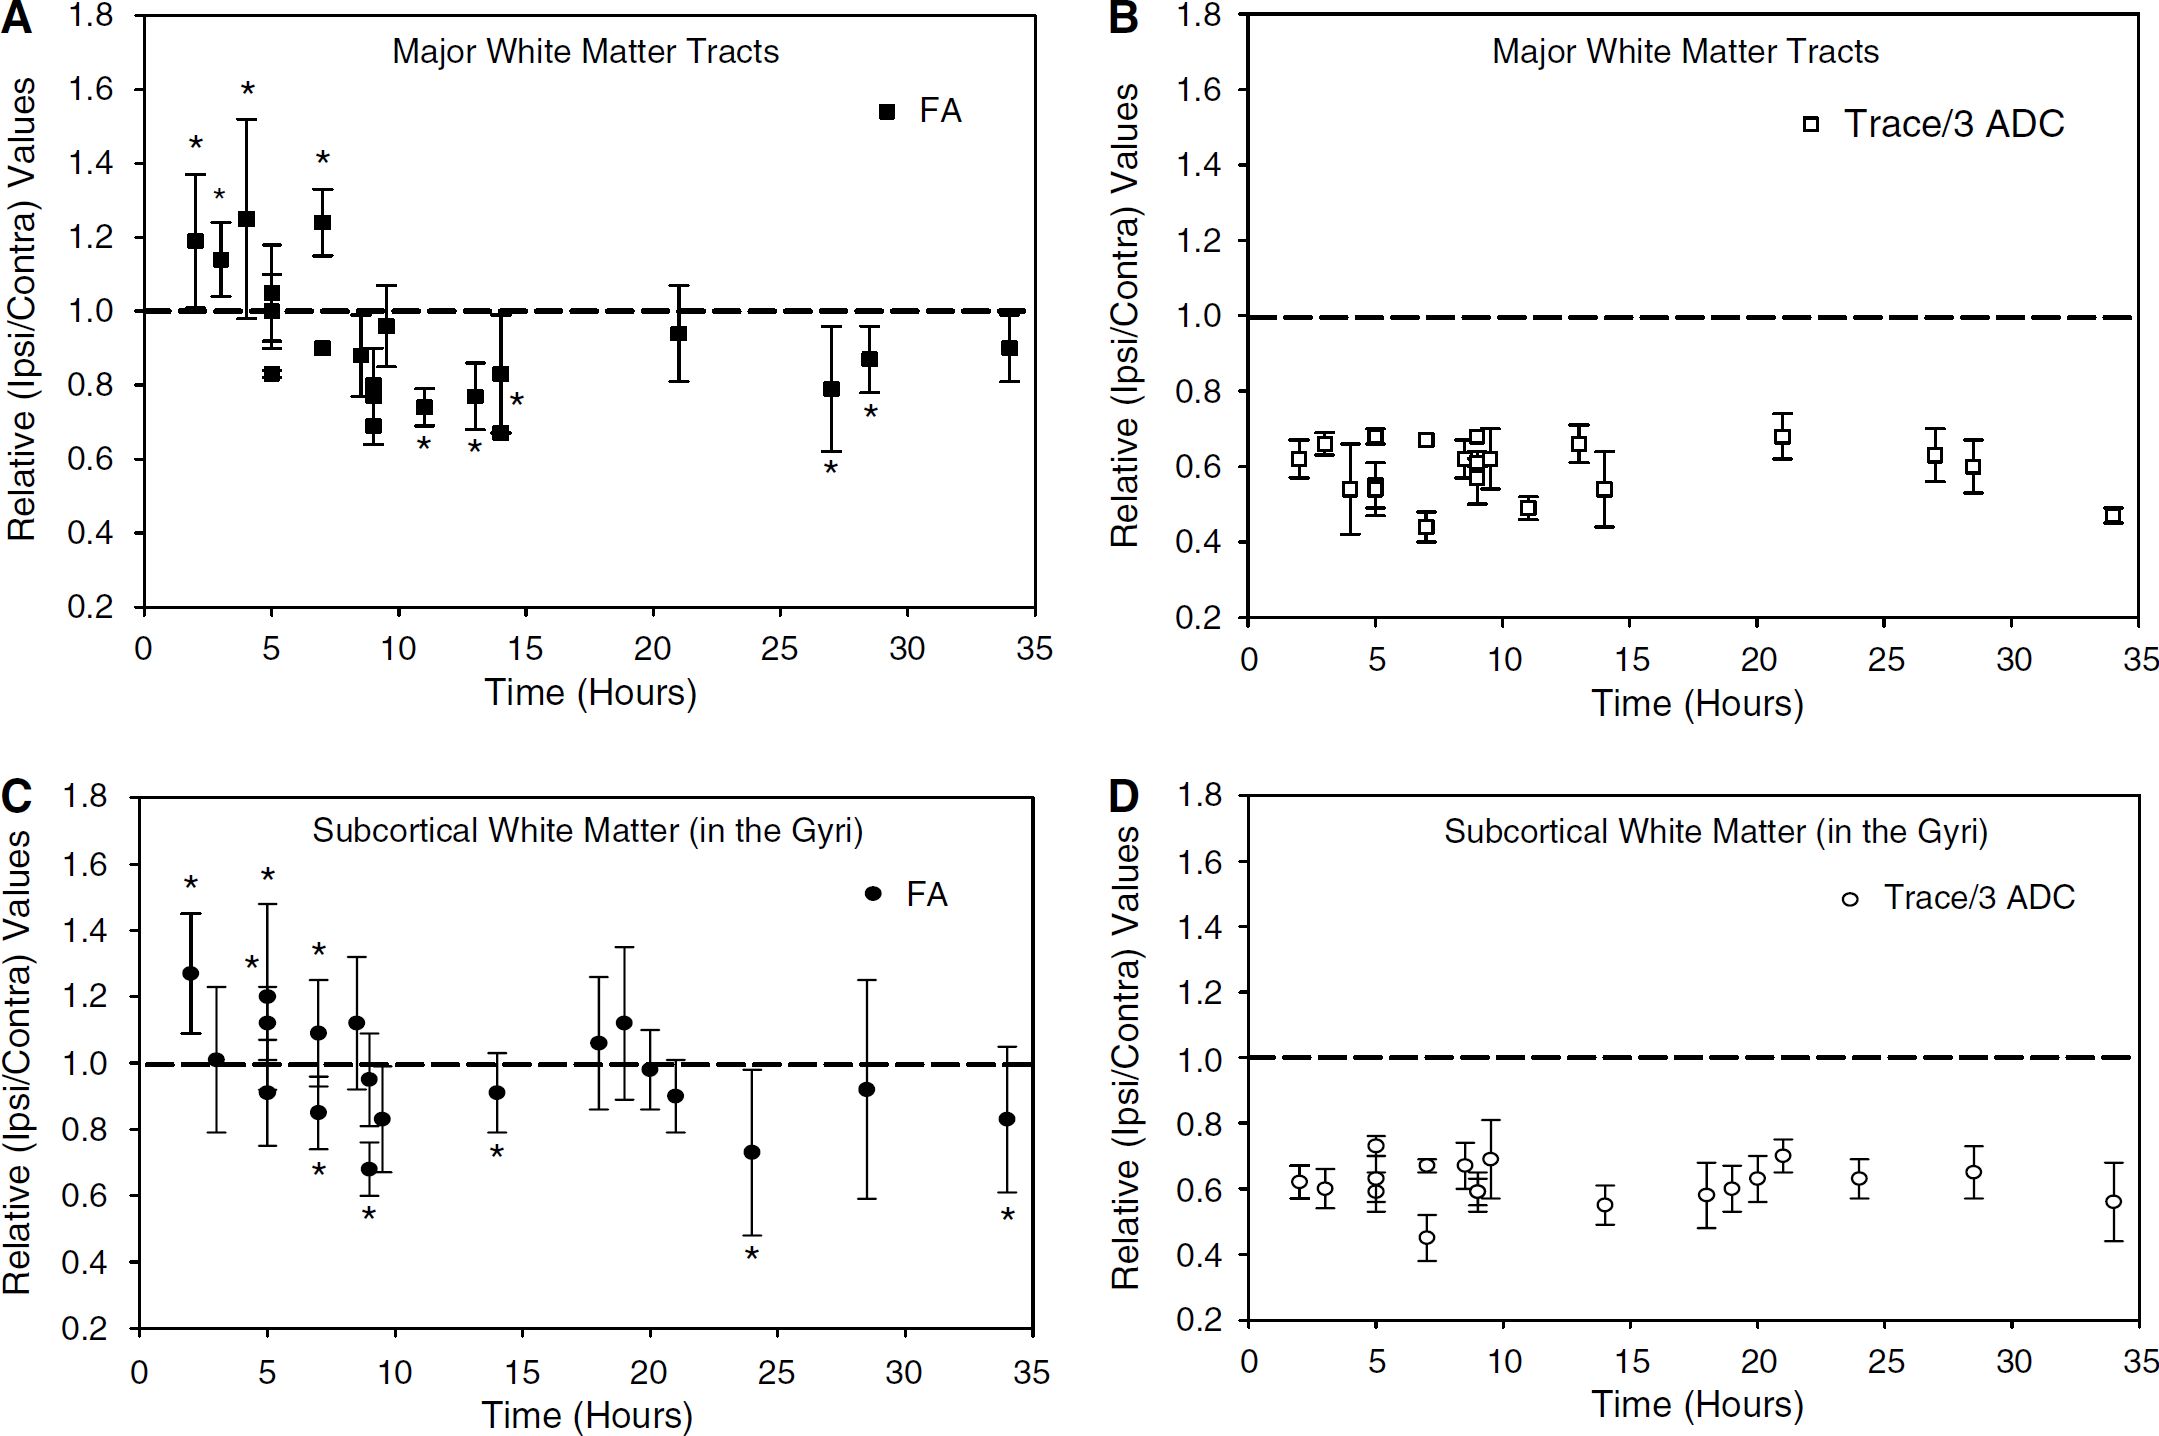
Time course of relative (r) fractional anisotropy (FA) and Trace/3 apparent diffusion coefficient (ADC) changes in (
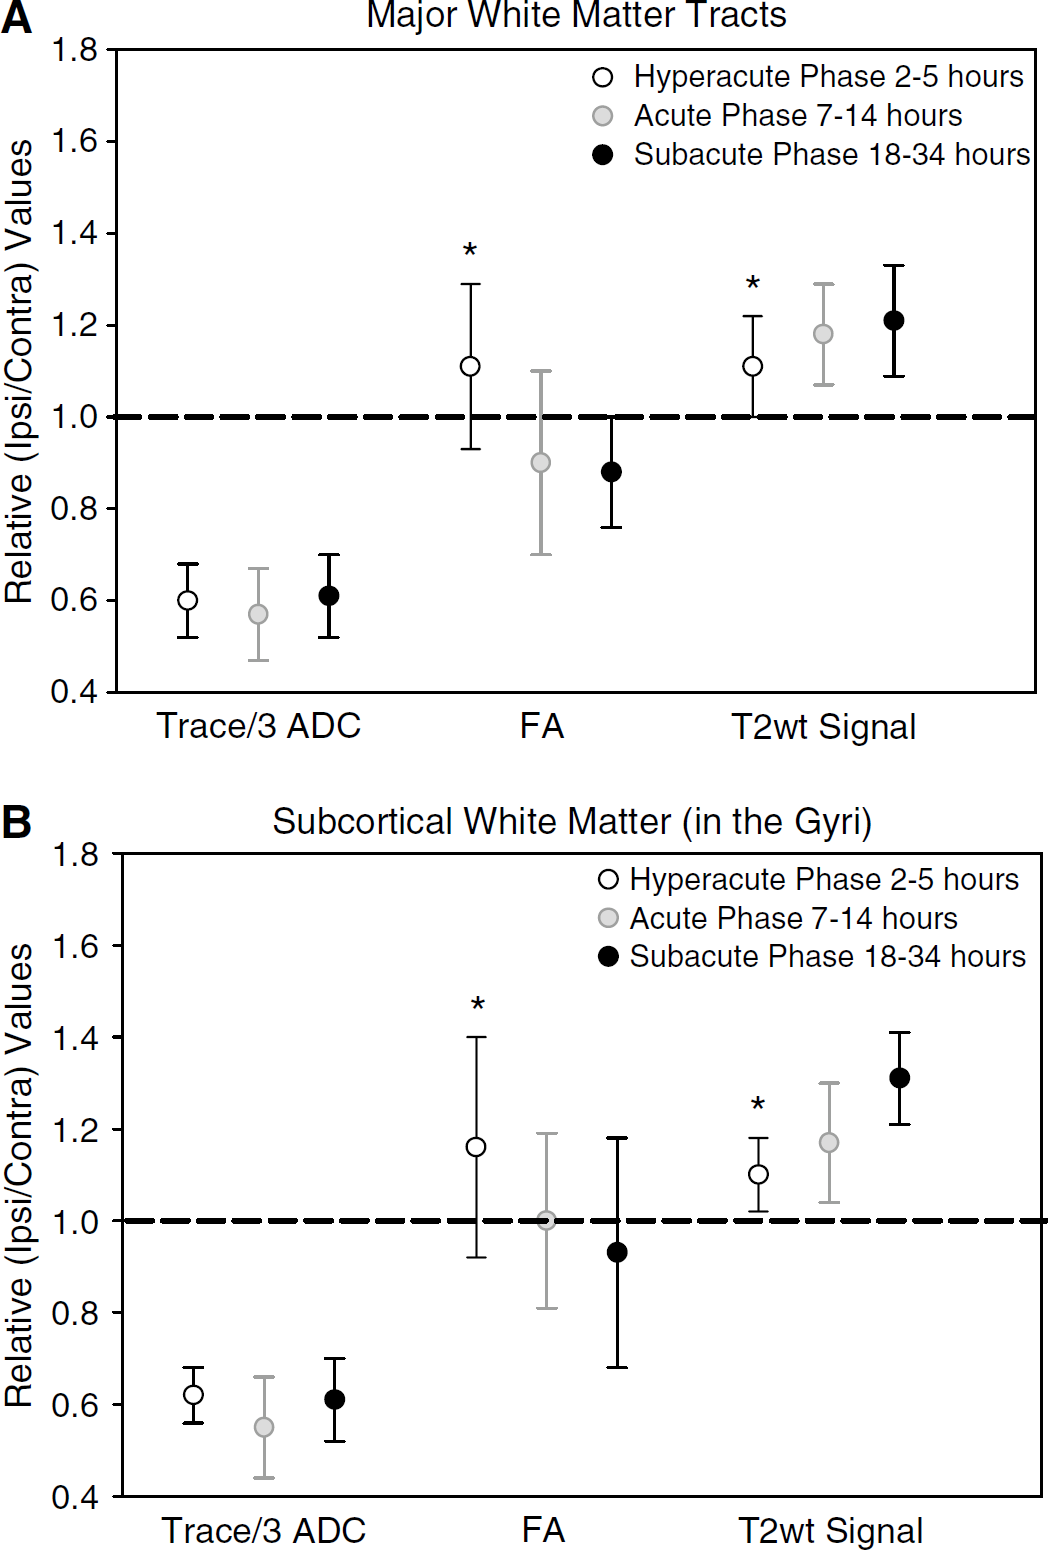
comparisons of the niean ± s.d. values (ail regions-of-interest (ROIs) measured in 26 patients) for relative (r) Trace/3 apparent diffusion coefficient (ADC), fractional anisotropy (FA) and T2-weighted signal intensity in (
Interrogation of the eigenvalues is useful to understand the basis of changes in FA since the latter is calculated from the eigenvalues. On average, in the 4 patients who showed significantly elevated FA in major WM tract lesions from 2 to 7 h after onset (Figure 3A), the relative principal (λ1), secondary (λ2), and tertiary (λ3) eigenvalues declined by 37%, 40%, and 49%, respectively (data not shown). The steeper decline of rλ3 relative to rλ1 and rλ2 (P < 0.01) accounts for the increased FA. In 13 patients showing reduced FA in major WM tracts from 9 to 34 h after onset (Figure 3A), rλ1, rλ2, and rλ3 declined by 47%, 37%, and 34%, respectively. Here, an greater reduction in rλ1 relative to rλ2, and rλ3 explains the decrease in FA. Relative rT2-wt signal intensity was also elevated by 11%, 18%, and 21% from the hyperacute to the subacute phase (P < 0.01) (Figure 4A), with an inverse correlation between mean rFA and rT2-wt signal intensity (R = −0.37, P < 0.01).
Diffusion Anisotropy in Subcortical White Matter (in the Gyri)
Trends of rFA and rTrace/3 ADC values for lesions involving subcortical WM in 19 patients are displayed in Figures 3C and D. Although Trace/3 ADC remained consistently low, rFA was elevated in 3/5 patients within 5 h postsymptom onset. A significant increase in rFA was also noted at 7 h after onset (patient 9); however, after that time point, no significant elevations were observed throughout the time course. Grouping the individual patient data in discrete time points, subcortical WM regions (with some variability) showed changes in rFA similar to major WM tracts with increases in mean rFA hyperacutely (1.16 ± 0.24, P < 0.01), and reductions subacutely (18 to 34 h; 0.93 ± 0.25, P = 0.01) (Figure 4B). The alterations in eigenvalues and correlation between rFA and rT2-wt signal intensity (R = −0.43, P < 0.01) for subcortical WM were similar to those observed for major WM tracts.
Discussion
This report details our findings on the alterations of water diffusion (Trace/3 ADC, FA, and eigenvalues) from 2 to 34 h after ischemic stroke onset in 26 patients. For major WM tracts, diffusion anisotropy was elevated in 4/8 patients ≤ 7 h after stroke onset (mean rFA = 1.20 ± 0.16 (P < 0.01) in these 4 patients) and 0/13 patients > 7h. Subcortical WM in the gyri showed similar elevated rFA findings in 4/7 patients le; 7 h (mean rFA = 1.1 ± 70.21 (P < 0.01) in these 4 patients) and 0/12 patients > 7 h. Our findings are in agreement with five human DTI studies that have reported elevations of FA less than 6 h (13% to 21% rise) (Green et al, 2002; Ozsunar et al, 2004a, b; Schaefer et al, 2003; Yang et al, 1999). However, one study had 3 patients less than 6 h with only 1 showing elevated FA (Green et al, 2002), and another acquired only 3-direction diffusion-wt images in the majority of their patients (Yang et al, 1999). Three of the aforementioned studies used an ROI analysis method that was not specific for measuring FA changes in different fractions of WM and GM within the lesion (Green et al, 2002; Ozsunar et al, 2004a; Schaefer et al, 2003), despite the large FA differences between these two tissue classes and the difficulty in matching the gray/white proportion in a contralateral ROI. Although Ozsunar et al show that 9/15 patients within 6 h show elevated FA, their ‘mixed’ tissue is evident in their low mean absolute FA value of 0.33. The other two reports employed a tissue classification scheme based on segmenting lesions as WM, GM, or mixed regions (GM and WM; Ozsunar et al, 2004b; Yang et al, 1999). However, the problem with this segmentation is that there are large variations of FA even within healthy WM. In our report, we overcame these limitations by measuring unique WM tracts separately within the lesion and in the homologous contralateral WM.
Serial human stroke studies by Zelaya et al (1999) and Munoz Maniega et al (2004) have identified a decreasing trend of FA (~8% to 54% decreases) from < 24 h to 90 days after onset. Sorensen et al (1999) focused on characterizing FA between WM and GM within 24 h after stroke, and noted a decline (14% drop) of FA in WM, as opposed to no FA change in GM, for similar decreases of ADC in both tissues. Our data agree with these previous human reports in that we note consistent FA reductions of 6% to 14% throughout the 9 to 34 h time period (Figures 3 and 4). In contrast, 2 studies have reported elevated FA at much later times, namely up to 27h (Green et al, 2002) and 96 h (Yang et al, 1999). Although averaging all the ROIs for a particular patient showed none with elevated rFA after 7 h in our study, 3% and 18% of individual ROIs from major and subcortical WM tracts showed increased FA values over their homologous contralateral ROI from 9 to 34 h. In the context of human stroke, reductions in FA are more severe at later time points of 2 days to 1 year after onset within the infarct (~40% to 70% decreases) and in regions downstream from the infarct such as the internal capsule, pons, and cerebral peduncles (~8% to 39% decreases) (Buffon et al, 2005; Pierpaoli et al, 2001; Thomalla et al, 2004, 2005; Werring et al, 2000; Zelaya et al, 1999).
Diffusion tensor imaging studies in animal models of ischemia appear to support our elevated FA results in the hyperacute phase and the reductions observed in the acute and subacute phases. Carano et al (2000) reported an acute elevation of FA in subcortical and cortical regions (~20% rise) as early as 1 h after middle cerebral artery occlusion in rats, with a progressive decline of ~25% to 40% noted by 3 h up to 5 days after stroke. In another study, Does and Gore (2000) suggested that diffusion anisotropy is slightly elevated 10 mins post mortem in the trigeminal nerve of a ‘global ischemia’ rat model. In their study, greater reductions in ADC values measured perpendicular to the nerve (26% to 31% drops) relative to ADC values measured parallel to the nerve (14% to 19% drops) accounted for the increased anisotropy. These findings are analogous to those we report for steeper reductions in rλ3 relative to rλ1 in the four patients showing elevated FA in the major WM ≤ 7 h after onset. A further restriction of water movement perpendicular to the fiber direction, and the subsequent elevations in anisotropy, could be interpreted that cellular swelling (either axons or the cells between the axons) causes both (i) more water to be restricted in the axoplasm environment and (ii) an increased extracellular tortuosity because of less spacing between the myelin fiber bundles (Sotak, 2002). A recent analytical modeling study of diffusion in WM predicted an ~29% increase in anisotropy during cytotoxic edema, which was attributed to changes in the microstructural geometrical properties of the WM; it was suggested that the degree of anisotropy is largely determined by the extraaxonal dimensions (Sen and Basser, 2005).
Although the Trace/3 ADC, indicative of cellular swelling, remains consistently low throughout our entire time span of 2 to 34 h (Figures 3 and 4), the anisotropy is not elevated but rather appears to be slightly reduced for subjects after 8 h poststroke onset. Progressive loss of diffusion anisotropy has been observed in animal models of cerebral ischemia (Carano et al, 2000) or retinal ischemia (Song et al, 2003). In this latter study, the early decrease of anisotropy was because of a reduction in parallel diffusion or 11) with preservation of perpendicular diffusion (λ1 = (λ2 + λ3)/2), whereas later, more substantial decreases of anisotropy were mainly because of increases in perpendicular diffusion. It was proposed that the parallel and perpendicular eigenvalues themselves may hold promise as specific markers of axonal and myelin injury, respectively. Along these lines, we noted greater declines in rλ1 compared with rλ2 and rλ3 in the ischemic major WM of 13 patients who showed reduced FA from 9 to 34 h after onset. These observations are similar to an earlier study where FA values were reduced < 24 h after stroke onset because of a greater decrease in λ1 compared with λ2 and λ3 in ischemic WM (Sorensen et al, 1999). Therefore, it is possible that these small reductions in λ1 and FA are reflecting early axonal injury after stroke. However, as we do not have follow-up scans on our patients, we cannot comment at this time on whether these parameters have a predictive role for ischemic tissue outcome.
The main limitations of the present study are the low number of patients early after stroke onset and the cross-sectional design, whereas serial scans would have been preferable. Although the number of patients is small, 6/9 patients within 7 h postsymptom onset showed elevated FA in ischemic lesions (defined by at least 30% reduction in Trace/3 ADC) in either major WM or subcortical WM of the gyri. In addition to our good-quality FA maps, further refinements in the image analysis relative to previously published reports yields confidence to the observation of early elevated FA in human stroke. Although free-hand ROI analysis is user-dependent, the same methods were used for all patients and the boundaries of the analysis were automated by a ≥ 30% drop in mean diffusivity. A free-hand ROI method is best suited for acquiring FA values from specific WM structures within an infarct. A semiautomated FA threshold method would not work given the range of FA values in various healthy WM tracts. Unlike Schaefer et al (2003), we did not measure FA in regions outside the ADC-defined lesions, namely in areas of perfusion-diffusion mismatch. Notably, in the 9 patients < 7 h in our study (where we note elevations in rFA), 4 showed a perfusion > diffusion mismatch (patients 1, 2, 4, and 5), 3 showed a perfusion-diffusion match (patients 6, 7, and 9), 1 showed a perfusion < diffusion mismatch, and 1 showed no perfusion abnormality (on time-to-peak) at all. Another practical limitation of our study in the era of aggressive stroke therapy is that 10 of the patients were treated with either rtPA (N = 8), a neuroprotectant (N = 1), or both (N = 1) (Table 1). We do not believe that these have had marked effects on our study as (a) the 2 neuroprotective and 5 of the rtPA patients were scanned after 7 h where no elevations in rFA are observed and the reduced rFA findings are rather consistent, and (b) of the 3 patients ≤ 7 h who had rtPA and major WM tract involvement, 2 showed constant rFA values (patient 5, perfusion > - diffusion mismatch; patient 8, no perfusion lesion) and 1 showed increased rFA (patient 9, perfusion-diffusion match). If the treatment had altered the natural progression of the lesion, it may not have changed our results much as we limited our analysis to the region with markedly reduced Trace/3 ADC.
Multiple MR parameters, including ADC, FA, T2, and perfusion maps in the study of cerebral ischemia, may hold the potential to better identify ischemic tissue and its fate. The role of anisotropy in the evaluation of acute (< 24 h) ischemic lesions is not firmly established, but FA may serve as a potential marker for classifying symptom onset in the clinical realm, especially in instances where the time of onset comes into question. The limitations of using FA for timing the onset of stroke or possibly predicting irreversible damage are that, unlike Trace/3 ADC, FA maps are nonuniform, making the visualization of acute lesions challenging, and also that changes are not apparent on FA maps unless quantitative measurements are undertaken. Although there are challenges to overcome, quantitative DTI may yet play a role in the diagnosis and prognosis of the acute stroke patient.