
Abstract
Recent studies have reported functional MRI (fMRI) activation within cerebral white matter (WM) using blood-oxygenation-level-dependent (BOLD) contrast. Many blood vessels in WM run parallel to the fibre bundles, and other studies observed dependence of susceptibility contrast-based measures of blood volume on the local orientation of the fibre bundles relative to the magnetic field or B0 axis. Motivated by this, we characterized the dependence of gradient-echo BOLD fMRI on fibre orientation (estimated by the local diffusion tensor) relative to the B0 axis to test whether the alignment between bundles and vessels imparts an orientation dependence on resting-state BOLD fluctuations in the WM. We found that the baseline signal level of the T2*-weighted data is 11% higher in voxels containing fibres parallel to B0 than those containing perpendicular fibres, consistent with a static influence of either fibre or vessel orientation on local T2* values. We also found that BOLD fluctuations in most bundles exhibit orientation effects expected from oxygenation changes, with larger amplitudes from voxels containing perpendicular fibres. Different magnitudes of this orientation effect were observed across the major WM bundles, with inferior fasciculus, corpus callosum and optic radiation exhibiting 14–19% higher fluctuations in voxels containing perpendicular compared to parallel fibres.
Keywords
Introduction
Functional MRI (fMRI) is commonly used to measure brain activity non-invasively in humans. In particular, the blood-oxygenation-level-dependent (BOLD) signal, typically measured with gradient-echo echo-planar imaging (EPI), has become the workhorse fMRI method to study human brain function and is mainly applied to the cerebral cortical grey matter (GM). However, BOLD-fMRI can be applied to measure function across almost all parts of the central nervous system, including the deep subcortical GM, the cerebral white matter (WM), the cerebellum, and the spinal cord. Because of its relevance to both neuroscientific and clinical research, interest in measuring brain function and physiology within the cerebral WM is growing, and, along with it, there has been a recent increase the number of reports applying BOLD-fMRI in the WM. Early WM-fMRI studies reported co-activation in the corpus callosum with interhemispheric transfer tasks,1–3 and more recently WM-fMRI has been applied to measure patterns of activity in the resting-state4–7 and in sleep 8 that seem to reflect the underlying anatomical organization. It is well-known that BOLD signal variations originate from dynamic changes within tissue vasculature arising from changes in blood flow, volume and oxygenation, and so because the WM exhibits a four-fold lower vascular density relative to GM, and because of the limited knowledge of metabolism and functional hyperaemia in WM, it is perhaps not surprising that reports of WM-fMRI have been viewed with some scepticism. 9
The interpretation of this patterned fMRI activation in the WM would benefit from a deeper understanding of WM vascular anatomy, however because of technical challenges with mapping the three-dimensional anatomy of WM vasculature and characterising its relationship to the surrounding tissue architecture, far less is known about WM vascular anatomy compared to that of GM. 10 The sparse number of classical anatomical studies do suggest however that the vasculature in WM is highly ordered—such that vessels are largely arranged “anisotropically” rather than “isotropically” with no preferred orientation—and that there is a strong resemblance between the layout of WM vessels and fibres. Figure 1(a) shows the WM vasculature from an ex-vivo micro-radiographic study by Salamon et al. 11 Several other studies suggest that WM vessels closely follow the course of fibre tracts in many WM regions.12,13 This can be qualitatively observed in Figure 1(b), which shows an estimate of the fibre directions from diffusion tensor imaging (DTI) data of a subject from the Human Connectome Project (HCP). Our recent in-vivo MR angiography supports this impression. 14 These anatomical observations raise questions regarding whether this parallel architecture of vessels and fibres reflects the pattern of blood flow regulation in the WM and whether individual fibre bundles possess dedicated vessels to support their metabolic demand, and how might WM vascular anatomy influence the observed patterns of WM-fMRI.
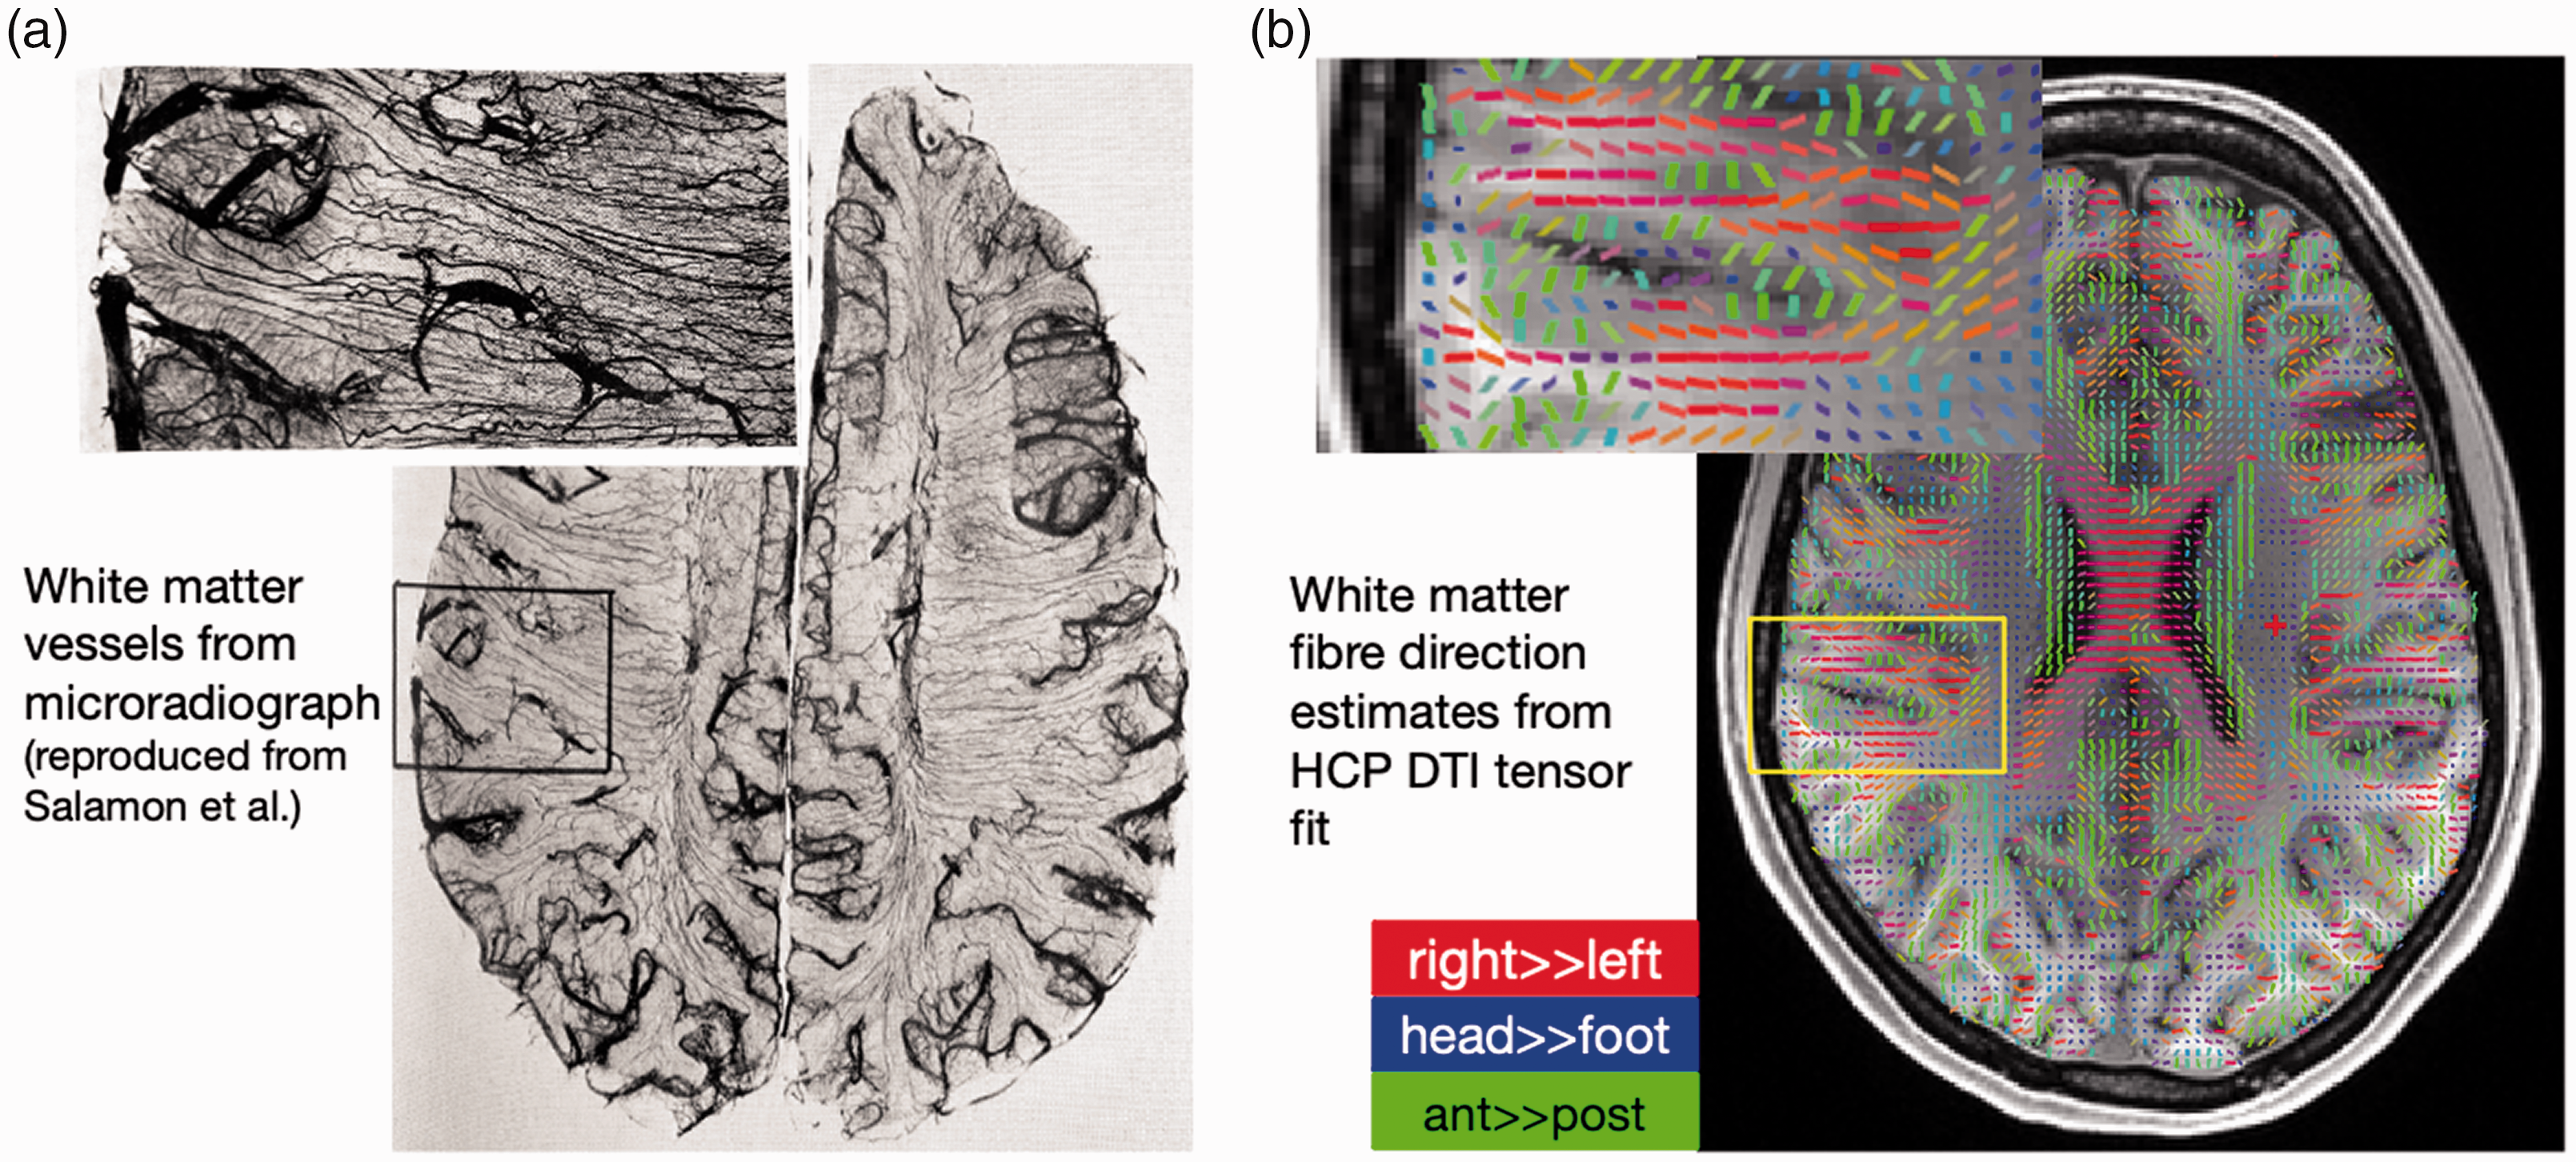
Vessels and fibre tracts exhibit congruent geometries in some regions of the WM. (a) An ex vivo microradiograph (using radio-opaque injections and X-rays), reproduced from Salamon et al. 11 suggests that macrovessels in the WM often run radial to the cortical gyri crowns and tangential to the cortical banks and (b) The principal diffusion direction, obtained from a DTI tensor fit, overlaid on a T1-weighted anatomical scan for an exemplar subject from the HCP. 39 The colours represent the directions of right-to-left (red), head-to-foot (blue) and anterior-to-posterior (green). The fibre direction estimates resemble a similar radial-central course from the gyri towards the brain centre as the WM vasculature in the microradiograph in panel a.
This conspicuous vascular anatomy may indeed shape patterns of the BOLD signal because BOLD arises from susceptibility effects that depend on the orientation of the corresponding blood vessels. Mainly because of the paramagnetic deoxy-haemoglobin in the blood, blood vessels perturb their local magnetic field environment, and this perturbation depends on the orientation of the blood vessel relative to the main magnetic B0-field axis.15–18 This orientation effect of blood vessels manifests as an observable orientation effect in BOLD-fMRI. For example, the largest veins of cortical GM are pial veins, which dominate the gradient-echo BOLD-fMRI signal at field strengths ≥3T, 19 and because the pial vessels run tangentially along the pial surface, this strict anatomical coupling between blood vessel and tissue geometry causes the local BOLD-fMRI signal amplitude to be dependent on the local cortical orientation relative to B0.
Orientation effects in BOLD measured within the cortical GM were first demonstrated using a hypercapnic (i.e. vasodilatory) task, 20 and later shown to also influence resting-state BOLD fluctuations. 21 Recent empirical evidence suggests that similar B0 orientation effects in BOLD should be observed in the WM as well, in this case because of the coupling between blood vessel and tract geometry described above. If vasculature in the WM is more ordered than that of the GM, it may even exhibit stronger orientation effects. Using dynamic susceptibility contrast (DSC) imaging measured with gradient-echo EPI, Hernández-Torres et al. reported blood flow and volume estimates varying up to 130% with the local orientation of the WM fibre tracts inferred from DTI data. 22 Kaczmarz et al. also demonstrated a similar relationship between WM fibre orientation and estimated blood volume, about 37%, again based on gradient-echo DSC data, although they used somewhat smaller voxel sizes and lower contrast agent dose. 23 Based on spin-echo-based DSC data, Doucette et al. reported a reduced effect of orientation on blood volume estimates of about 20%, 24 suggesting that at least some portion of the microvasculature that dominates spin-echo signals is also anisotropically organized in WM, and that this microvasculature is partly geometrically aligned with the WM tracts.
Motivated by this, here we tested whether the ordered anisotropy of the blood vessels and the evident geometric coupling between WM fibres and the vessels that run parallel to them also impart an orientation effect in resting-state BOLD (rs-BOLD) within WM. To understand the nature of the observed effects of local WM tract orientation on the nominally BOLD-weighted gradient-echo EPI data, we considered whether the source of the orientation effect was due to baseline or fluctuating T2* signal components based on the argument developed below. We expect that baseline T2*-weighted signals will exhibit an orientation effect from myelination aligned with the fibres and, potentially, parallel blood vessels containing deoxy-haemoglobin as well; we also tested whether changes in the T2*-weighted signal—corresponding to BOLD fluctuations in the blood compartment itself, arising from changes in flow, volume or oxygenation, associated with functional hyperaemia supporting metabolic oxygen consumption—also exhibited an observable orientation effect. We used gradient-echo BOLD-fMRI and diffusion MRI (dMRI) data acquired within the same subjects and analysed the rs-BOLD time-series data as a function of fibre orientation estimates under the assumption that in many WM regions large vessels, including veins, run parallel to the fibre tracts.
Theory
The baseline and fluctuation components of the T2*-weighted signal should exhibit opposite orientation effects as described below and as explained in Figure 2.
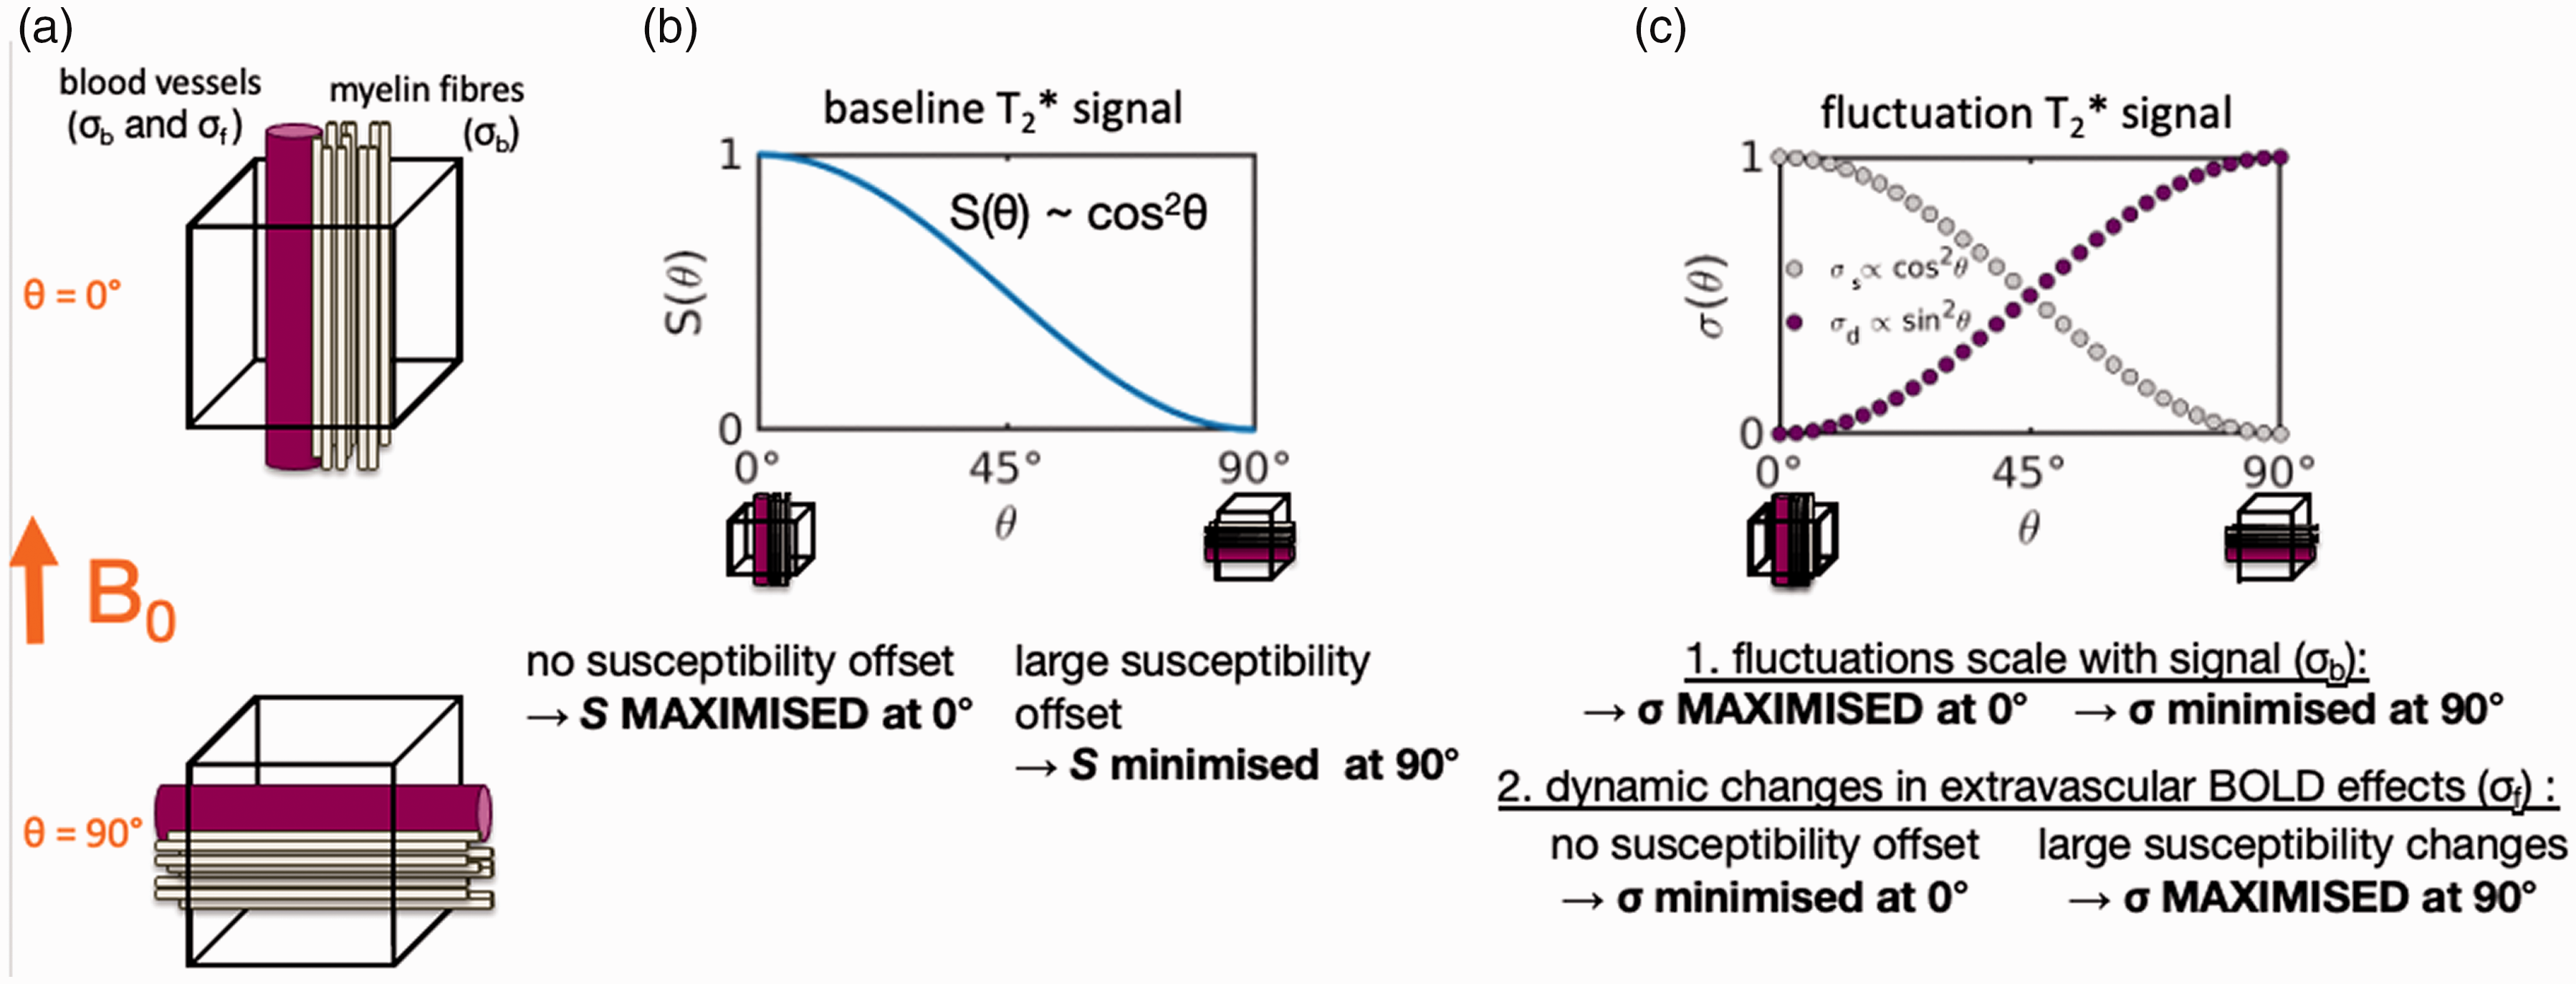
Schematic of baseline and fluctuation orientation effects. (a) The voxel model assumes that fibres (beige) and vessels (pink) run in parallel and that fibre and vessel orientation with respect to the B0-field axis is identical. (b) The orientation dependence of the static baseline signal S(θ). A voxel containing fibres and vessels running parallel to the B0 direction exhibits a higher baseline T2*-weighted signal than a voxel with fibres and vessels running perpendicular to the B0 direction, and in general the baseline signal varies with orientation θ according to cos 2 θ and (c) The orientation dependence of the temporal signal fluctuations σ(θ) (normalized to the value at σ(θ = 90°). The component of these fluctuations that scales with the baseline level, denoted as σs, exhibits the same orientation dependence as the baseline level S(θ) of cos 2 θ seen in panel B; however component of these fluctuations that is driven by dynamic changes in blood flow, volume or oxygenation, denoted as σf, exhibits an opposite orientation dependence behaviour (one that results in no T2* change in the tissue for θ = 0° and a maximum T2* change for θ = 90°) of sin 2 θ.
Baseline components
The T2* value of myelinated tissue depends on the orientation of the myelin relative to the B0 axis.25–28 Similarly, the T2* value of a voxel containing tissue and a vessel filled with blood depends on the orientation of the vessel relative to B0. While the exact effect depends on several factors—such as whether the myelinated structure or blood vessel is centred within the voxel, or perhaps outside of the voxel, the partial-volume/blood-volume fraction, the true shape of the voxel including its point-spread function and aspect ratio, and other factors 29 ,30—the changes in T2* value with orientation with all other factors held constant takes on a simple form. If we represent the angle between the axes of the vessel and the B0 field as θ, where θ represents the polar angle in a spherical coordinate system centred around the B0 axis, the baseline T2*-weighted signal level of the voxel containing the vessel, denoted S(θ), exhibits an orientation dependence that follows a cos 2 θ relationship. 31 Most conventional fMRI data are physiological-noise-dominated 32 and for these data the T2*-weighted signal changes, σb, scale positively with the baseline, i.e., σb = λ ⋅ S, where λ is a proportionality factor, as is well-known from classic studies of physiological noise33–35; if this assumption holds, then σb ∝ λ ⋅ cos 2 θ + β, where β is an offset, and so both the T2*-weighted baseline signal S and the signal change σb will both be higher for voxels that contain myelinated structures and/or vessels parallel to B0, and both will be lower for voxels that contain myelinated structures and/or vessels that are perpendicular to B0 as a consequence.
Fluctuation components
Intra- and extravascular field variations induced by changes in blood flow, volume or deoxy-haemoglobin concentration also depend on the orientation of the vessel relative to B0. Extravascular effects are thought to dominate BOLD for field strengths ≥3T 19 ; a vessel that is aligned perpendicular to B0 will exhibit a maximum extravascular field perturbation in its vicinity for a given change in blood oxygenation, whereas a vessel that is aligned parallel to B0 will induce no extravascular field offset.16,36 Hence, the dynamic fluctuations of the BOLD signal will also exhibit an orientation effect. We define σf as the fluctuation amplitude due to dynamics, which follows a sin 2 θ relationship20,21 and therefore scales in a way that is complementary to the baseline component σb defined above. This dynamic fluctuation effect is directly proportional to the orientation angle as σf ∝ sin 2 θ and thus σf vanishes for voxels containing vessels parallel to B0 with θ = 0°.
Methods
As explained above, baseline and fluctuation factors oppositely influence the T2*-weighted signal and the BOLD signal fluctuation amplitudes’ orientation dependence and manifest as a cosine-squared or a sine-squared dependency, respectively. We therefore independently characterized the orientation dependencies of the rs-fMRI time-series mean µ (i.e., baseline) and standard deviation σ (i.e., fluctuation amplitude) by measuring whether these baseline T2* or fluctuating BOLD components varied systematically as a function of local fibre orientation—under the assumption that in many WM regions blood vessels have an orientation that matches that of the local fibre tracts. Specifically, we confirmed that the baseline T2*-weighted signals, μ, vary with orientation, and characterized how the BOLD fluctuation amplitudes, σ, vary with orientation, testing whether they more closely matched the trend expected for a baseline-dominated orientation dependence given by σb ∝ cos 2 θ or a fluctuation-dominated orientation dependence given by σf ∝ sin 2 θ.
MRI data
Data were acquired using protocols approved by the Washington University institutional review board. Written informed consent was obtained from all subjects by the HCP according to the Declaration of Helsinki. A total of 110 subjects from the HCP 3T dataset (S1200, release 03/2017) were chosen at random, avoiding subjects flagged by the HCP for quality control issues.37–39 These data were acquired on a 3T system based on the Skyra (Siemens Healthineers, Erlangen, Germany) with a 32-channel head coil array; details have been published elsewhere. 39 The “unprocessed”, anonymised image data were downloaded. 40
Structural data
The anatomical reference data consisted of a T1-weighted MPRAGE of 0.7-mm isotropic nominal resolution, with matrix = 256 × 320 × 320, repetition time (TR) = 2400 ms, echo time (TE) = 2.14 ms, inversion time (TI) = 1000 ms, acceleration GRAPPA = 2 and flip-angle (FA) = 8°.
Functional data
The rs-BOLD-fMRI data consisted of four scans (two sets of opposite phase-encode directions, right-to-left and left-to-right) of gradient-echo simultaneous multi-slice (SMS) EPI with blipped CAIPI41–43 with 2-mm isotropic nominal resolution, matrix = 104 × 90, 72 slices, multi-band factor (MB)=8, no partial Fourier, no in-plane acceleration, TR = 720 ms, TE = 33.1 ms, echo spacing = 0.58 ms, readout bandwidth (BW)=2290 Hz/pixel, time points per run = 1200, total acquisition time ∼15 minutes. One single-band (i.e., MB = 1) volume was acquired in each run as a high-tissue-contrast reference for motion and distortion correction and registration to the T1-weighted structural data.
Diffusion data
Diffusion-weighted MRI data consisted of six runs of spin-echo SMS EPI. These dMRI data were acquired with three distinct sets of diffusion directions, each acquired with opposite phase-encode directions, right-to-left and left-to-right, with 1.25-mm isotropic nominal resolution, matrix = 168 × 144, 111 slices, MB = 3, partial Fourier = 6/8, TR = 5520 ms, TE = 89.5 ms, echo spacing = 0.78 ms, BW = 1488 Hz/pixel, FA = 78°; refocusing FA = 160°, b-values = [1000, 2000, 3000] s/mm2, total acquisition time ∼55 minutes.
Data pre-processing
Structural data pre-processing
The T1-weighted anatomical data were processed with the minimal pre-processing of the HCP (pipeline version 3.25.0), 44 which includes corrections for gradient non-linearities and intensity bias-fields, followed by automatic brain parcellation using FreeSurfer 45 version 5.2 which provided the WM segmentation used to define the WM mask in our fMRI and dMRI data.
Functional data pre-processing
The HCP fMRI pre-processing consists of temporal domain operations, such as detrending, and spatial operations, such as motion estimation and correction, geometric distortion correction (for both susceptibility-induced EPI distortion and gradient-nonlinearity distortion), intensity bias correction due to transmit/receive coil nonuniformities, and spatial normalization operations such as registration to atlas space. The pipeline combines all spatial transformations to perform a single one-step resampling to minimize interpolation errors. 46 We adapted the pipeline to omit the nonlinear spatial normalization and retain the fMRI data in subject-native space, because this operation rotates the head position and can change the local brain orientation, which complicates proper calculation of orientation at the time of fMRI acquisition. Rigid registration between the T1-w anatomical data and the distortion-corrected EPI reference scans was calculated with FLIRT from the FSL software package (https://fsl.fmrib.ox.ac.uk). 47 We used these transformations to align the DTI tensor fit from its native space into the native functional space corresponding to the head position and pose during each fMRI run to calculate orientation angles during the BOLD-fMRI session (see below).
After pre-processing, we calculated the temporal mean μ and temporal standard deviation σ for each fMRI voxel. No physiological noise removal was performed.
Fibre orientation estimation
We estimated fibre orientations as the angle between B0 and the primary eigenvectors of the diffusion tensor as
We then resampled the image volumes containing the fibre orientations in the diffusion image space to the rs-fMRI space using nearest-neighbour interpolation. As noted above, to account for rotations of the head between the dMRI and fMRI scans, and ensure that the orientation dependencies of the fMRI data were assessed using the orientation of each tract at the time of the fMRI data acquisition, the fibre orientation(s) at each voxel were rotated using the registration between the dMRI and fMRI data with the tool “fdt_rotate_bvecs” from FSL. We refer to the DTI-based fibre orientation estimate as θDTI and bedpostX-based fibre orientation estimates as θbX1 (primary fibre orientation), θbX2 (secondary fibre orientation) and θbX3 (tertiary fibre orientation) rotated into the native coordinate frame of the acquired fMRI data. All angles θ represent orientation as the polar angle in spherical coordinates with the scanner B0 axis as the zenith direction, which yields a more straightforward interpretation of orientation effects compared to, e.g., representing orientation using Euler angles. 23
WM and fibre bundle mask generation
For each subject we first created a binary WM mask in native space from the FreeSurfer WM parcellation derived from the MPRAGE anatomical data. We eroded the mask with two iterations of the default 3 × 3 × 3 kernel two remove an approximately two-voxel layer of boundary voxels from the mask to avoid partial volume effects with the cortical GM. To generate individual fibre bundle masks, we used the labelled streamline-density atlas of the IIT Human Brain Atlas. 50 This atlas contains 24 tract labels. We registered the atlas reference image to each subject’s fMRI reference image via the subject’s T1-weighted anatomical reference to map the atlas into subject native space. To create tract-specific masks we then binarized the streamline-density map at a low threshold of 3% of the maximum streamline density value for each tract, as recommended 50 ; note that tracts can overlap, i.e., these masks are not mutually exclusive. These masks were used for regional analysis (described below) of the fMRI data based on the DTI-based fibre orientation estimates θDTI or bedpostX-based fibre orientation estimates θbX1, θbX2 and θbX3.
Characterization of orientation effects
Our goal was to investigate the dependence of the baseline signal μ and the signal fluctuation σ on fibre orientation to B0. For each subject and within each bundle mask, we sorted μ and σ values by fibre orientation angle θ in bins of 5° width. Effects are expected to be maximised and minimised at angles 90° and 0°, respectively. Thus we normalised each distribution to the value of the bin closest to 90° (i.e., the bin at θ = 87.5 ± 2.5°). We refer to these distributions as orientation profiles μ(θ) and σ(θ). For each subject we averaged the orientation profiles of all four rs-fMRI runs. Subsequently we averaged orientation profiles over all 110 subjects. We computed these orientation profiles separately for all fibre orientation estimates θDTI, θbX1, θbX2 and θbX3 using their respective masks. Histograms of the orientations contained within each fibre mask were calculated, and are presented as Supplemental Material (Supp. Fig. S1). From the initial 24 bundle masks, 16 exhibited sufficient ranges of orientations and were retained for further analysis; the remaining 8 masks, for example the fornix, yielded orientation histograms with too few counts in several bins to adequately cover the full range from parallel to perpendicular orientations relative to B0. Fibre mask sizes ranged between an average of 801 and 2697 voxels contained within each bundle; a list of the voxel counts for all bundle masks included in our analysis is provided as Supplemental Material (Suppl. Table S1).
Within each retained fibre bundle mask, we calculated the maximum orientation bias between voxels with perpendicular and parallel orientations as Δμ = μ θ =90° − μ θ =0° for the signal baseline; and Δσ = σ θ =90° − σ θ =0° for the fluctuation amplitudes, respectively. We refer to these quantities as signed orientation signatures. Signal baseline components σb are expected to exhibit a signed orientation signature greater than zero since σb ∝ cos 2 θ, thus we refer to masks with a positive trend Δσ > 0 as “baseline-dominated”, whereas signal fluctuation components σf are expected to exhibit a signed orientation signature less than zero since σf ∝ sin 2 θ, thus we refer to masks with a negative trend Δσ < 0 as “fluctuation-dominated”. We performed this analysis using all voxels within each WM mask, and then, to test whether a stronger effect may be seen in voxels with more consistent fibre orientations, we repeated the analysis on only those voxels whose fractional anisotropy (FA) exceeded a moderate threshold (FA ≥ 0.2) and high threshold (FA ≥ 0.5) threshold. We focus however on the results from the full WM masks without FA thresholding, since these are expected to be more conservative, with potentially stronger orientation effects expected when considering higher FA thresholds.
Results
Orientation effects based on fibre direction estimates from DTI fits
Orientation effects from pooling across the entire WM
The baseline signal μ, averaged over the entire WM, exhibits a clear dependence on the local WM orientation estimated from the dMRI data. Voxels for which the dominant diffusion direction was parallel to B0 exhibited an ∼11% higher baseline T2*-weighted signal than voxels for which the dominant diffusion direction was perpendicular to B0, as shown in Figure 3(a). This baseline signal change corresponds to a change in transverse relaxation rate, ΔR2*, of 3.1 Hz between voxels in which the principal direction is parallel to or perpendicular to B0 assuming a mono-exponential signal decay, and for our TE of 33.1 ms. The signal fluctuation σ, however, averaged over the entire WM shows a mixed bias relationship, as shown in Figure 3(b), where error bars are of comparable magnitude to the effect itself.
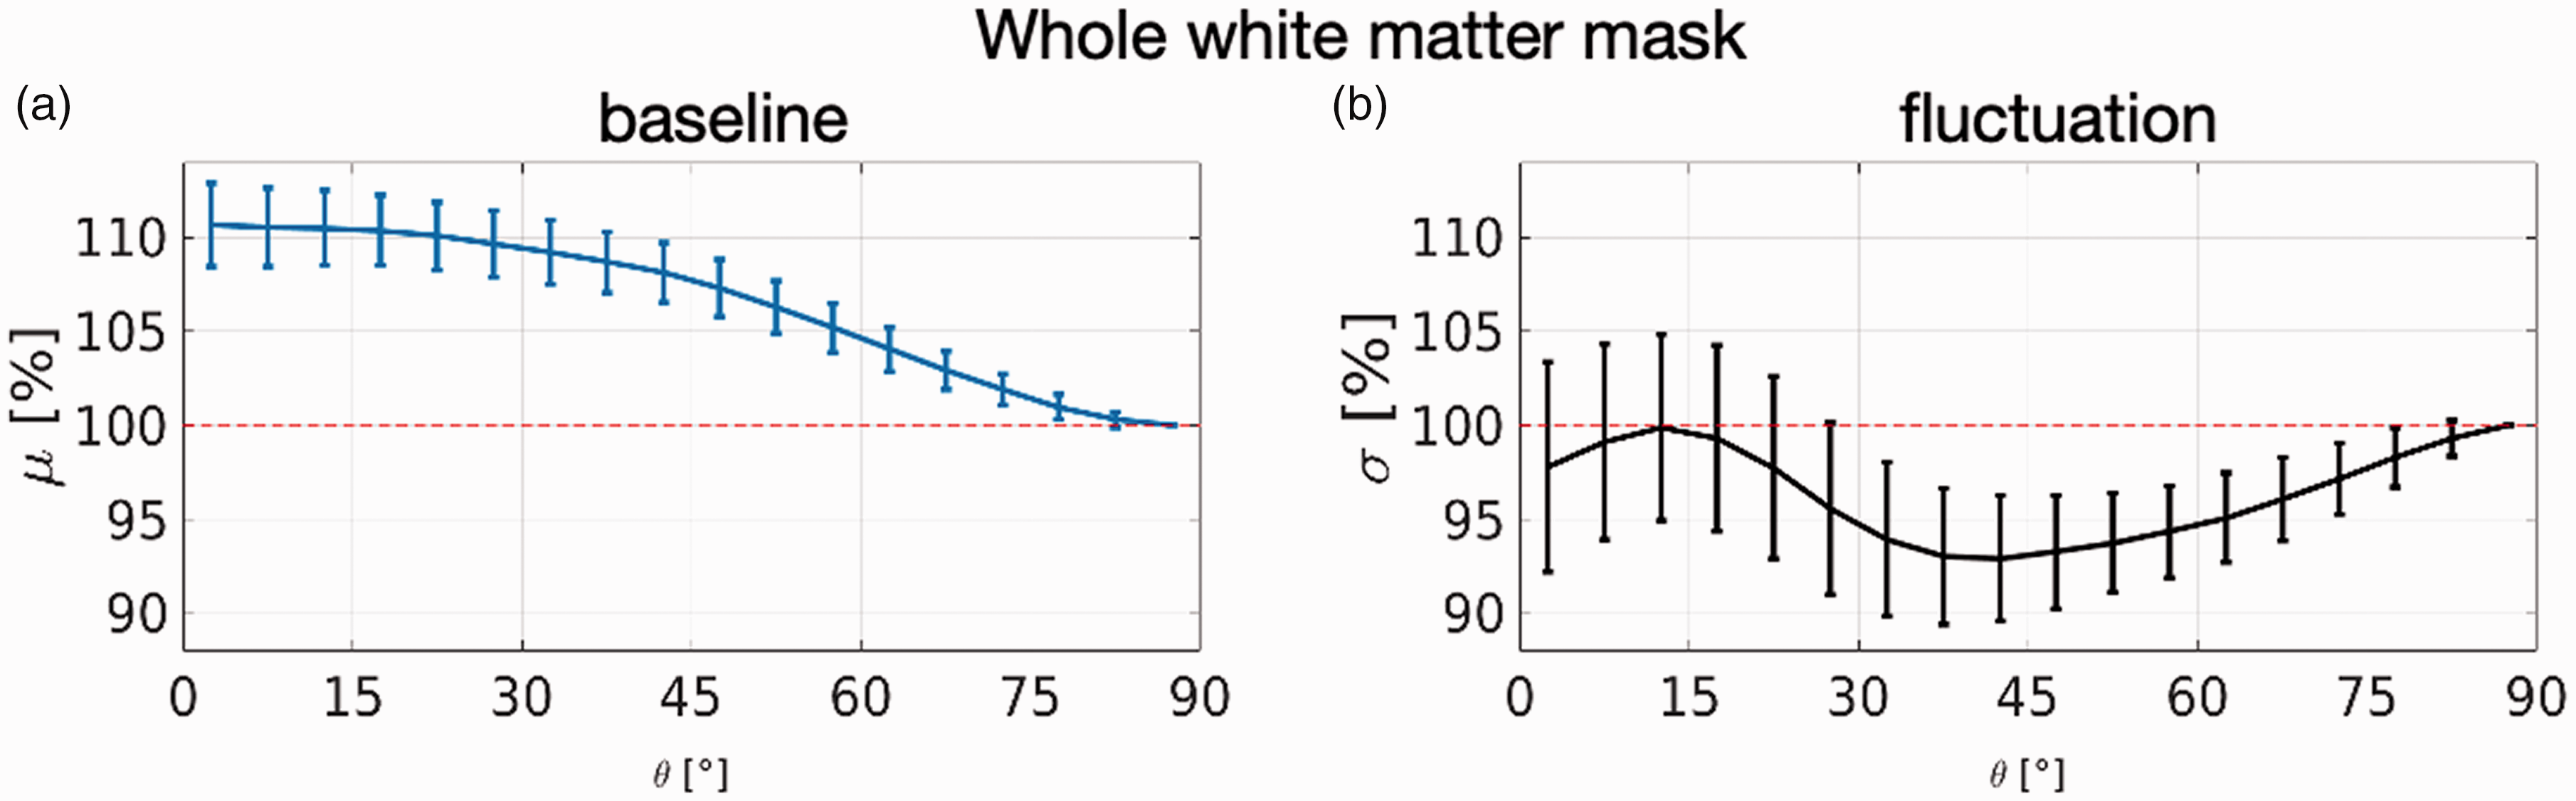
The orientation dependence of the fMRI time series within the whole WM mask and averaged over 110 subjects. Error bars are the standard deviation across subjects. Here the fibre directions are estimated from DTI fits to the dMRI data (and thus are denoted as θDTI). (a) The baseline signal as a function of the orientation of the fibre direction estimate relative to the B0 axis shows an orientation bias of about 11% between voxels that contain perpendicular and parallel fibres and (b) The fluctuation amplitude of the time series shows a bi-phasic behaviour and exhibits error bars of similar magnitude as the effect, suggesting no effect or a spatially heterogenous distribution of orientation effects.
Orientation effects observed within individual fibre bundle masks
Heterogenous orientation profiles emerge when the dynamic BOLD signal changes are plotted for individual fibre bundles. Profiles are displayed in Figures 4 and 5. All fibre bundle masks tested exhibited clear orientation effects in their baseline T2* signal μ, as expected, which matches our observations from the whole WM mask. The consistency of this observed effect suggests that all fibre bundle masks tested contained a sufficient number and range of orientations to enable detection of orientation effects in our T2*-weighted data.
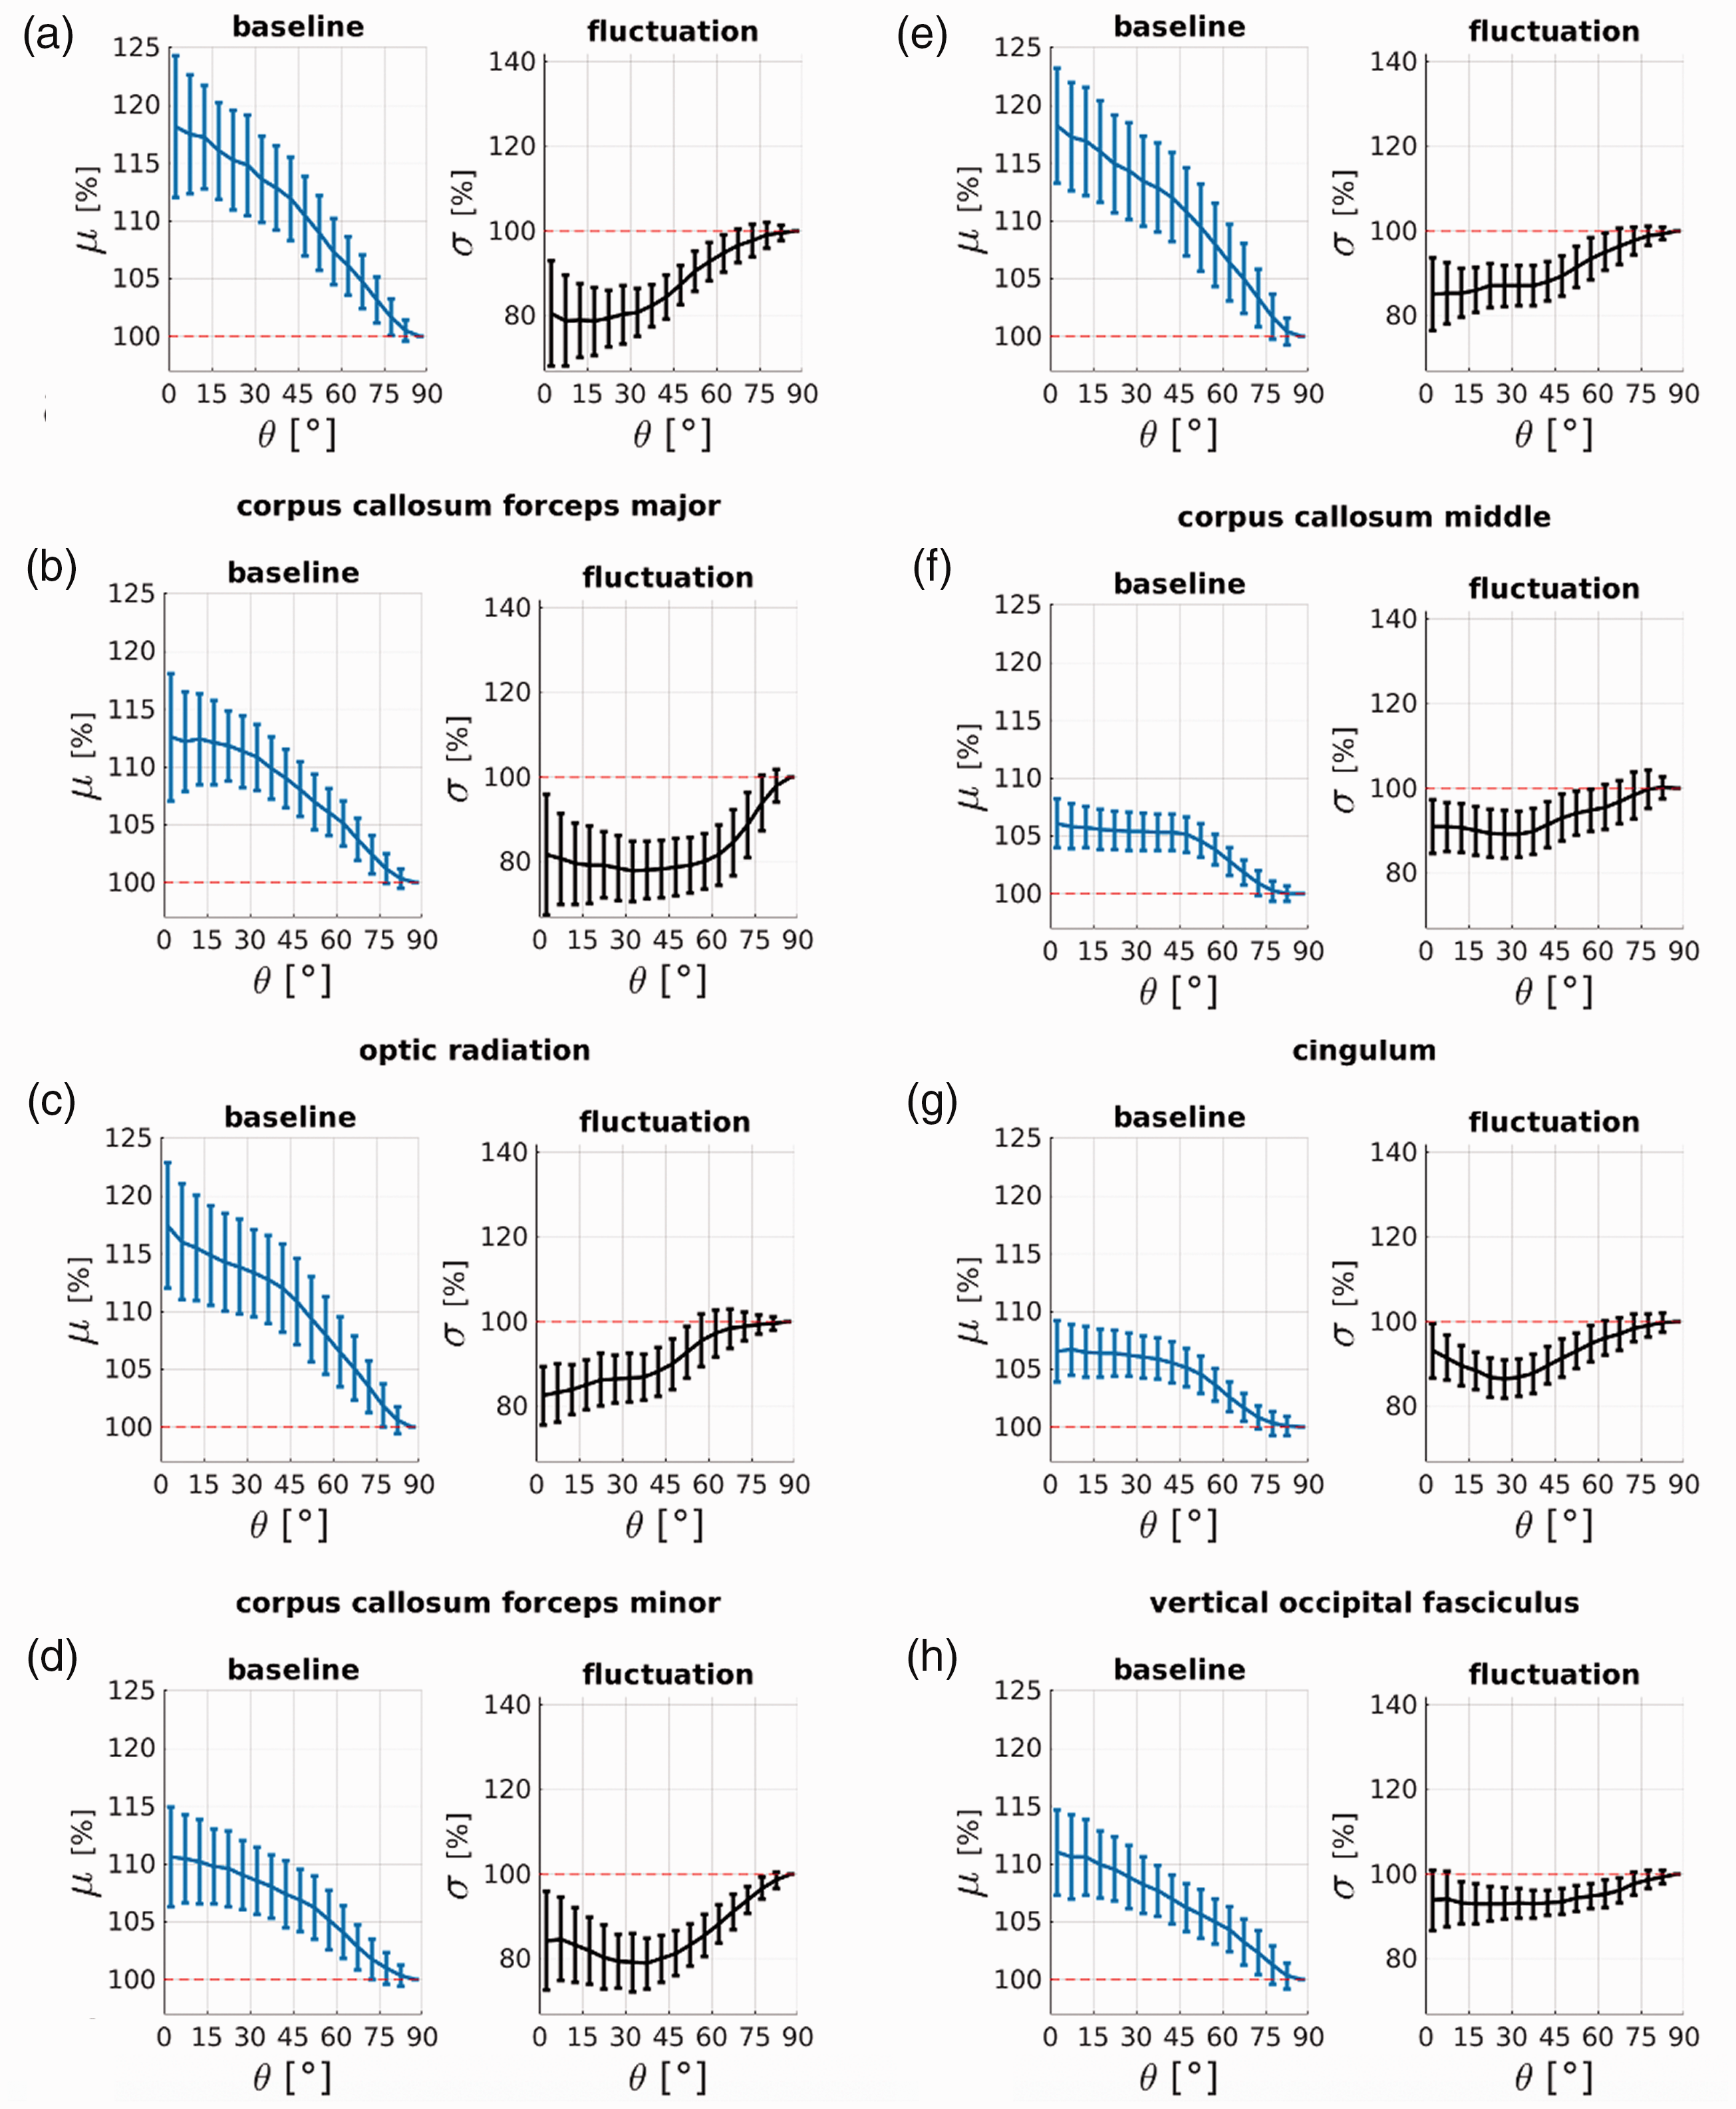
Eight (out of 16) fibre bundles exhibit negative orientation bias profiles as expected from fluctuation changes in BOLD. The profiles are averaged over 110 subjects and error bars represent the standard deviation across subjects. Orientation angles refer to the principal diffusion direction estimate from the DTI tensor fit θDTI. Blue plots are the orientation profile of the times series temporal mean μ (baseline) and black plots are the temporal standard deviation σ (fluctuation). Fibre bundles are sorted with respect to the amount of negative fluctuation bias Δσ from highest to lowest bias (a–h); exact values are in Table 1.
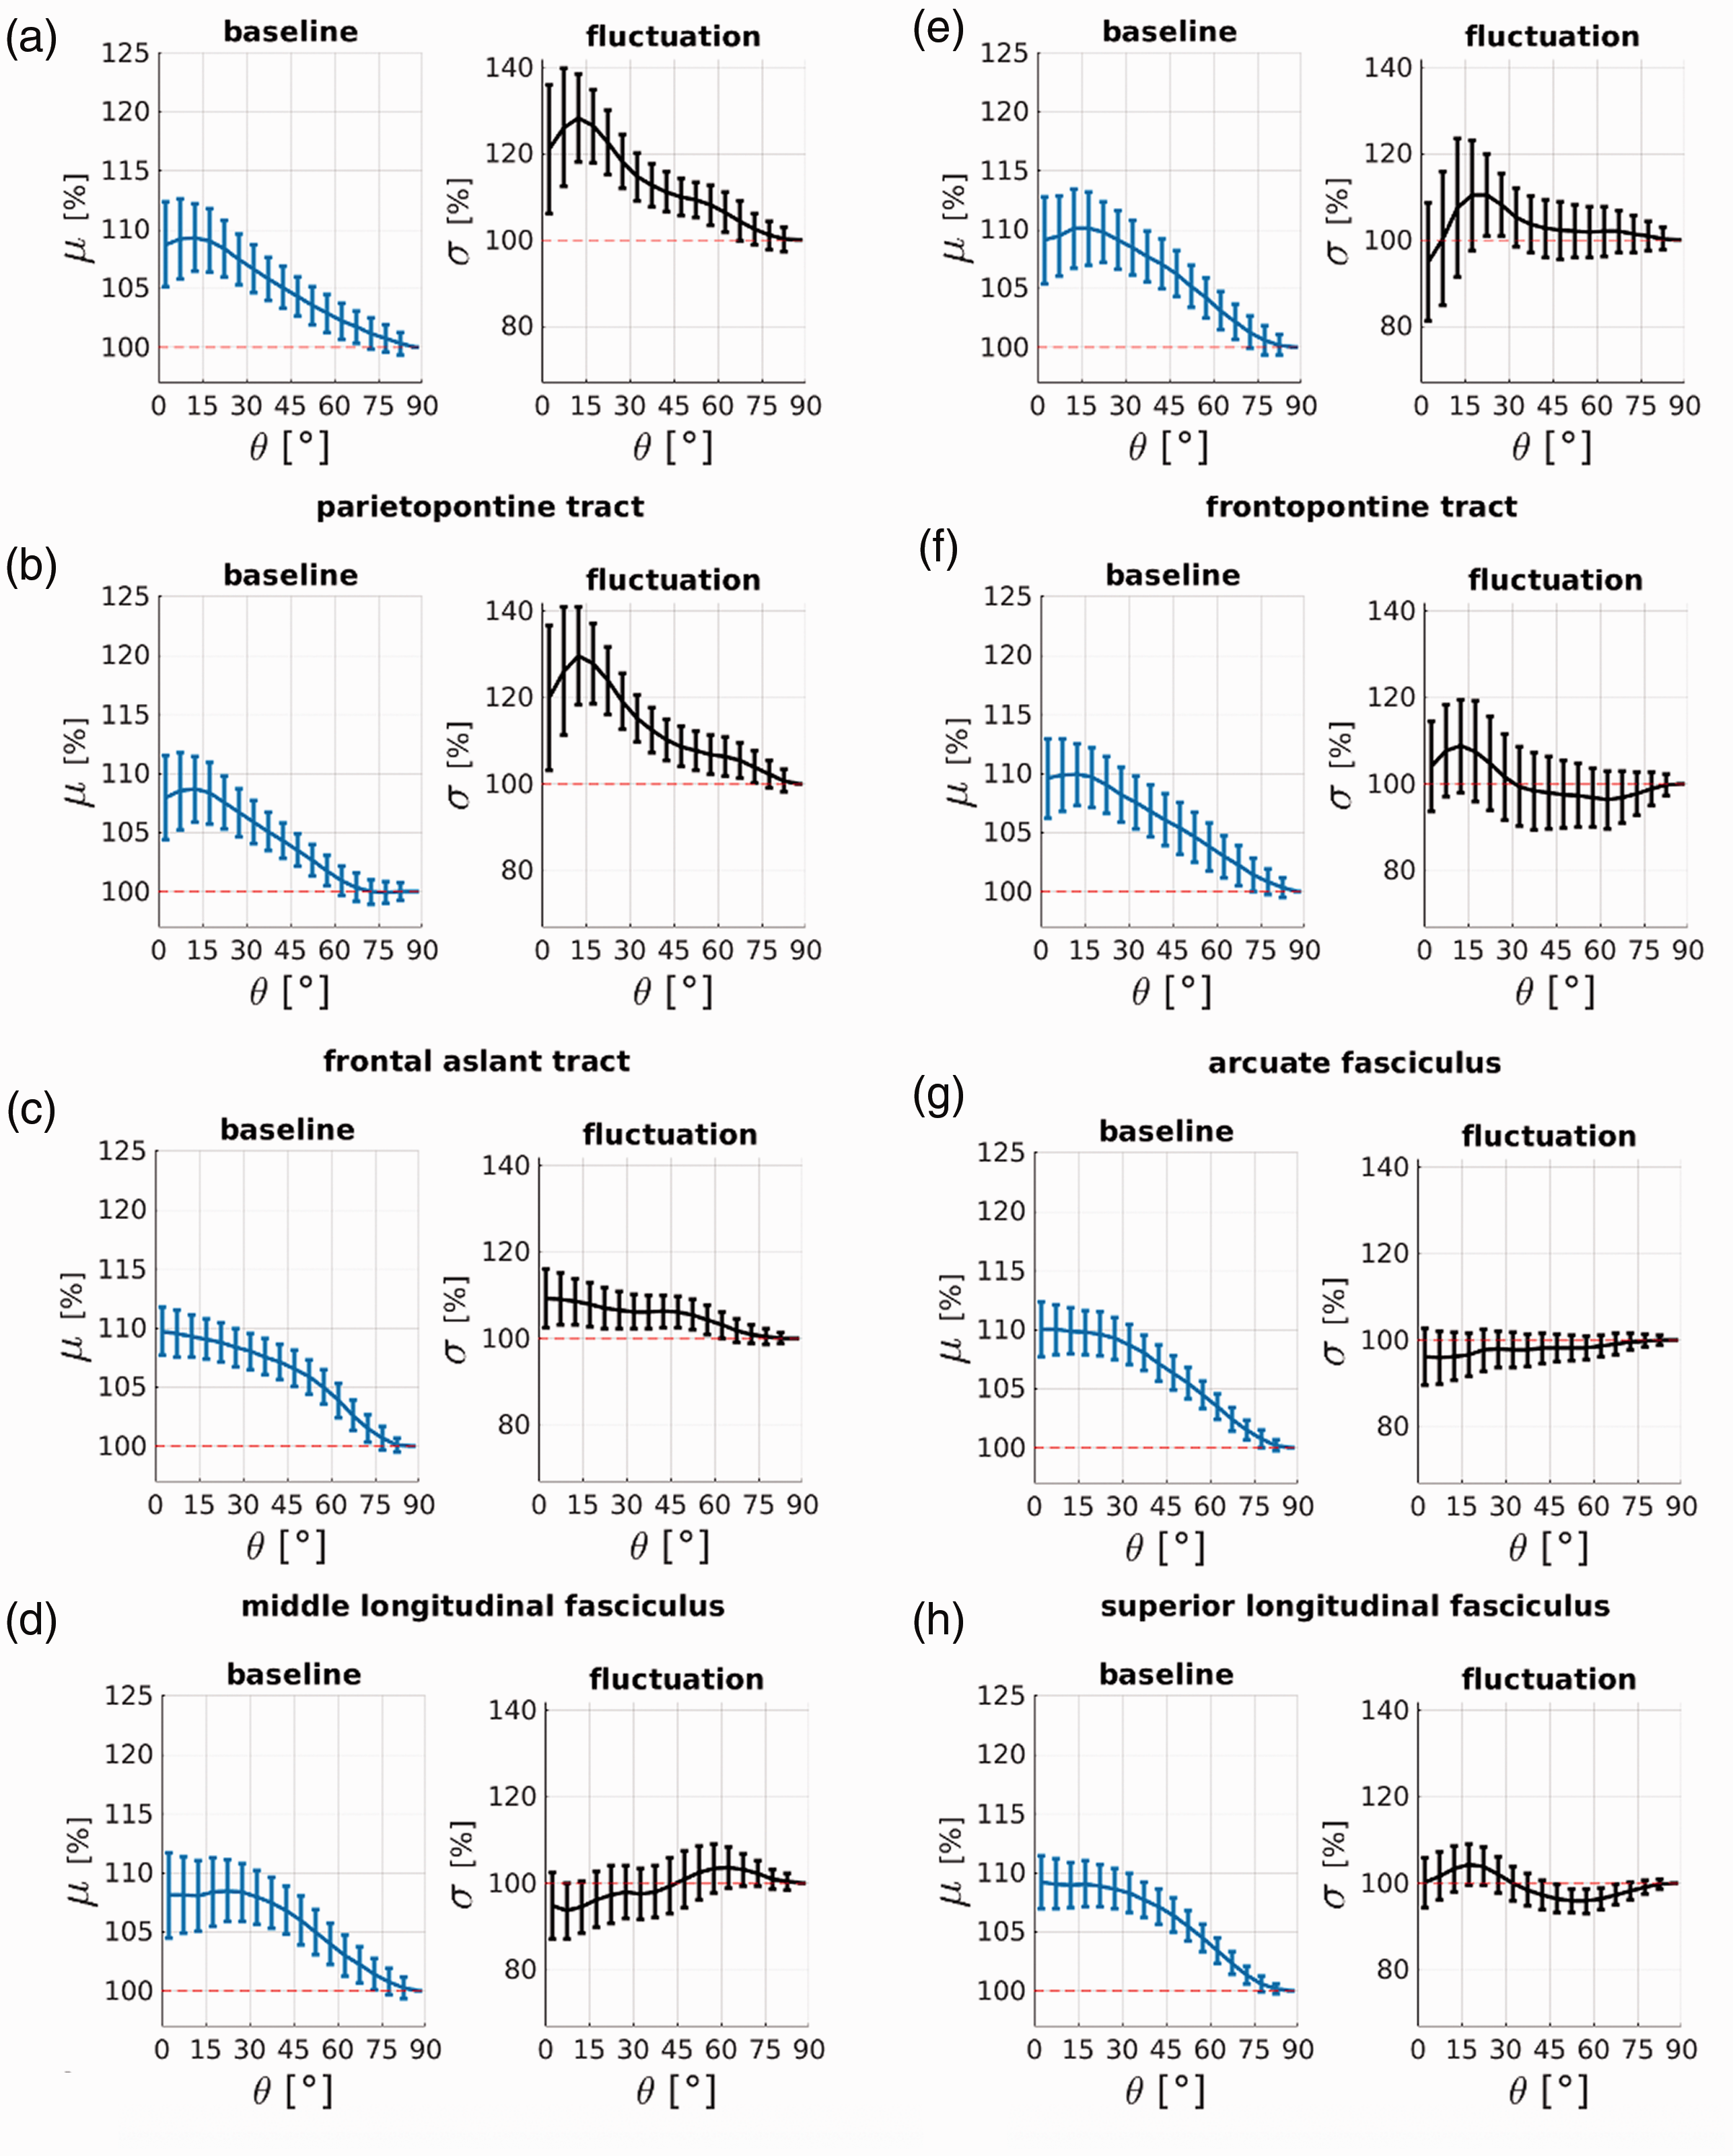
Three (out of 16) fibre bundles (a–c) exhibit positive orientation bias profiles that suggest that their time series fluctuations are dominated by baseline fluctuations. Five fibre bundles (d–h) exhibit no orientation bias beyond the magnitude of the error bars. The profiles are averaged over 110 subjects and error bars represent the standard deviation across subjects. Orientation angles are the principal diffusion direction estimate from a DTI tensor fit θDTI. Blue plots are the time series temporal mean μ (baseline) and black plots are the temporal standard deviation σ (fluctuation). Fibre bundles are sorted with respect to the amount of positive fluctuation bias Δσ from highest to no bias (a–h); exact values are in Table 1.
Fibre bundles are categorised by their orientation signature in Table 1. Eight of the 16 bundles are classified as fluctuation-dominated with a negative orientation signature Δσ in their fluctuation amplitudes; their corresponding profiles are plotted in Figure 4. Three bundles are classified as baseline-dominated with a positive orientation signature Δσ; their corresponding profile are plotted in Figure 5(a) to (c). Five bundles are classified as bias-free with little-to-no orientation bias beyond the magnitude of the error bars; their corresponding profile are plotted in Figure 5(d) to (h).
Fibre bundles categorised by their orientation bias signature Δσ.
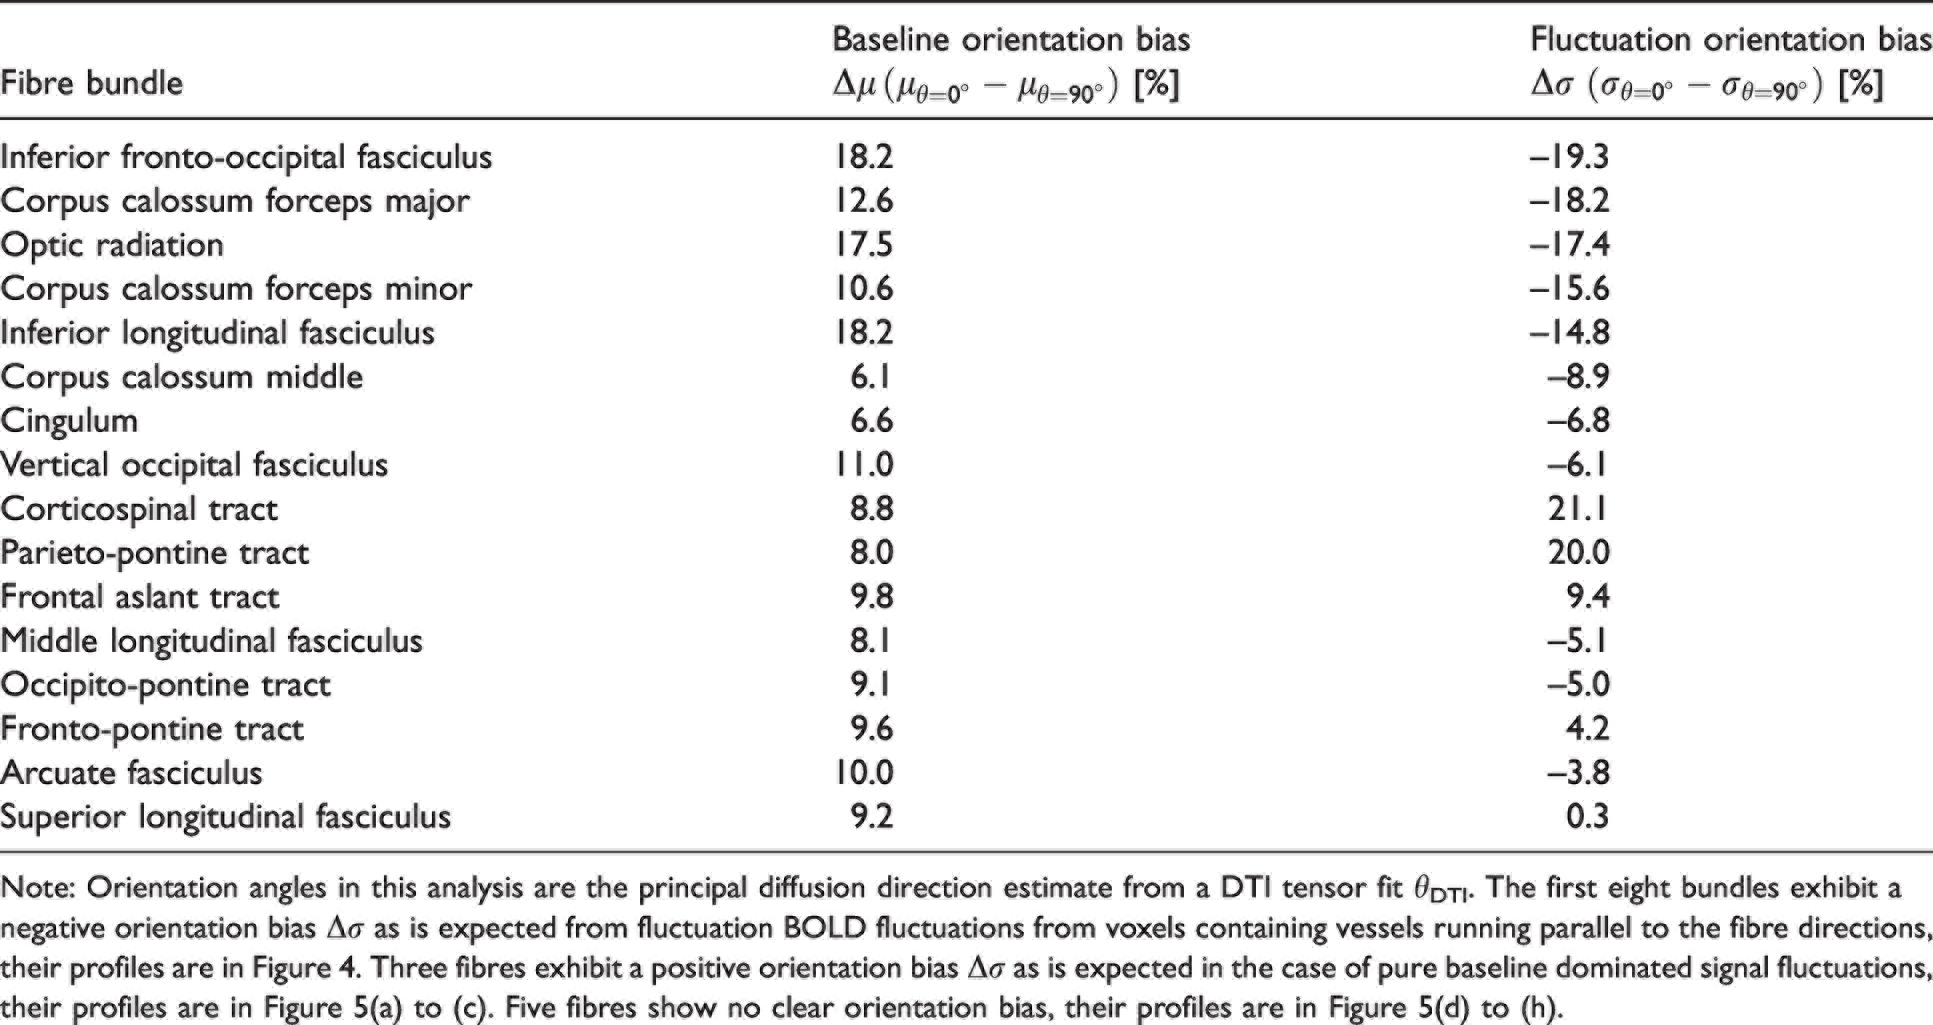
Note: Orientation angles in this analysis are the principal diffusion direction estimate from a DTI tensor fit θDTI. The first eight bundles exhibit a negative orientation bias Δσ as is expected from fluctuation BOLD fluctuations from voxels containing vessels running parallel to the fibre directions, their profiles are in Figure 4. Three fibres exhibit a positive orientation bias Δσ as is expected in the case of pure baseline dominated signal fluctuations, their profiles are in Figure 5(a) to (c). Five fibres show no clear orientation bias, their profiles are in Figure 5(d) to (h).
The bundles with the strongest negative fluctuation bias Δσ corresponding to the fluctuation-dominated signature, also exhibit the strongest baseline biases Δμ. The most fluctuation-dominated bundles are the inferior fasciculus, the corpus callosum and the optic radiation, with Δσ from −15–19%, and Δμ from +11–18%. The heterogenous profiles between the fluctuation-dominated bundles (Figure 4), baseline-dominated and bias-free bundles (Figure 5) may explain the bi-phasic σ(θ) profile seen in Figure 3(b) obtained when averaging over the entire WM mask. The results did not change in their interpretation when we repeated the analysis with more restrictive WM masks based on selecting only voxels with FA values above either 0.2 or 0.5 (see Supplementary Material, Suppl. Table S2).
Orientation effects based on fibre direction estimates from probabilistic tractography
It is well-known that fibres can cross and kiss within a given voxel, in which case the principal direction of the DTI fit will be an inaccurate estimate of the true fibre directions and thus the inferred vessel directions. We therefore performed the same orientation profile analysis for the individual fibre masks using three direction estimates from probabilistic tractography (Figure 6) which can resolve multiple fibre crossings in a voxel.
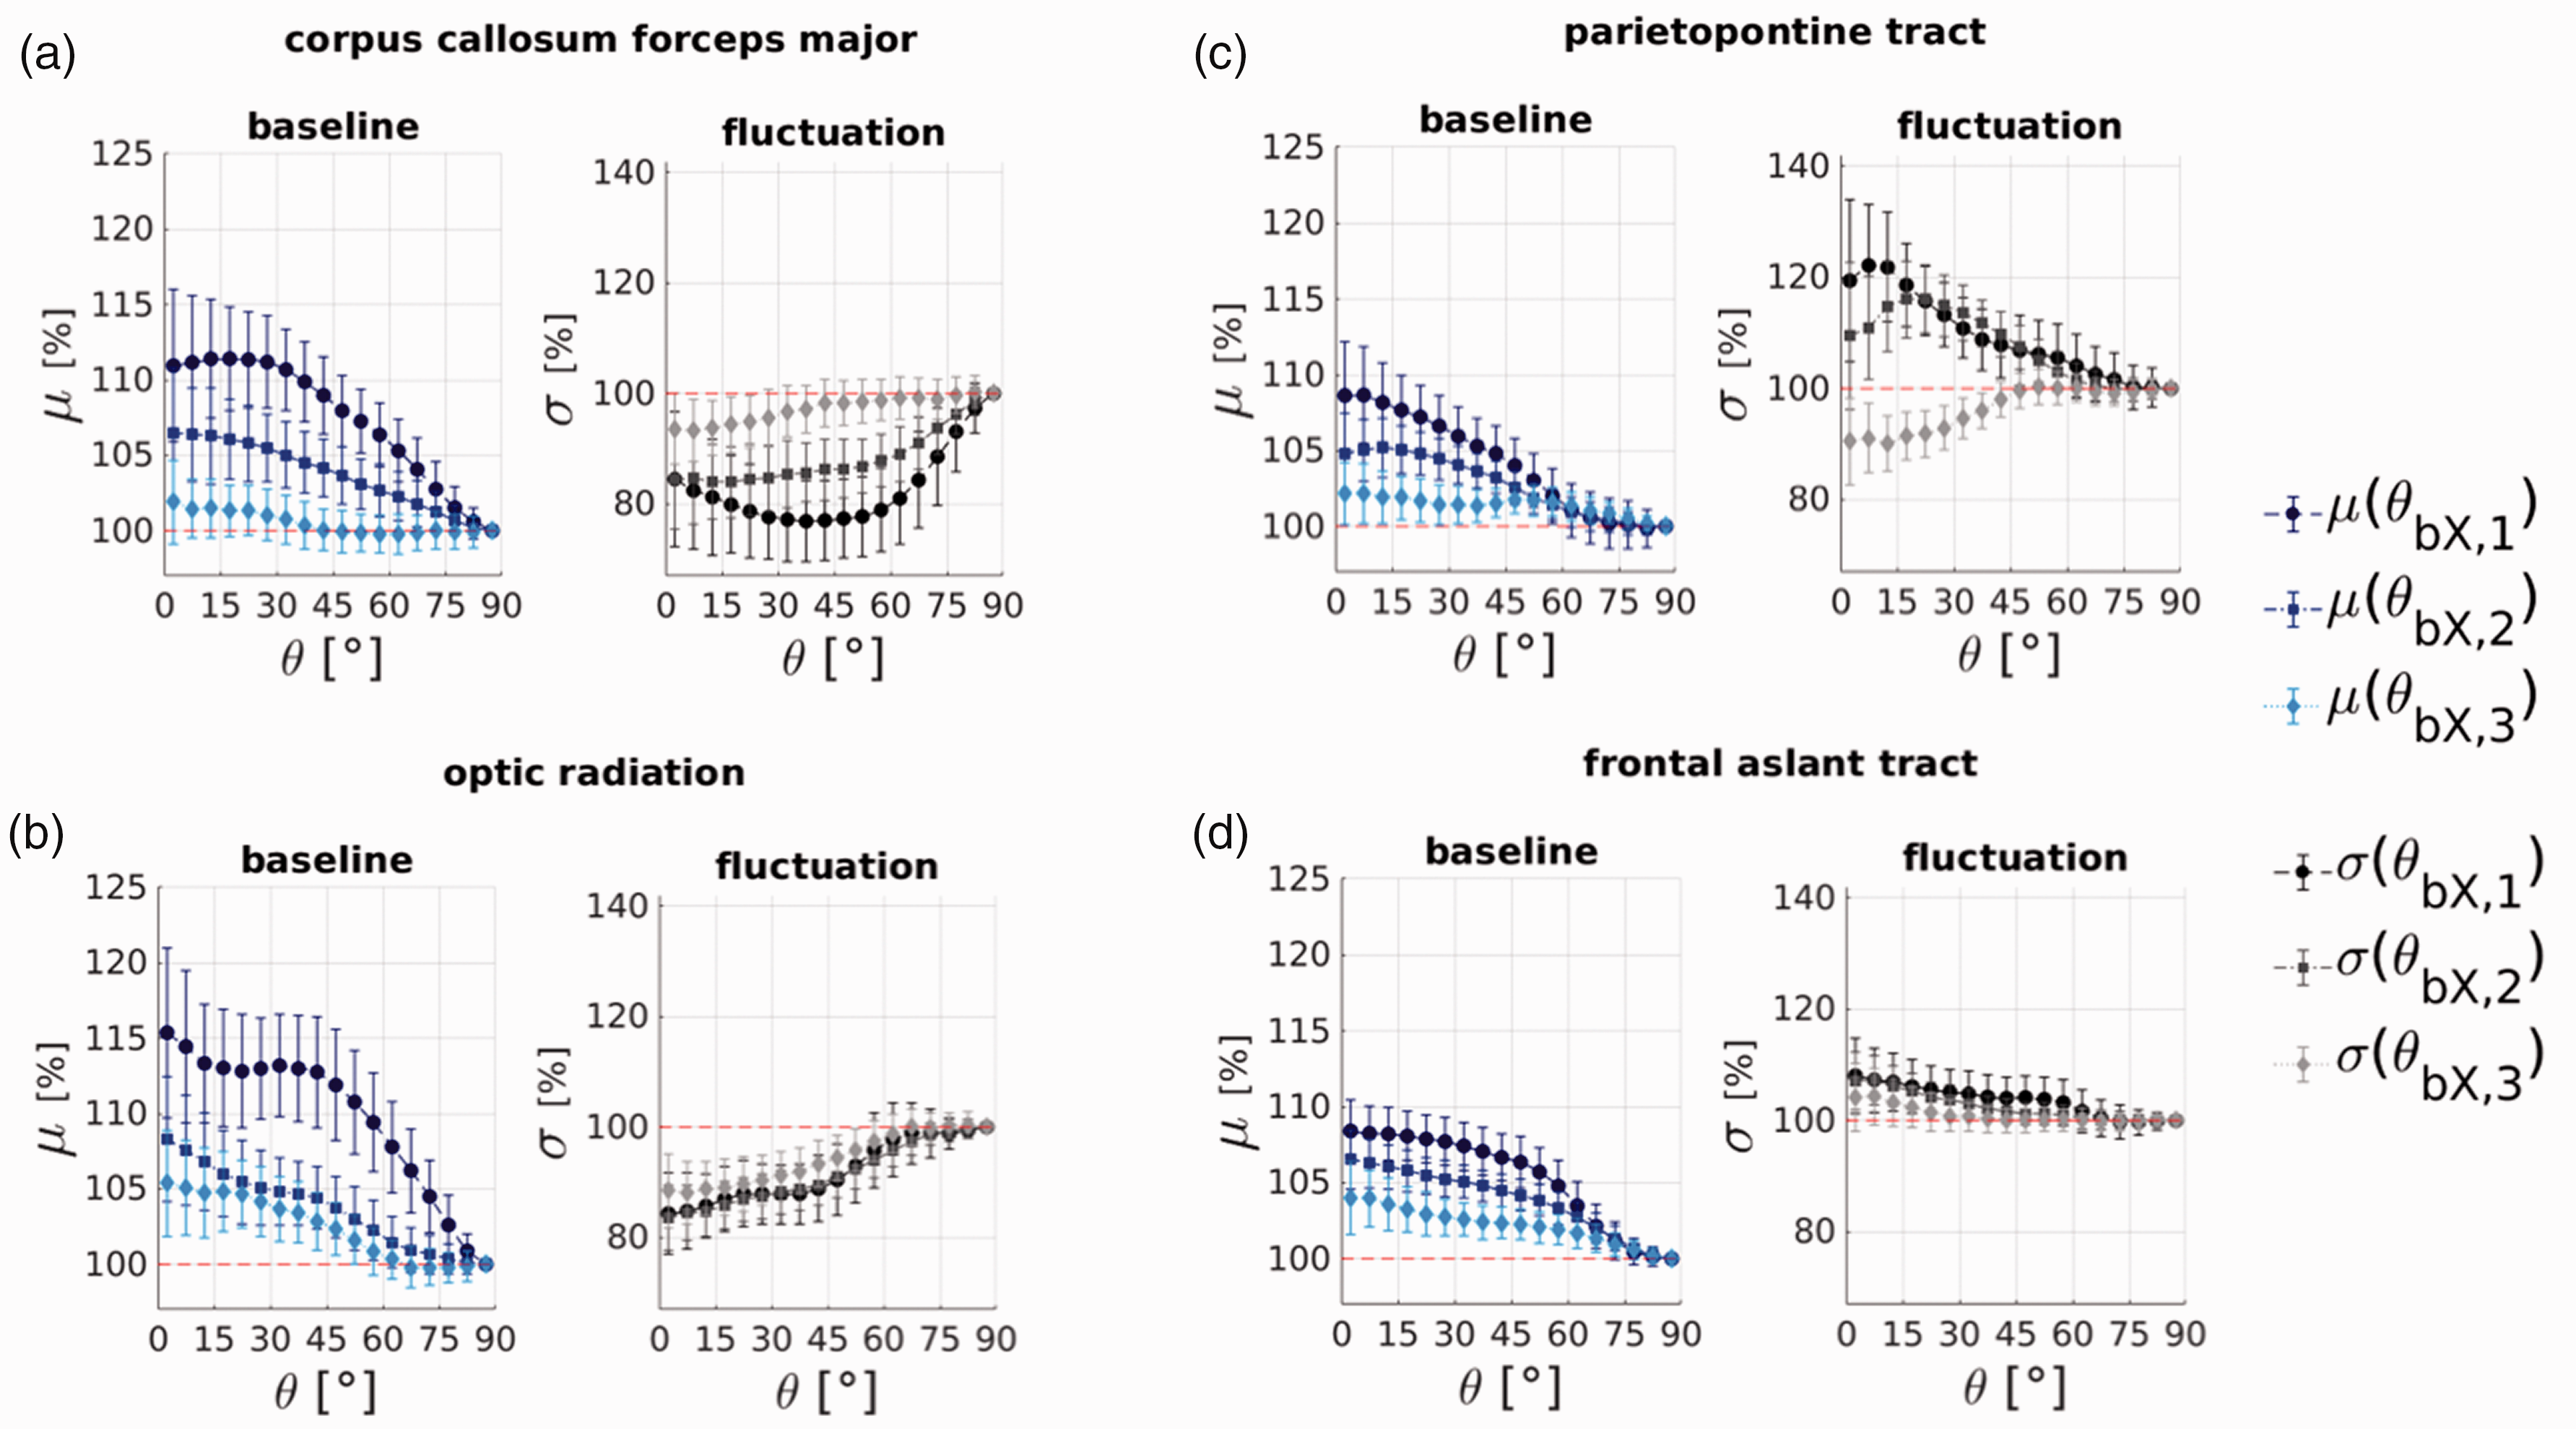
Exemplar orientation profiles from the probabilistic direction estimates from bedpostX. The profiles for the major direction is plotted in dark blue (μ(θbX1)) and black (σ(θbX1)); the results for the intermediate direction is in light blue (μ(θbX2)) and light grey (σ(θbX2)); and the results for the minor direction is in lightest blue (μ(θbX3)) and lightest grey (σ(θbX3)). (a, b) Dynamics-dominated bundles of the corpus callosum and the optic radiation; (c, d) baseline-dominated examples of the parietopontine tract and the frontal aslant tract. Trends are similar to the DTI-based fibre direction angle estimates shown in Figures 4 and 5 when compared with the major direction but diminish for the intermediate and the minor fibre direction estimates.
Orientation effects observed within individual fibre bundle masks
The orientation profiles from the major direction angle derived from probabilistic tractography, θbX,1, and the DTI-based principal direction angle, θDTI, compare well for all bundles. Figures 6(a) and (b) show examples for the fluctuation-dominated bundles of the corpus callosum and the optic radiation, and Figures 6(c) and (d) show two baseline-dominated examples from the parietopontine and the frontal aslant tracts. The orientation profiles for the intermediate and minor direction angles θbX,2 and θbX,3 diminish and flatten out as expected since these fibre components are assumed to reflect the dominant fibre direction less well, and thus there should be less of a BOLD orientation effect relative to these angles.
Discussion
Orientation effects in the gradient-echo BOLD baseline signal due to baseline T2* effects
We found that the baseline gradient-echo T2*-weighted signal, calculated as the temporal mean of the T2*-weighted time-series data, varies on average by 11% between WM voxels that contain parallel and perpendicular fibre direction estimates. Our data consist of T2*-weighted images, and not quantitative T2* maps, and while other non-T2* components may exhibit subtle orientation effects such as any T1 weighting51,52, if we assume that the orientation effects are dominated by T2* our observation corresponds to a change in relaxation rate, ΔR2*, of ∼3 Hz. Similar observations have been reported based on fibre orientation estimates derived from DTI: a 3T study by Denk et al. reported parallel-to-perpendicular orientation ΔR2* changes of approximately 2–3 Hz in the WM using multi-echo susceptibility imaging 31 and Kaczmarz et al. reported a ΔR2* of 2.5 Hz in a 3T study. 23 Increasing field strength will enhance the orientation dependence, and indeed observed ΔR2* changes of ∼6 Hz were found in the corpus callosum in two ex-vivo studies at 7T.25,27 These studies also indicate that effects of blood was only a minor contributing source of orientation effects, since these brain-tissue specimens presumably contained far less blood than what is present in vivo. The latter ex-vivo study also found that ΔR2* did not change notably after tissue iron had been extracted from the specimen, which suggests that the observed dependence may be driven predominantly by myelin. Also a recent study investigating orientation effects in spin-echo imaging demonstrated that observable orientation effects can be generated by myelin alone, 53 suggesting that blood vessel effects are not needed to generate an orientation dependency. Here, we show how the baseline orientation dependence is heterogenous between distinct fibre tracts, with Δμ ranging between 6% to 18% across bundle masks. This can in part be attributed to the heterogeneous myelination levels across the brain, causing some tracts to be more myelinated than others such that they exhibit varying levels of orientation effects. Still, another source that should contribute to the heterogeneity in the baseline signal orientation dependence in our data are blood vessels—in particular veins that contain T2*-shortening deoxygenated blood—that run parallel to many of the bundles.
Support of a role of the vasculature on the observed orientation effects is provided by a recent study by Hernández-Torres et al. on the orientation dependence of blood volume and flow estimates in the WM derived from DSC imaging. By administering a contrast agent, they found an orientation-dependent change in R2* that was consistent with approximately half of the blood volume in the WM being within blood vessels that were anisotropic and aligned parallel to the local WM fibre direction; they also found estimated blood volume to be almost 100% higher in perpendicular WM than in parallel WM at the highest contrast agent dose. 22 A similar conclusion was reached by Doucette et al., who, using spin-echo based DSC data, also estimated from the observed orientation effect that roughly half of the WM vascular volume is comprised of vessels running in parallel with WM fibre tracts, 24 which further suggests that blood vessels with smaller diameters seen in spin-echo data also exhibit anisotropy and are aligned with the WM tracts; in their case, numerical simulations indicated that the spin-echo signal was sensitive to small vessels with radii of about 100 µm on average. An orientation effect was also found in a later study by Polimeni et al. who used high-resolution DSC imaging and DTI data at 7T to assess the B0-orientation effect in the estimation of cerebral blood volume. 54 This study confirmed that even when using small voxels the blood volume estimates show an orientation bias: on average, voxels that contained parallel fibres yielded a ∼10% lower blood volume estimate than voxels that contained perpendicular fibres. In agreement with our findings, this recent study also found heterogenous orientation profiles in DSC-based blood volume estimates across fibre bundles using a similar analysis approach, supporting the notion that vascularisation across the WM bundles might be heterogenous. Because partial volume effects between vessels and surrounding tissue within a voxel play an important role on the orientation effect, 30 and interactions between voxel geometry and extravascular fields can impact observed signal levels, 29 especially for voxels containing vessels parallel to B0, further work will be needed to fully account for the observed differences in the orientation bias across imaging resolutions and field strengths.
Orientation effects in gradient-echo BOLD fluctuation amplitudes and implications for WM-fMRI
The novel aspect of our work was to exploit the orientation dependence of T2* to test for potential dynamic sources in gradient-echo BOLD amplitude fluctuations that could be more directly associated with blood vessels running alongside WM fibre tracts. Static baseline signal components, from sources such as myelin and venous blood, should introduce an orientation bias Δσ that tracks the baseline orientation bias Δμ that would manifest as a maximal T2* change for tracts parallel to the B0 axis. However, if there are dynamic changes in blood oxygenation levels, i.e., BOLD effects, within the vessels that dominate the orientation effect, the orientation bias should follow an opposite negative trend that would manifest as a maximal BOLD fluctuation for tracts perpendicular to B0. When pooling across the entire WM, we found an orientation effect size that was small relative to the error bars, however the relationship between BOLD fluctuation amplitude varied slowly with orientation, suggesting that there may be a systematic relationship. A more apparent orientation effect was observed by considering individual fibre bundles. Here we found that about half of the fibre bundles show this fluctuation-dominated orientation signature consistent with an effect driven by blood vessels. The strongest effects were seen in the inferior fronto-occipital and longitudinal fasciculi, the corpus callosum and the optic radiation. Given the recent reports of WM-fMRI activity it might be of interest to study these fibre bundles in particular, as BOLD responses from these bundles may be more readily detectable. In fact many WM-fMRI studies have reported BOLD activity in the corpus callosum.1–3 Although our results are based on observations of gradient-echo BOLD data, it is expected that spin-echo BOLD data would show similar orientation biases based on previous reports, mentioned above, that suggest that blood vessels far smaller than the voxel size also appear to run alongside WM tracts and generate measurable orientation effects. 24
Our study is limited by sensitivity variations in the fMRI data across the cerebrum which could impact the detectability of fMRI fluctuations and could be a reason why we do not detect BOLD fluctuations in some fibre bundles. An additional limiting factor is the high slice-acceleration (MB = 8) used in the fMRI protocol. Such high parallel-imaging acceleration contributes to spatially-varying noise levels, with reductions of SNR in the centre of the head including some WM regions, thus we expect effects to be more detectable in studies using less acceleration. Furthermore, partial volume effects could also hinder our ability to detect BOLD fluctuations in all tracts of the WM. However, our results are in agreement with a recent contrast-enhanced vascular imaging study by Bernier et al. who ranked fibre bundles by vascularisation using the same fibre bundle atlas as in this work. 55 The bundles that appeared most vascularised in their data are also the bundles that we find to have the highest dynamic BOLD fluctuations. This does not imply that the bundles where neither vessels (in their data) nor BOLD fluctuations (in our data) were detected are not vascularised per se, but it may mean that these particular bundles have reduced blood volume, making detection both in this previous study and in our study more challenging.
Crossing fibres are a confounding factor to estimate fibre orientations from dMRI data and thus to infer blood vessel orientation. For example, the corpus callosum is more uni-directional than other fibre bundles, which potentially renders it more favourable for accurate estimation of fibre direction and thus more accurate blood vessel orientation estimation, which also could improve the detectability of BOLD orientation effects there. However, our results remained mostly consistent when we used the multi-fibre estimates obtained with a crossing-fibre model (bedpostX) instead of the single-fibre orientation from the diffusion tensor model. Our multi-fibre analysis led to the bias signature of only two fibre bundles, namely the parietopontine and the occipitopontine tracts, changing between the primary and tertiary orientation estimates. A potential explanation is that the fibres corresponding to the primary orientation possess no parallel running vessels, whereas the fibres along the tertiary orientation do possess parallel vessels that exhibit a dynamic BOLD component.
WM metabolism and sources of dynamic BOLD
Our results suggest that parallel-running vessels in certain bundles carry dynamic BOLD fluctuations in the resting state. The question still remains regarding which processes drive the changes in blood oxygenation levels in the WM vasculature. One possibility is that these fluctuations reflect global effects such as physiological noises in WM driven by the respiratory/cardiac cycles. Previous fMRI studies presented evidence for physiological noise within WM,8,56 however these fluctuations are expected to be global as they are driven systemically, yet in our data fluctuations are only observed in a subset of WM tracts. Another possibility is that the observed BOLD fluctuations reflect local effects such as functional hyperaemia driven by local fluctuations in metabolic demand. Unfortunately, knowledge about WM metabolism and neurovascular coupling is sparse. GM metabolism is well understood, and it is well accepted that oxidative phosphorylation is the dominant energy source. GM energy is suggested to be mainly used for neural signalling compared to non-signalling processes. 57 In contrast, WM energy is mainly consumed for non-signalling “housekeeping” purposes, such as maintaining homeostasis, and overall the WM energy consumption is estimated to be three times smaller than that of the GM, 58 which is roughly consistent with the observation that the WM exhibits a vascular density that is four times lower than that of GM. However, while less than half of energy the consumption in WM is related to signalling, this is still relatively “high” given that synapse density is substantially lower; to our knowledge this has only been measured in rat brain, where synapse density is 80× lower in WM compared to GM 58 , and collectively WM synapses require less than 0.5% of the energy of GM synapses. 58 Rather than synaptic activity, other signalling processes such as the propagation of action potentials along axons and the maintenance of their resting membrane potentials appear to drive metabolic demand in WM. Still, there is no consensus on how much metabolism in the WM is based purely on aerobic glycolysis, i.e., glycolysis without oxidative metabolism when there is no lack of available oxygen. Animal studies are somewhat contradictory, with one rodent study reporting higher glycolytic than oxidative metabolism in WM, 59 another study reporting a correlation between WM oxidative glucose metabolism and GM electrostimulation 60 and a more recent study suggesting that axonal oxidative glucose metabolism as well as lactate production (a by-product of glycolysis) rise when activity is evoked in the GM regions sending or receiving the associated WM projections. 61 In summary, it might be that WM utilises a mix of metabolic mechanisms, of which some require oxygen supply via the vasculature and thus requiring functional hyperaemia and the consequent BOLD effect. Whether BOLD fluctuations seen in the WM are truly linked to neuronal signalling in GM and subsequent activation of WM axons cannot be answered here, and the BOLD effects we have observed could be entirely unrelated to neural activity.
Physiological noise removal was not performed here in part because our hypothesis was that BOLD fluctuations in the WM should exhibit orientation effects, and these fluctuations can be driven by neuronal activity or by systemic physiology. We previously demonstrated that some physiological noise components that reflect true oxygenation changes exhibited orientation dependence in the cortical GM, whereas other physiological noise components that reflect other non-BOLD changes did not exhibit orientation dependence in the cortical GM, as expected. 21 Neuronally-driven fluctuations in the BOLD signal exhibit an orientation dependence, and so while physiological noise correction, if performed properly, will have some impact on the size of the orientation dependence effect. We note that our derivation for why baseline-dominated orientation dependence given by σ = λ ⋅ S ∝ cos 2 θ assumes that the fMRI data in the physiological noise dominated regime, and so fMRI data with lower levels of physiological noise are expected to more often exhibit a fluctuation-dominated orientation dependence given by σ ∝ sin 2 θ. It is also unclear how “draining vein” effects, which cause a displacement of BOLD signal changes away from the site of neural activity, manifest in the WM. Although the orientation dependency is expected to be dominated by larger (i.e., draining) veins—so by definition there will be some influence of draining veins—proper draining-vein displacement effects could be observed far downstream from the capillary bed, e.g., from penetrators draining subcortical GM structures, or an increased orientation effect at the downstream end of a tract caused by an accumulation of deoxygenated blood from all upstream capillary beds. Note that most of the venous blood of the WM is drained outwards, and so deoxygenated blood from the WM may be observed downstream in the cortical GM. Still, observed fMRI fluctuations along tracts might offer a means to study vascular function and integrity in the WM. This might be relevant for research into neurodegenerative diseases, such as vascular dementia where WM tissue pathology and vascular impairment occur as concomitant phenomena.62–64
Conclusion
Here we show that gradient-echo BOLD signals in the WM are consistently influenced by the geometry of fibre tracts: the fMRI signal in a voxel depends on the orientation of the local diffusion tensor axis relative to the B0-field. The fMRI time-series temporal mean signal is biased similarly in all of the WM, but the fluctuation amplitudes are biased differently across fibre bundles. In particular the inferior fasciculus, the corpus callosum and the optic radiation exhibit a bias signature in their time-series amplitude fluctuations expected from changes in BOLD in voxels containing blood vessels running in parallel to the fibre architecture.
Supplemental Material
sj-pdf-1-jcb-10.1177_0271678X221106277 - Supplemental material for Static and dynamic BOLD fMRI components along white matter fibre tracts and their dependence on the orientation of the local diffusion tensor axis relative to the B0-field
Supplemental material, sj-pdf-1-jcb-10.1177_0271678X221106277 for Static and dynamic BOLD fMRI components along white matter fibre tracts and their dependence on the orientation of the local diffusion tensor axis relative to the B0-field by Olivia Viessmann, Qiyuan Tian, Michaël Bernier and Jonathan R Polimeni in Journal of Cerebral Blood Flow & Metabolism
Footnotes
Funding
The author(s) disclosed receipt of the following financial support for the research, authorship, and/or publication of this article: This work was supported in part by the NIH NIBIB (grants P41-EB015896, P41-EB030006 and R01-EB019437), by the BRAIN Initiative (NIH NIMH grant R01-MH111419), and by the MGH/HST Athinoula A. Martinos Center for Biomedical Imaging. Data were provided by the Human Connectome Project, WU-Minn Consortium (Principal Investigators: David Van Essen and Kamil Ugurbil; U54-MH091657) funded by the 16 NIH Institutes and Centers that support the NIH Blueprint for Neuroscience Research; and by the McDonnell Center for Systems Neuroscience at Washington University.
Acknowledgements
We thank Dr. Konstantinos Arfanakis for advising us on fibre bundle mask creation with the IIT brain atlas.
Declaration of conflicting interests
The author(s) declared no potential conflicts of interest with respect to the research, authorship, and/or publication of this article.
Authors’ contributions
Olivia Viessmann: conceptualization, methodology, formal analysis, writing – original draft
Qiyuan Tian: formal analysis, writing – review and editing
Michael Bernier: writing – review and editing
Jonathan Polimeni: conceptualization, methodology, supervision, writing – review and editing
Supplemental material
Supplemental material for this article is available online.
References
Supplementary Material
Please find the following supplemental material available below.
For Open Access articles published under a Creative Commons License, all supplemental material carries the same license as the article it is associated with.
For non-Open Access articles published, all supplemental material carries a non-exclusive license, and permission requests for re-use of supplemental material or any part of supplemental material shall be sent directly to the copyright owner as specified in the copyright notice associated with the article.