
Abstract
Relative oxygen extraction fraction (rOEF) is a fundamental indicator of cerebral metabolic function. An easily applicable method for magnetic resonance imaging (MRI) based rOEF mapping is the multi-parametric quantitative blood oxygenation level dependent (mq-BOLD) approach with separate acquisitions of transverse relaxation times
Keywords
Introduction
The oxygen extraction fraction (OEF) is a fundamental marker of cerebral metabolic function, which is widely considered as an important indicator of brain health and tissue viability. For rapid in vivo assessment of regional OEF, the magnetic resonance imaging (MRI) based multi-parametric quantitative BOLD (mq-BOLD) approach is highly promising. In mq-BOLD, three separate measurements are conducted to obtain maps of the relative cerebral blood volume (rCBV) as well as the quantitative transverse relaxation rates
The mq-BOLD approach is based on a model representing a network of randomly oriented blood vessels by infinite length cylinders that possess homogenous magnetization and infinite length.1,9 While these model assumptions are reasonable in gray matter (GM), known anisotropy effects in white matter (WM) contradict them. Anisotropy effects primarily arise from the highly oriented myelin sheaths within nerve fibers. 10 Moreover, blood vessels are also expected to contribute to orientation effects,11,12 because preferential orientation of blood vessels in WM parallel the fiber tracts.13,14 As corroborated by simulations, the results of Hernández-Torres et al. 12 are in agreement with oriented vessels occupying about one-third of the vascular volume in WM. Thus, mq-BOLD application in highly ordered WM structures raises questions about its reliability. 1 Since WM is particularly affected by many vascular pathologies such as stroke and small vessel diseases, 15 a deeper understanding of factors influencing mq-BOLD-derived rOEF values in WM as high clinical relevance.
Fiber bundles in WM consist of axons, running mainly parallel to each other, being wrapped by myelin. The surrounding myelin sheaths consist of lipid bilayers organized in a lamellar structure with alternating layers of lipid and water. 16 Strong effects of the nerve fiber orientation towards the main static magnetic field (B0) on effective transverse relaxation are well known and have been investigated extensively11,16–31 and also demonstrated in the context of DSC-based perfusion imaging. 12 In addition, spin echo-derived T2 was found to be affected by fiber orientation effects, 20 which was attributed to diffusion. 18
Fiber orientation effects have been studied by different methods, including in vitro samples20,23,24,26,31 and scanning in different head positions.11,18 However, determining fiber orientation via diffusion tensor imaging (DTI) 32 allows voxelwise correlations with the parameter values,11,12,17,19,28,29 and thus appears most suitable for accurate in vivo measurements.
A number of studies attempted to characterize the
Even though, the orientation effects of
Material and methods
Participants
Thirty healthy elderly (17 females; mean age 70.3 ± 4.8 years; see Supplemental Table 1 for more details; normal test results in MMSE, STAI, BDI) participated in this prospective study. Participants were enrolled by word-of-mouth advertisement from May 2015 until May 2017. Examination of every participant included medical history, basic neurological examination and MRI. The study was approved by the medical ethical board of the Klinikum rechts der Isar, in line with Human Research Committee guidelines of the Technical University of Munich. All participants provided informed consent in accordance with the standard protocol approvals. Exclusion criteria for entry into the study were any neurological, psychiatric or systemic disease, clinically remarkable structural MRI (e.g. territorial stroke lesions, bleedings, or a history of brain surgery), severe chronic kidney disease or MR contraindications.
Imaging data acquisition
Scanning was performed on a clinical 3T Philips Ingenia MR-Scanner (Philips Healthcare, Best, The Netherlands) using a 16-channel head/neck-receive-coil. The Omega HP gradients allow a maximum amplitude of 45 mT/m and slew rate of 200 T/m/s. In order to calculate mq-BOLD-derived rOEF, the MRI protocol comprised quantitative mapping of intrinsic and effective transverse relaxation times T2 and Overview of MRI protocol and derived parameters. DTI was used to derive the rotation matrix 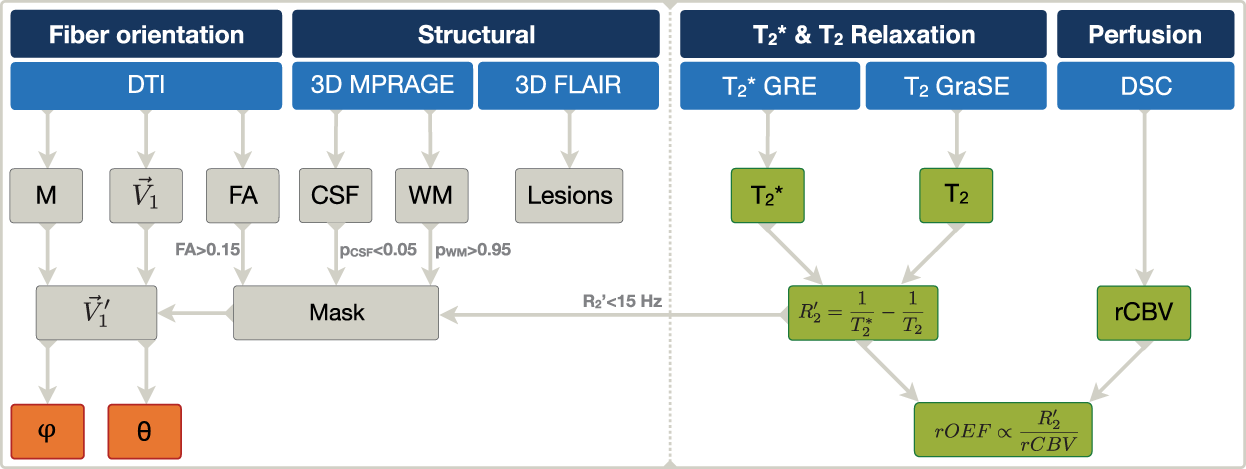
T2*-mapping used a 12 echo gradient echo (GRE) sequence featuring exponential excitation pulses to facilitate correction of magnetic background gradients40,41 and duplicate acquisition of k-space center for motion correction 42 with the following imaging parameters: TE1 = ΔTE = 5 ms, TR = 1950 ms, α = 30°, mono-polar readout, 30 slices, matrix 112 × 92, voxel size 2.0 × 2.0 × 3.0 mm3, total acquisition time 6:08 min.
T2-mapping was based on an eight echo gradient-spin-echo (GraSE) sequence: TE1 = ΔTE = 16 ms, TR = 8596 ms, echo planar imaging (EPI) factor = 7, 30 slices, gap 0.3 mm, matrix 112 × 91, voxel size 2.0 × 2.0 × 3.0 mm3, acquisition time 2:23 min.
DSC-imaging used dynamic acquisition of 80 single-shot gradient-echo EPI volumes during injection of a weight-adjusted Gd-DOTA bolus (concentration 0.5 mmol/ml, dose 0.1 mmol/kg, at least 7.5 mmol per subject, flow rate 4 ml/s, injection 7.5 s after DSC imaging onset) with TE = 30 ms, TR = 1513 ms, α = 60°, 26 slices, voxel size 2.0 × 2.0 × 3.5 mm3, acquisition time 2:01 min, following the ASFNR recommendations. 43
DTI used spin-echo EPI with 32 gradient directions, b = 800 s/mm2, TE = 61 ms, TR = 12.9 s, Halfscan = 0.7, SENSE = 2, 60 slices, matrix 112 × 110, voxel size 2.0 × 2.0 × 2.0 mm3, NSA = 2, acquisition time 15:30 min. The DTI field-of-view (FOV) was individually aligned to the interhemispheric gap in the axial plane and tilted in the sagittal plane to exclude the participant's eyes.
Structural imaging comprised MPRAGE (TE = 4 ms, TR = 9 ms, α = 8°, TI = 1000 ms, shot interval 2300 ms, SENSE AP = 1.5, SENSE RL = 2.0, 170 slices, matrix 240 × 238, voxel size 1.0 × 1.0 × 1.0 mm3, acquisition time 5:59 min) and FLAIR (TE = 289 ms, TR = 4800 ms, α = 90°, inversion delay 1650 ms, α = 90°, TSE factor = 167, 163 slices, matrix 224 × 224, voxel size 1.12 × 1.12 × 1.12 mm3, acquisition time 4:34 min). Screening for ischemic brain lesions and grading of white matter hyper-intensities were based on diffusion-weighted imaging and FLAIR. The FLAIR lesions were graded by the Fazekas-score 44 (Rater: JG).
Data preprocessing and parameter calculation
All processing procedures used FMRIB Software Library 45 (FSL), SPM1246 (Wellcome Trust Centre for Neuroimaging, UCL, London, UK) and custom programs in MATLAB R2016b (The MathWorks, Natick, MA, USA). MPRAGE data were segmented by SPM12 using six tissue classes and default settings for generation of a WM mask by applying a probability threshold of PWM > 0.95. To reduce influences of partial volume effects, cerebrospinal fluid (CSF) was additionally excluded by applying a threshold of PCSF < 0.05 (Figure 1).
mq-BOLD parameter maps
Multi-echo GRE data were corrected for macroscopic background gradients40,41 and motion
42
and subsequently fitted mono-exponentially for
Since iron depositions are known to increase

DTI-based fiber orientation mapping
DTI-data were processed using FSL.
45
Eddy current effects and motion were corrected by the FSL FLIRT toolbox51,52 and non-brain voxels removed by the FSL brain extraction tool.
53
Eigenvalues and corresponding eigenvectors were calculated with the tensor fitting routine of FSL FDT.54,55 Fractional anisotropy (FA) values were calculated and thresholded at FA > 0.15 to exclude voxels with isotropic structures. We assumed the nerve-fibers to be collinear with the main eigenvector, which is associated with the highest eigenvalue.
10
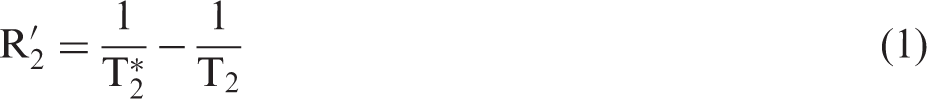
Thereby, the tensor fitting revealed voxelwise vectors Overview of main nerve fiber vector map calculation and angular transformations. (a) Tensor fitting of the DTI-data within the DTI-FOV coordinate system (DTICS, green) revealed the main nerve fiber orientation for each voxel, described by the vector 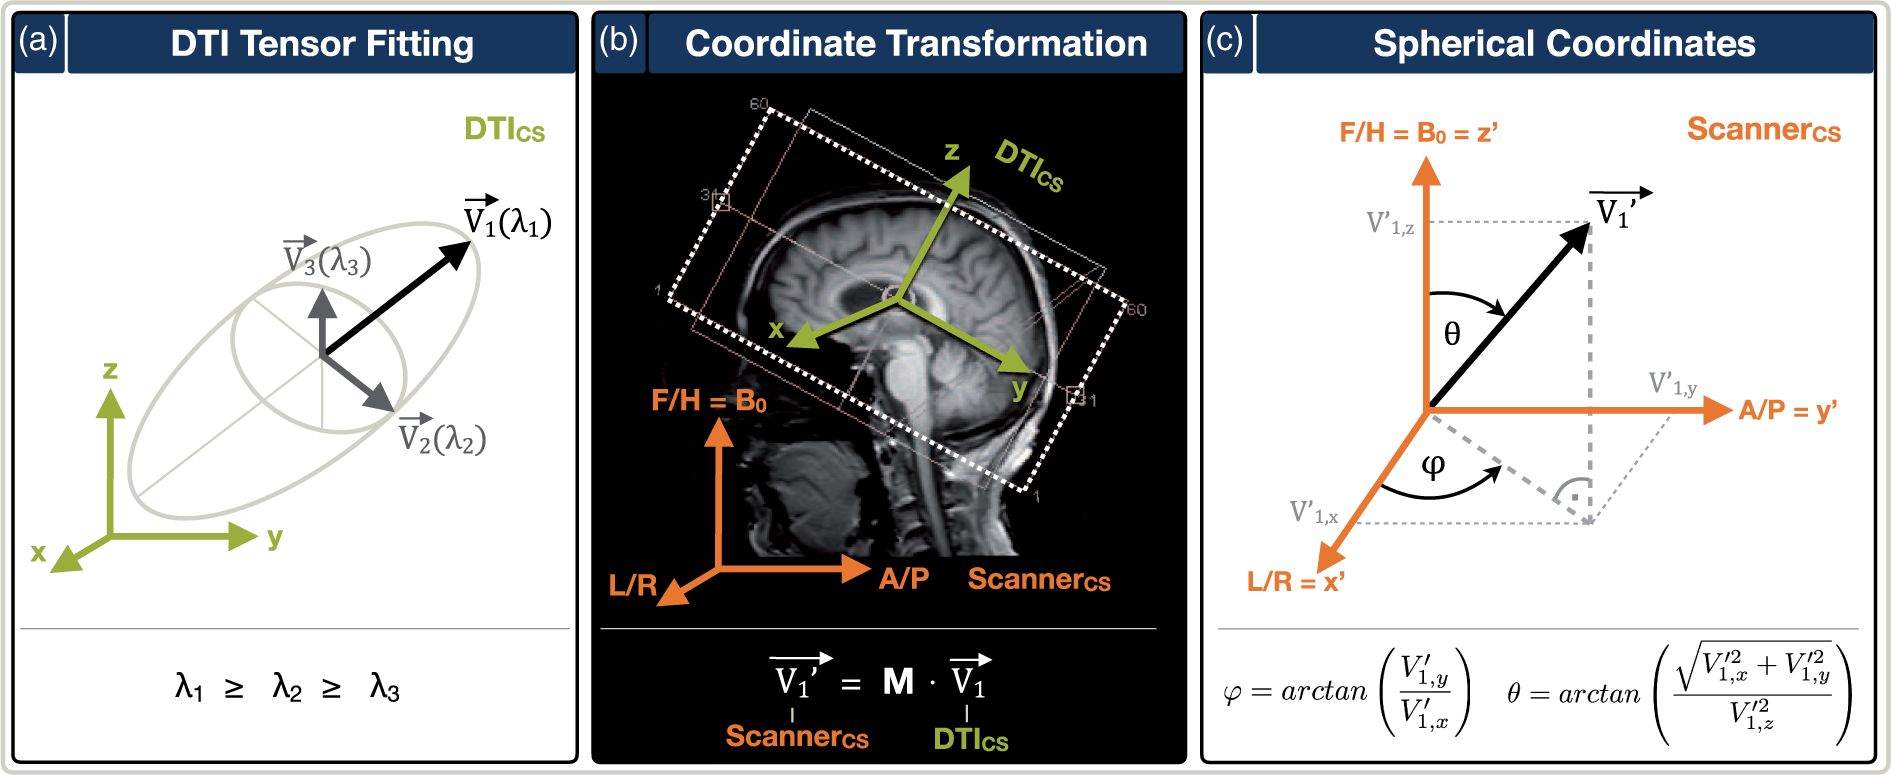
Spatial coregistration
For further evaluation, all individual MR images and parameter maps (MPRAGE, tissue segments,
Angulation processing
The orientation information about the DTI-FOV was extracted from the DTI nifti headers. The resulting matrix
Fitting model
Recently, Lee et al.
24
proposed a model for highly aligned networks of parallel fibers including anisotropy of magnetic susceptibility to describe

Results
The calculated maps of the polar angle θ and azimuthal angle ϕ show excellent agreement with the expected fiber tract directions as demonstrated in Figure 3, showing data from a prototypical participant (see Supplemental Figure 1 for more details).
Exemplary parameter maps of a healthy volunteer in one axial slice. 
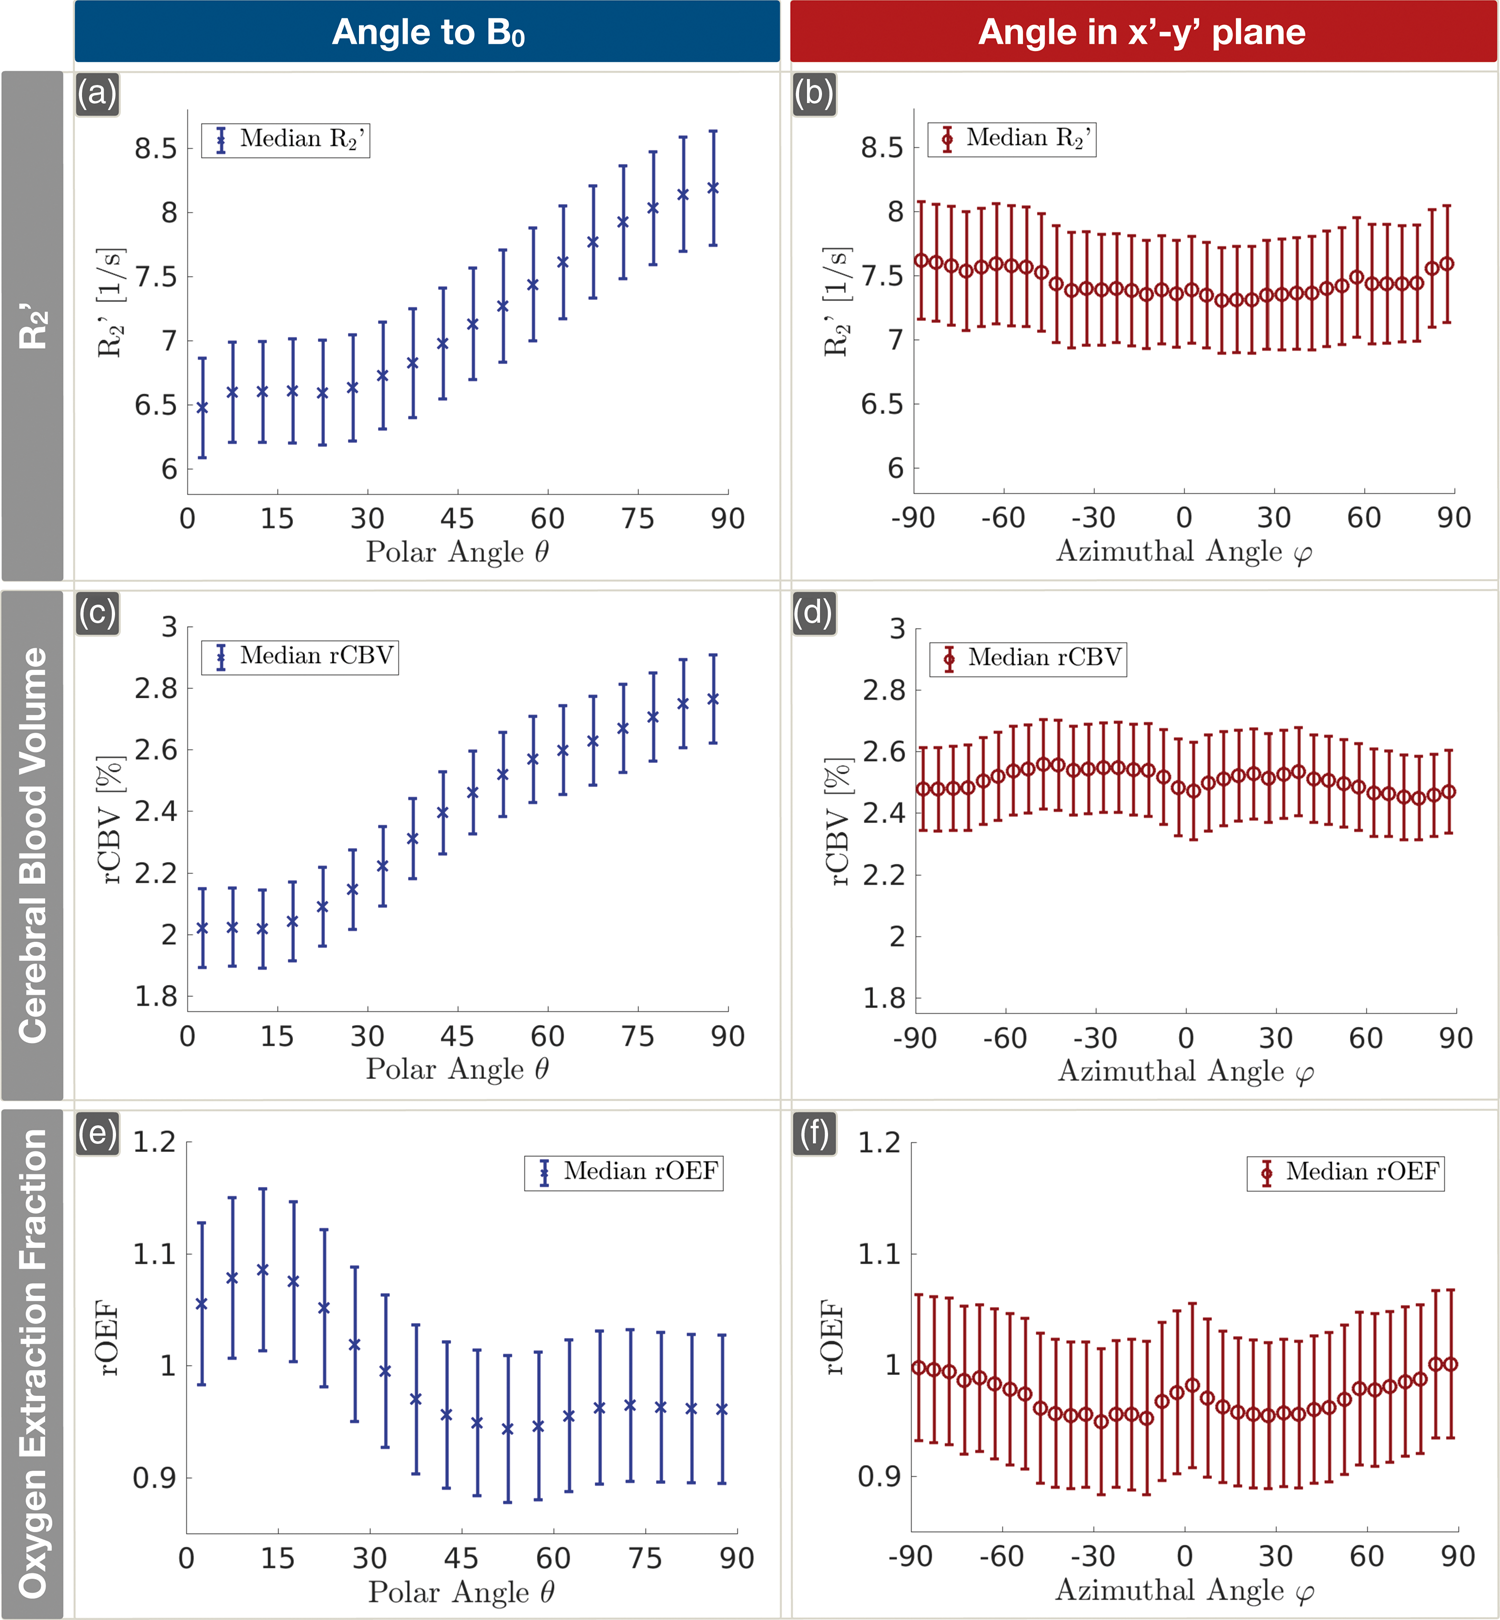
On group level, Orientation dependencies of Orientation dependencies of Histograms of the numbers of contributing voxels depending on the polar angle θ and the azimuthal angle ϕ. The dotted blue line represents the average number of measured voxels per participant depending on θ (a). For comparison, the solid black line indicates equally populated orientations (a). The average number of voxels per participant depending on ϕ, perpendicular to B0, is shown by the red dotted line and compared to the mean of all voxels, represented by the solid black line (b).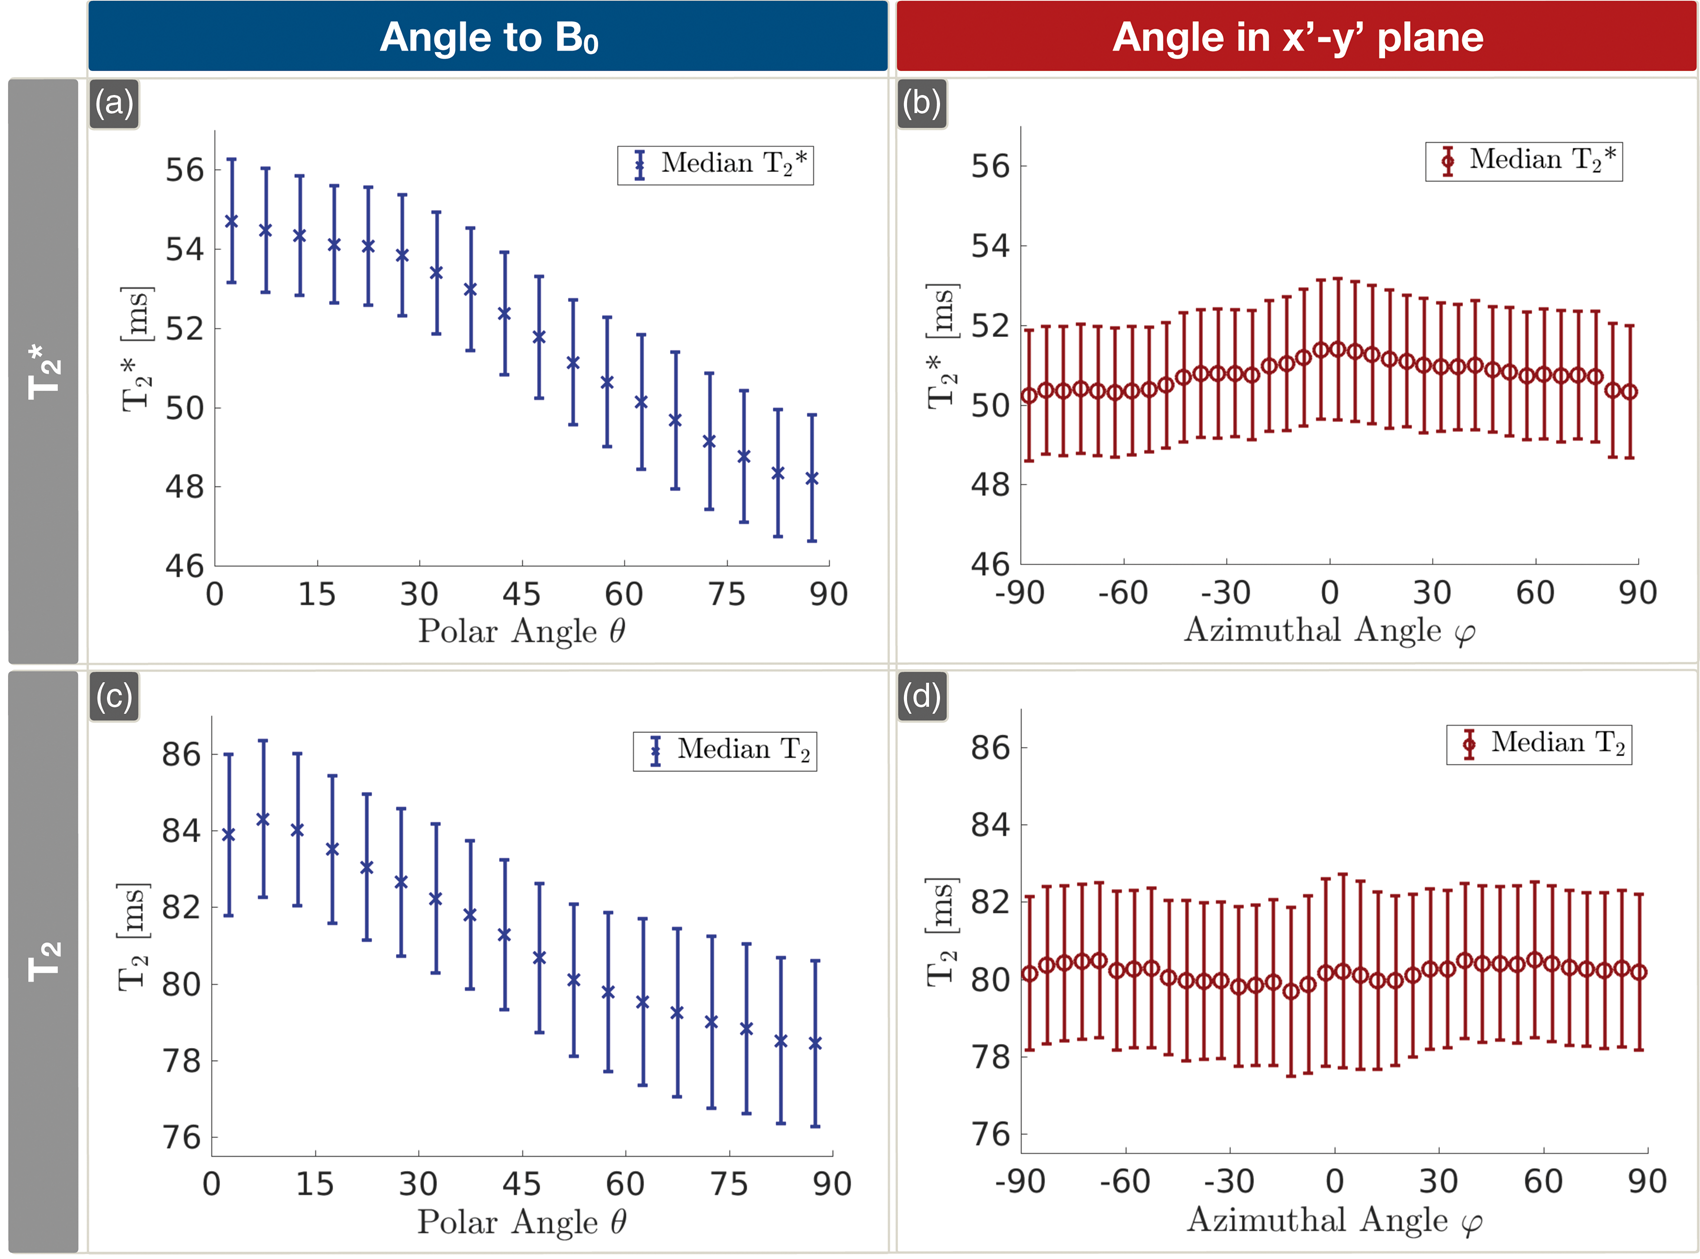
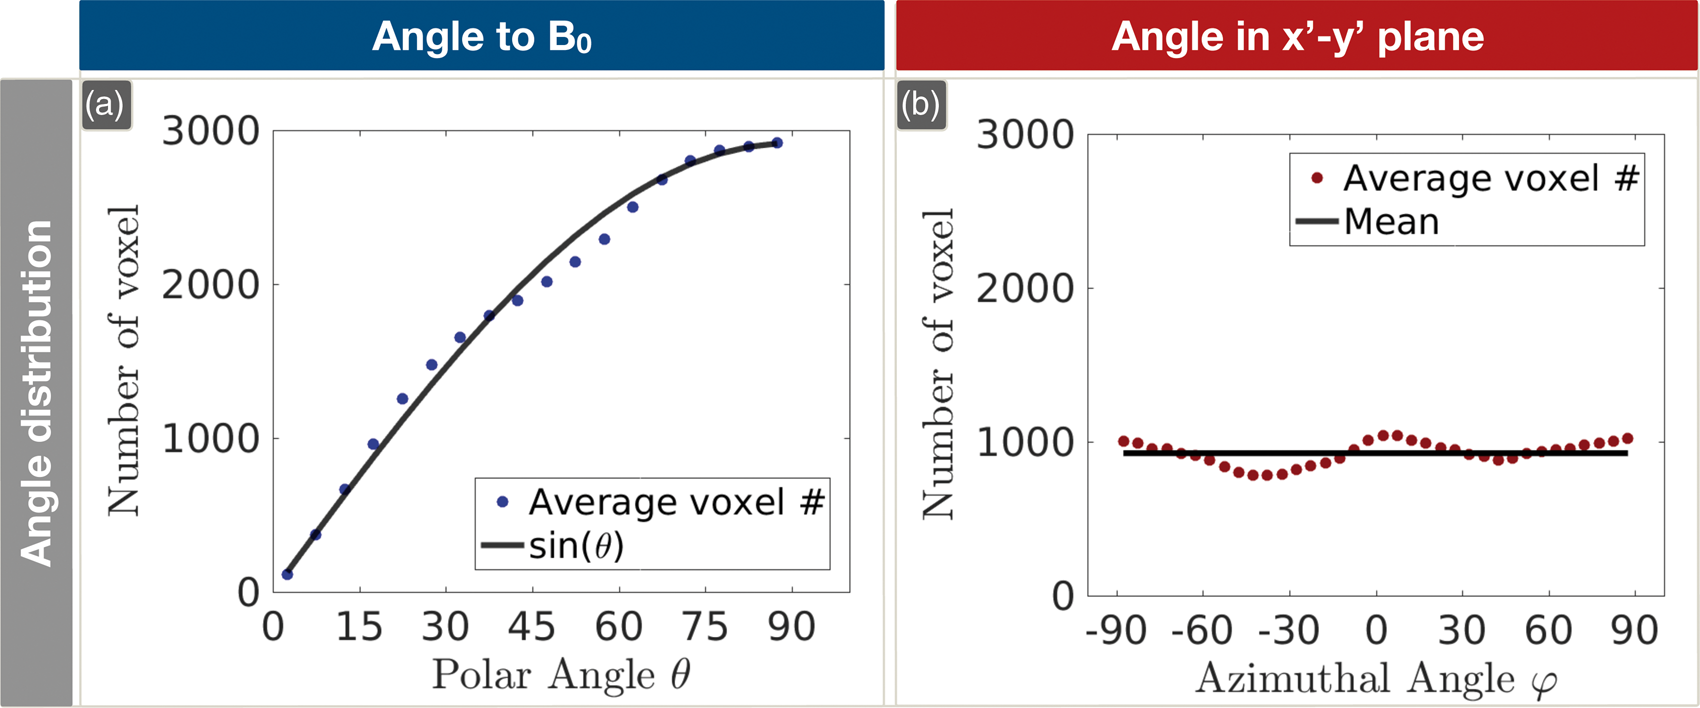
The distribution of the number of voxels within oriented WM contributing to the presented median values within the θ bins of 5° was well described by a sinusoidal curve (Figure 6(a)), indicating that fiber orientations towards the main magnetic field are almost homogenously distributed within the investigated volumes. Conversely, the voxel distribution depending on the azimuthal angle ϕ was almost constant, also indicating a homogenous distribution, with a slight preference for left-right and anterior-posterior orientations (Figure 6(b)).
Although the Fazekas-scores revealed a mean of 1.0 ± 0.9 (range 0–3, for details see Supplemental Table 1) indicating minor microangiopathic changes, none of the participants had subacute or older territorial infarct lesions. Including participants with Fazekas-scores above 1 had no obvious effect on the observed orientation dependencies (Supplemental Figure 2). Separate evaluations of the data from female and male participants did not reveal significant effects of gender on rOEF(θ) (Supplemental Figure 3). Additional measurements of
Fitting of Lee's model (equation (3)) to the median values of Fittings of all mq-BOLD-related parameters. All parameters were fitted with the same function (equation (3)). Median values on group-level and SDs are shown in blue, fitted curves are indicated by dashed orange lines. The fit parameters are noted in the red framed boxes (a, c–f). Analysis of the two sinusoidal fit components of 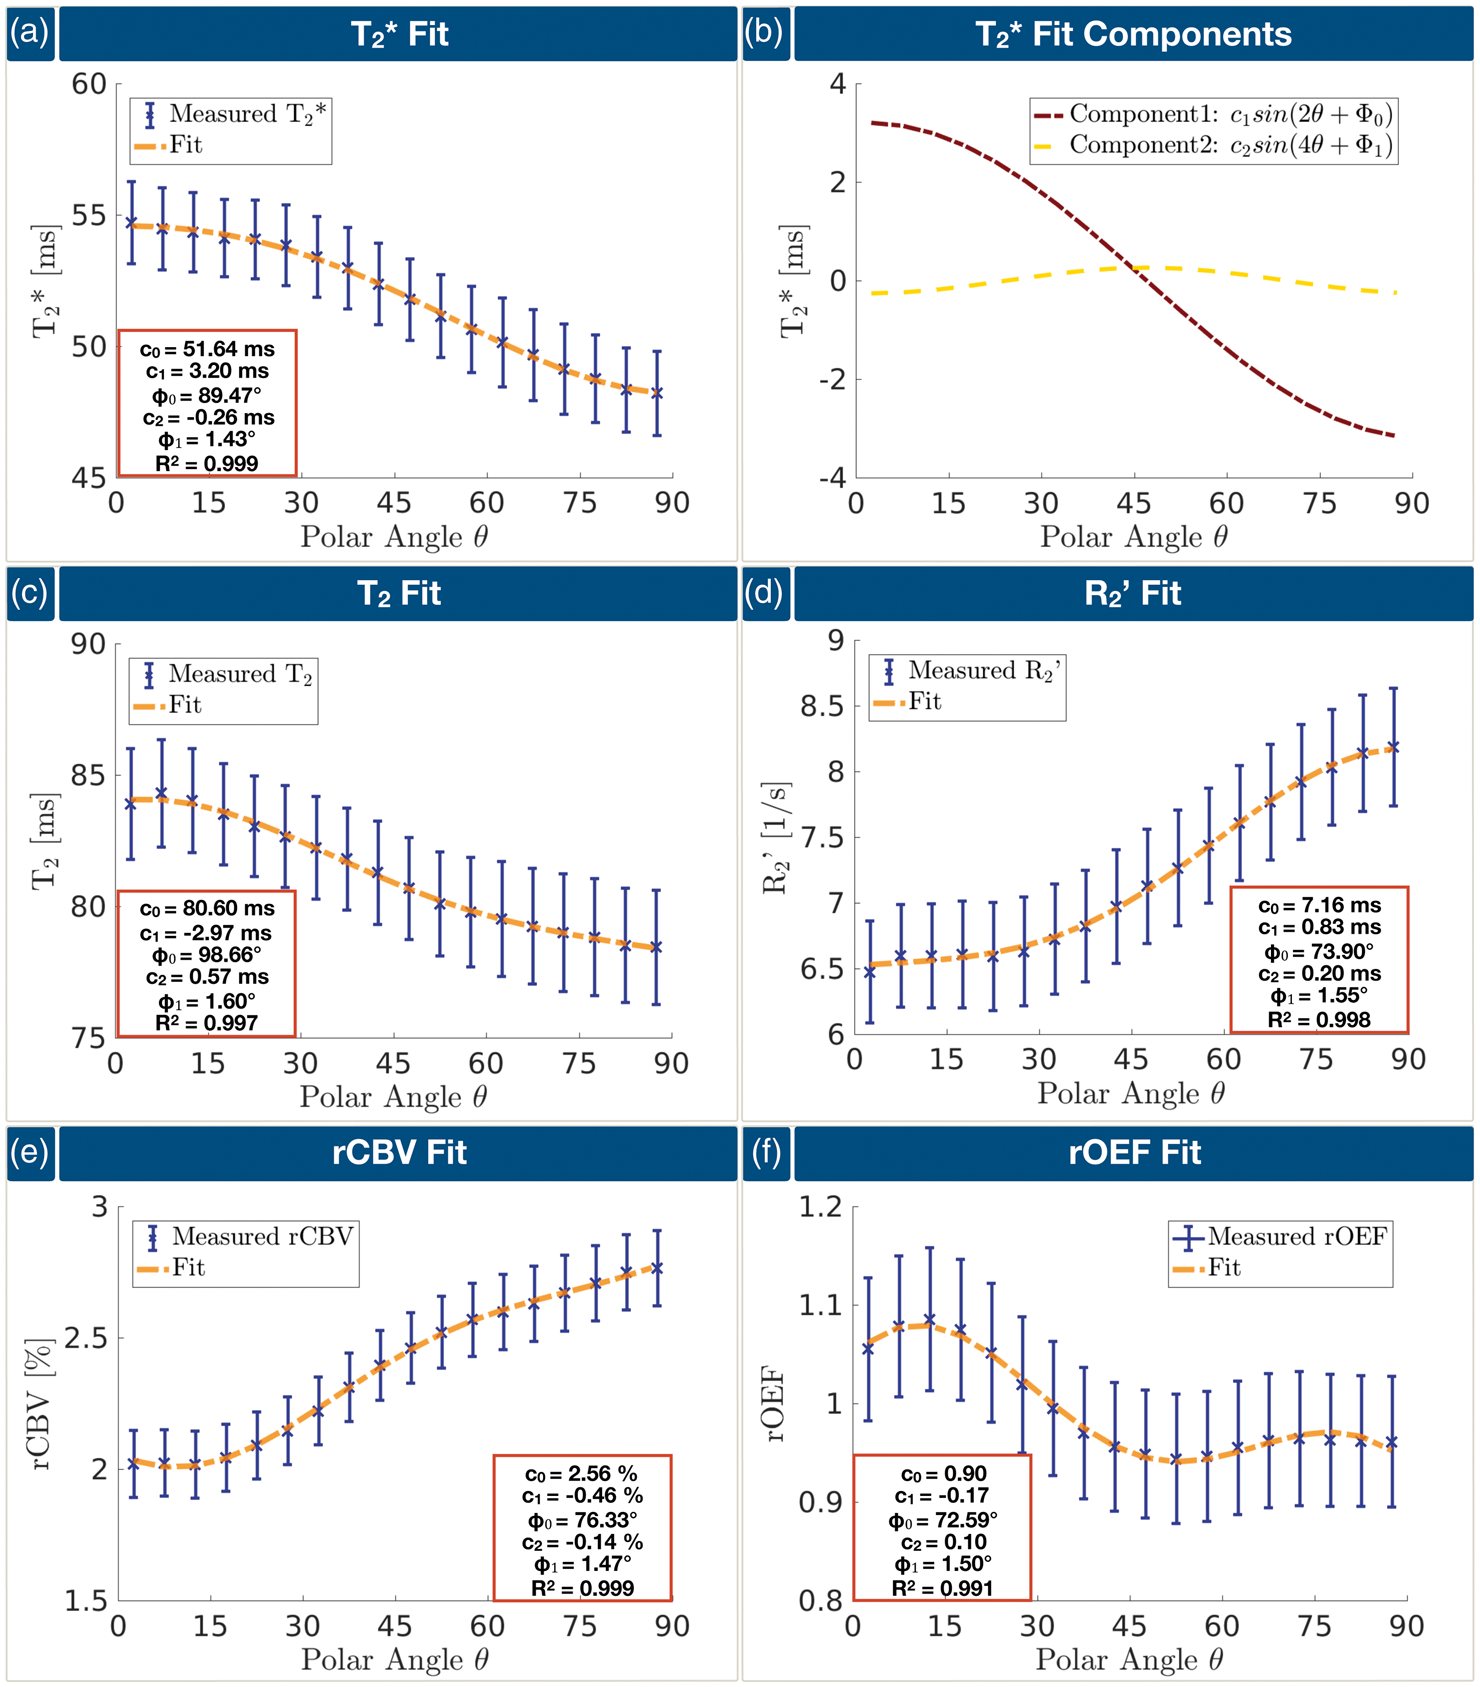
Discussion
In this study, we presented a DTI-based quantitative orientation analysis method using an automated coordinate system transformation to spherical coordinates and applied it to characterize anisotropy effects of mq-BOLD related parameter maps in WM. Orientation effects were measured for multiple parameters, namely
Influence of WM orientation on T
Our measured differences Δ
The major contributors to anisotropy effects driving orientation dependencies of effective transverse relaxation are still under discussion. Most likely, the angular dependencies are caused by sub-voxel susceptibility effects arising from anisotropic sources, namely highly ordered myelin-fiber structures12,17–24,57 and effects of oriented WM vasculature11,12,22 being preferentially aligned parallel to axonal-fibers.12–14
Lee's model (equation (3)) includes highly oriented cylinders, which can represent the fibers and vessels, as well as anisotropic susceptibility in the annular region, representing myelin.
24
Fitting Lee's model (equation (3)) to
Influence of WM orientation on T2
We also observed a strong T2(θ) orientation effect with ΔT2(θ) ≈ 6 ms or ΔR2(θ) ≈ 1 Hz in accordance with Oh et al. 20 Minor discrepancies to their ex vivo study can be explained by cell swelling as well as further molecular changes 18 in their formalin fixed tissue samples scanned at room temperature, which also influences the transverse relaxation rates. 20 Moreover, their study was conducted at 7T and they averaged over larger ROIs without actually measuring fiber orientation. While orientation dependencies can be expected to be more prominent at higher field strength, the latter rather decreases the observed effects.
Regarding origins of T2(θ) orientation effects, contributions from susceptibility effects are actually expected to be minimized by the GraSE refocusing pulses, in contrast to GRE-based
Application of Lee's model (equation (3)) to T2(θ) was further supported by Oh et al.,
20
who compared the anisotropic susceptibility model with pure magic angle effects of R2(θ) as well as a model of isotropic susceptibility in superposition with magic angle effects. In agreement with their data, pure magic angle effects cannot explain our measured T2(θ) dependency (see Figure 7(c)). In general, our fittings of
Influence of WM orientation on
Since, in our approach,
Influence of WM orientation on rCBV
As could be expected from the fact that DSC-MRI is based on
Again, fitting Lee's model (equation (3)) to rCBV(θ) revealed excellent agreement (Figure 7(e)). Interestingly, the ratio of the orientation-dependent fit coefficients c1 and c2 to the orientation independent coefficient c0 is much higher for the rCBV(θ) fitting compared to
Distribution of orientations
Even though the subvoxel WM structures are highly anisotropic, as indicated by high FA values within oriented WM (Figure 3), the orientations across all WM voxels are almost equally populated (Figure 6). Regarding the polar angle θ, measured voxel distributions closely resemble a sinusoidal shape, representing equal populations (Figure 6(a)). Those results are in accordance with data from a similar approach by Denk et al. 17 However, our results are even closer to equal population, which might be due to different FA thresholds, our additional WM and CSF thresholds, larger sample size, higher number of DTI gradient directions and improved, automated coordinate transformation. Analysis of the voxel distribution with respect to the azimuthal angle ϕ reveals almost equal population, too (see Figure 6(b)). However, angles around ϕ = 0° and ϕ = ±90° tend to be somewhat higher populated indicating a slight preference for fiber orientations in right-left and anterior–posterior orientations. Those findings are in accordance with DTI and histological examination of highly ordered structures such as the corpus callosum. 59
Previous studies analyzing orientation effects by voxel-wise parameter correlations with DTI investigated either only the polar angle12,17,29 or showed somewhat contra intuitive dependencies on the Euler angles relative to the x-axis and y-axis. 11 Those uncertainties could be resolved in our study by introducing spherical coordinates to describe the fiber orientation within the scanner coordinate system. Overall, the distribution of orientations underlines the successful implementation of the introduced automated coordinate system transformation. Moreover, it strongly indicates the validity of our DTI-based orientation analysis.
Influence of WM orientation on rOEF
A pronounced dependence of mq-BOLD-derived rOEF on θ was expected, since the contributing parameters
Possible limitations
Values of rOEF derived by mq-BOLD are systematically elevated, as previously reported.1,4,7,60 Furthermore, WM values (average rOEFWM = 0.94) are elevated compared to GM values (average rOEFGM = 0.60; for more details, see Supplemental Table 2). This contradicts PET-based OEF measurements, and primarily arises from systematic errors of the mq-BOLD method. While approximating the venous CBV by total DSC-based CBV certainly contributes to GM-WM contrast, systematic bias in T2 measurement mainly causes general overestimation. 1 Improved quantitative T2 mapping has already been demonstrated to statistically significantly reduce rOEF elevations towards lower, physiologically more realistic values. 61 In this study, we could demonstrate that orientation effects do not primarily contribute to neither rOEF elevations nor the GM-WM contrast. Despite of this and successful applications of mq-BOLD in different pathologies,1,4,7,60 future studies are necessary to further validate and improve the method. Furthermore, observed diffusion-dependent T2(θ) orientation effects indicate that the assumption of static dephasing in mq-BOLD might be violated. In any case, caution should be exercised when evaluating rOEF by mq-BOLD in WM. To minimize detrimental influences of unphysiological GM-WM contrast, mq-BOLD evaluations should not mix values from GM and WM.
Generally, the large variations of
Further limitations may apply. Measurements of
Influences of age and WM pathology on the observed orientation effects may be suspected. To limit application of contrast agent in DSC-imaging, we investigated orientation effects in the elderly control group, which was also acquired for a physiological MRI study.
8
Additional control analyses revealed that higher Fazekas-scores of some of our elderly participants have no obvious impact on the observed orientation effects (Supplemental Figure 2). This is in accordance with Haller et al. who concluded that periventricular FLAIR hyperintensities are in many cases not associated with demyelination.
65
In order to control for age effects on
Anisotropy effects of oriented susceptibility perturbations also depend on the magnetic field strength, where we expect stronger orientation dependencies with increasing B0. Furthermore, sequence-dependent influences may for example arise from the voxel size, as the aspect ratio in GRE was found to affect the sensitivity to veins and may thereby also influence measured orientation dependencies. 17
Another potential limitation is the scanning at only one head orientation. However, in vivo scanning at different head positions is experimentally very challenging and limited on both, reachable angles and the number of scanned angles. 17 In contrast, our investigation of tissue orientation effects based on analysis of DTI-data requires scanning at only one head position while deriving precise information about voxel-wise fiber orientations. Even though errors of DTI-based fiber orientation mapping induced by crossing fibers within single voxels cannot be corrected with the presented methodology, 32 thresholding of FA values reduced errors by excluding isotropic voxels.
A disadvantage of the DTI-based method may arise from patient movement between the mq-BOLD and the DTI acquisitions, but careful immobilization of the participant's head with foam pads and image coregistration could minimize motion-related errors. But in spite of careful inspection, small misalignments after coregistration cannot be ruled out completely. Nevertheless, the validity of the results is strongly supported by the excellent agreement of θ dependent fittings with previous studies.
Analysis of orientation effects assumes B0 to be parallel to the z′-axis in our as well as previous studies.11,12,17,28,29 However, magnetic field inhomogeneities, shimming and measurements off the iso-center may violate this assumption. Nevertheless, analysis of the azimuthal angle ϕ revealed independency on the fiber orientation perpendicular to B0, strongly indicating correct orientation analyses and generally high consistency of the presented data.
Partial volume effects are another potential error source affecting both, DTI orientation analysis and the mq-BOLD parameter estimates. However, those influences could be reduced by rigorous application of individual oriented WM masks excluding CSF.
Impact of orientation effects
Tissue microstructure orientation effects may have far reaching consequences on many MRI parameters in WM. While we demonstrated mq-BOLD-derived rOEF to be only moderately affected by WM orientation effects,
A promising method to further disentangle orientation effect origins by myelinated nerve fibers and oriented vessels is cortical surface modeling of GM. 67 Veins can be modelled depending on the cortical surface orientation to exclusively characterize vessel-related orientation effects.
Conclusion
Our results demonstrate reliable in vivo characterization of WM anisotropy effects in mq-BOLD imaging with high sensitivity at reasonable scan time. We confirmed strong dependencies of transverse relaxation and rCBV on the nerve fiber orientation towards B0. In contrast, observed orientation effects in rOEF values are comparably low in our healthy, elderly cohort indicating an average orientation induced variation of 3.8%. This is due to a partial compensation of anisotropy effects in
Supplemental Material
Supplemental Material1 - Supplemental material for Characterizing white matter fiber orientation effects on multi-parametric quantitative BOLD assessment of oxygen extraction fraction
Supplemental material, Supplemental Material1 for Characterizing white matter fiber orientation effects on multi-parametric quantitative BOLD assessment of oxygen extraction fraction by Stephan Kaczmarz, Jens Göttler, Claus Zimmer, Fahmeed Hyder and Christine Preibisch in Journal of Cerebral Blood Flow & Metabolism
Supplemental Material
Supplemental Material2 - Supplemental material for Characterizing white matter fiber orientation effects on multi-parametric quantitative BOLD assessment of oxygen extraction fraction
Supplemental material, Supplemental Material2 for Characterizing white matter fiber orientation effects on multi-parametric quantitative BOLD assessment of oxygen extraction fraction by Stephan Kaczmarz, Jens Göttler, Claus Zimmer, Fahmeed Hyder and Christine Preibisch in Journal of Cerebral Blood Flow & Metabolism
Supplemental Material
Supplemental Material3 - Supplemental material for Characterizing white matter fiber orientation effects on multi-parametric quantitative BOLD assessment of oxygen extraction fraction
Supplemental material, Supplemental Material3 for Characterizing white matter fiber orientation effects on multi-parametric quantitative BOLD assessment of oxygen extraction fraction by Stephan Kaczmarz, Jens Göttler, Claus Zimmer, Fahmeed Hyder and Christine Preibisch in Journal of Cerebral Blood Flow & Metabolism
Supplemental Material
Supplemental Material4 - Supplemental material for Characterizing white matter fiber orientation effects on multi-parametric quantitative BOLD assessment of oxygen extraction fraction
Supplemental material, Supplemental Material4 for Characterizing white matter fiber orientation effects on multi-parametric quantitative BOLD assessment of oxygen extraction fraction by Stephan Kaczmarz, Jens Göttler, Claus Zimmer, Fahmeed Hyder and Christine Preibisch in Journal of Cerebral Blood Flow & Metabolism
Supplemental Material
Supplemental Material5 - Supplemental material for Characterizing white matter fiber orientation effects on multi-parametric quantitative BOLD assessment of oxygen extraction fraction
Supplemental material, Supplemental Material5 for Characterizing white matter fiber orientation effects on multi-parametric quantitative BOLD assessment of oxygen extraction fraction by Stephan Kaczmarz, Jens Göttler, Claus Zimmer, Fahmeed Hyder and Christine Preibisch in Journal of Cerebral Blood Flow & Metabolism
Footnotes
Funding
The author(s) disclosed receipt of the following financial support for the research, authorship, and/or publication of this article: This work was supported by the Friedrich-Ebert-Stiftung (grant to SK), the Dr.-Ing. Leonhard Lorenz-Stiftung (grant to JG: 915/15), by the Faculty of Medicine of the Technical University of Munich (grant to JG: KKF E12), by a postdoc fellowship of the German Academic Exchange Service (DAAD) (grant for JG) and the German Research Foundation (DFG) – Project number PR 1039/6-1 (grant to CP). FH was supported by NIH grants (R01 MH-067528, R01 NS-100106, P30 NS-052519).
Acknowledgements
We thank Andreas Hock (Philips Healthcare, Hamburg, Germany) for his support with the DTI orientation transformation.
Declaration of conflicting interests
The author(s) declared no potential conflicts of interest with respect to the research, authorship, and/or publication of this article.
Author's contributions
SK: study design, data acquisition, data analysis, interpretation of the results, manuscript writing.
JG: data acquisition, data analysis, interpretation of the results, manuscript editing.
CZ: study design, study supervision.
FH: interpretation of the results, manuscript editing.
CP: study design, study supervision, interpretation of the results, manuscript editing.
References
Supplementary Material
Please find the following supplemental material available below.
For Open Access articles published under a Creative Commons License, all supplemental material carries the same license as the article it is associated with.
For non-Open Access articles published, all supplemental material carries a non-exclusive license, and permission requests for re-use of supplemental material or any part of supplemental material shall be sent directly to the copyright owner as specified in the copyright notice associated with the article.