
Abstract
Measurements of cerebral perfusion using dynamic susceptibility contrast magnetic resonance imaging rely on the assumption of isotropic vascular architecture. However, a considerable fraction of vessels runs in parallel with white matter tracts. Here, we investigate the effects of tissue orientation on dynamic susceptibility contrast magnetic resonance imaging. Tissue orientation was measured using diffusion tensor imaging and dynamic susceptibility contrast was performed with gradient echo planar imaging. Perfusion parameters and the raw dynamic susceptibility contrast signals were correlated with tissue orientation. Additionally, numerical simulations were performed for a range of vascular volumes of both the isotropic vascular bed and anisotropic vessel components, as well as for a range of contrast agent concentrations. The effect of the contrast agent was much larger in white matter tissue perpendicular to the main magnetic field compared to white matter parallel to the main magnetic field. In addition, cerebral blood flow and cerebral blood volume were affected in the same way with angle-dependent variations of up to 130%. Mean transit time and time to maximum of the residual curve exhibited weak orientation dependency of 10%. Numerical simulations agreed with the measured data, showing that one-third of the white matter vascular volume is comprised of vessels running in parallel with the fibre tracts.
Keywords
Introduction
Perfusion measurements of the brain are widely used in research and clinical imaging. 1 With widespread availability, magnetic resonance imaging (MRI) has become a frequently used method for assessing cerebral blood perfusion. Perfusion measurements with MRI offer good spatial and temporal resolution while ionizing radiation is not required. An important MRI technique for the assessment of cerebral tissue perfusion is dynamic susceptibility contrast (DSC) imaging, which uses the administration of a paramagnetic contrast agent (CA) during the repeated acquisition of a rapid imaging technique that is sensitive to the CA.2,3 The MRI DSC scan is usually a series of gradient echo planar scans with a repetition time between 1 and 2 s, which is shorter than the time needed for a CA to transit through the brain so that the CA dynamics can be visualized. The CA's paramagnetic properties lead to a reduction of the gradient echo signal due to the generation of magnetic field inhomogeneities around blood vessels containing the CA. The signal reduction is thought to be proportional to the CA concentration within the tissue of interest. Using pharmacokinetic models, 3 important hemodynamic parameters can be computed from the measured signal time series in cerebral tissue: cerebral blood flow (CBF), cerebral blood volume (CBV), mean transit time (MTT), and time to peak, or the time to maximum of the residue function (Tmax). These parameters depend on physiological parameters, such as haematocrit, cardiac output, and regional blood volume and flow. In addition, the measured values also depend on technical parameters, such as type of CA, the way it is administered, and the type of MRI sequence, magnetic field strength, as well as other data acquisition parameters. The calculation of absolute perfusion parameter values, especially of CBF and CBV requires knowledge of the CA concentration over time in the arteries feeding into the tissue of interest, the so-called arterial input function (AIF). The AIF represents the deviation of the bolus from the ideal delta-function-shaped bolus. Deconvolution of the concentration time curve with the AIF results in the residue function, which is corrected for the AIF contribution and describes the fraction of tracer present in the capillaries at each time point. The residue function is typically used for the calculation of quantitative perfusion parameters, such as CBF and CBV.
The pharmacokinetic models used for calculation of perfusion parameters maps from DSC MRI assume a spatially isotropic vascular architecture, so that the orientation of the vascular bed relative to the main magnetic field can be neglected. However, if the vascular network is not isotropic, the orientation of the anisotropic component, e.g. a large vessel traversing the imaging voxel starts to play a role in the signal reduction. Orientation effects of single blood vessels have been investigated extensively in the context of venography based on susceptibility-weighted imaging (SWI).4–6 In SWI, the paramagnetic venous blood is used as an intrinsic CA to map venous vasculature in high detail. Due to the field inhomogeneities created by a vein, 7 the magnetization of a voxel containing a vein loses coherence more rapidly than a voxel without a vein. With increasing angle between the vein and the main magnetic field, the field inhomogeneities around the vessel become more pronounced and the signal decreases more rapidly. Due to this effect, vessels with diameters less than 100 µm can be imaged at 3T using an SWI scan with a spatial resolution of 0.25 mm3. 8 In DSC, which uses much larger voxel sizes in the range of 20 mm3, the vasculature within a voxel has been assumed to be isotropic and potential orientation effects have not been investigated so far. However, there is evidence that white matter (WM) blood vessels do not form a perfectly isotropic vascular tree, but rather have a tendency to run in parallel with the WM tracts. Nonaka et al. presented postmortem images of WM vessels with considerable anisotropy.9,10 Detailed images of vessels in a rodent model of ischaemia also provide evidence of vessels running in parallel with WM fibres. 11 It was also shown that the blood oxygenation level dependency (BOLD) of the T2*-weighted MR signal depends strongly on the orientation of the cortical tissue. 12 Finally, maps of perivascular spaces exhibit anisotropic vascular trees that resemble fibre tracts mapped with diffusion tensor imaging (DTI). 13
It is impossible to directly map the orientation of very small vessels and difficult to map medium-sized (30–200 µm) vessels in the human brain in vivo. If, however, vessels are assumed to run in parallel with WM tracts, their orientation can be assessed indirectly at high angular precision using DTI. The purpose of this study was, therefore, to combine gradient echo DSC and DTI to investigate tissue orientation effects on DSC measurements.
Methods
Standard protocol approval, registrations and patient consents
This study was approved by the Clinical Research Ethics Board of the University of British Columbia (H12-01153, 20 June 2012) and is in accord with the Declaration of Helsinki. All subjects gave written informed consent.
Subjects
Thirteen patients with multiple sclerosis (eight relapsing remitting; three secondary progressive; two primary progressive; nine female; EDSS = 2.5–5, median = 4; age = 44–61 years, median = 53 years; disease duration = 4–42 years, median = 20 years) were included in this study.
Data acquisition
MRI scans and their parameters.
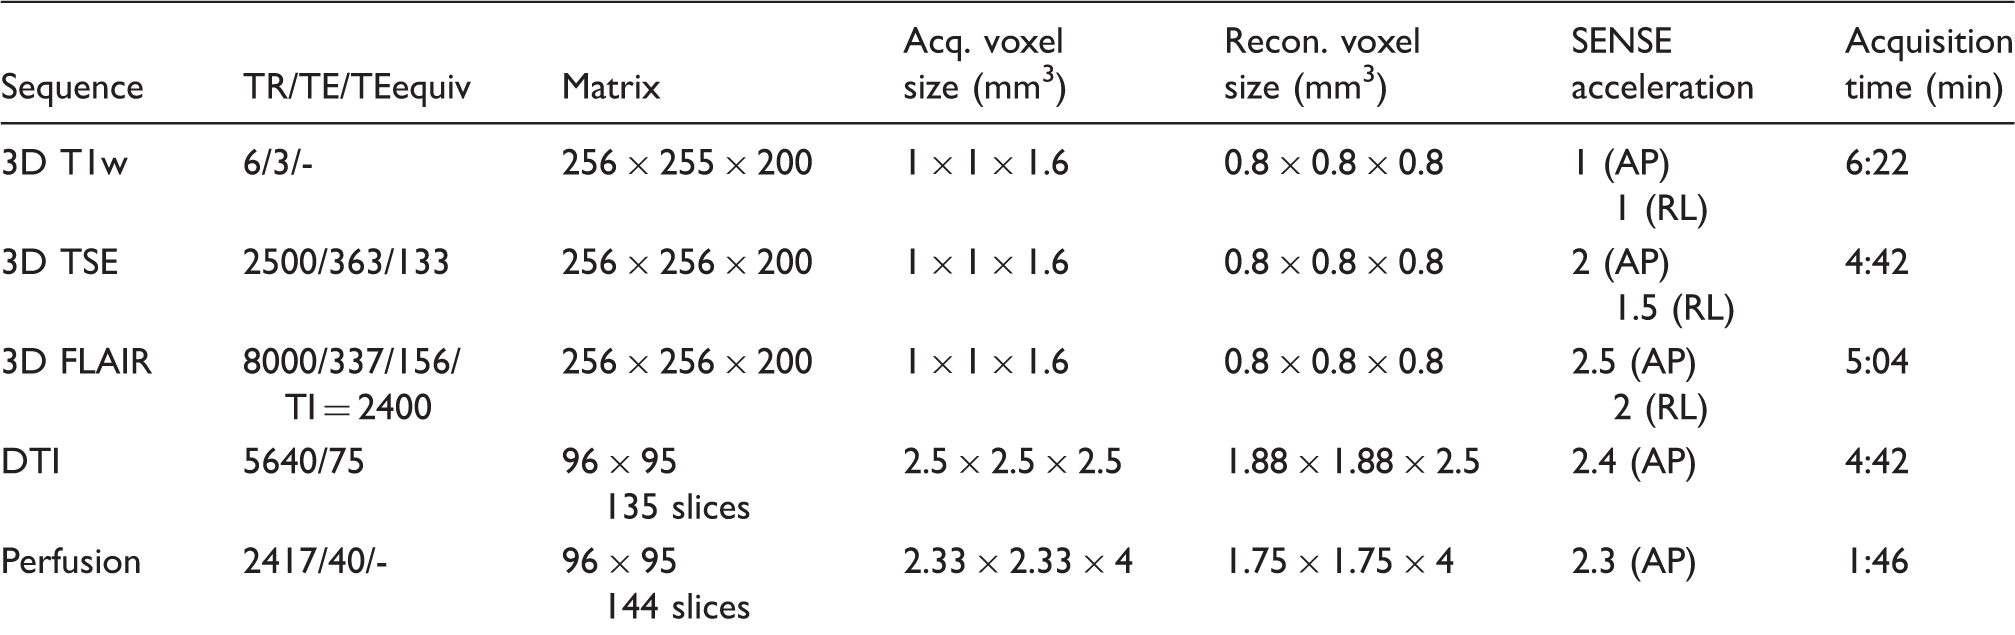
DTI: diffusion tensor imaging; FLAIR: fluid attenuated inversion recovery; TSE: turbo spin echo scan.
Data processing
DTI data were processed using FMRIB Software Library (FSL).14,15 Eddy current and head motion correction of DTI data were performed via a linear registration (FLIRT) and non-brain voxels were removed using FSL's brain extraction tool. Eigenvalues and their corresponding eigenvectors were calculated using FSL's DTIFIT. T1w and TSE were linearly registered to the DTI space using FLIRT. The combination T1wTSE = (T1w - TSE) / (T1w + TSE) enhances contrast between WM, grey matter (GM) and subcortical structures 16 and was used for tissue segmentation with FSL's FAST, using the non-binary partial volume maps with a threshold of 0.95 for WM. Maps of the angle between the main magnetic field and the principal diffusion direction of every voxel as a measure of local fibre orientation were computed spanning angles between 0 ° and 90 °. 17
For quantitative evaluation of the angle dependency of perfusion parameters, the DSC datasets were processed using the software tool AnToNIa.
18
Briefly, an in-slice rigid registration was used for motion correction. After this, each DSC signal intensity curve S(t) was converted to a relative transverse relaxivity curve 

Perfusion maps were registered to DTI using FLIRT. Voxels with orientations within 5 ° intervals were pooled and averaged and then used to calculate Numerical simulation of an isotropic vascular network and one large vessel. Vessels with a normal distribution of radii (mean = 13.4 µm, standard deviation of 2.1 µm) were simulated. The orientations ranged from 0 ° to 90 °. The large vessel has a radius of 68 µm and an orientation of 90 ° to the external magnetic field. For blood volumes encountered in the human brain, the distance between vessels can be regarded large in comparison to the vessel diameter. Therefore, small changes in individual vessels' positions had no influence on the result of the simulation.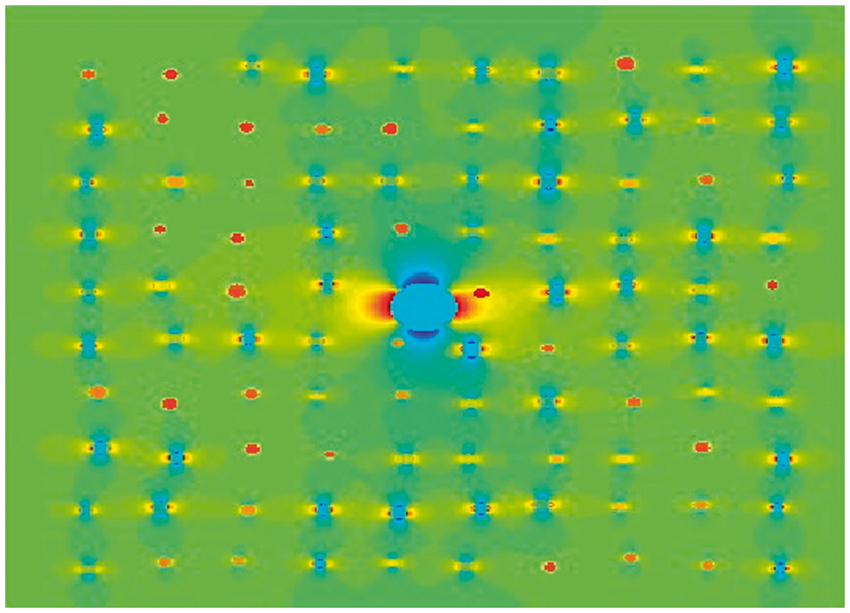
Numerical simulations
Numerical simulations of the change in DSC signal due to the presence of a CA were performed using Matlab (R2012b). In order to understand the effects of vascular architecture on the DSC signal, simulations were performed for anisotropic vessels embedded in an isotropic vascular bed and for different CA concentrations. All parameters are given in SI units. Simulations were conducted for a DSC gradient echo time of 40 ms and a field strength of 3 T. Separate simulations were performed for single blood vessels, for isotropic vascular networks and finally for combinations of single vessels and networks. For each orientation of the large vessels with respect to the main magnetic field,
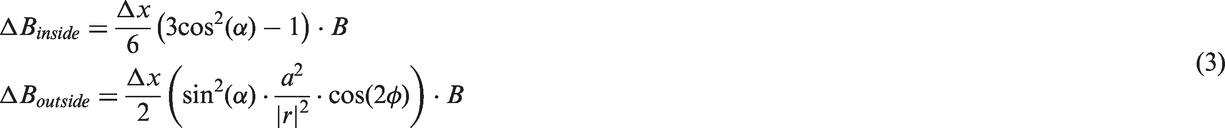
The field inside and outside blood vessels was computed according to

The vascular network was simulated in two dimensions on a quadratic grid as a large number of non-intersecting vessels with orientations distributed uniformly between 0 ° and 90 ° and diameters distributed normally around 13.7 µm with a standard deviation of 2.1 µm, according to Jochimsen et al.
25
The magnetization at a certain echo time t and at a location 

The baseline signal S0 was computed for vessels with venous blood only, i.e. no added CA. The changes in
Results
Measurements
The concentration time curve of the brain's WM showed a dependency on fibre orientation with increasing signal reduction for increasing angles between WM and the main magnetic field (Figure 2). There was also a variation of about 5% in the baseline signal depending on fibre orientation. For WM fibre orientations between 0 ° and 5 ° (i.e. parallel to B0) the reduction at peak CA concentration was about 22%, whereas for fibres perpendicular to B0 the reduction was almost 80% larger with 38% signal loss compared to baseline.
Signal reduction for one subject as a function of CA concentration for voxels with different WM tissue orientation. With increasing angle between the tissue and the main magnetic field, the reduction becomes larger. Note also that there are small angle-dependent variations of up to 5% in the baseline signal. The inset shows a zoomed view of the concentration time curves around the maximum CA concentration.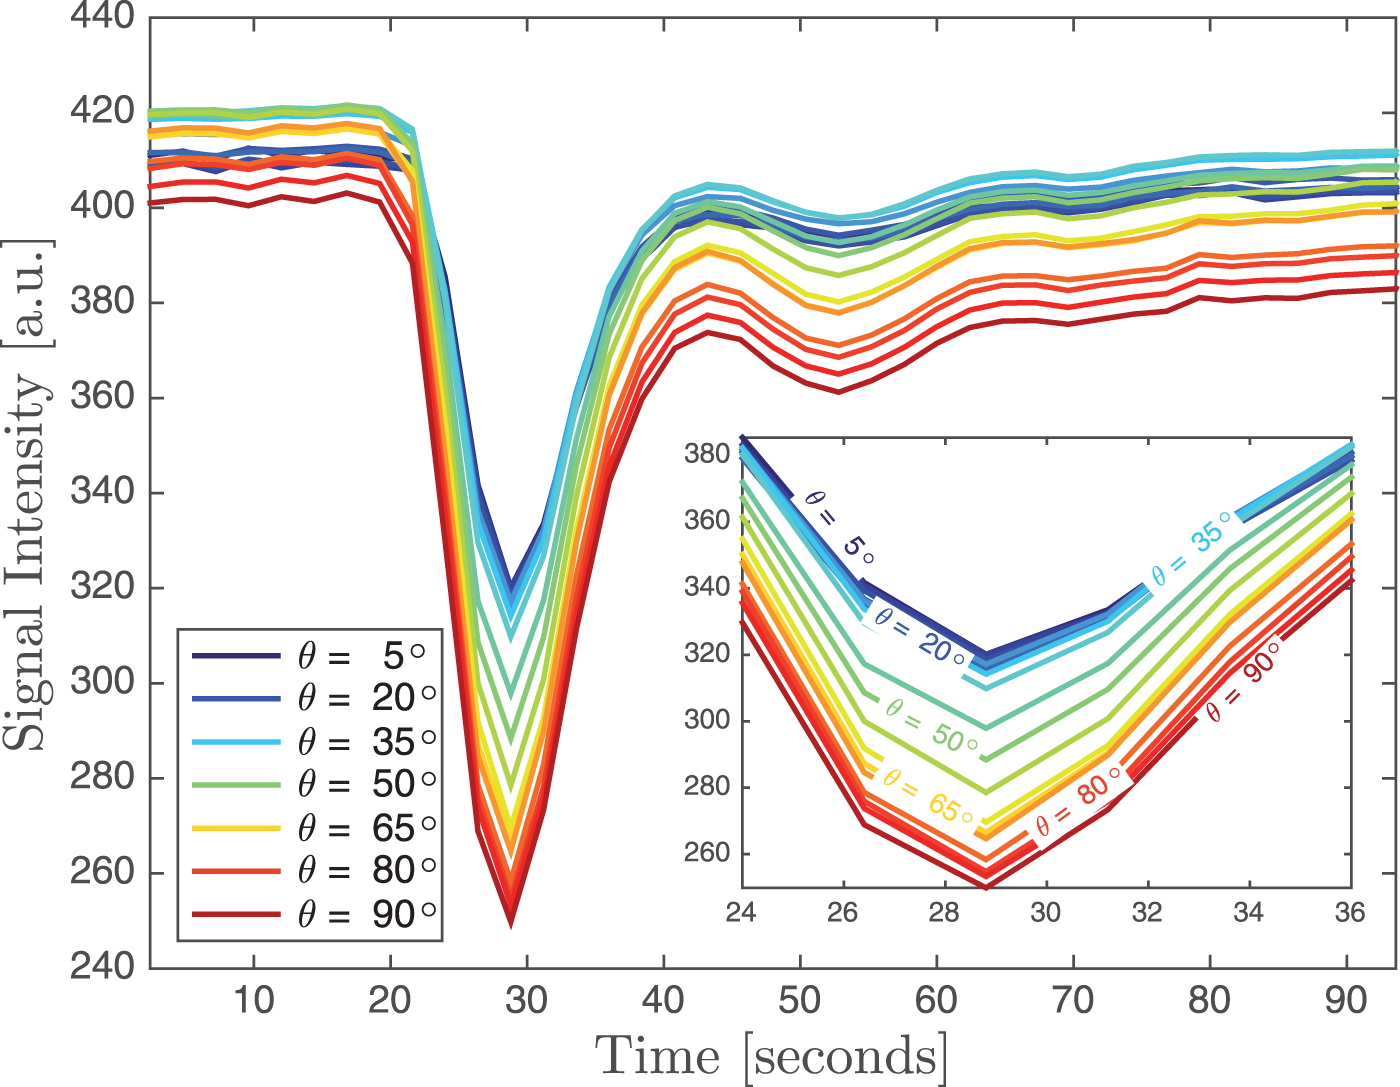
The change in (a) Changes in 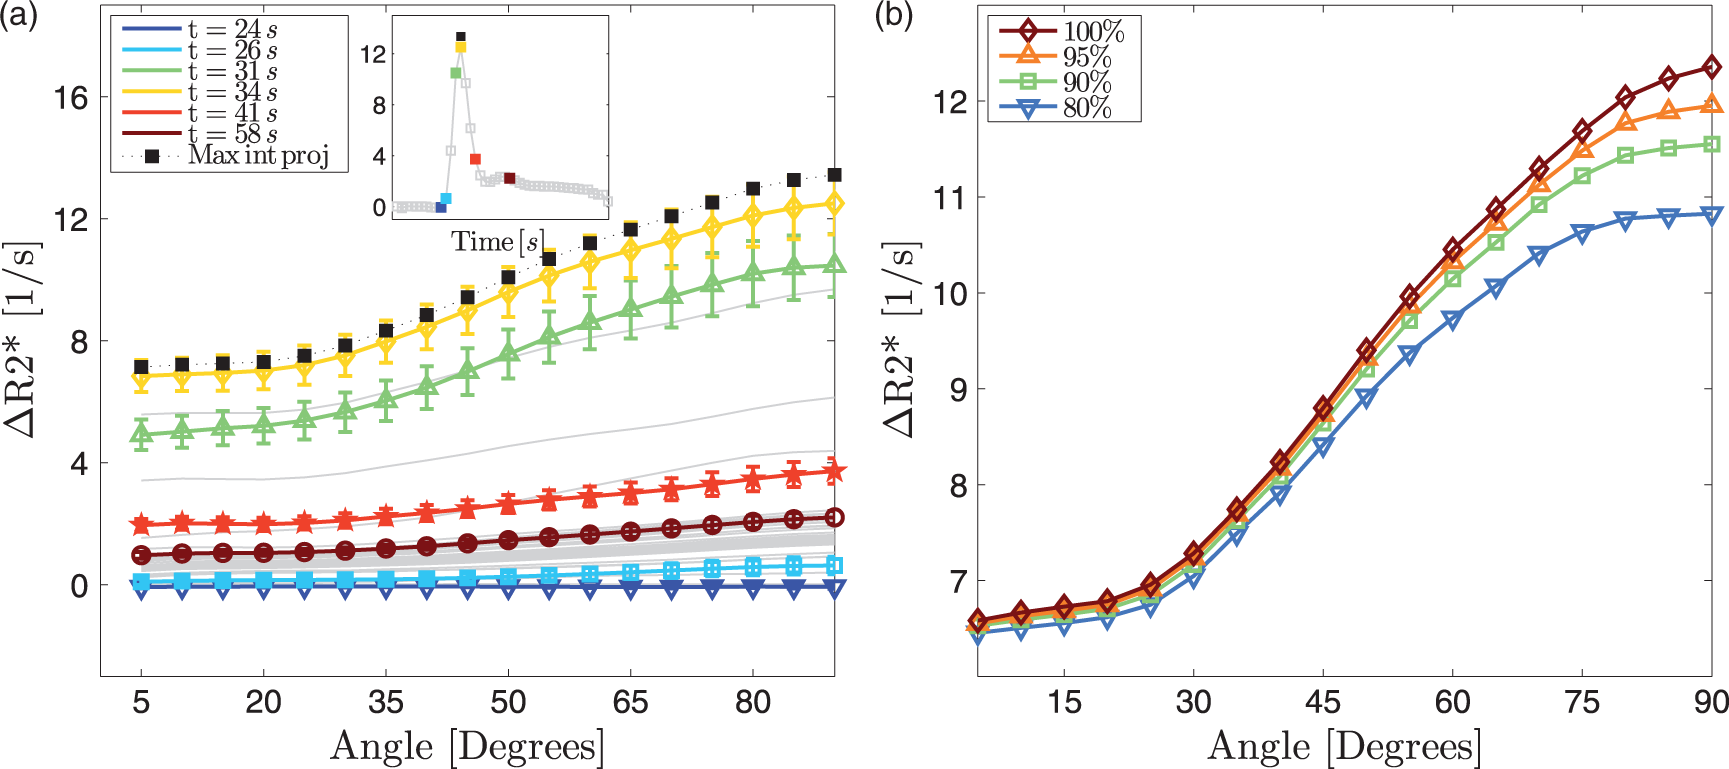
The orientation dependency in Orientation dependency in CBV (a), CBF (b), MTT (c) and Tmax (d) in the same subjects shown in Figure 3. Again, there is a large orientation dependency and considerable inter-subject variability in CBV and CBF. The orientation dependency in MTT and Tmax is small at around 10%. The thick black lines are the averages across the 13 subjects.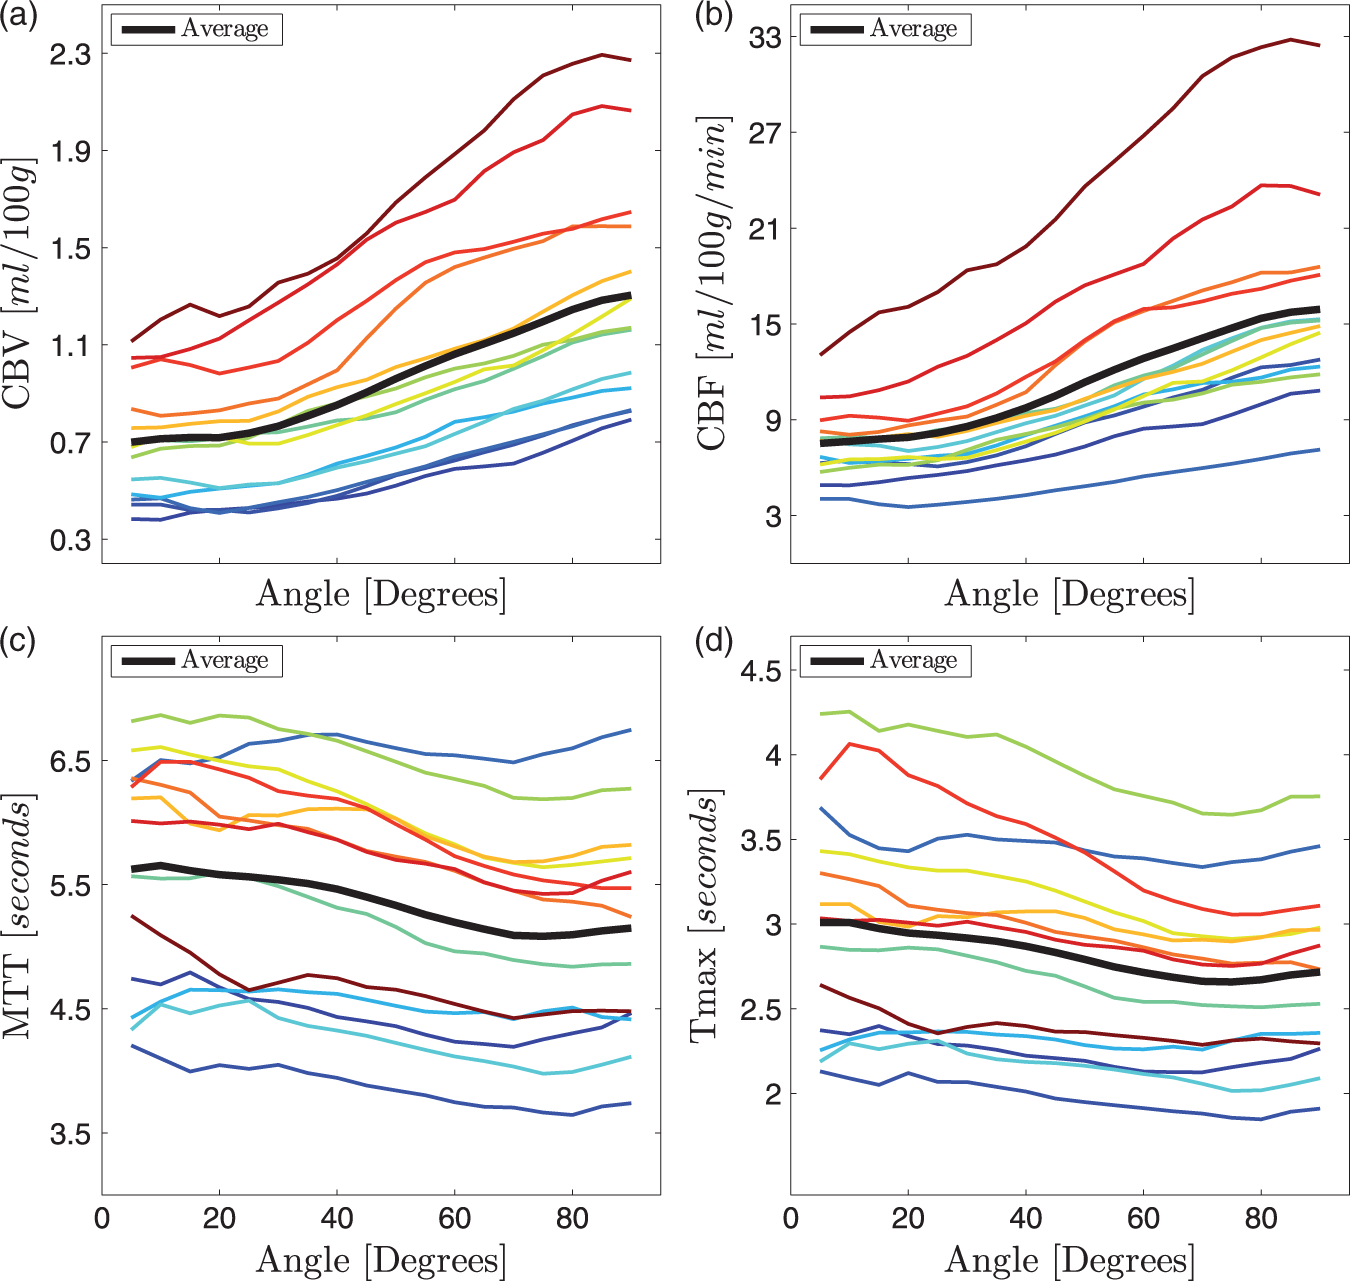
Numerical simulations
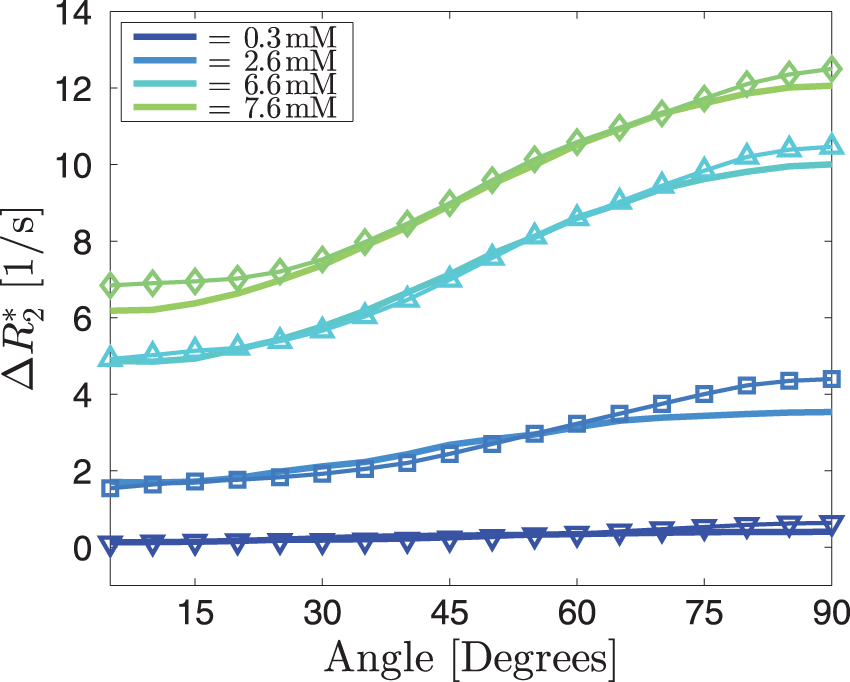
Simulations for one very small vessel in the centre of the voxel, with no isotropic vascular background, show how (a) Simulations of The thin lines represent the average angle dependencies across 13 subjects for four different CA concentrations. The thick lines are the best fits, resulting in a background blood vessel volume fraction of 1.0% and an anisotropic blood vessel volume fraction of 1.0%. The resulting CA concentrations are 0.3, 2.6, 6.6 and 7.6 mM. The anisotropic part was simulated assuming four parallel vessels of equal radius.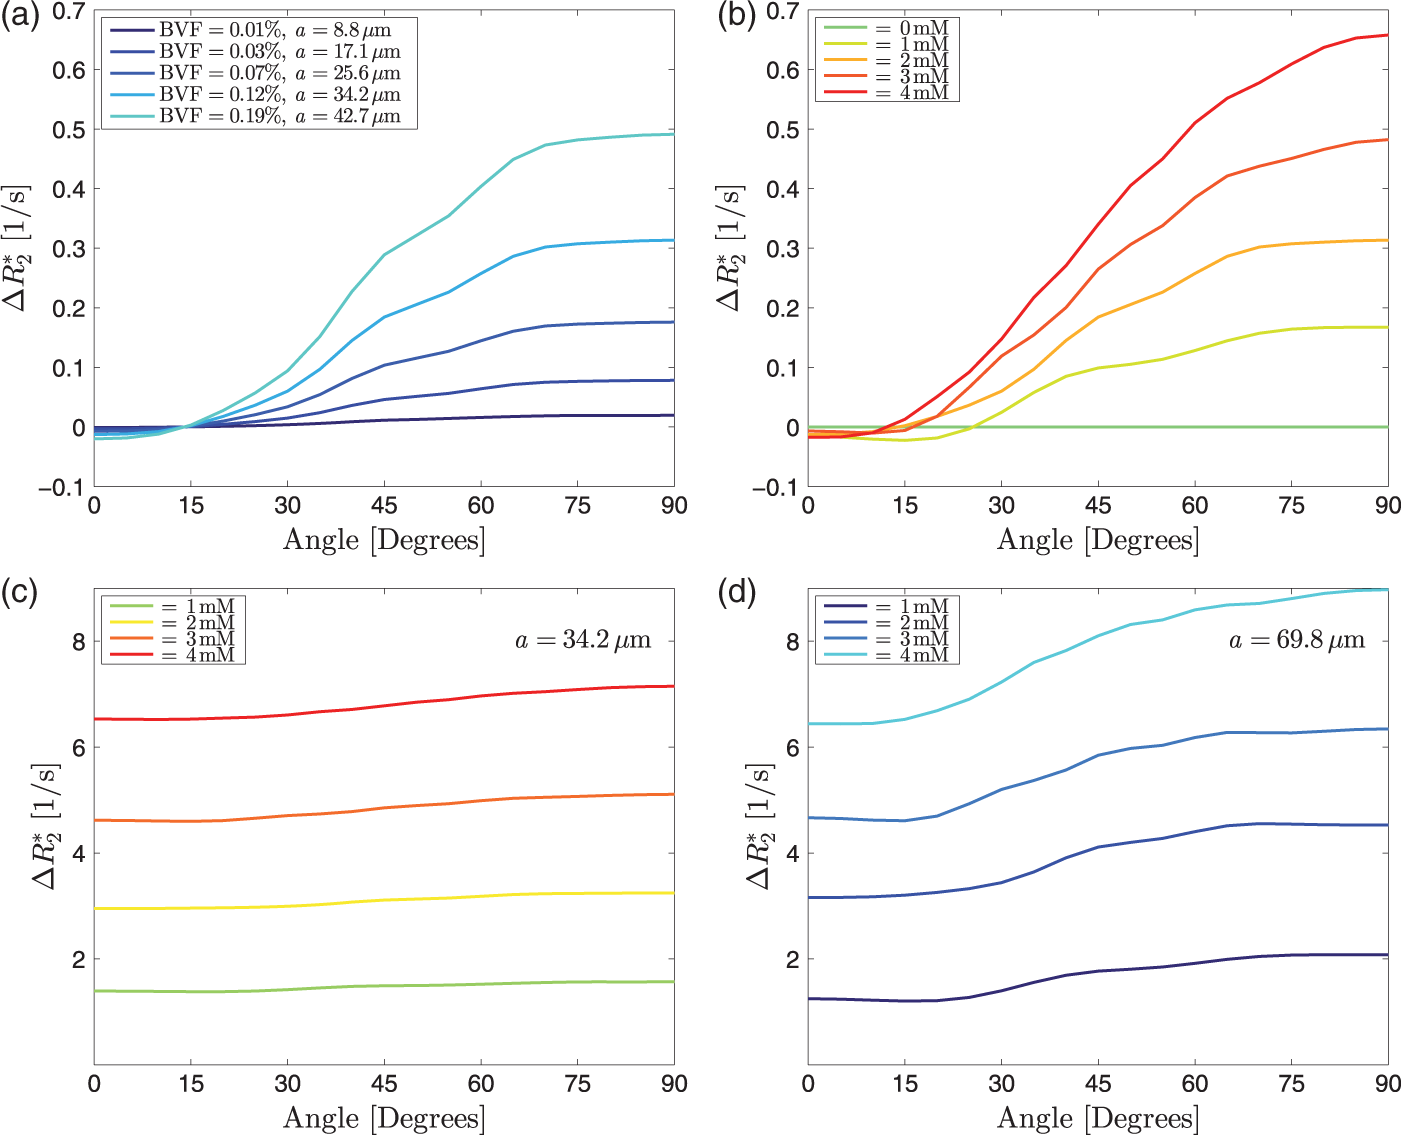
Discussion
We found a strong relationship between WM fibre orientation measured with DTI and perfusion parameters measured with gradient echo DSC imaging while the temporal perfusion parameters MTT and Tmax showed only slight orientation dependency. The most likely explanation for this phenomenon consistent with current scientific knowledge and with our numerical simulations is that a considerable proportion of the vascular network in WM runs in parallel with the fibre tracts that are mapped with the DTI scan. The measured data are in good agreement with our numerical simulations of an isotropic vascular network combined with blood vessels that run in parallel with the WM fibres. Simulations for the isotropic background alone were not able to explain the angle dependency. Simulations for a single vessel or a few vessels running in parallel, on the other hand, were not able to explain the CA-dependent offset in
For small angles and for single vessels parallel to the WM, the changes in
WM vasculature has been described histologically, with positron emission tomography (PET) and with MRI. Histologically, vascular density in WM was shown to be reduced compared to GM. 28 Studies using PET, the gold standard, report CBV of 2.6 ml/100 g in WM and 4.6 ml/100 g in GM. 29 Using MRI, Jochimsen et al. showed that vessel density in WM is about half of the density in GM and that the average vessel radius is about 13.5 µm in both GM and WM. 25 Using spin echo DSC, Helenius et al. 30 reported a CBV of 1.3 ml/100 g tissue for WM and 4.6 ml/100 g tissue for GM, while Arakawa et al. reported a CBV of 1.44 ml/100 g tissue for normal WM and 1.86 ml/100 g tissue for normal GM. 31 However, both studies did not report on potential anisotropy of WM vasculature. The work by Nonaka and colleagues presents some spectacular images on the vascular anatomy of the subcortical and deep WM.9,10 These authors report large blood vessels passing through the cortex and continuing through the WM towards the ventricular angle. Figure 1 in Nonaka et al. 9 shows considerable anisotropy for larger vessels in the WM, whereas the GM exhibits a more isotropic vascular tree. Blood vessel anisotropy in WM was also reported in a rodent model of ischaemia. 11
The numerical simulation of susceptibility and relaxation effects of the CA on the MRI signal for different geometries was able to explain the effects of tissue (i.e. vessel) orientation on the DSC signal. Only a combination of an isotropic background and anisotropic vessels was able to explain the observed changes in signal with changing tissue orientation. The simulation was kept simple in the sense that it was performed for two-dimensional voxels and that it did not take the effects of diffusion or extravasation of CA into account. Semmineh et al. also showed that
In addition to the considerable angle dependency in
Our findings have far-reaching consequences for gradient echo-based perfusion mapping of WM. The results of previous studies may have to be interpreted with caution. For instance, comparisons to contralateral WM would have to be controlled for the presence and orientation of venous vessels. 34
In contrast to the CBV and CBF parameters, only minimal influence of the tissue orientation was found for the temporal parameters Tmax and MTT. This finding can be explained by the fact that tissue orientation has an effect on the magnitude of the measured signal but doesn't lead to a dispersion or delay of the CA bolus. This conclusion is especially relevant for the image-based analysis of patients with an acute ischaemic stroke where DSC PWI is typically used to determine the tissue at risk of infarction using the Tmax parameter. 35 Thus, it can be argued that no correction for tissue orientation is necessary for Tmax and MTT and the established procedure as well as findings of previous studies using the Tmax or MTT parameter are not affected by differences in tissue orientation.
In the present study, there were large differences in CBV and CBF between subjects. These may be due to imperfect measurements of AIF, due to actual physiological differences, or due to orientation dependency of the AIF itself.36–38 The cohort consisted of patients with multiple sclerosis of various disease duration and severity as well as different WM lesion load. These factors likely play a role in the observed differences. Nevertheless, the relative changes associated with tissue orientation are still comparable between the subjects (see Figure 4) so that it can be argued that the absolute differences between subjects have no influence on the general findings of this study. It should be noted that we did not normalize the perfusion measurements on a patient per patient basis. Our cohort was too small to perform a systematic analysis and comparison with clinical presentation. However, the orientation-dependent analysis of DSC data in MS presented here may become an interesting avenue of future research into the vascular aspects of the disease. 39 Changes in blood flow are a major consequence of inflammation.40,41 The analysis presented herein may reveal differences in perfusion in patients with MS that are masked by the orientation dependency of CBF and CBV.
Our findings also have implications for functional MRI (fMRI) of WM, an emerging field of research. 42 WM fMRI is known to suffer from very low signal to noise due to the much smaller vascular volume in WM compared to GM. Our finding that CA-related changes are twice as large for WM perpendicular to B0 compared to WM parallel to B0 can be translated directly to the BOLD of the MRI signal. The BOLD sensitivity in tracts parallel to the main magnetic field may be much smaller than the sensitivity in tracts that run perpendicular to B0, for instance in the corpus callosum. Since the sensitivity is already very low in WM in general, it is likely that WM fMRI suffers from false negatives in WM bundles parallel to B0. A solution for this problem may be to use spin echo fMRI at very high field strengths of 7T and above in order to mitigate orientation effects and while having sufficient SNR.
Wong et al. observed that the whole brain histograms of CBF were much broader for gradient echo DSC than for spin echo DSC and 3D pseudo-continuous arterial spin labelling. 43 The orientation dependency observed in the present study may be an explanation for this observation.
The data were acquired in patients with multiple sclerosis. There may be subtle quantitative differences in the observed effect between patients and healthy subjects. However, if MS was the cause of this strong orientation effect, it would have to cause a dramatic reorganization of the vascular architecture throughout the brain's WM. There are no reports of such reorganization in the MS literature. Moreover, it has been shown previously that both people with MS and healthy controls exhibit a considerable orientation-dependent behaviour in
There are also several simplifications for the numerical simulation. We did not model for potential CA leakage or for changes in T1 due to the CA. Leakage is present in enhancing lesions (none of the subjects in this study had an enhancing lesion) but it may also be present below the detection threshold of the MRI scan used to identify enhancing lesions. However, the total volume of enhancing MS lesions is small compared to the total WM volume. Only 2D voxels were simulated although in real experiments 3D voxels with higher in-plane resolution and thick slices are usually used. For an axial acquisition this means that vessels parallel to B0 occupy a larger volume fraction than vessels at larger angles to B0. Only a limited number of background vessels at different orientations and with different angles were simulated. With a range of numbers of vessels in a 3D voxel, the simulations become computationally very expensive. Finally, the simulations assumed the same vascular architecture across the entire brain. In real life both the background and the volume fraction of the anisotropic component should vary across the large number of voxels. In some voxels there may not be any anisotropic vessels, whereas in other voxels a larger number of small parallel vessels may be present. In the experiment a large number of these scenarios get averaged into a final result. Moreover, blood oxygenation effects were ignored in the current simulation. While arterial vessels carry almost fully oxygenated blood, oxygenation in venous vessels is around 60%, resulting in paramagnetic properties already at baseline. However, the angle dependency is very small at baseline compared to the situation when CA is present (Figure 2). Since the total venous cross section is larger than the total arterial cross section, all vessels were assumed to be veins with a blood oxygenation of 0.6. It should be noted, however, that even without CA, there is a small angle dependency.17,22,45 This angle dependency in the absence of a CA has been ascribed to the properties of the myelin sheath. However, the data presented here suggest, that components of venous vasculature that run in parallel with the WM bundles also play a role. Another limitation is that we only investigated WM. It has been shown previously that the BOLD effect also depends on the orientation of the cortex,
12
suggesting that DSC in the cortical grey matter also exhibits considerable orientation dependency. At 2.4 s, the repetition time of the DSC scan was rather long, which may have an effect on the measurement of the perfusion parameters. The main finding presented here, however, is based on the raw
In conclusion, there is a strong angle dependency of the apparent change in
Footnotes
Funding
The author(s) disclosed receipt of the following financial support for the research, authorship, and/or publication of this article: EHT and VW are supported by the Milan and Maureen Ilich Foundation and NSERC. AR is supported by Canada Research Chairs. VW is supported by the Multiple Sclerosis Society of Canada. NK was supported by the DAAD RISE program. Data acquisition was funded by CIHR.
Acknowledgements
We wish to thank the participants and the UBC MRI Research Centre and its technologists.
Declaration of conflicting interests
The author(s) declared no potential conflicts of interest with respect to the research, authorship, and/or publication of this article.
Authors' contributions
EH-T: data analysis, interpretation of results, manuscript editing NK: data analysis, interpretation of results, manuscript editing N-DF: data analysis, interpretation of results, manuscript editing LW: data analysis, interpretation of results VW: interpretation of results, manuscript editing MD: data analysis DL: study design, interpretation of results, manuscript editing LM: study design AT: study design AR: idea, study design, study supervision, interpretation of results, manuscript writing