
Abstract
Ischemic brain and peripheral white blood cells release cytokines, chemokines and other molecules that activate the peripheral white blood cells after stroke. To assess gene expression in these peripheral white blood cells, whole blood was examined using oligonucleotide microarrays in 15 patients at 2.4 ± 0.5, 5 and 24 h after onset of ischemic stroke and compared with control blood samples. The 2.4 h blood samples were drawn before patients were treated either with tissue-type plasminogen activator (tPA) alone or with tPA plus Eptifibatide (the Combination approach to Lysis utilizing Eptifibatide And Recombinant tPA trial). Most genes induced in whole blood at 2 to 3 h were also induced at 5 and 24 h. Separate studies showed that the genes induced at 2 to 24 h after stroke were expressed mainly by polymorphonuclear leukocytes and to a lesser degree by monocytes. These genes included: matrix metalloproteinase 9; S100 calcium-binding proteins P, A12 and A9; coagulation factor V; arginase I; carbonic anhydrase IV; lymphocyte antigen 96 (cluster of differentiation (CD)96); monocarboxylic acid transporter (6); ets-2 (erythroblastosis virus E26 oncogene homolog 2); homeobox gene Hox 1.11; cytoskeleton-associated protein 4; N-formylpeptide receptor; ribonuclease-2; N-acetylneuraminate pyruvate lyase; BCL6; glycogen phosphorylase. The fold change of these genes varied from 1.6 to 6.8 and these 18 genes correctly classified 10/15 patients at 2.4 h, 13/15 patients at 5h and 15/15 patients at 24 h after stroke. These data provide insights into the inflammatory responses after stroke in humans, and should be helpful in diagnosis, understanding etiology and pathogenesis, and guiding acute treatment and development of new treatments for stroke.
Introduction
There is substantial evidence for an inflammatory-immune response to ischemic brain mediated by a variety of molecules expressed by leukocytes as well as by the brain (Allan and Rothwell, 2003; Danton and Dietrich, 2003; del Zoppo et al, 2000, del Zoppo et al, 2001; Dirnagl, 2004; Fagan et al, 2004; Iadecola and Alexander, 2001; Lo et al, 2002; Mattila et al, 1998; Zheng and Yenari, 2004). After experimental strokes, there is adhesion of leukocytes to venules within 1 h in a rat model (Ritter et al, 2000) and within the first 2 h in a pig model (Gidday et al, 1997). An antibody to the CD18 adhesion molecule blocked the leukocyte adherence to the vessel walls (Gidday et al, 1997). This implies that changes in gene regulation occur in the leukocytes and endothelial cells within this short period of time. Moreover, polymorphonuclear leukocytes (PMN) are detectable within areas of infarction in human strokes within 3 to 6h (Akopov et al, 1996), with the accumulation being quite marked by 6 to 15 h after ischemic stroke (Akopov et al, 1996; Lindsberg et al, 1996; Lindsberg and Grau, 2003).
Direct assessment of white blood cell gene expression has also been studied after stroke. IL1, IL-8, IL10, IL-17, interferon gamma and macrophage inflammatory protein (MIP) mRNAs are elevated in peripheral blood mononuclear cells in patients and animals with ischemic stroke from 1 day up to 10 days after the strokes (Kostulas et al, 1998, 1999; Li et al, 2001; Pelidou et al, 1999). Similarly, leukocyte proteinases, interleukins, matrix metalloproteinases (MMPs) and integrins are elevated in patients after both acute stroke and transient ischemic attacks (Beschorner et al, 2002; Caimi et al, 2001; Elneihoum et al, 1996; Falke et al, 2000; Schwab et al, 2001). At 12 h after stroke, the CD18 adhesion molecule is highly upregulated on leukocytes of peripheral blood of patients with ischemic stroke (Fiszer et al, 1998; Prestigiacomo et al, 1999). In experimental stroke studies, IL1, TNF, TNF receptor, adhesion molecules and various interleukins are elevated in peripheral blood leukocytes within a few hours of ischemic stroke (Barone and Feuerstein, 1999; DeGraba, 1998; del Zoppo et al, 2000; Li et al, 2001). Though it is still unclear whether the immune response in stroke is helpful or harmful (del Zoppo et al, 2001; Dirnagl, 2004; Iadecola and Alexander, 2001; Kazmierski et al, 2004), there is no question that there are marked changes of gene expression in leukocytes in response to stroke with marked infiltration of ischemic areas by inflammatory cells. It is notable that smoking, an important risk factor for cerebral ischemia and hemorrhage, activates neutrophils (Pitzer et al, 1996). Thus, ample evidence supports the notion that changes of gene expression will occur in white blood cells after ischemic stroke. Although changes of body temperature, C-reactive protein and white blood cell count are documented (Audebert et al, 2004; Emsley and Tyrrell, 2002; Smith et al, 2004), the role of inflammation in human ischemic brain is still unclear. This is due in part to the inability to directly study human brain. The difficulty in translating results of animal studies to clinical trials was apparent in the unexpected failure of an anti-inflammatory clinical trial (Unnamed, 2001). Therefore, further investigation into inflammatory processes after stroke in humans seemed warranted.
Microarray technology makes it possible to examine the expression of thousands of genes. Using this technology, we have identified characteristic blood ribonucleic acid (RNA) expression profiles for neurological conditions, including epilepsy (Tang et al, 2004a), migraine (Hershey et al, 2004), Tourette's syndrome (Tang et al, 2005) and several neurogenetic disorders, including Down s syndrome (Tang et al, 2004b, c). It is likely that this approach could provide surrogate markers for diagnostic and mechanistic purposes, including diseases where there is acute brain injury and an associated inflammatory response.
Accordingly, we examined gene expression profiles in the blood of rats subjected to ischemic stroke, hemorrhagic stroke, sham surgeries, kainate-induced seizures, hypoxia and insulin-induced hypoglycemia (Tang et al, 2001). We found injuryspecific gene expression changes in blood using microarrays 24 h after each injury. In addition, there was a common blood gene expression profile that correlated with the occurrence of neuronal cell death regardless of the cause (Tang et al, 2003). This led to a recent human study by Moore et al(2005), who found a genomic signature from peripheral blood that was diagnostic for ischemic stroke in humans. This landmark study examined patients at roughly 1 to 4 days after ischemic stroke, and studied peripheral blood mononuclear cell (PBMC) gene expression.
The aims in our study were to extend the animal and human work in stroke and examine the genomic changes of whole blood before 3 h, at 5 h and at 24 h after the onset of ischemic stroke in adult patients. We also compared the genes expressed after stroke to those of several leukocyte subsets, including neutrophils, monocytes, B cells, CD4+ helper T cells, CD8+ cytotoxic T cells and natural killer cells, to determine the cellular origin of the genes regulated by ischemic stroke. The data show that changes of gene expression occur in whole blood before 3 h in many patients and in most patients by 5 h after ischemic stroke, and that the changes of gene expression in blood are accounted for mainly by neutrophils (PMNs) and to a lesser extent by monocytes.
Materials and methods
Study Participants
A total of 15 patients with acute ischemic stroke enrolled in a clinical trial (Combination approach to Lysis utilizing Eptifibatide And Recombinant tissue-type plasminogen activator (r-tPA) (CLEAR) in acute ischemic stroke participated in this study. The CLEAR trial is a study evaluating the safety and efficacy of a combination of eptifibatide (Integrilin) and low-dose r-tPA (Activase) compared with standard-dose r-tPA (Activase) for acute ischemic stroke in patients treated within 3 h of onset. For the combination treatment arm, eptifibatide is infused intravenously over 2 h and the low dose of r-tPA of 0.6 mg/ kg is infused over 30mins. Standard-dose r-tPA of 0.9 mg/ kg is infused over an hour with 10% of the dose given as a bolus. Patients are randomized in a double-blind fashion to combined therapy versus the standard dose of intravenons r-tPA in a 3:1 ratio.
Ischemic stroke was diagnosed clinically, based on the presence of focal neurological signs and symptoms. Computed tomography brain scan was performed before treatment and patients with hemorrhage excluded from the study. After informed consent, 15 mL blood was obtained from each patient at three time points: before 3h – designated ‘3h’ after-stroke (on admission before treatment), ‘5h’ after-stroke (after the infusion of thrombolytic drugs) and ‘24 h’ after-stroke. Stroke severity was assessed using the National Institute of Health Stroke Scale (NIHSS) at 3, 5, 24 h and 5 days after stroke. Eight healthy subjects were recruited as controls. Each healthy subject was asked to give 15 mL blood at two different times. The Institutional Review Boards at the participating institutions approved the study protocols and consent forms. A total of 60 separate blood samples (45 stroke, 15 control) were analyzed in this study.
Sample Processing and Array Hybridization
Ribonucleic Acid Isolation from Whole Blood: A total of 15 mL blood was collected into 6 PAXgene vacutainers (PreAnalytiX, Hilden, Germany) via antecubital fossa venipuncture at each time. PAXgene tubes contain a proprietary reagent that immediately stabilizes RNA, thus reducing RNA degradation and inhibiting gene induction after phlebotomy (Rainen et al, 2002). Total RNA was isolated using the PAXgene blood RNA kit (PreAnalytiX, Germany) according to the manufacturer s protocol. The RNA isolated with this protocol comes from all blood cells, including PMN (neutrophil, basophil and eosinophil), mononuclear cells (PBMC) (lymphocytes, macrophage/monocytes), platelets and red blood cells.
Ribonucleic Acid Isolation from Leukocyte Subsets: Blood was drawn from three healthy donors for all leukocyte subsets. Neutrophils were separated from 6 mL sodium citrate, anticoagulated venous blood by centrifugation in leukocyte separation media (Histopaque-1119 and Histopaque-1077; Sigma-Aldrich, St Louis, MO, USA). Ribonucleic acid was isolated using Trizol reagent (Invitrogen, CA, USA) according to the manufacturer s directions. The purity of the PMNs was ∼ 98° % based on microscopic examination after Wright-Giemsa staining. Subsets of mononuclear cells, including CD4+ T cells, CD8+ T cells, CD19+ B cells, CD56+ natural killer cells and CD14+ monocytes, were enriched using RosetteSep™ negative selection methods (StemCell Technologies, Vancouver, BC, Canada). For each subset, 8 mL venous blood was drawn into Vacutainer® CPT™ Cell Preparation Tubes with sodium citrate (Becton & Dickinson, Bridgeport, NY, USA). (400 μL) RosetteSep ™antibody cocktail was added to each tube of whole blood and incubated for 20 mins at room temperature. The antibody cocktail crosslinks unwanted cells in whole blood to red blood cells, forming immunorosettes with increased density. After incubation, the blood collected in CPT™ tubes is centrifuged for 20 mins at 1800g to precipitate the unwanted cells and free red blood corpuscles (RBCs). The desired cells, not labeled with antibody, were collected from the plasma: ficoll interface, washed once with phosphate-buffered saline and the RNA isolated using Trizol reagent. The purity of cells separated with this protocol is 90% ± 75% for CD4+ T cells, 76% ± 8% for CD8+ T cells, 81% ± 8% for CD19+ B cells, 74% ± 10% for CD56+ natural killer (NK) cells and 69% ± 12% for CD14+ monocytes (mean ± s.d.) based on flow cytometry data from our laboratory and data provided by the manufacturer. The relative impurity of the cell types obtained is compensated to some degree by the gene selection criteria that were designed to detect genes differentially expressed in the different cell types using cluster analyses.
Sample labeling, hybridization to chips and image scanning were performed using standard Affymetrix protocols (Affymetrix Expression Analysis Technical Manual). For each whole blood sample from stroke and control subjects, 10 μg total RNA was labeled using the One-Cycle Target Labeling protocol and hybridized to one array. For each white blood cell subset, 25 ng total RNA was labeled using a Two-Cycle Target Labeling protocol and hybridized to arrays. Affymetrix Human U133 Plus2 arrays that contain more that 54,000 probe sets that sample over 39,000 genes were used for each blood sample in this study.
Reverse transcriptase-polymerase chain reaction (RT-PCR) confirmation was not performed in this study, because of the limited amount of RNA obtained in a number of the patients. The RNA that is currently available from the patients in this report will be saved, and once the entire CLEAR study is completed, RT-PCR will then be performed on all of the stroke and control subjects as a group.
Probe-Level Data Analysis
After scanning the array, the raw expression values (probe level data) for each gene were saved in Affymetrix.cel. files. The probe level data were then collated using Robust Multi-array Average (RMA) software (http://www.bioconductor.org/). This involved nonlinear background reduction, quantile normalization and summarization by median polishing (Bolstad et al, 2003; Irizarry et al, 2003). One array from one healthy control was found to be an outlier and eliminated from further analysis as its average intensity was significantly different from other arrays.
Gene-Level Data Analysis
Genes Regulated by Stroke Compared with Healthy Controls: Three supervised statistical analyses were used with a priori knowledge of sample categories (i.e. 3, 5, 24 h and controls) to identify genes regulated by stroke at each time point compared with healthy controls. The purpose was to identify biologically meaningful genomic changes by adjusting the level of statistical stringency. We first used the one-way analysis of variance (ANOVA) followed by the Student–Newman–Keuls post hoc test with time after stroke onset as the variable (healthy control, 3-, 5-and 24-h stroke) (GENESPRING® 7 software, Silicon Genetics, Redwood City, CA, USA). The type I error probability value (P-value) was corrected with Benjamini—Hochberg false discovery technique (false detection rate (FDR)) for multiple test comparisons. False detection rate < 0.05 was considered significant. We also directly compared each time point after stroke with healthy controls (3 h versus control, 5 h versus control, 24h vs. control) using three unpaired-sample t-tests instead of ANOVA. The P-value was corrected by Benjamini-Hochberg procedure with FDR < 0.05 as the significance threshold. Prediction analysis of microarray (PAM) software used the ‘nearest shrunken centroids’ method to identify a minimum set of signature genes that distinguish stroke from healthy controls (Tibshirani et al, 2002). The accuracy of the classifier was tested using a tenfold crossvalidation.
Genes Regulated Between Different Times After Stroke: To identify genes that were significantly regulated between different time points after stroke (5 versus 3 h, 24 versus 5 h), a class comparison tool (BRB-Array Tools 2.0, developed by Dr Richard Simon and Amy Peng at the National Cancer Institute and Emmes Corporation) was used. This tool performed a paired-sample t-test for each gene and P < 0.01 was considered significant. Though the P-values were not corrected for multiple test comparisons, the global significance of the genomic changes between different times after stroke was then assessed using a permutation analysis, which performed 1000 random permutations of the class labels (i.e. which arrays correspond to which classes, i.e. 3, 5 and 24 h) and computed the proportion of the random permutations that gave as many genes significant at P < 0.01 level. This estimated probability of randomness provided a global test of whether the expression profiles at two time points were significantly different. In this global testing situation, obtaining a P-value of less than 0.05 is sufficient to establish that expression profiles between two classes were different (BRB-Array Tools 2.0, National Cancer Institute).
Genes that Correlate with Stroke Severity: To identify genes that correlated with clinical stroke severity, we used quantitative traits analysis in BRB-Array Tools. This analysis found genes that were significantly correlated with the NIHSS score at 3 h (quantitative variable), which was used as an index of initial stroke severity. Spearman correlation coefficients were used as a measure of correlation and used to compute parametric P-values for each gene. A parametric P-value of < 0.05 was considered significant. A permutation analysis similar to that used in class comparison was used to evaluate the overall significance of the correlation of gene expression with NIHSS.
Genes that Correlate with Outcome of Recanalization Therapy: We next determined whether the blood genomic changes after stroke correlated with the outcome of recanalization therapy. The outcome was defined as the decrease of NIHSS from 3 to 24 h (ΔANIHSS) (Broderick et al, 2000). Patients with ΔNIHSS > 6 were considered as ‘good outcome’ (n = 6), ΔNIHSS < 3 was considered as ‘relatively bad outcome’ (n = 6), ΔNIHSS between 3 and 6 was considered as ‘indeterminant’ (n= 3). For each patient, the gene expression value at 24 h was used for the comparison between ‘good outcome’ and ‘bad outcome’. The class comparison tool of the BRB-Array Tools was used and the significance was assessed by permutation analysis.
Results
Blood Genomic Changes at 3, 5 and 24 h After Stroke
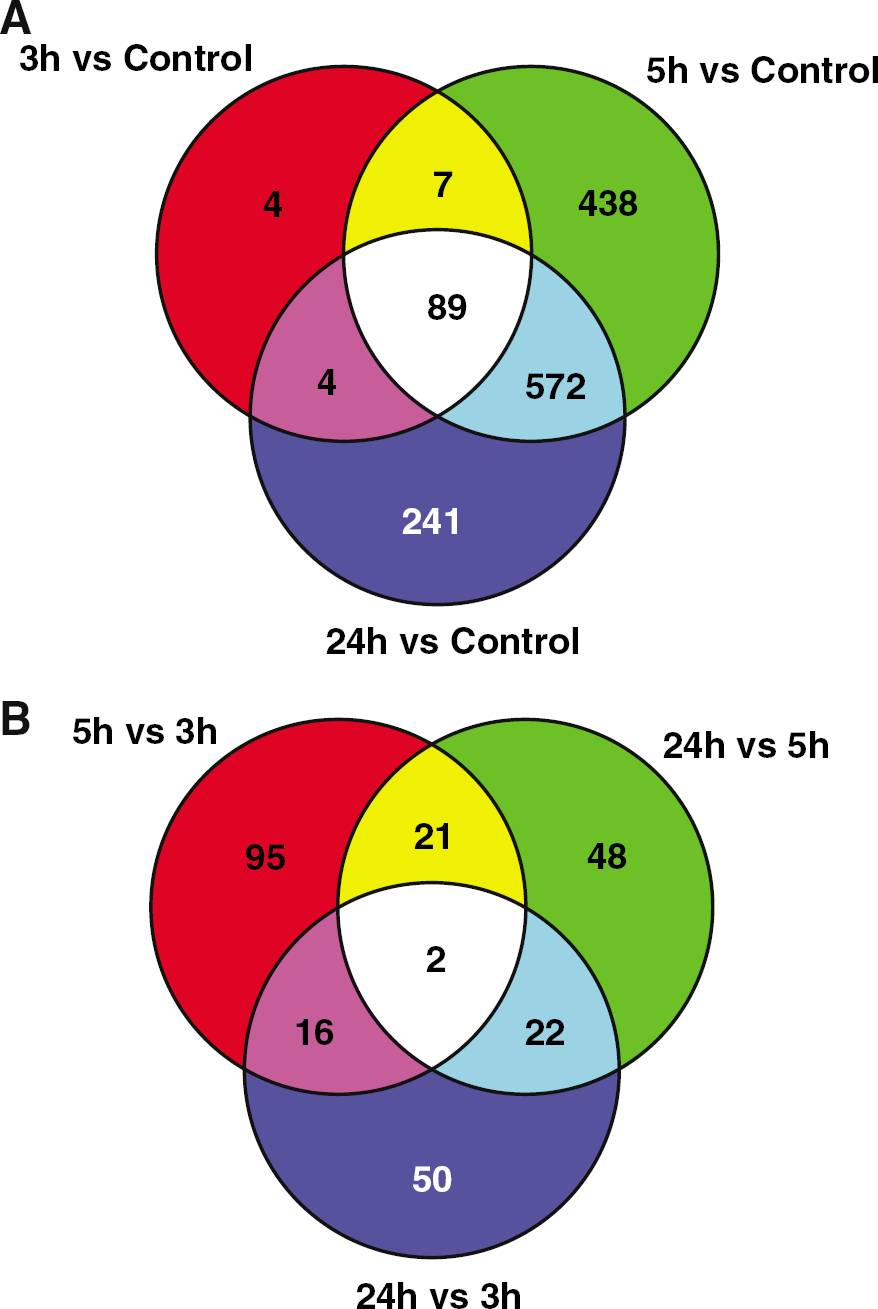
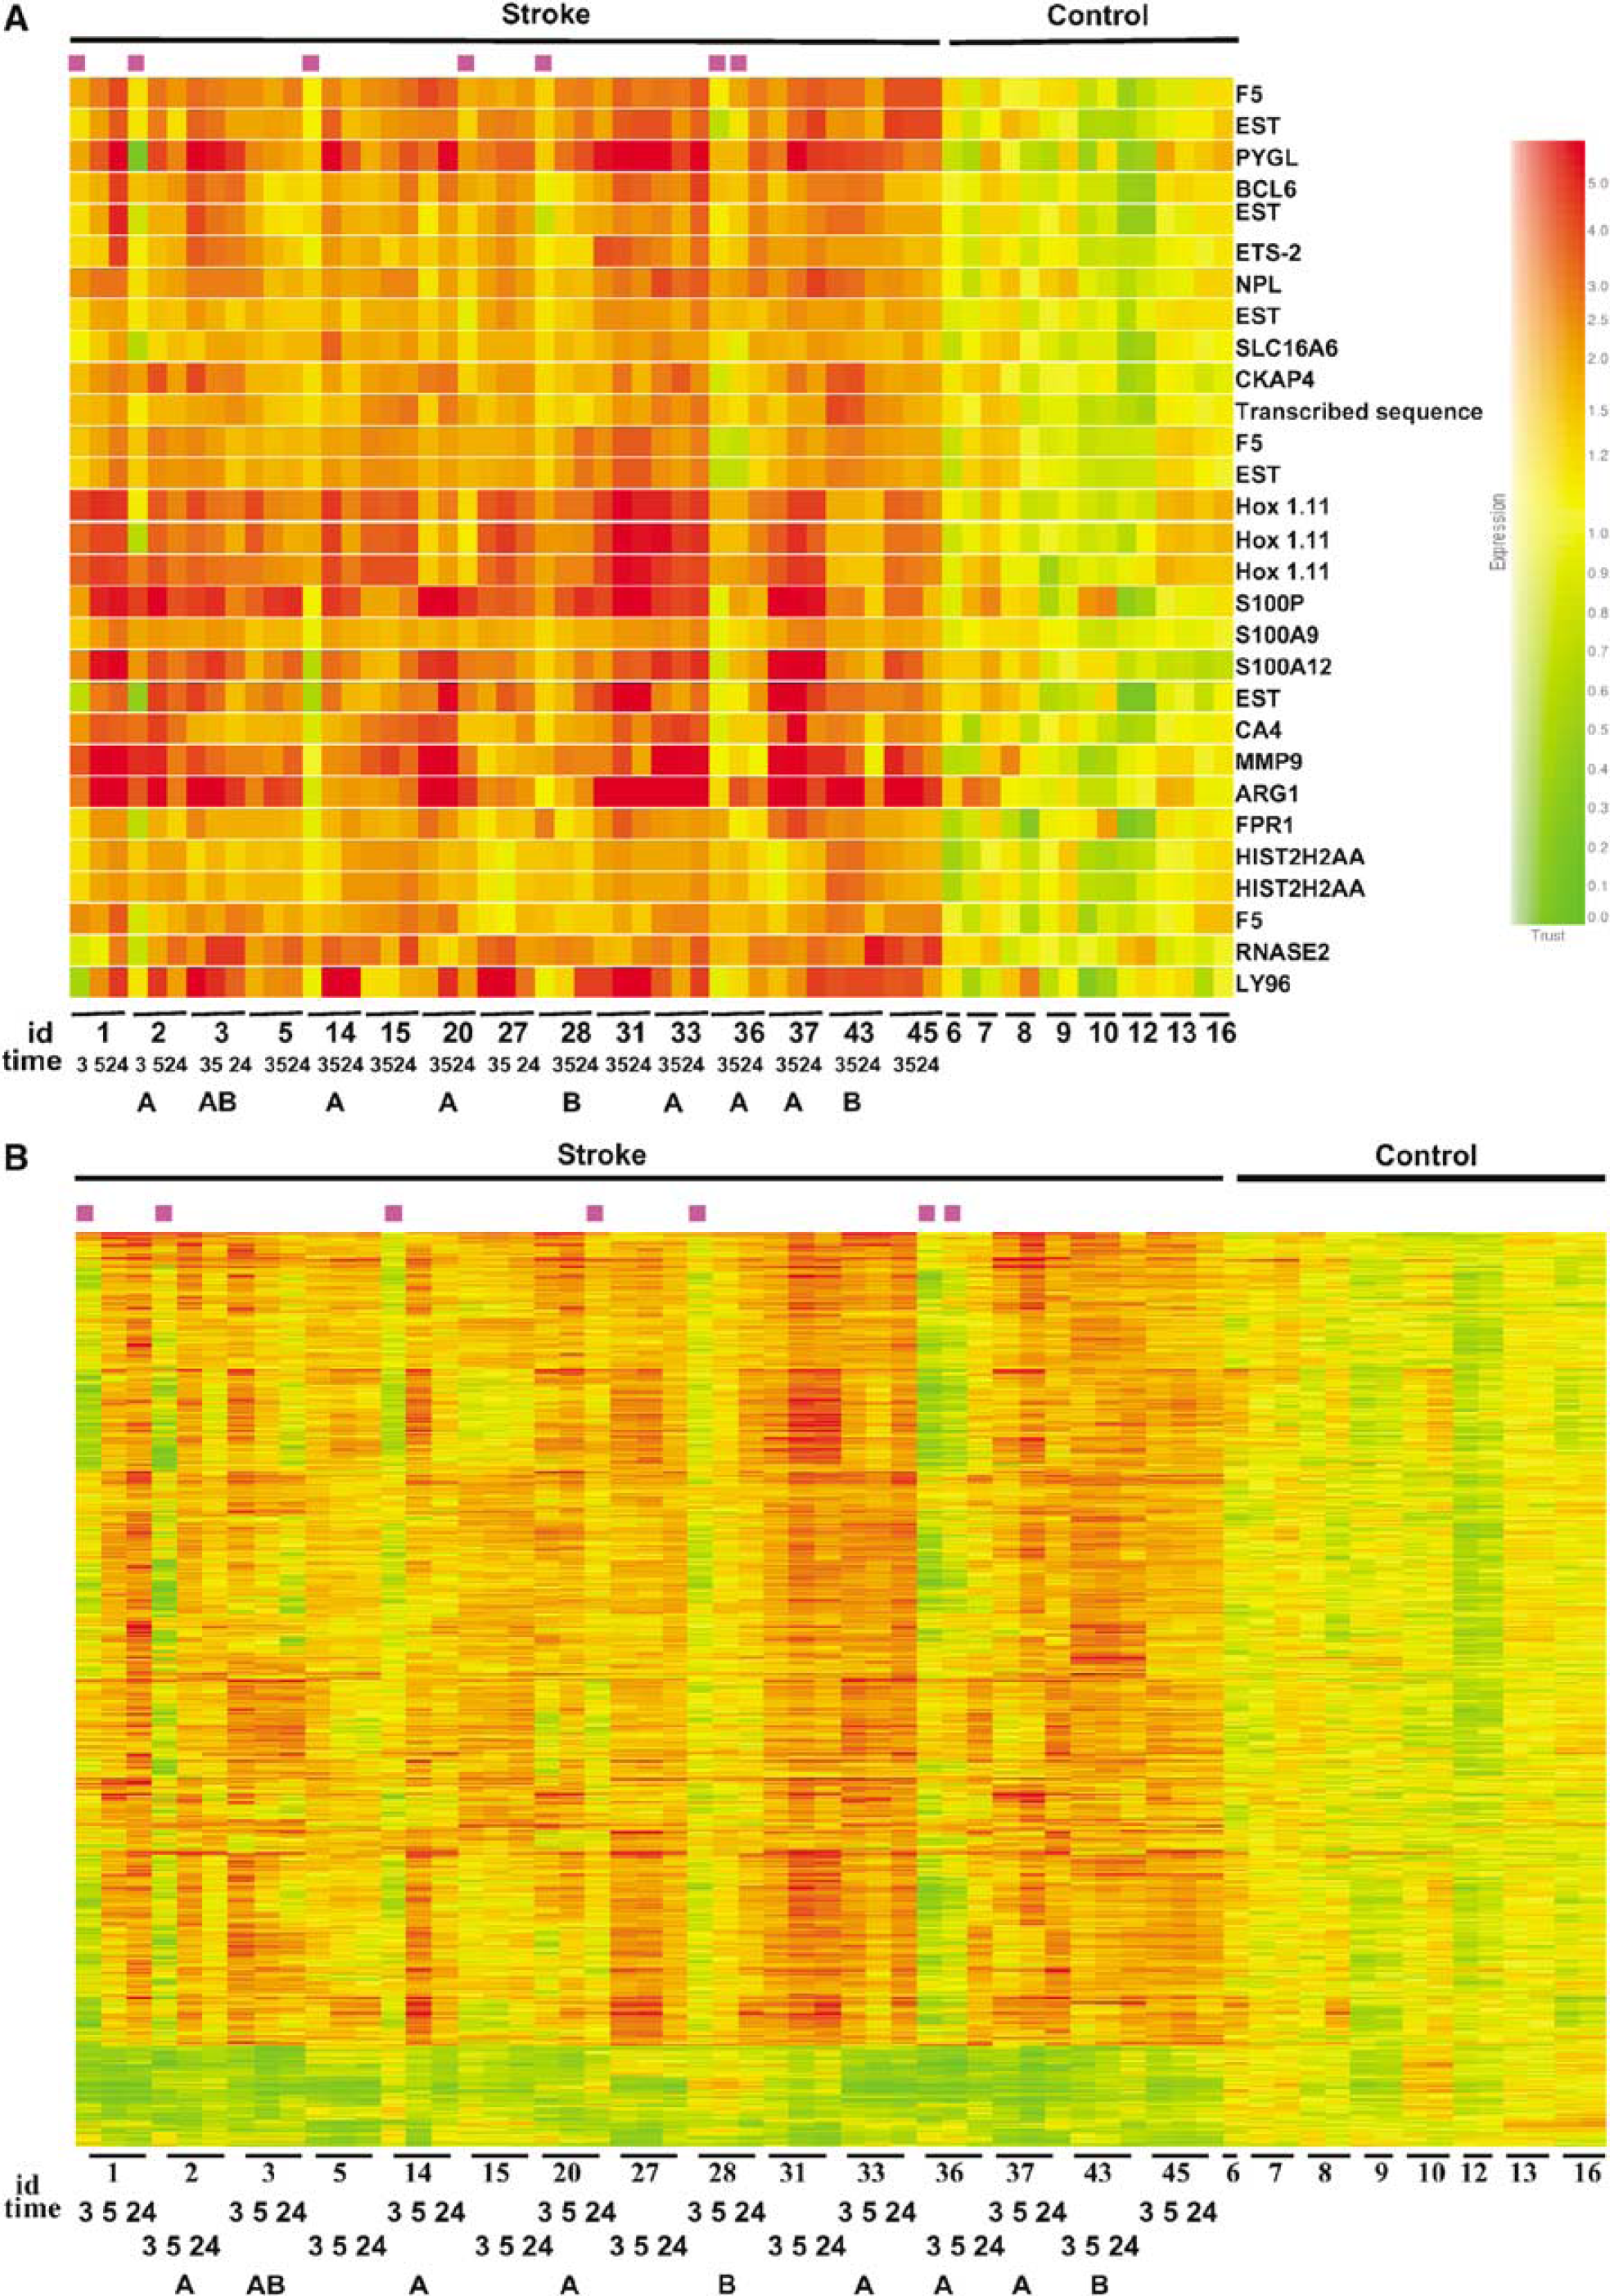
We used three different methods to examine the genomic changes after stroke. With ANOVA and the Student–Newman–Keuls Post hoc test (Benjamini–Hochberg FDR < 0.05), a total of 18, 22 and 24 genes are significantly regulated at 3, 5 and 24 h, respectively, compared with healthy controls. Since this approach might be too stringent, we chose to directly compare stroke samples at each time point with controls (3 h versus control, 5 h versus control, 24 h versus control). A total of 104, 1106 and 906 genes were significant at 3, 5 and 24 h, respectively (unpaired t-test, Benjamini-Hochberg FDR < 0.05, fold change > 1.5). The gene lists are included in Supplementary data. We found that many genes were significantly regulated at more than one time point and that nearly all of the genes regulated at 3 h after stroke continued to be regulated at 5 and 24 h (Figure 1A). However, many more genes are significantly regulated at 5 and 24 h than at 3 h. Lastly, examination of the patterns of gene regulation indicated that the majority of the genes that were significantly regulated at 5 h and 24 h had started to change, but had not achieved statistical significance at 3 h.
(
Temporal Genomic Changes After Stroke
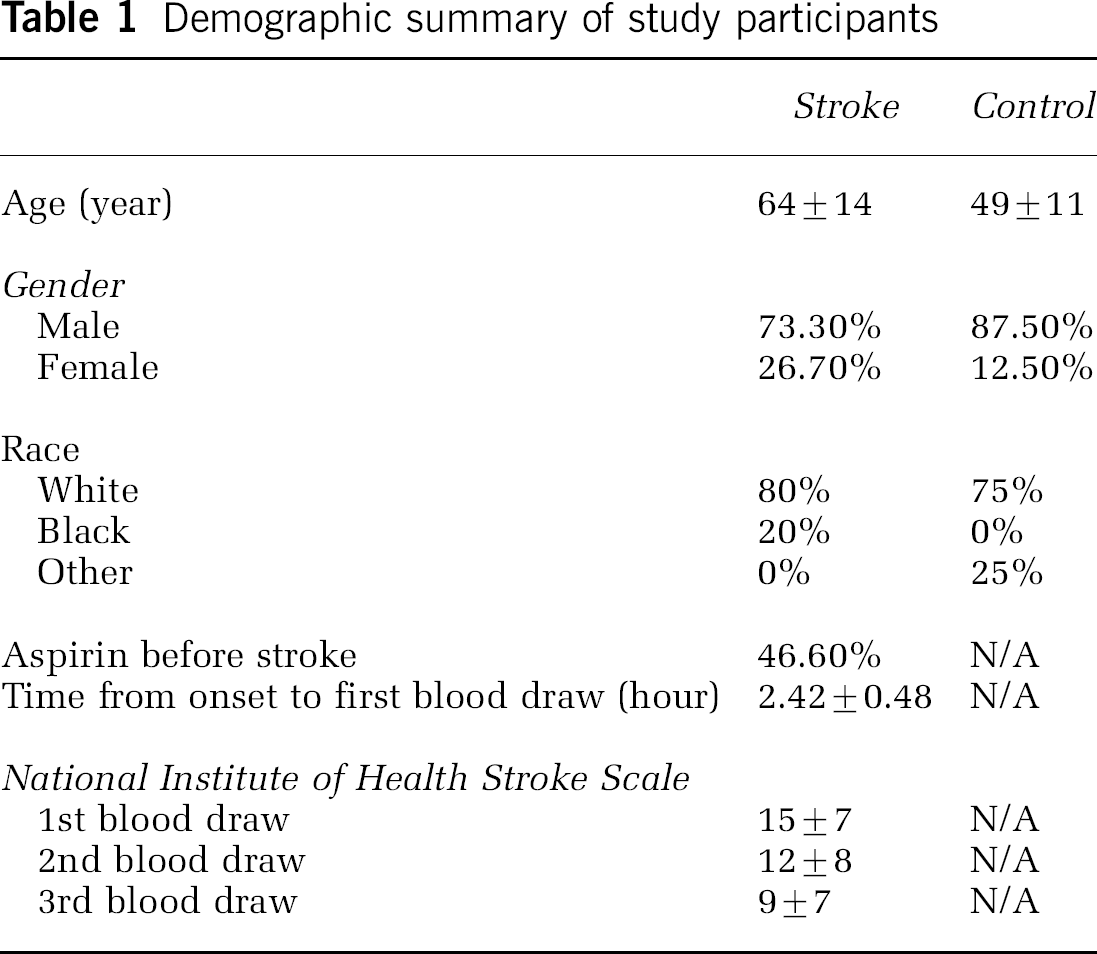
To examine the changes of gene expression over time after stroke, the permutation-based, paired-sample t-test analysis was employed (BRB-Array Tools). We found that, among 1335 genes regulated for at least one poststroke time point, 134 genes were regulated between 3 and 5 h (parametric P < 0.01, permutation P = 0.035), and 93 genes were regulated between 5 and 24 h (parametric P < 0.01, permutation P = 0.039). This suggests that the blood genomic pattern was evolving with time after stroke. Among these genes, 23 were significantly changed at 5 h compared with both 3 and 24 h (Figure 1 B). This pattern might be related to stroke or may reflect the effects of medication (t-PA ± platelet antagonist) given just after the 3 h (2.42 ± 0.48 h; see Table 1) blood sample, but before the 5 h blood sample. It is also noteworthy that two genes — IL1β and SOCS3, which were not significantly regulated at 3 h compared with healthy controls, were significantly increased at 5h and increased further at 24 h.
Demographic summary of study participants
Prediction Analysis of Blood Genomic Markers for Stroke
We used PAM, which used the ‘nearest shrunken centroids’ method, to identify the minimum number of signature genes that distinguished ischemic stroke from healthy controls. A threshold is adjusted to produce the fewest number of genes with the least misclassification error (Tibshirani et al, 2002). At a threshold of 4.5, with a total of 29 probe sets which represented 18 genes (Table 2), PAM achieved the lowest error after cross-validation (Figure 2A). All of the control samples are identified correctly, while 5/15 of 3-h samples, 2/15 of 5-h samples and 1/15 of 24-h samples were misclassified (Figures 2B and 3). It is noted that among the five misclassified samples at 3 h, three can be correctly classified at 5 h and all can be correctly classified at 24 h (Figures 3A and 3B). This attests to increased robustness of the blood genomic pattern after stroke over time. However, one sample correctly classified at 3 and 5 h was misclassified at 24 h, which points to interindividual heterogeneity. It is important to emphasize that of the 29 probe sets and 18 genes identified by PAM, none of these genes were regulated as a function of age, race, gender, aspirin or NIH stroke scale as noted below.
PAM gene list
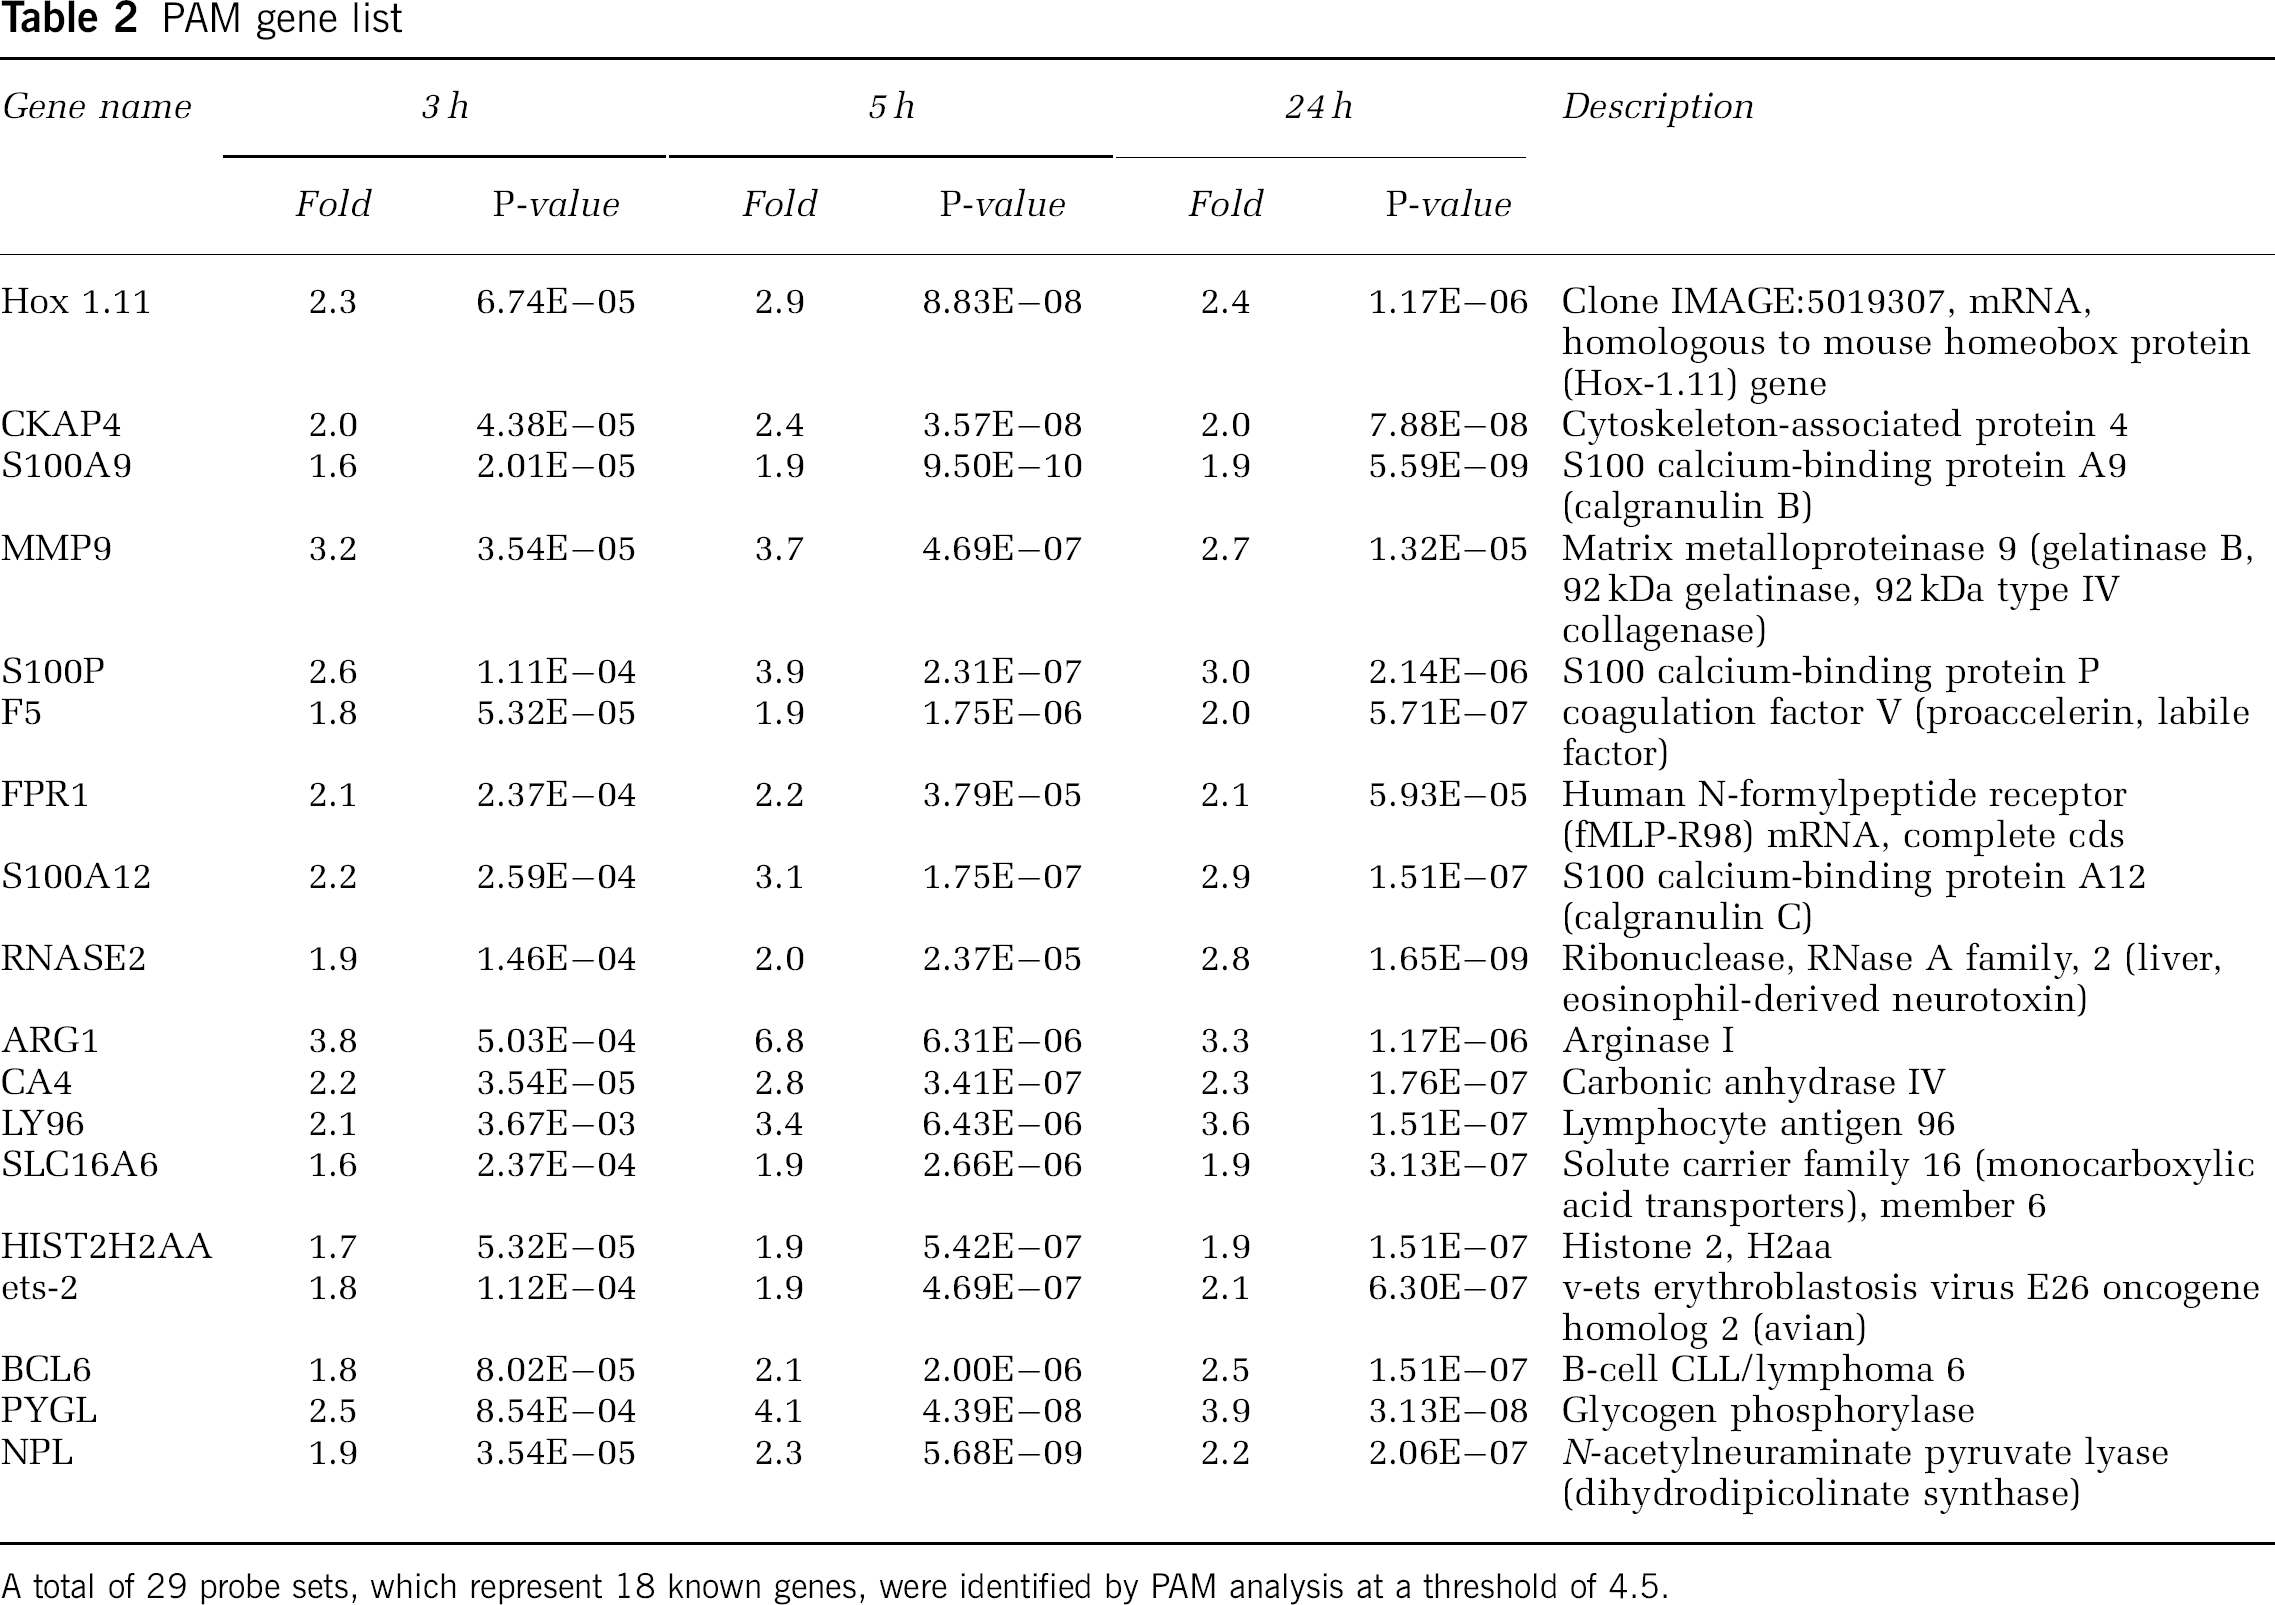
A total of 29 probe sets, which represent 18 known genes, were identified by PAM analysis at a threshold of 4.5.
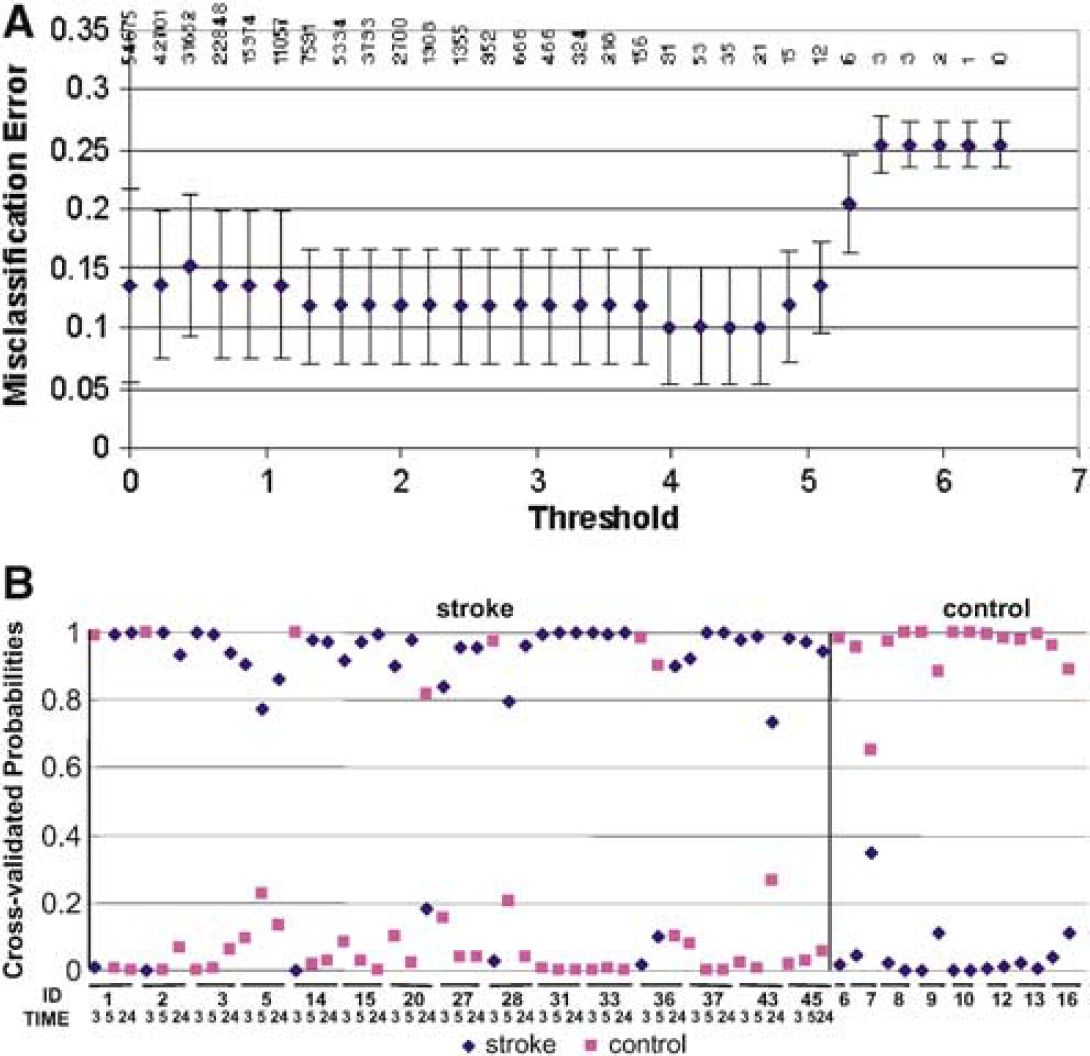
Class prediction analysis of all subjects that uses PAM software. Prediction analysis of microarray used the ‘nearest shrunken centroid’ method to identify genes that best distinguish stroke from controls. The number of the signature genes was adjusted by tuning the shrinkage parameter (threshold). The misclassification error for each threshold was computed using a 10-fold crossvalidation. (
Cluster analysis of genes regulated by stroke in patients on aspirin (
Cellular Origin of Genes Regulated by Stroke
We next compared the expression of genes regulated by stroke among different blood cell types. Among the 29 probe sets identified by PAM, most were highly expressed by neutrophils compared with the other cell types, while some were also highly expressed by monocytes (Figure 4A). This held true when a more inclusive gene list (1204 genes upregulated by stroke at any of the three time points, Benjamini–Hochberg FDR < 0.05 and fold change > 1.5) was used (Figure 4B). This suggests that neutrophils and monocytes are the major blood cell types involved in the human blood genomic responses to acute ischemic stroke within the 2.4 to 24-h time window examined in this study. Confirmation of these results will require direct measurements of the gene expression in these cell types in stroke patients in future studies.
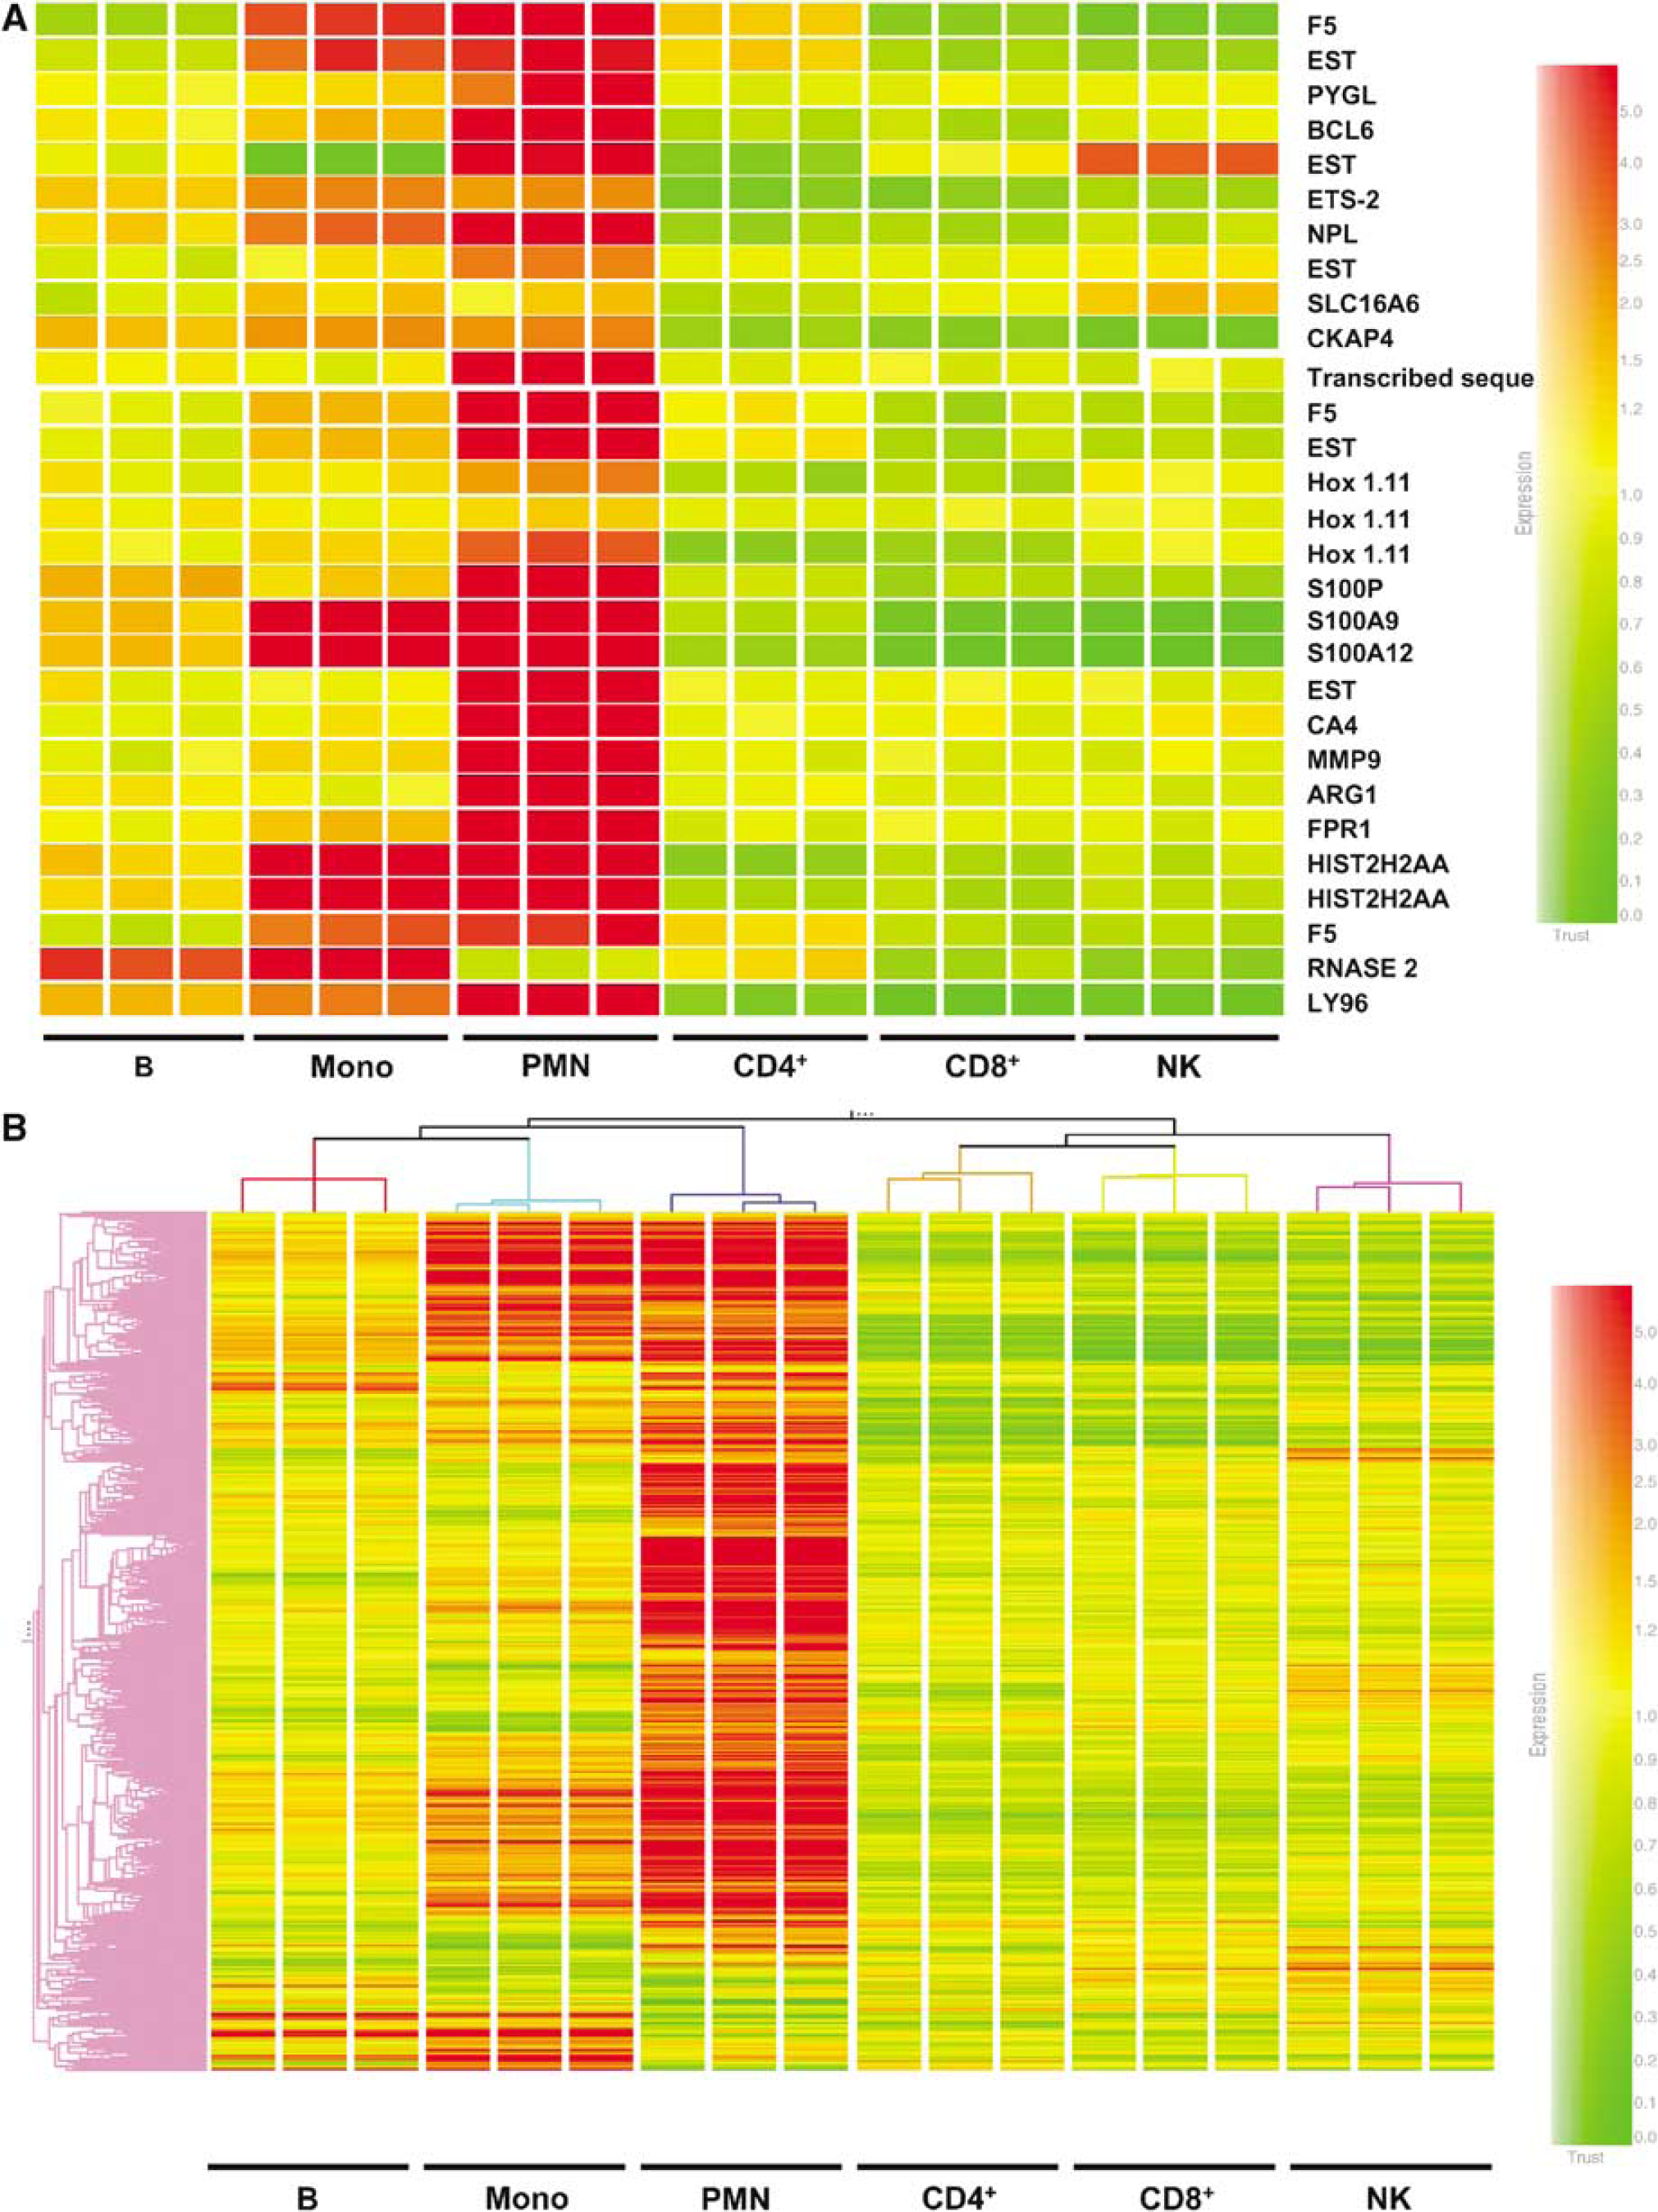
Cellular origin of genes regulated by stroke. Blood cell subtypes, including B cells (B), monocytes (Mono), PMN or neutrophil, CD4+ T cells (CD4+), CD8+ T cells (CD8+) and NK cells were separated from a single healthy donor. Ribonucleic acid isolated from each subset was hybridized to three genechips as technical replicates. Expression levels of genes regulated by stroke were compared between different cell subtypes. (
Blood Genomic Patterns Related to Stroke Severity, Outcome and Aspirin
Among 1335 genes regulated by stroke, using an unpaired t-test with 3 samples from each individual treated as replicates, we found that 1186 genes have significantly different expression between individual patients (P < 0.05, Benjamini–Hochberg correction). This indicates that the stroke genomic profile is associated with considerable variability between individuals. To begin to address some of the causes of this heterogeneity, we examined the effects of several factors on the expression of the 1335 stroke-regulated genes, including initial stroke severity, response to revascularization therapy and previous use of aspirin. Other factors, including brain hemorrhage after thrombolytic therapy, were not assessed in this first report because of a limited sample size (60 blood samples total in this study).
There were 82 genes that significantly correlated with NIHSS at 3 h (P < 0.05, Spearman correlation). However, the permutation P-value was 0.21 (BRB-Array Tools), suggesting that with this multiple comparison correction this was not a significant effect with this sample size. This list of genes is included in the appendix to this study. Similarly, a total of 16 genes correlated with the outcome of recanalization therapy (P < 0.01, unpaired t-test ‘good outcome’ versus ‘bad outcome’). Again, because the permutation P-value was 0.19 (BRB-Array Tools), this was not a significant effect with this sample size.
For stroke patients on aspirin compared with those not on aspirin, using an FDR of 0.05 and a fold change of 1.5, then 424 genes are regulated between the stroke patients on aspirin versus those not on aspirin. However, of these genes, only 143 genes were significantly different between patients on aspirin before the onset of their strokes (24 h earlier) compared with those who were not on aspirin before their strokes (unpaired t-test, P < 0.01). The permutation P-value was 0.016 (BRB-Array Tools), suggesting that this was a significant effect. Notably, of the 424 aspirin-regulated genes identified using FDR, only 30 genes are among the 906 stroke-regulated genes at 24 h. Most importantly, none of the 424 aspirin-regulated genes were among the stroke-regulated genes at 3 h, and none of the aspirin-regulated genes are among the 18 genes predictive of stroke. Thus, though aspirin does influence gene expression, aspirin does not have a significant effect on gene expression profiles after acute stroke. This can be appreciated at least visually, in that the blood genomic profiles for the stroke patients on aspirin (A) versus those not on aspirin (not labeled) appear to be similar to each other at each time, as shown in Figures 3A and 3B.
Patient Demographics—Effects of Age, Gender and Race
The characteristics of the ischemic stroke patients and healthy control subjects are listed in Table 1. There is a significant difference in age and race between the stroke and control groups. However, we have previously shown that there is no significant difference in gene expression in the blood of 36 younger adults (ages 15 to 50) compared with 22 older (ages 50 to 80) adults (Tang et al, 2004b). In addition, though there are profound effects of gender on blood genomic profiles in our previous studies (Tang et al, 2004b); genes markedly regulated as a function of gender are entirely different from those regulated after acute ischemic stroke in the present study. The list of the most highly regulated genes as a function of gender is included in the appendix to this study. A larger cohort will be needed to test for age and gender differences during acute stroke.
Though it was not possible to control for race in this study, we did compare the gene expression of the 3 black patients with stroke to the 12 Caucasian patients with stroke at each time point of 3, 5 and 24 h. There were 54 genes that were significantly different between the black patients with stroke compared with the Caucasian patients with stroke at 2 to 24 h after stroke—few compared with the 906 genes regulated at 24 h after stroke (see above). Of these 54 genes, only 6 were among the 906 genes regulated at 24 h, none were among the 104 genes regulated at 3 h (see above) and none were among the 18 genes predictive of stroke noted above. The list of the race-regulated genes is attached in the appendix. Though larger sample sizes will need to be studied to carefully address this question, race does not appear to be a major regulator of gene expression after acute stroke in this preliminary study. This is shown pictorially in Figures 3 A and 3 B, where the gene profiles for the black patients (B) appear to be similar to the Caucasian patients (not labeled) after stroke, at each time point after stroke.
The gene lists obtained in this study are included either as an appendix to this publication and/or in the website for this journal. The gene lists will also be provided to anyone who requests them. The lists include genes regulated at each time, genes regulated by gender and race, and genes regulated by aspirin. The lists based on both Bonferroni (very stringent) and FDR multiple comparison corrections are included.
Discussion
The major finding of this study is that gene expression changes rapidly in blood after ischemic stroke in humans, occurring before 3 h in 10 of 15 patients by 5 h in 13 of 15 patients, and by 24 h in all 15 patients in this study. Moreover, comparison of gene expression in patients with ischemic stroke with gene expression in different cell types shows that the changes of gene expression after ischemic stroke occur predominantly in PMNs and to a lesser degree in peripheral blood monocytes. This temporal and cell-specific whole genome data from blood is among the first of its kind to be obtained in the first few hours after ischemic stroke either from humans or animals (Moore et al, 2005; Tang et al, 2001).
Comparison to Previous Studies
The first study of whole genome expression in human blood after ischemic stroke, however, was just reported by Moore et al(2005), who found that ischemic stroke could be diagnosed using PBMC with a sensitivity of 78% and specificity of 80%. The mean time for that study was 32.4 ± 17.8h after stroke onset, with one-third of the blood draws performed within 24 h. The current study and that of Moore et al (2005) provide the first proof of principle studies in humans that changes of gene expression occur at very early times in the peripheral blood of patients after ischemic stroke. The current results show changes before 3 h after stroke, suggesting that these rapid changes of gene expression might be useful for making the early diagnosis of ischemic stroke in humans. It is notable that the genes regulated in the blood of rats after stroke do not predict the genes that are regulated in the blood of humans after stroke (Tang et al, 2001).
There are also significant differences between the genes identified in this study and in that by Moore et al (2005) in spite of using similar Affymetrix microarray technology. Using the Benjamini-Yekutieli multiple test correction, Moore et al identified 771 stroke-regulated genes from PBMC. To make a direct comparison, we employed similar criteria (Benjamini-Hochberg test and at least 1.5-fold change) and identified 1355 genes from whole blood, among which 11% (156 genes) overlap with Moore et al's (2005) list. Similarly, our study identified 18 known genes using PAM analysis, only two of which were also identified by Moore et al using PAM. The differences between our results and those of Moore et al are likely due in large part to the fact that different cell populations were isolated and studied. Moore et al studied PBMC. Our study utilized whole blood that includes PMNs and PBMCs (which includes lymphocytes and monocytes). Among all blood cell types, PMNs are the first to infiltrate the brain after stroke in humans and animal stroke models (Lindsberg et al, 1996; Akopov et al, 1996; Gidday et al, 1997; Lindsberg and Grau, 2003; Ritter et al, 2000). In addition, our cell-specific data show the following: the large majority of the genes that are induced between 2 and 24 h after stroke in humans are induced in PMNs; only a minority of the induced genes are induced in monocytes; almost all of the 18 genes that are the best predictors of stroke at 3, 5 and 24h are expressed in PMNs. Hence, since the study of Moore et al (2005) only sampled PBMCs, that study would not have detected the changes of gene expression in PMNs detected in the present study.
The other major difference between the present study and that of Moore et al (2005) was that all of the patients in this study were treated either with tissue-type plasminogen activator (tPA) alone or with tPA plus eptifibatide as part of the CLEAR trial. Since patients were treated by 3 h in the present study, the marked increases in the numbers of regulated genes at 5 and 24 h in the present study could be due in part to these medications. However, the changes of gene expression at the first time point before 3 h in the current study are not due to medication, since this blood sample was drawn before treatment, on average at 2.4 h after the stroke but before treatment that was given by 3 h after the stroke. It is for this reason that we have concentrated on the genes that were most regulated before 3 h after the stroke, that would not be affected by medications, and that continued to be induced at 5 and 24 h after the stroke. Moreover, genes regulated at later times may represent the downstream targets of ‘initiator’ molecules regulated early by stroke, and it is the genes regulated before 3 h that are likely to be most useful for diagnosis, prognosis and guiding treatment.
Genes Regulated at 3 h After Stroke: Consistent with the finding that neutrophils (PMNs) infiltrate early after stroke, many genes regulated at 3 h are expressed predominantly by activated PMNs and may contribute to the tissue damage after stroke. Below we discuss the genes regulated at 3 h since these are unaffected by drug treatment in the trial, and the 3-h genes would be most relevant for early responses predictive of stroke. Two molecules—formyl peptide receptor 1 (FPR1) and peptidoglycan recognition protein 1 (PGLYRP 1)—represent initial steps leading to PMN activation. FPR1 is a receptor that specifically binds formyl peptides originating from the debris of necrotic cells. Its activation leads to the accumulation of granulocytes at the site of inflammation (Le et al, 2002). PGLYRP1 recognizes the peptidoglycan of bacteria and activates the Toll pathway (Steiner, 2004). Several other molecules may serve as crucial mediators of inflammatory damage. Matrix metalloproteinase 9, largely expressed by neutrophils (Opdenakker et al, 2001), participates in the degradation of extracellular matrix and blood–brain barrier breakdown. Matrix metalloproteinase 9 plasma levels have been related to the infarct volume (Montaner et al, 2003b) and predict hemorrhagic complications after thrombolysis (Castellanos et al, 2003; Montaner et al, 2003a). S100 proteins including S100P, A8, A9 and A12, are also expressed by activated granulocytes (Roth et al, 2003; Vogl et al, 1999). These proteins, bind specifically to vascular endothelial cells and induce a thrombogenic and inflammatory response (Viemann et al, 2004). Neutrophil cytosolic factor-4 (NCF-4) is also induced by 3 h after stroke, a gene that codes for p40(phox) protein that is a component of the nicotinamide adenine dinucleotide phosphate (NADPH)-oxidase complex that produces superoxide-generated free radicals in neutrophils, and is related to NCF-1 and NCF-2, which are mutated in neutrophils of patients with chronic granulomatous disease (Kuribayashi et al, 2002).
Coagulation factor V and VIII are also upregulated after ischemic stroke in this study. Plasma levels of these two factors are increased in acute coronary syndromes and correlate with the magnitude of inflammation (Apetrei et al, 2004). These procoagulants might be expressed by monocytes/macrophages and participate in the inflammatory process (Edwards and Rickles, 1984).
Several genes regulated at 3 h, including pellino 1, IRAK and NALP12, play important roles in IL-1 signaling (Jiang et al, 2003; Tschopp et al, 2003). However, the blood expression of IL-1β itself was not increased until 5h. Therefore, cytokines released from endogenous microglia may play a role in priming the IL-1 pathway of peripheral leukocytes. Besides the proinflammatory molecules, several molecules that negatively regulate the innate immune responses were also expressed. For example, the prototypic decoy receptor IL-1RII, which is the major IL-1 scavenger on PMNs (Bourke et al, 2003), is increased at 3 h after stroke. SOCS3, a suppressor of cytokine signaling, correlates highly with the expression of IL-1β in this study and may represent an important mechanism for limiting the immune response (Starr et al, 1997).
Stroke Blood Test—Previous Studies: Since changes of gene expression are detected before 3 h after stroke, and 10/15 patients can be predicted as having stroke at 3 h compared with healthy controls, it is possible that these changes of gene expression could be useful in developing a diagnostic test for stroke. Many attempts have been made at identifying serum or plasma protein markers of stroke, including MMP9, GFAP, S100 proteins, neuron-specific enolase, N-acetyl-aspartic acid and many others (Ali et al, 2001, 2000; Bertsch et al, 2001; Buttner et al, 1999, 1997; Castellanos et al, 2003; Elting et al, 2000; Herrmann et al, 2000; Lindsberg and Grau, 2003; Lynch et al, 2004; Martens et al, 1998; Montaner et al, 2003a, b; Persson et al, 1987; Ribo et al, 2004; Rosen et al, 1998; Schoerkhuber et al, 1999; Smith et al, 2004; Stevens et al, 1999; Strachan et al, 1999; Sulter et al, 1998; Ueda et al, 1995; Vila et al, 2000). Indeed, MMP9, alone or with a panel of four proteins, can predict stroke with high accuracy (Lynch et al, 2004; Montaner et al, 2003b). However, most of the proposed markers have not been examined in the very acute patient between 2 and 12 h when acute diagnosis and treatment are most important. Whether gene expression or protein levels will eventually be used for a diagnostic test, the present study suggests that there are very early changes that could be useful in diagnosis and potentially predict the hemorrhagic complications of tPA and other drugs (Montaner et al, 2003a). Ribonucleic acid expression might be useful because it is induced before proteins, though it is easier to measure proteins rapidly using current technology.
Effects of Comorbidities and Other Risk Factors on Gene Expression in Blood
It is important to emphasize that the 18 genes identified in this study might or might not be those most useful in eventually diagnosing stroke in a 3-h time window. The genes derived in this study compared ischemic strokes with healthy controls poorly matched for age, race and vascular risk factors. We have previously characterized the genomic changes in blood related to age and gender (Tang et al, 2004b), and hence these were not included in the lists of genes identified in the current study. Our preliminary results indicate that race may modulate gene expression after acute stroke, but this is not a major factor. The effects of common vascular risk factors, including smoking, hypertension, diabetes and hyperlipidemia, have been controlled to some degree by Moore et al (2005), but need further study. Even if risk factors were controlled for, the current data does not answer whether this panel of genes would distinguish ischemic stroke from intracerebral hemorrhage or other medical conditions like myocardial infarction. Thus, the changes of gene expression must be interpreted with caution. However, it is clear that the evolving genomic pattern identified in the current study is mostly caused by stroke, because the effects of coexisting confounding factors would be relatively stable for a particular patient and would not progress over a 24-h period of time. The progression of gene expression over time suggests that the gene changes identified here were related, at least in large part, to evolving cerebral infarction.
How Genes in Blood Relate to the Pathophysiology of Ischemic Brain Injury. The mechanisms for the extremely rapid changes in gene expression after ischemic stroke remain to be elucidated, but may involve direct interactions between the white blood cells and ischemic brain endothelium. In addition, it is possible that the blood genomic response is preprogrammed to some extent once cerebral ischemia occurs. The current data also shows that genomic changes of peripheral granulocytes precede their detectable accumulation in brain by nuclear imaging techniques (Akopov et al, 1996; Price et al, 2004). This is expected since signals between cerebral endothelial cells and passing leukocytes must first result in chemoattraction, which is then followed by adhesion and migration into the brain. The genomic changes that occur in the leukocytes during this time should help us understand this process in humans. If the response of neutrophils and monocytes after stroke is harmful, then strategies for knocking down the genes identified here in peripheral blood leukocytes might decrease this inflammatory response and thereby improve tissue survival after ischemia and perhaps decrease reperfusion induced cerebral hemorrhage.
Footnotes
References
Supplementary Material
Please find the following supplemental material available below.
For Open Access articles published under a Creative Commons License, all supplemental material carries the same license as the article it is associated with.
For non-Open Access articles published, all supplemental material carries a non-exclusive license, and permission requests for re-use of supplemental material or any part of supplemental material shall be sent directly to the copyright owner as specified in the copyright notice associated with the article.