
Abstract
We studied unique cerebral blood flow (CBF) responses to cortical spreading depression in mice using a novel two-dimensional CBF imaging technique, laser speckle flowmetry. Cortical spreading depression caused a triphasic CBF response in both rat and mouse cortex. In rats, mild initial hypoperfusion (approximately 75% of baseline) was followed by a transient hyperemia reaching approximately 220% of baseline. In mice, the initial hypoperfusion was pronounced (40–50% of baseline), and the anticipated hyperemic phase barely reached baseline. The duration of hypoperfusion significantly correlated with the duration of the DC shift. As a possible explanation for the pronounced hypoperfusion, mouse cerebral vessels showed enhanced resistance to relaxation by acetylcholine (3 μM) after K+-induced preconstriction (20, 40, and 80 mM) but dilated normally in response to acetylcholine after preconstriction with U46619, a synthetic thromboxane A2 analog. By contrast, rat vessels dilated readily to acetylcholine after preconstriction by K+. The transient normalization of CBF after hypoperfusion in the mouse was abolished by L-NA but not 7-NI. In summary, the CBF response to cortical spreading depression in mice contrasts with the rat in that the initial hypoperfusion is pronounced, and the hyperemic phase is markedly diminished. The differences in CBF response between species may be in part caused by an increased sensitivity of mouse cerebral vessels to elevated extracellular K+.
Keywords
Cortical spreading depression (CSD) is a wave of slow negative potential shift propagating at 2 to 4 mm/min over cerebral cortex. Extracellular K+ increases to 30 to 60 mM, along with elevations in extracellular levels of excitatory neurotransmitters. The electrophysiologic mechanisms of CSD have been extensively investigated and discussed elsewhere (Somjen, 2001). However, CSD-induced cerebral blood flow (CBF) changes have not yet been reported in mice, a species commonly used to delete genes or express transgenes by genetic engineering.
In different species including rats, CSD causes a large transient CBF increase, followed by delayed oligemia lasting up to 1 hour (Piper et al., 1991; Shibata et al., 1990; Zhang et al., 1994). However, brief hypoperfusion occasionally precedes the hyperemia (Dreier et al., 1998, 2001; Duckrow, 1993; Fabricius et al., 1995; Sonn and Mayevsky, 2000; Van Harreveld and Ochs, 1957). In support of this, reduced cerebral blood volume (CBV) precedes the hyperemia in rats and cats (Tomita et al., 2002). The factors that mediate CBF changes during CSD remain unknown, although K+, H+, prostanoids, nitric oxide (NO), and calcitonin gene-related peptide (CGRP) have been implicated (Colonna et al., 1994a, b , 1997; Kraig and Cooper, 1987; Meng and Busija, 1996; Meng et al., 1995; Wahl et al., 1994).
A role for CSD in the pathophysiology of focal cerebral ischemia has been suggested (Branston et al., 1977, 1982; Nedergaard, 1988) based upon the fact that multiple peri-infarct depolarizations resembling CSD spontaneously develop in focal ischemic penumbra (Nedergaard and Hansen, 1993) and impose an increased tissue metabolic load (Mayevsky and Weiss, 1991; Mies and Paschen, 1984). In contrast to normal brain, ischemic brain cannot increase CBF to match the increased metabolic load, and, therefore, energy deficits and tissue injury exacerbate. Hence, peri-infarct depolarizations worsen ischemic injury (Back et al., 1996, 1994; Takano et al., 1996). The results of the present study show that mice exhibit pronounced hypoperfusion coincident with the depolarization wave during CSD that significantly differs from the rat and that NO synthase (NOS) inhibition exacerbates this hypoperfusion. The species differences may be related to a higher sensitivity of mouse cerebral arteries to elevated extracellular K+. These results suggest that hemodynamic alterations may further exacerbate the metabolic mismatch imposed upon focal ischemic penumbra by peri-infarct depolarizations and provide a potential explanation for the deleterious effects of endothelial NOS inhibition in focal cerebral ischemia.
MATERIALS AND METHODS
General preparation
Mice (SV129 and C57BL/6J, 23–28 g) were housed under diurnal lighting conditions and allowed food and tap water ad libitum. Mice were anesthetized with 2% isoflurane (in 70% N2O and 30% O2) and intubated transorally. Femoral artery was catheterized for the measurement of mean arterial pressure (MAP; ETH 400 transducer amplifier). Anesthesia was maintained by 1% isoflurane, which in our previous experience did not significantly alter the electrophysiologic properties of CSD in mice, compared with α-chloralose (Ayata et al., 2000). The depth of anesthesia was checked by the absence of cardiovascular changes in response to tail pinch. Rectal temperature was kept at 36.8°C to 37.1°C using a thermostatically controlled heating mat (FHC, Brunswick, ME). Mice were paralyzed (pancuronium bromide, 0.4 mg/kg intravenously, q 45 minutes) and mechanically ventilated (CWE, SAR-830, Ardmore, PA, U.S.A.). In preliminary experiments we showed that pancuronium did not alter the CBF response to CSD in mice. Mice were then placed in a stereotaxic frame (David Kopf, Tujunga, CA, U.SA>). End-tidal CO2 was monitored by a microcapnometer (Columbus Instruments, Columbus, OH, U.S.A.). Arterial blood gases and pH were measured several times during each experiment (Corning 178 blood gas/pH analyzer, Ciba Corning Diag., Medford, MA, U.S.A.) and used to verify the end-tidal CO2 measurements. The arterial blood gas and pH were within previously reported normal limits (Dalkara et al., 1995). The mean arterial pressures were 94 ± 18 (n = 5) and 79 ± 8 mm Hg (n = 22) in SV129 and C57BL/6J mice, respectively (P > 0.05). Mice were allowed to stabilize for 30 minutes after surgical preparation.
To compare CSD-induced CBF changes between rats and mice, rats (Sprague-Dawley, 200–250 g) were anesthetized using isoflurane (2.5% induction, 1% maintenance, in 70% N2O and 30% O2). Arterial blood pressure (85 ± 5 mm Hg) and blood gases (pH, 7.38 ± 0.04; pCO2, 44 ± 6 mm Hg; pO2, 149 ± 31 mm Hg) were monitored using a catheter placed in femoral artery. Intubation and mechanical ventilation were not performed because arterial blood gas values were within normal range in freely breathing rats throughout the experiment. Two craniotomies were opened: 4 × 4 mm on parietal bone and 1 × 1 mm on frontal bone. Dura was kept intact to minimize brain pulsations and covered with a thin layer of mineral oil to prevent drying.
Laser speckle flowmetry
Laser speckle-flowmetry (LSF) was used to study the spatiotemporal characteristics of CBF changes during CSD in C57BL/6J mice (n = 16) and Sprague Dawley rats (n = 4). The technique for LSF has been described in detail elsewhere (Dunn et al., 2001). Briefly, a CCD camera (Cohu, San Diego, CA, U.S.A.) was positioned above the head, and a laser diode (780 nm) was used to diffusely illuminate the intact skull in mice and dura in rats. The penetration depth of the laser is approximately 500 μm. In preliminary experiments, we showed that the amplitude of relative CBF changes measured through intact skull did not significantly differ from those measured through a cranial window. Raw speckle images were used to compute speckle contrast, which is a measure of speckle visibility related to the velocity of the scattering particles. The speckle contrast is defined as the ratio of the standard deviation of pixel intensities to the mean pixel intensity in a small region of the image (Briers, 2001). Ten consecutive raw speckle images were acquired at 15 Hz (an image set), processed by computing the speckle contrast using a sliding grid of 7 × 7 pixels and averaged to improve signal-to-noise ratio. Speckle contrast images were converted to images of correlation time values, which represent the decay time of the light intensity autocorrelation function. The correlation time is inversely and linearly proportional to the mean blood velocity (Briers, 2001). The pial arterioles were identified under stereomicroscopy based upon their color and anatomic locations. To determine the changes in CBF, regions of interest (ROIs) were placed over different tissue areas. In case of cortical tissue measurements, the ROIs (0.1–0.25 mm2) were placed away from visible cortical vessels. CBF changes in arteries were quantified by placing the ROI over a branch of middle cerebral artery. Relative blood flow images (percentage of baseline) were calculated by computing the ratio of a baseline image of correlation time values to subsequent images. Laser speckle perfusion images were obtained every 7.5 seconds in mice and every 15 seconds in rats for 30 minutes.
To analyze the time course and amplitude of CBF changes during CSD, we defined the onset of hypoperfusion as time zero, and the latency to and the amplitude of the following CBF deflection points were measured: the initial brief CBF increase, the onset of hypoperfusion, the trough of hypoperfusion, peak of transient normalization, and 3 and 5 minutes after the onset of hypoperfusion.
Electrophysiology and laser Doppler flowmetry
The amplitude and time course of CBF changes and their temporal relationship to the electrophysiologic changes during CSD were studied using LDF in rats (Sprague-Dawley, n = 2) and mice (SV129, n = 5; C56BL/6J, n = 6). For these experiments, three burr holes (0.8 mm in diameter) were opened at the following coordinates: 1) KCl injection: 0 mm anterior, 1.5 mm lateral from lambda; 2) Recording site 1: 1.5 mm posterior, 1.5 mm lateral from bregma; and 3) Recording site 2: 1 mm anterior, 1 mm lateral from bregma. Cortex was covered with mineral oil to prevent drying. The extracellular steady (DC) potential and electrocorticogram (ECoG) were recorded by glass micropipettes (tip resistance 1–2 MΩ) at a cortical depth of 400–600 μm and a microelectrode amplifier (Axoprobe 1A, Axon instruments). An Ag/AgCl reference electrode was placed under the contralateral scalp. Dura was kept intact because it did not interfere with the insertion of micropipettes. CBF at the electrophysiologic recording sites was measured using LDF (Periflux PF2B, Perimed, Sweden). The LDF probes (0.6 mm diameter) were placed on the cortex overlying the micropipettes using a micromanipulator and kept away from large pial vessels. The Doppler signal was averaged over 0.2 seconds. The duration of hypoperfusion was measured between the initial brief CBF increase and the peak of transient normalization. To analyze the temporal relationship between the CBF changes and the DC shift, we determined the latency from the onset of DC shift to the trough of hypoperfusion and the peak of transient normalization. The duration of DC shift was measured from its onset to the point where it returns to baseline. The data from the first CSD in each mouse (C57BL/6J, n = 6; SV129, n = 5) were used for the regression analysis between the duration of DC shift and the duration of hypoperfusion. The speed of propagation of SD wave was calculated from the latency of the DC shift between the two recording sites and the distance between the electrode tips.
Experimental protocols
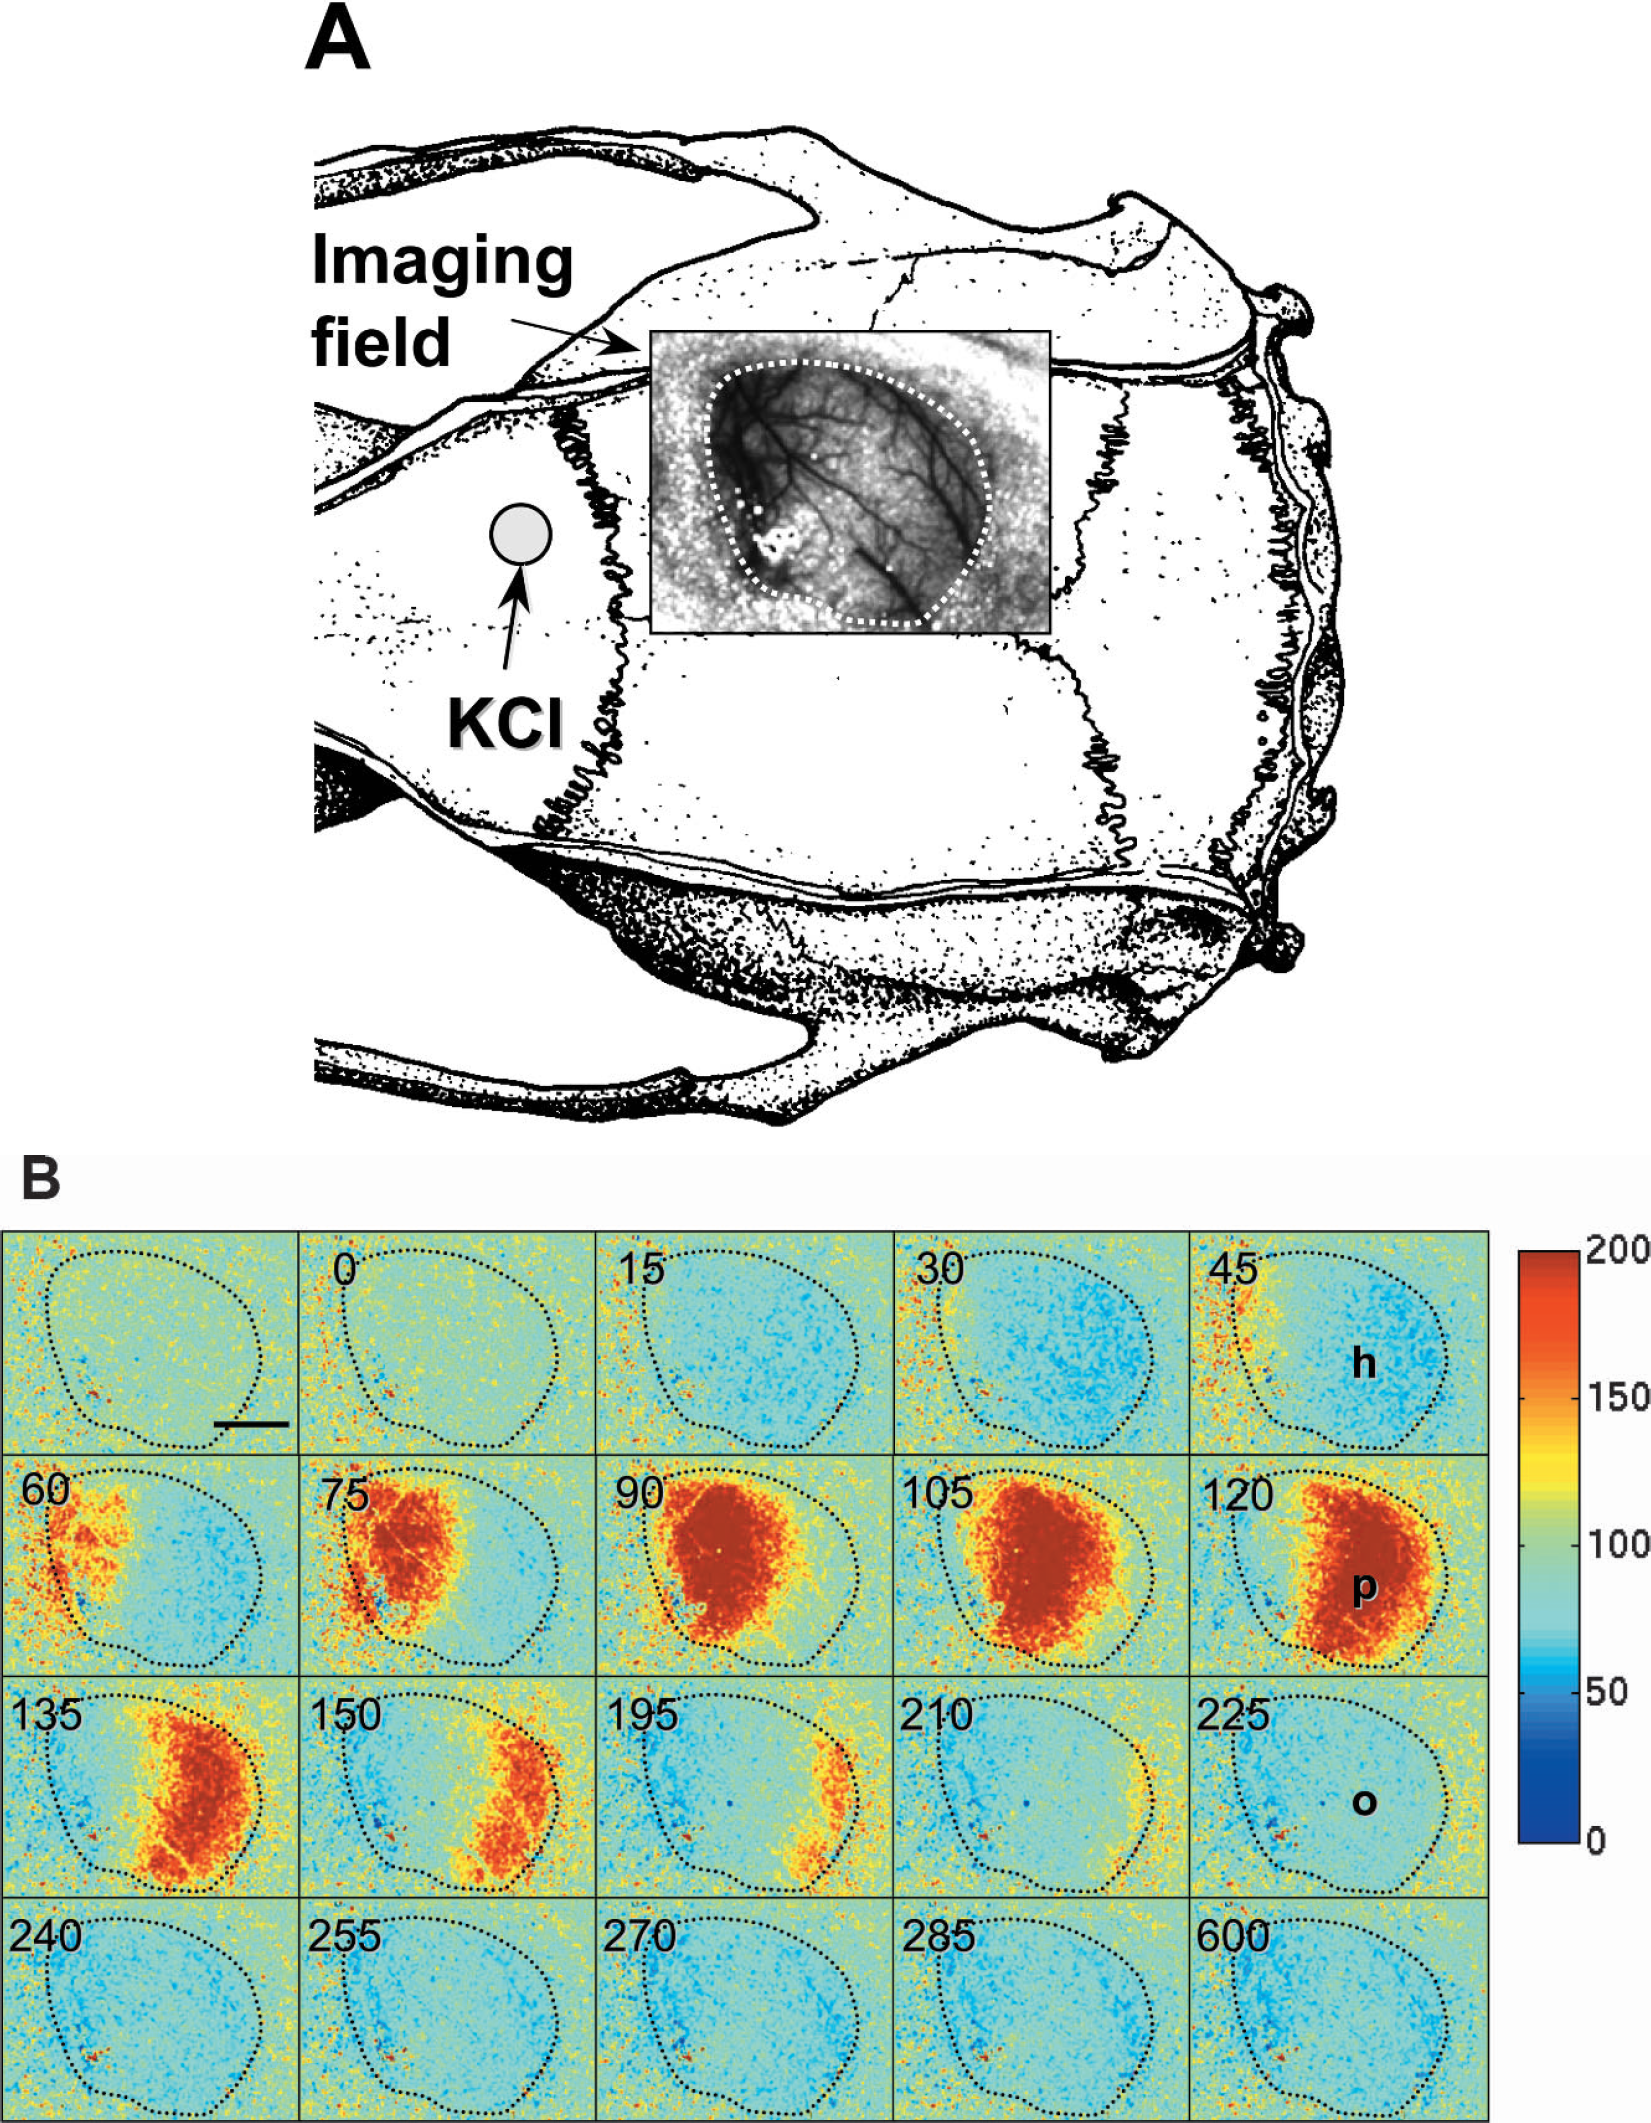
Cortical spreading depressions were induced every 60 minutes by focal application of 10 μL, 0.5 M KCl (5 μmol) onto occipital cortex in mice, and onto frontal cortex in rats. A small dural opening allowed passive diffusion of KCl into the cortex and facilitated the CSD induction. In preliminary experiments, we determined that CSDs triggered by pinprick induced identical CBF responses to those triggered by KCl application. In addition, the location of KCl application did not influence the CBF response in either rats or mice. In focal cerebral ischemia, spontaneous peri-infarct depolarizations resembling CSDs are observed every 5 to 8 minutes in mice (up to 10 CSDs per hour). To simulate the frequency of peri-infarct depolarizations, we studied the CBF response to two consecutive CSDs in mice by repeating the KCl application within 5 to 8 minutes. To test the role of nitric oxide, L-NA (10 mg/kg, intraperitoneally, n = 4) or 7-NI (50 mg/kg, intraperitoneally, dissolved in peanut oil, n = 6) were administered 1 hour before the induction of CSD in separate groups of C57BL/6J mice. This dose of L-NA inhibited the brain NOS activity by 60% to 80% in different studies (Gidday et al., 1999; Izuta et al., 1995; Traystman et al., 1995; Yoshida et al., 1994). The dose of 7-NI chosen for this study inhibits brain NOS activity by 60% without inhibiting the endothelial NOS function (Izuta et al., 1995; Yoshida et al., 1994). Vehicle controls were done using either saline or peanut oil (0.2 mL, n = 2 each) and did not differ from untreated control mice (n = 2). Therefore, vehicle-treated and untreated mice were pooled into a single control group (n = 6). The effects of NOS inhibitors upon baseline CBF and cerebrovascular resistance (CVR) were determined every 15 minutes for 1 hour by LSF. CVR changes were calculated using the following formula:
We performed laser speckle flowmetry in four rats to compare CSD-induced CBF changes with mice. In addition, we performed laser Doppler-flowmetry with extracellular DC potential recordings in two rats to reproduce the previously published CBF response and compare this with laser speckle and to demonstrate the temporal relationship of the DC shift to the CBF changes in rats. All other in vivo experiments were performed in mice.
Isolated basilar artery preparation
Mice (n = 10) or rats (n = 6 rats, 12 basilar artery preparations) were killed by decapitation. Brains with attached arteries were removed and immersed in physiologic solution (composition, mM: NaCl, 118; KCl, 4.6; NaHCO3, 25; MgSO4, 1.2; KH2PO4, 1.2; CaCl2, 1.25; glucose, 10; EDTA, 0.025; pH 7.4 at 37 °C). Basilar artery was dissected, cut into segments (1.5–2 mm long), threaded onto wires (25 μm diameter stainless steel in rats, 15 μm diameter tungsten in mice), and mounted in an isometric myograph (610M, Danish Myo Technology, Aarhus, Denmark). After mounting, each preparation was stabilized for 30 minutes in physiologic solution and aerated with 95% O2/5% CO2 at 37°C. The normalized passive resting force and corresponding diameter was then determined for each preparation from its own length-pressure curve (Mulvany and Halpern, 1977). Contractile responses were recorded into a computer using a data acquisition and recording software (Myodaq and Myodata, Danish Myo Technology). After normalization and 30-minute equilibration in physiologic solution, the preparations were constricted with isotonic depolarizing high-K+ solutions, in which part of NaCl had been replaced by equimolar amount of KCl. We preconstricted the basilar arteries with 20, 40, or 80 mM K+ to study the endothelium-dependent relaxations. Once the K+-evoked vasoconstriction had reached a steady-state, one of the following vasodilating agents were added in the organ chamber: acetylcholine (ACh, 3 μM), sodium nitroprusside (SNP, 1 μM), or papaverine (3 μM). After washout and 30-minute recovery, the preparations were exposed to a synthetic thromboxane A2 analog, U46619 (0.3 μM), to constrict mouse basilar arteries. This compound induces a reproducible and stable response in this species, which is comparable in amplitude to 80 mM K+-induced constriction. During U46619 preconstriction, vessels were again exposed to ACh to test the integrity of endothelium, as well as to SNP and papaverine.
Data acquisition and analysis
The data were continuously recorded using a data acquisition and analysis system (PowerLab, AD Instruments, Medford, MA, U.S.A.), stored in a computer, and expressed as mean ± SD. Statistical comparisons were done using paired or unpaired Student's t-test or one-way ANOVA followed by Fisher's protected least significant difference test. Linear regression was used to correlate the durations of the DC shift and hypoperfusion. P < 0.05 was considered statistically significant.
RESULTS
LSF demonstrated a triphasic CBF response to CSD in mice (C57BL/6J, n = 6; Figs. 1 and 2). CSD was associated initially with a wave of hypoperfusion propagating in all directions over the cortex. CBF then transiently normalized, followed by a second phase of post-CSD oligemia (50–60% of baseline) lasting up to 1 hour. The triphasic CBF response tended to be even more prominent in pial arteries compared with cortical capillaries (Fig. 2). When CSDs were repeated 60 minutes apart, the triphasic CBF response was highly reproducible. When two consecutive CSDs were induced 5 to 10 minutes apart, the second CSD took place during the post-CSD oligemia (40–50% of initial baseline) in the wake of the first event. The trough of initial hypoperfusion and the peak of transient normalization during the second CSD were comparable with the first CSD, although the baseline before the second CSD was reduced because of the post-CSD oligemia in the wake of the first CSD (Fig. 2). The CBF response in mice significantly differed from rats because in the latter CSD caused a large CBF increase (220% of baseline) followed by delayed oligemia (75% of baseline, n = 4) (Figs. 3 and 4). A small and brief initial hypoperfusion was also observed (approximately 25%), as previously reported (Fabricius et al., 1995). Identical CBF changes were observed when CSD was triggered by pinprick (data not shown), although only data after KCl is presented.
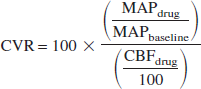
Laser speckle flowmetry of CSD-induced CBF changes in a C57BL/6J mouse. (A) The imaging field (8 × 6 mm) was positioned over the right hemisphere, as shown by the speckle contrast image obtained through intact skull. CSD was induced in medial occipital cortex by KCl application (10 mL, 0.5 M). (B) Laser speckle flowmetry images of relative changes in CBF obtained every 7 to 8 seconds, as indicated in the upper left corners. CSD was associated with a wave of hypoperfusion (h) spreading in all directions over the cortex (approximately 5 mm/min). This was followed by a transient recovery (p) and then a prolonged oligemia (o). The early and persistent hypoperfusion immediately surrounding the CSD induction site represents the direct vasoconstrictive effect of topically applied KCl on the cortex. Horizontal bar = 2 mm. Vertical color bar shows relative changes in CBF expressed as percentage of baseline.
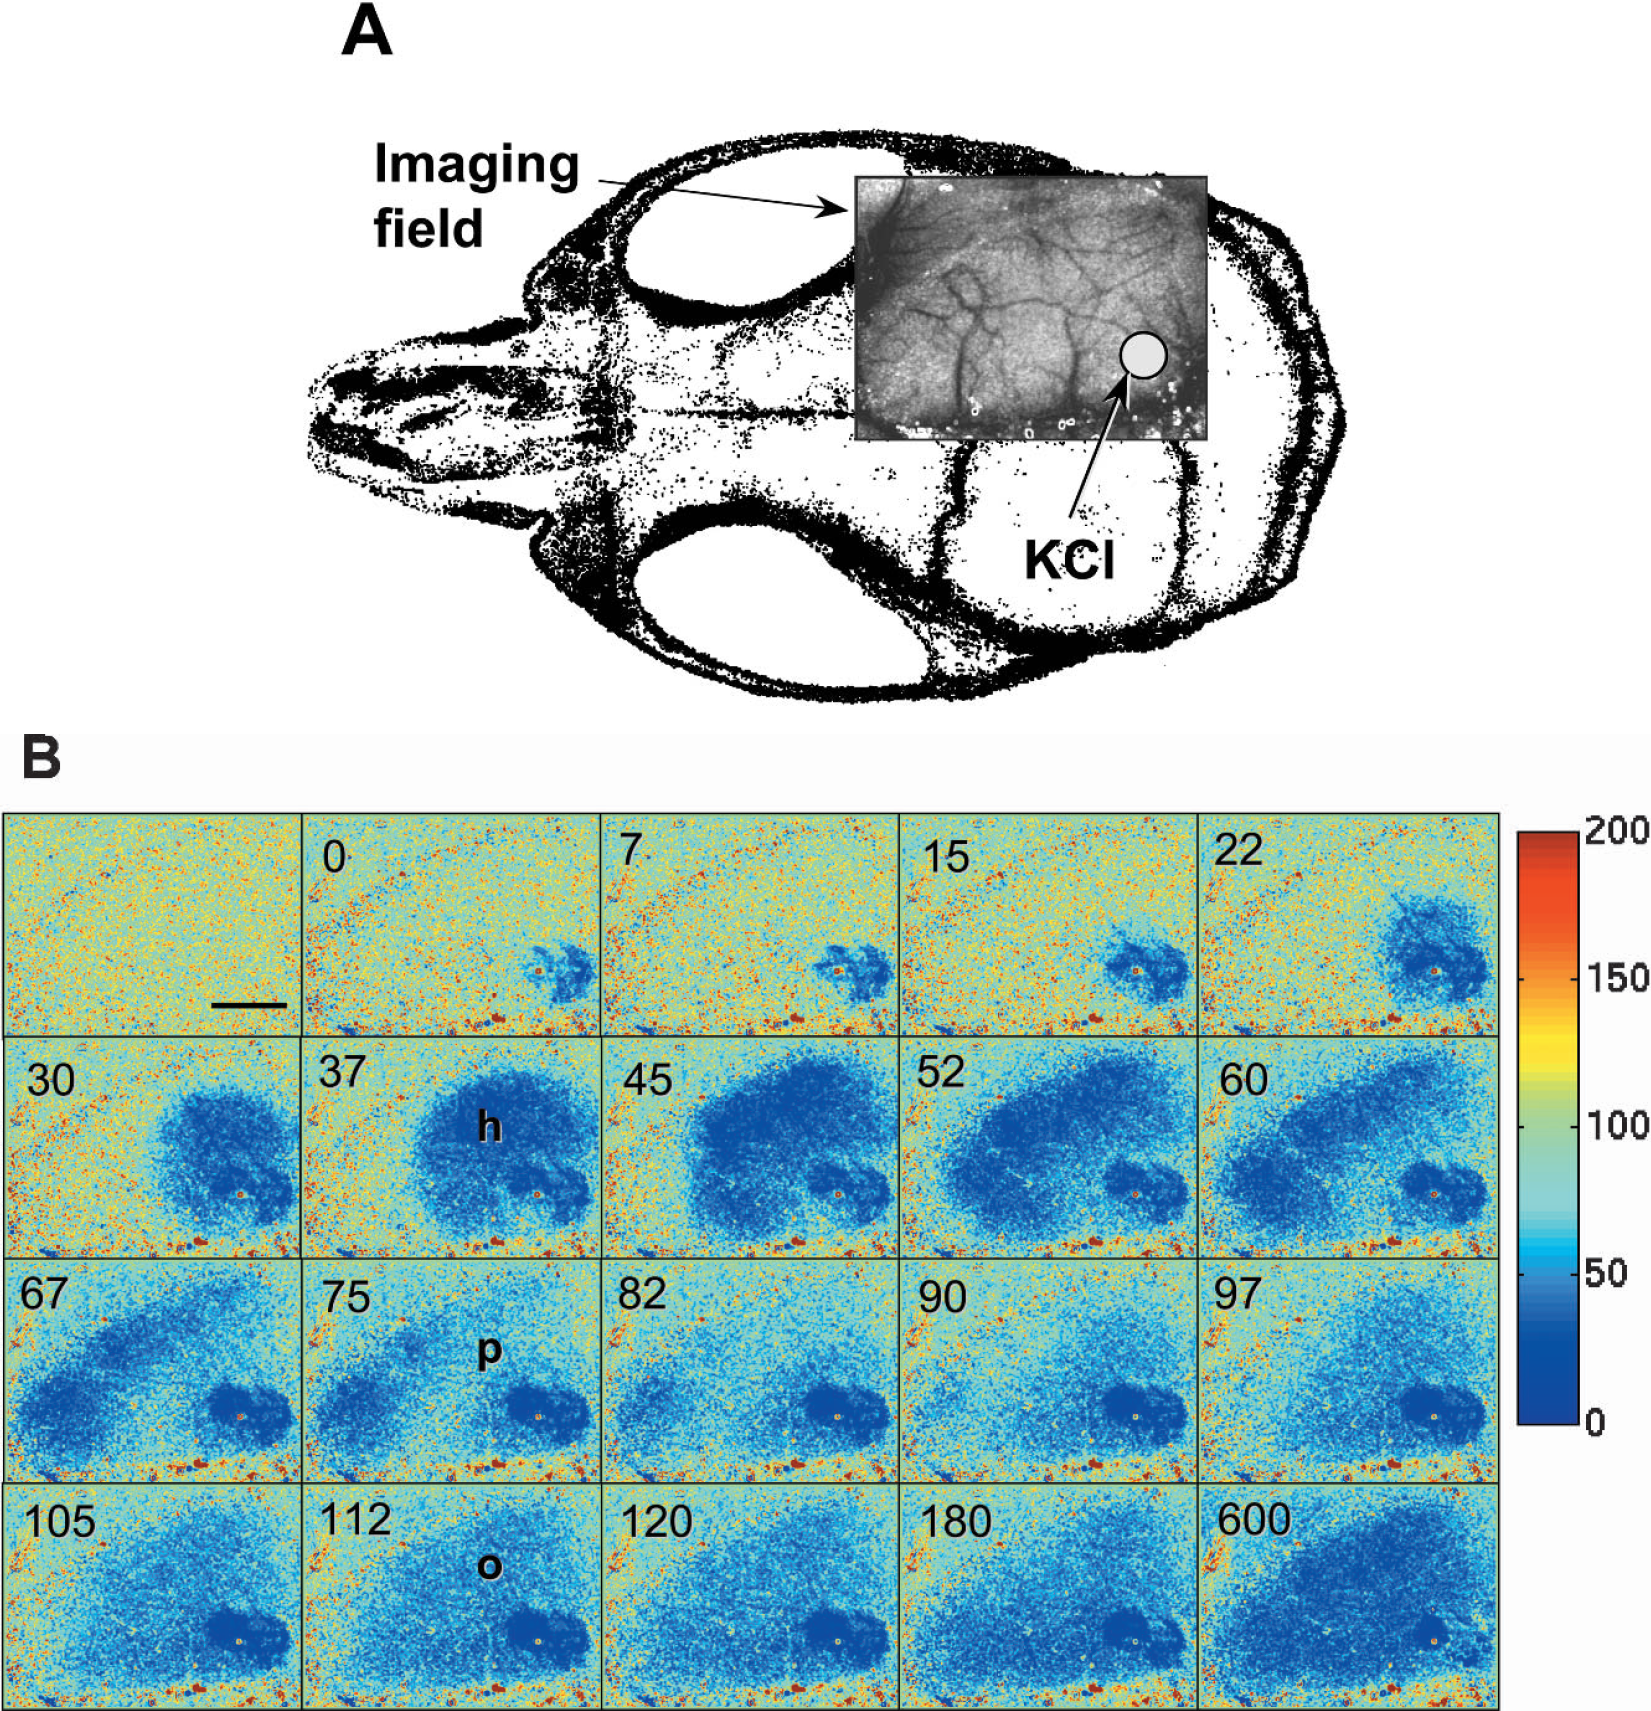
The time course of CBF changes during CSD measured by LSF in C57BL/6J taken from the right frontal cortex (n = 6). Changes in cortical capillary and arterial flow were measured separately by appropriately placing the ROI over the cortex free of blood vessels (squares) or over an arteriole (circles). CSD was associated with an initial hypoperfusion followed by a transient recovery of CBF and a post-CSD oligemia. Arteriolar CBF changes tended to be more prominent compared to cortical capillary bed. The left and right panels show the CBF response to the first and second (5 minutes later) of two consecutive CSDs, respectively. Vertical and horizontal bars indicate standard deviations of the amplitude of the CBF changes and the latency of the deflection points from the onset of hypoperfusion, respectively.
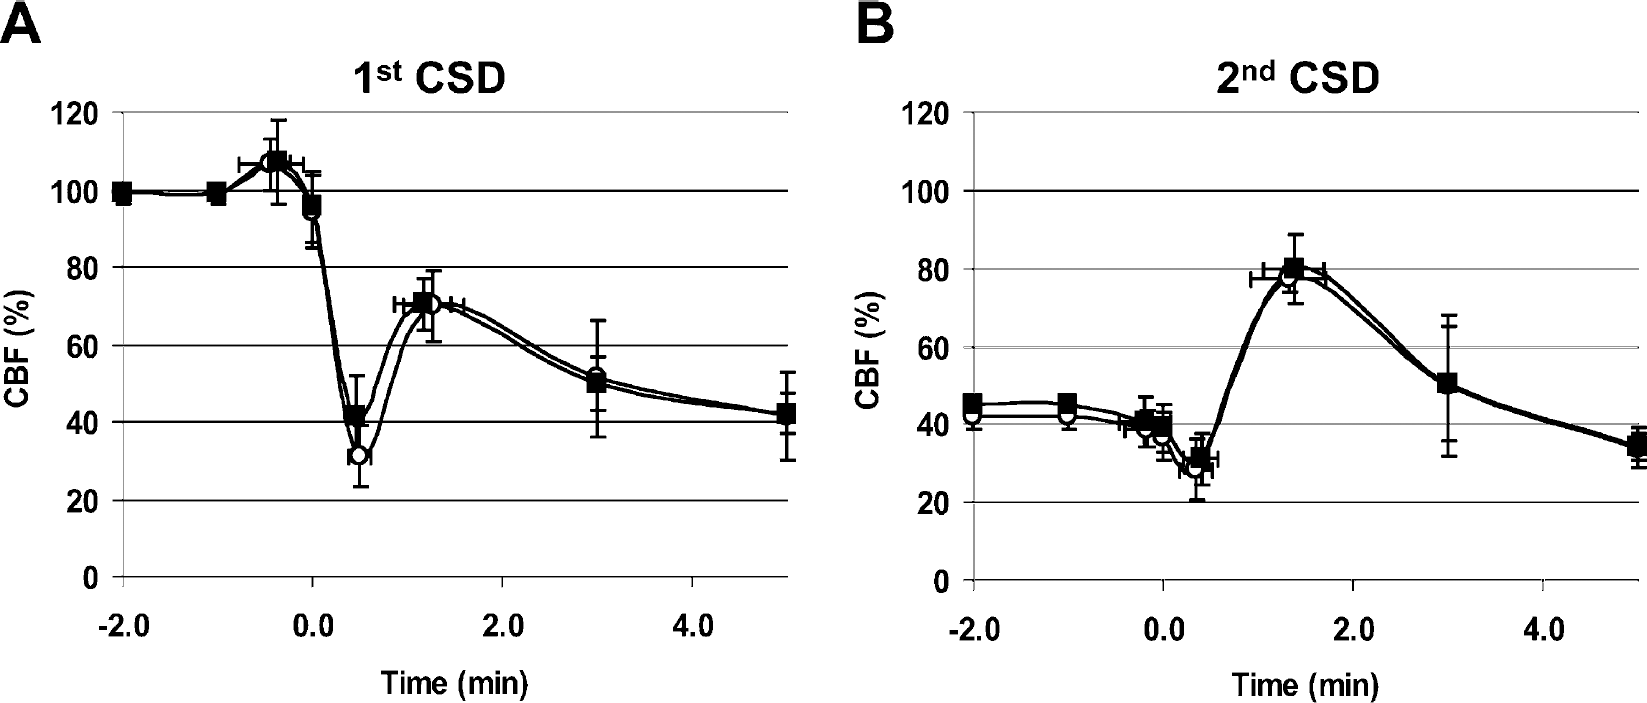
Laser speckle flowmetry of CSD-induced CBF changes in a Sprague-Dawley rat. (A) The imaging field (8 × 6 mm) was positioned over the right parietal craniotomy (dashed line), as shown by the speckle contrast image. CSD was induced in medial frontal cortex by KCl application (10 mL, 0.5 M). (B) Laser speckle perfusion imaging of relative changes in CBF obtained every 15 seconds, as indicated in the upper left corner. CSD was associated with a small initial hypoperfusion followed by a profound hyperemia spreading over the cortex (4 mm/min). This was followed by prolonged oligemia. Horizontal bar = 2 mm. The position of the imaging field is shown in (A). Color bar shows relative changes in CBF expressed as percent of baseline. Dashed lines (A and B) indicate the location of the craniotomy.
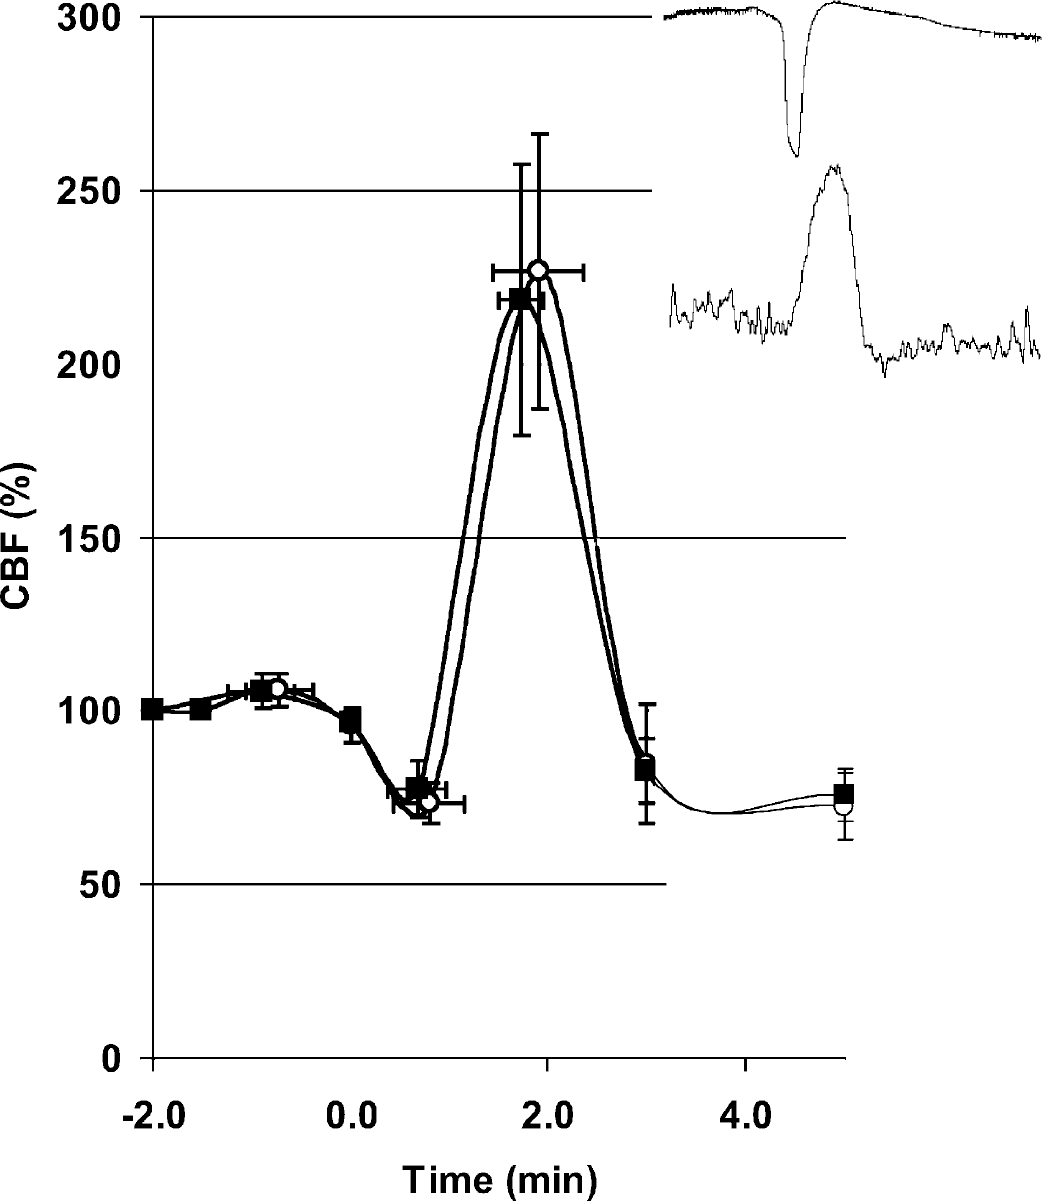
The time course of CBF changes during CSD measured by LSF in Sprague-Dawley rats (n = 4). CSD was associated with a brief and small initial hypoperfusion followed by a profound hyperemia and a post-CSD oligemia. This pattern of CBF response to CSD in rats was very different from that in mice, where the initial hypoperfusion was larger and hyperemia absent. Changes in cortical capillary and arterial flow were quantified separately by appropriately placing the ROI over the cortex free of blood vessels (squares) or over an arteriole (circles). Vertical and horizontal bars indicate standard deviations of the amplitude of CBF changes and the latency from the onset of hypoperfusion, respectively. The inset shows representative tracings comparing the temporal relationship between the extracellular DC potential (top) and regional CBF changes (bottom) recorded using LDF from the same cortical area simultaneously during a CSD in the rat. The hyperemia in the rat started during the repolarization phase of CSD and peaked after the full recovery of DC shift (inset). Hence, this temporal pattern was similar to the transient normalization of CBF in the mouse (Fig. 5, p).
We confirmed the triphasic nature of the CBF changes imaged using LSF by performing LDF in a separate group of mice. The time course and amplitude of CSD-induced CBF changes agreed between the two techniques (n = 6 per group) (Figs. 2 and 5). Hence, the triphasic CBF response to CSD was species dependent, although the electrophysiologic properties in mice (i.e., the amplitude, duration, and propagation speed of the DC potential shift) were similar to previously reported data in other species (Table 1) (Somjen, 2001).
Electrophysiologic properties of CSD in mice
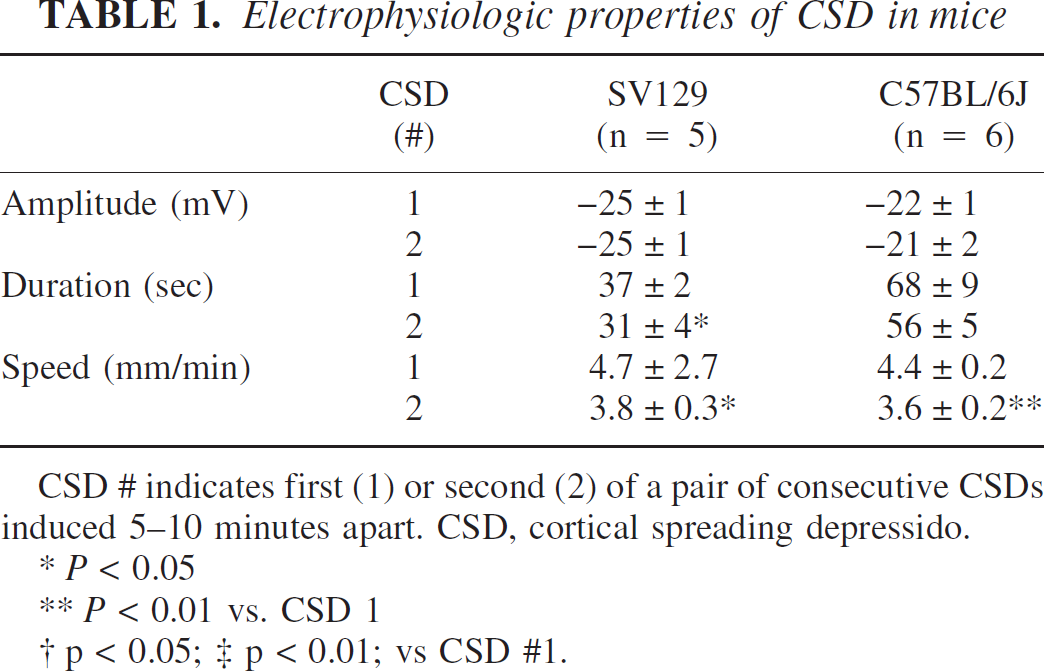
CSD # indicates first (1) or second (2) of a pair of consecutive CSDs induced 5–10 minutes apart. CSD, cortical spreading depressido.
* P < 0.05
** P < 0.01 vs. CSD 1
† p < 0.05; ‡ p < 0.01; vs CSD #1.
We next determined the temporal relationship between the triphasic CBF response and the electrophysiologic changes during CSD. Simultaneous recording of LDF and the DC potential changes from the same cortical location in mice showed that there was a brief increase (10%) in CBF during the first 3 to 5 seconds of the DC shift. This small increase was quickly replaced by a pronounced hypoperfusion simultaneous with the DC shift (Fig. 5). The trough of hypoperfusion was reached 21 ± 4 seconds after the onset of DC shift (C57BL/6J). The transient normalization of CBF peaked when the repolarization phase of the DC shift was complete (66 ± 18 seconds after the onset of DC shift; C57BL/6J). The CBF response was similar between C57BL/6J and SV129 (P > 0.05), although the transient normalization of CBF tended to be larger in amplitude in SV129 mice (n = 5, data not shown). The duration of the DC shift and the hypoperfusion were significantly correlated, and this was independent of mouse strain (r2 = 0.9, P < 0.01, n = 11 CSDs). In rats, the small initial hypoperfusion, when present (six out of eight CSDs in four rats), was simultaneous with the DC shift, and the subsequent hyperemia peaked after the complete repolarization of DC shift (Fig. 4). This temporal relationship between the CBF changes and the DC shift in rats was reminiscent of mice, suggesting that the transient normalization of CBF in mice temporally corresponds to the hyperemia in rats.
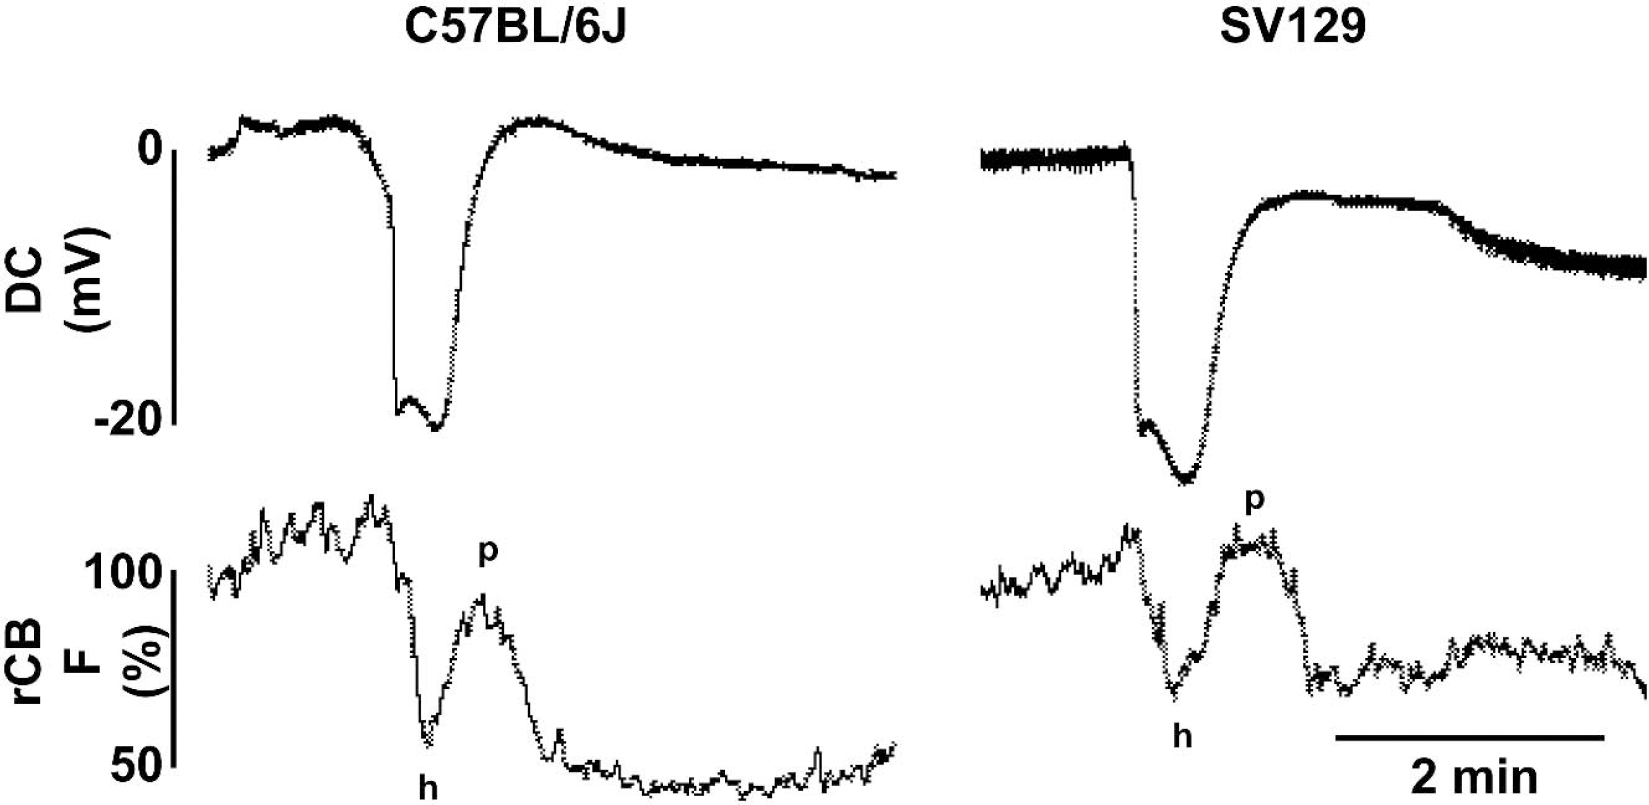
Representative tracings of CSD-induced regional CBF changes measured by LDF in mice (C57BL/6J and SV129). CBF tended to rise by approximately 10% during the first 5 seconds of DC shift. This brief early rise quickly turned into a hypoperfusion (h) coincident with the DC shift, which then transiently returned towards baseline (p) during repolarization, and peaked after the full recovery of the DC shift. This temporal pattern suggests that the transient normalization of CBF in mice corresponds to the hyperemic phase in rats (Fig. 4, inset). The CBF responses measured using LDF were comparable with those imaged using LSF (Figs. 2), and LDF recordings did not significantly differ between C57BL/6J and SV129 mice (n = 6 and 5, respectively; data not shown).
Effects of elevated K+ upon isolated cerebral arteries
Extracellular K+ elevations as high as 60 mM have been reported during CSD (Hansen et al., 1980). Elevated extracellular K+ exceeding 10 to 20 mM causes vasoconstriction in isolated arteries (Godfraind et al., 1986). To determine the sensitivity of cerebral vessels to elevated K+, we studied its effects upon isolated basilar arteries in mice (n = 10) and rats (n = 12). A direct comparison of the contractile force in response to elevated K+ was not possible because of the differences in basilar artery diameter between mice and rats. Therefore, we studied the ability of endothelium-dependent vasodilator ACh (3 μM) to relax basilar arteries preconstricted using either K+ or U46619 (Fig. 6). When preconstricted with 80 mM K+, mouse basilar artery failed to relax in response to ACh (0 ± 0%) (Fig. 6A). This was not caused by endothelial damage or dysfunction because ACh relaxed the same arteries by 27 ± 14% when preconstricted with U46619 (0.3 μM) (Fig. 6B). In contrast to mice, all rat basilar artery preparations preconstricted with 80 mM K+ relaxed to ACh (21 ± 9%, P < 0.01 vs. mouse) (Fig. 6C). The increased sensitivity of mouse arteries to elevated K+ was even more marked at lower K+ concentrations (Fig. 7). Endothelium-independent vasodilators SNP (1 μM) and papaverine (3 μM) induced 27 ± 1% and 22 ± 9% relaxation, respectively, in mouse basilar arteries preconstricted with 80 mM K+, compared with 16 ± 13% and 18 ± 4% relaxation, respectively, in the rat (P > 0.1, mouse vs. rat).
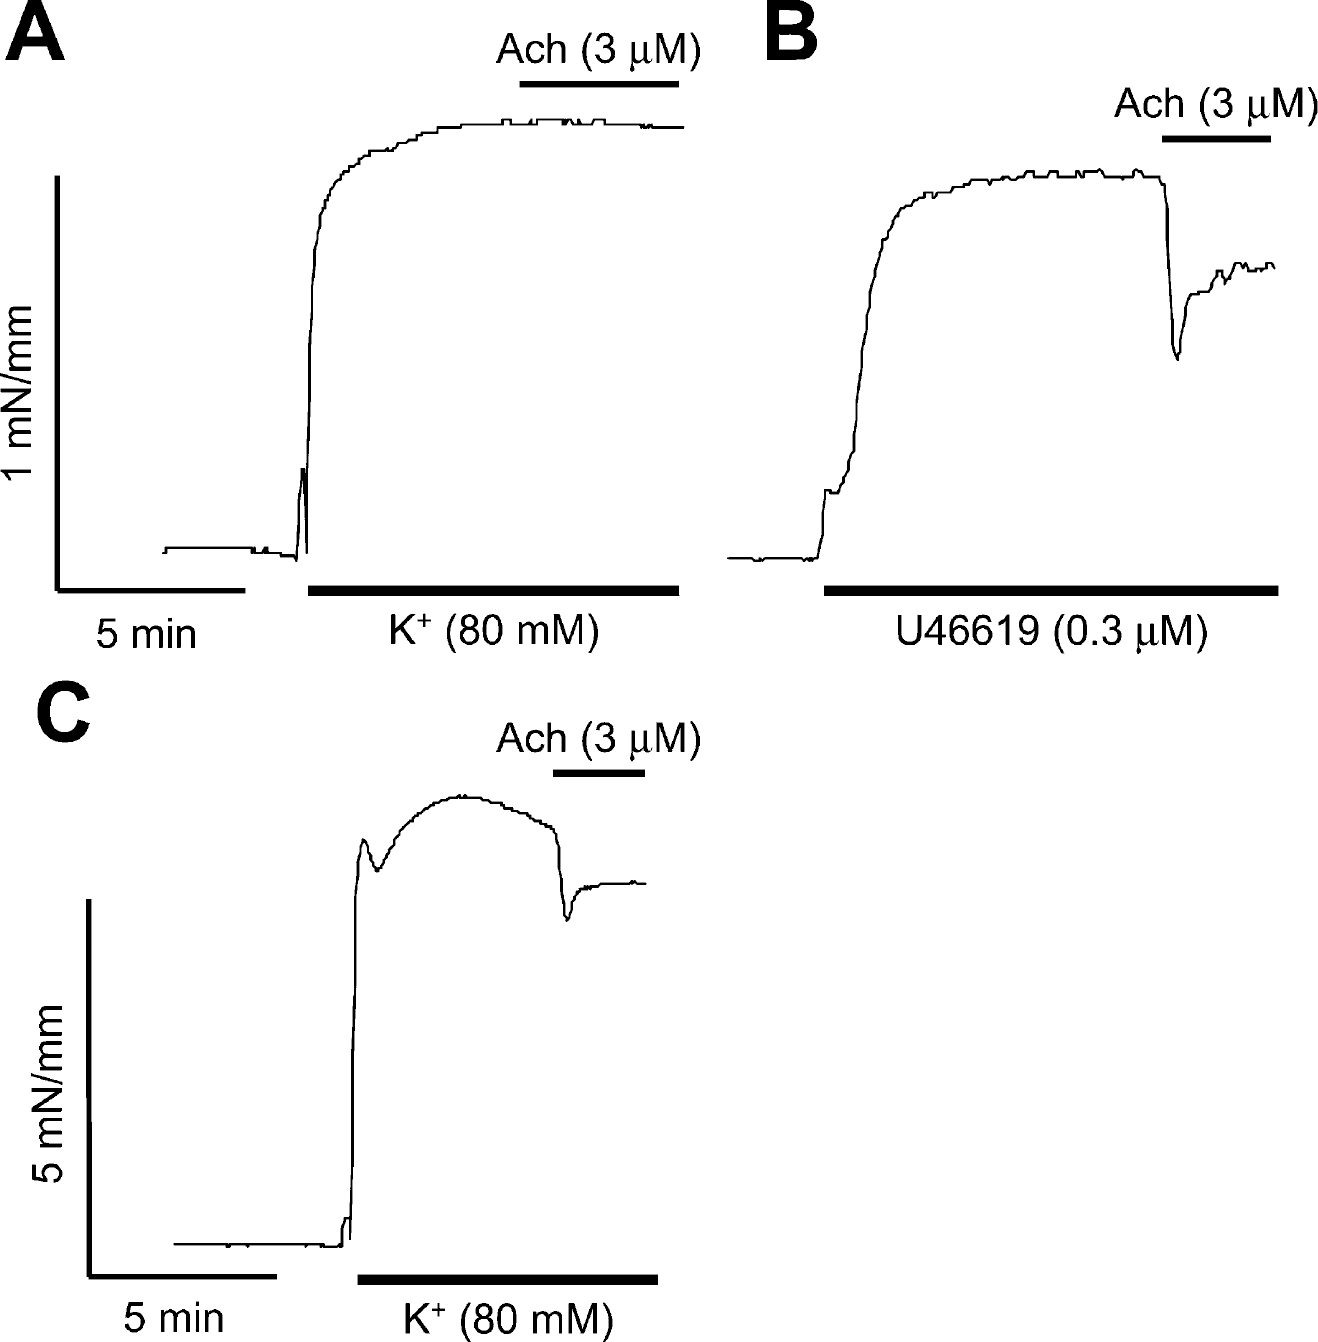
Acetylcholine-induced vasodilation in mouse (A and B) or rat (C) basilar arteries preconstricted with either elevated K+ (80 mM) (A and C) or the thromboxane A2 agonist U46619 (0.3 μM) (B). Tracings are from representative experiments. Acetylcholine (3 μM) failed to relax mouse basilar arteries when preconstricted with elevated K+ (A), whereas rat basilar arteries consistently showed about 20% relaxation (B). Endothelial integrity in mouse basilar arteries was confirmed by 25–30% relaxation to acetylcholine (3 μM) in U46619-pre-constricted arteries. Differences in ordinate scale (C) should be noted.
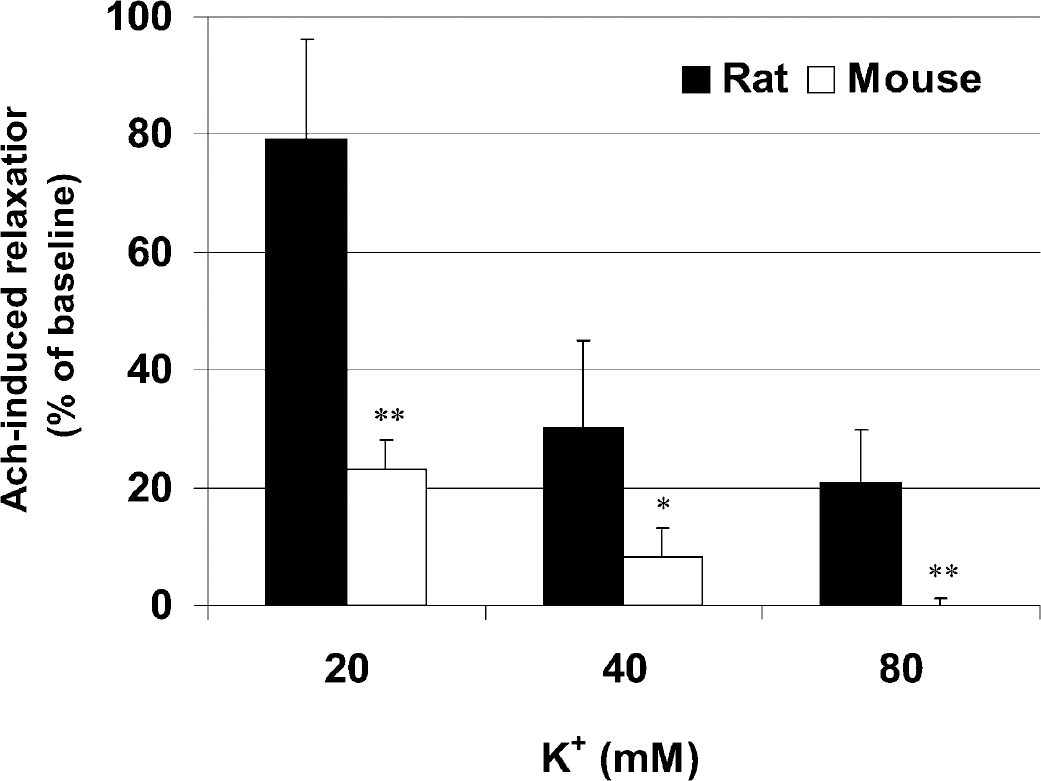
Acetylcholine-induced relaxation in mouse (open bars, n = 10) or rat (filled bars, n = 6 rats, 12 preparations) basilar arteries preconstricted with 20, 40, or 80 mM K+. At all K+ concentrations, Ach (3 μM) relaxation was smaller in mice compared with rats. Data are expressed as percent relaxation from K+-preconstricted baseline. Error bars indicate standard deviations of the mean. *P < 0.05; **P < 0.01.
Effects of NOS inhibition upon the CBF response to CSD in mice
The nonselective nitric oxide synthase inhibitor L-NA (10 mg/kg intraperitoneally) significantly increased the MAP (78 ± 4 vs. 90 ± 6 mm Hg, before and 1 hour after L-NA, respectively; P < 0.05, n = 4), and reduced the resting CBF (79 ± 8 and 73 ± 12% of baseline, in cortical capillaries and pial arterioles, respectively; P < 0.01). Consequently, the CVR was increased (148 ± 21 and 162 ± 27% of baseline, in cortical capillaries and pial arterioles, respectively; P < 0.01, compared with baseline in cortical capillaries). One hour after L-NA, the initial hypoperfusion during CSD was exacerbated (44 ± 8 vs. 19 ± 7% of baseline, in control and L-NA groups, respectively; P < 0.01), and the transient restoration of CBF was inhibited (72 ± 6 vs. 44 ± 10% of baseline, in control and L-NA groups, respectively; P < 0.01) (Fig. 8). The hyperemic response to the second consecutive CSD was similarly inhibited, whereas the post-CSD oligemia did not differ from the control group (data not shown).
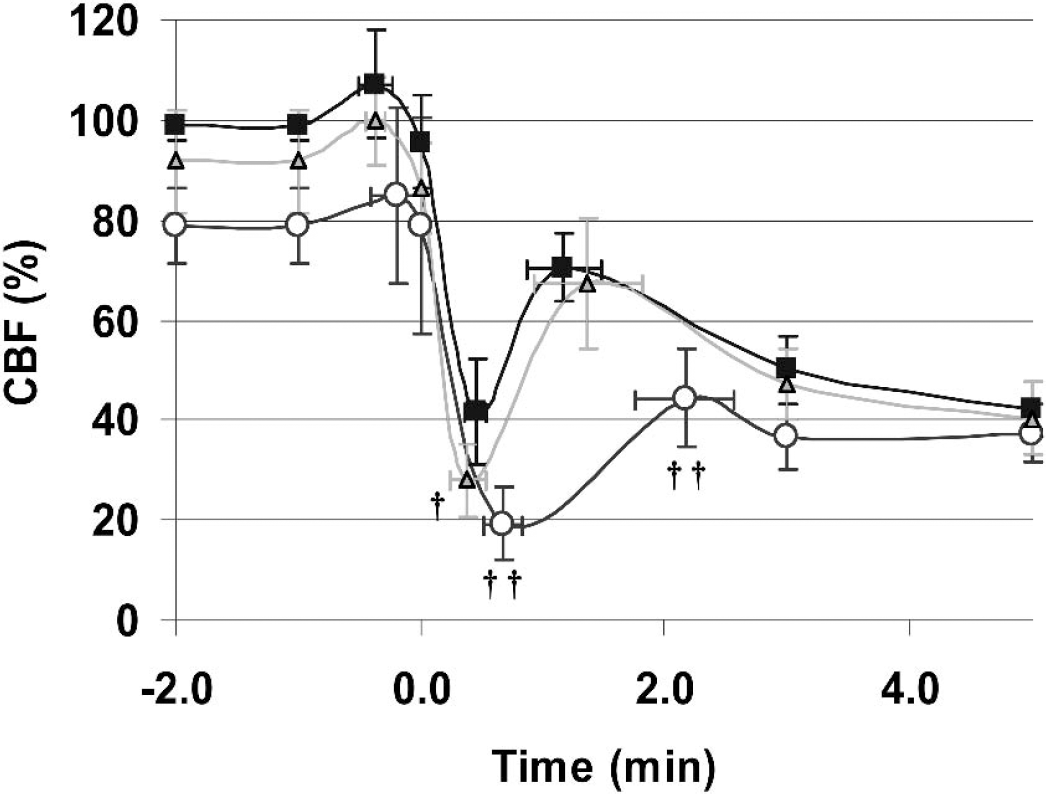
The effects of NOS inhibitors L-NA (n = 4, circles) and 7-NI (n = 6, triangles) upon the CBF response to CSD. Measurements were obtained using LSF by appropriately placing the ROI over the cortex free of visible blood vessels in C57BL/6J. Control CBF response was superimposed for comparison (n = 6, squares). L-NA significantly exacerbated the initial hypoperfusion and nearly abolished the transient recovery of CBF, whereas 7-NI only exacerbated the hypoperfusion without altering the transient recovery of CBF. Vertical and horizontal bars indicate standard deviations of the amplitude of the CBF changes, and the latency from the onset of hypoperfusion, respectively. †P < 0.05; ††P < 0.01 vs. control.
The relatively selective type I NOS inhibitor 7-NI (50 mg/kg intraperitoneally) did not significantly alter MAP (84 ± 10 vs. 88 ± 14 mmHg, before and 1 hour after 7-NI, respectively), reduce resting CBF (92 ± 10 and 93 ± 16% of baseline, in the cortical capillaries and pial arterioles, respectively), or increase the CVR (114 ± 16 and 115 ± 21% of baseline, in the cortical capillaries and pial arterioles, respectively; P = 0.058, compared with baseline in cortical capillaries), supporting a relative lack of inhibition of type III NOS at this dose (Yoshida et al., 1994). One hour after systemic 7-NI administration, the initial hypoperfusion during CSD was significantly exacerbated (44 ± 8 vs. 28 ± 7% of baseline, in control and 7-NI groups, respectively; P < 0.05), but the transient normalization of CBF was not altered (Fig. 8). The CBF response to the second consecutive CSD and the post-CSD oligemia were also not influenced by 7-NI (data not shown).
DISCUSSION
The magnitude of the CBF changes during CSD markedly differs between mice and other species. Pronounced hyperemia, reached after the repolarization of DC shift, is the predominant response in rats, rabbits, and cats and temporally corresponds to the transient normalization of CBF in mice. However, Van Harreveld and Ochs (1957) described a wave of vasoconstriction preceding dilation in sections of rapidly frozen rabbit brain. Furthermore, a CBV reduction, reflecting vasoconstriction, appeared to be consistently associated with CSD in two other studies (Sonn and Mayevsky, 2000; Tomita et al., 2002). The initial hypoperfusion and vasoconstriction reported in rats were not always reproducible (Duckrow, 1993; Fabricius et al., 1995; Van Harreveld and Ochs, 1957). Our data indicate that in mice the initial hypoperfusion is invariable and pronounced.
We suspect that major shifts in extracellular K+ might be important in predicting the CBF changes during CSD because the initial hypoperfusion was temporally linked to the DC shift. A brief and small increase in CBF coincident with the onset of DC shift was then followed by significant hypoperfusion (Fig. 5). Sonn and Mayevsky (2000) reported a temporal correspondence between the DC shift and a rise in extracellular K+ during CSD. Hence, one of the more likely mediators of CSD-induced initial hypoperfusion is the rise in extracellular K+ (Hansen et al., 1980; Hansen and Zeuthen, 1981). Cerebral blood vessels dilate or constrict depending upon the degree of K+ elevation. Moderate elevations (<20 mM) cause vasodilation by modifying inward rectifier K+ channels and electrogenic Na+ pump (Edwards, et al. 1988; Knot et al., 1996; McCarron and Halpern, 1990), whereas higher concentrations tend to constrict vessels (Konold et al., 1968; Kuschinsky and Wahl, 1978; Kuschinsky et al., 1972). Therefore, the rise in extracellular K+ during CSD may initially dilate vessels at lower concentrations but vasoconstrict as K+ levels continue to increase. This is consistent with our observation that CBF in mice initially showed a small increase during the first 5 seconds of the DC shift (approximately 10% above baseline) (Fig. 5). The hypoperfusion then gradually developed as the DC shift, and hence the rise in extracellular K+, reached a maximum. Furthermore, the duration of DC shift, reflecting extracellular K+ increase (Hansen and Zeuthen, 1981), was significantly correlated with the duration of hypoperfusion, suggesting that they are related.
Our findings are further supported by data obtained in the rat showing that CBV decreases coincident with a rise in extracellular K+ during CSD (Sonn and Mayevsky, 2000). It is of interest that this reduction is accompanied by a concomitant CBF reduction under hypoxic or partially ischemic conditions, suggesting that elevated basal K+ levels exacerbate the hypoperfusion caused by CSD (Sonn and Mayevsky, 2000). It has been suggested that the cause of early hypoperfusion might be a brief alkaline shift coincident with the initial slope of the DC shift during CSD (Fabricius et al., 1995; Kraig and Cooper, 1987; Mutch and Hansen, 1984). Although we have not tested this possibility in mice, the alkaline shift observed in rats may be too small and brief to explain the prolonged and severe hypoperfusion and its temporal relationship to the DC shift in mice (Kraig et al., 1983).
There are several potential explanations for the species differences in CBF response to CSD. Potassium handling by the brain parenchyma seems to be similar and perhaps unimportant here because the peak extracellular K+ concentrations are comparable in mice and rats (Sick et al., 1998; Takahashi et al., 1981). Responses of isolated mouse vessels to high levels of K+ were striking. For example, the vasodilator ACh (3 μM) failed to reverse the vasoconstriction of isolated mouse basilar artery induced by 80 mM K+, whereas the same concentration of ACh consistently relaxed rat vessels. Furthermore, the same vessels consistently relaxed to ACh (3 μM) when preconstricted to a comparable degree using the thromboxane A2 analog U46619, confirming endothelial integrity. The response to added NO (SNP) or papaverine did not appear to differ. We speculate that for unexplained reasons, the endothelium-dependent vasodilator mechanisms in mice are not sufficient to reverse the vasoconstriction to elevated K+ and that this may contribute to CSD-induced hypoperfusion. In accordance with our data, it was recently shown that elevated extracellular K+ inhibits ACh-induced, endothelium-dependent relaxation by interfering with intracellular Ca++ increase in endothelial cells (Seol et al., 2004). It is interesting to note that the lack of relaxation of K+-preconstricted mouse arteries to ACh appears to be restricted to intracranial circulation because mouse carotid arteries preconstricted by 80 mM K+ relax in response to ACh by approximately 20% (unpublished observations, S. Salomone, January 2003). Finally, it should be noted that our findings in isolated basilar arteries (chosen over smaller cerebral arteries because of technical consideration) may not be fully representative of middle cerebral artery branches supplying the cortical tissue where spreading depression was studied.
Alternatively, vasodilator molecules released during CSD may be insufficient in the mouse to counteract the effects of K+ in this species. For example, there may be less NO release during CSD in mice, which is known to attenuate the vasoconstriction induced by elevated K+ (Schuh-Hofer et al., 2001). Contrary to this, we found that nonselective NOS inhibitor L-NA profoundly altered the CBF response to CSD. One hour after systemic L-NA administration, the initial hypoperfusion was exacerbated, and the transient recovery of CBF was abolished, transforming the triphasic CBF response into a severe spreading hypoperfusion. On the other hand, the relatively selective type I NOS inhibitor 7-NI only exacerbated the initial hypoperfusion and had no effect upon the transient recovery of CBF. L-NA was shown to induce an early hypoperfusion and attenuate the vasodilation during CSD in rats (Duckrow, 1993; Fabricius et al., 1995; Meng et al., 1995). However, spreading hypoperfusion similar to that in mice was only observed when resting extracellular K+ was artificially elevated in a cranial window (Dreier et al., 2001). These results suggest that NO significantly, although incompletely, counteracts the CSD-induced hypoperfusion in mice, further supporting the possibility that elevated extracellular K+ is the mediator of CSD-associated hypoperfusion (Duckrow, 1993; Hansen et al., 1980; Schuh-Hofer et al., 2001). In addition, NO from neuronal sources appears to be effective only during the DC shift, and combined inhibition of neuronal and endothelial NO production abolishes the transient recovery of CBF subsequent to the repolarization phase of CSD in mice.
In summary, we showed that CSD induces novel triphasic CBF changes in mouse cortex with pronounced hypoperfusion coincident with the DC shift, distinguishing mice from other species studied to date. The species differences appear to be caused by an increased sensitivity of mouse cerebral vessels to elevated K+.