
Abstract
Functional magnetic resonance imaging (fMRI) techniques were used to study haemodynamic and metabolic responses in human visual cortex during varying arterial blood oxygen saturation levels (Ysat, determined by pulse-oximeter) and stimulation with contrast-reversing checkerboards. The visual-evoked potential amplitude remained constant at lowered Ysat of 0.82 ± 0.03. Similarly, fMRI cerebral blood flow (CBF) responses were unchanged during reduced Ysat. In contrast, visual cortex volume displaying blood oxygen level-dependent (BOLD) fMRI response decreased as a function of Ysat, but the BOLD signal change of 3.6% ± 1.4% was constant. Oxygen extraction ratio (OER) during visual activation showed values of 0.26 ± 0.03 for normal Ysat. At lowered Ysat, two OER patterns were observed. Firstly, a reduced OER of 0.14 ± 0.03 in the visual cortex structures showing BOLD in hypoxia was observed. Secondly, signs of much higher OER in other parts of visual cortex were obtained. T2*-weighted magnetic resonance imaging revealed signal increases by 0.8% ± 0.4% with visual activation during lowered Ysat in the visual cortex structures, which showed BOLD of 3.6% in magnitude under normoxia. Because the CBF response in the visual cortex was quantitatively similar during stimulation in normoxia and hypoxia, attenuated T2*-weighted signal increase in parts of visual cortex indicated high OER during visual activation in hypoxia, which was close to that encountered in the resting brain. These spatially localised regions of tissue oxygen extraction and metabolism argue for dissociation between CBF and BOLD fMRI signals in mild hypoxia. The findings point to heterogeneity with regard to oxygen requirement and its coupling to the haemodynamic response in the brain.
Introduction
Blood oxygenation level-dependent (BOLD) functional magnetic resonance imaging (fMRI) is extensively used in sensory and cognitive neuroscience to study the link between structure and function in the brain. Functional magnetic resonance imaging BOLD provides an indirect measure of neuronal activity. It is a composite signal derived from oxygen (O2) delivery and consumption as well as from blood volume. The quantitative interrelationships between oxygen delivery and consumption during resting and working brain conditions have been extensively characterised (Fox et al, 1988; van Zijl et al, 1998; Zheng et al, 2002). Although it is appreciated that generation of the BOLD response involves complex physiologic and biophysical events that are currently only partially understood (Buxton and Frank, 1997; Friston et al, 2000; Ogawa et al, 1993; van Zijl et al, 1998; Zheng et al, 2002), it is firmly established that BOLD fMRI reveals brain activity because of locally decreased deoxyhaemoglobin (Hb) concentration because of a decline in oxygen extraction ratio (OER). The reasons why there is such a steep decline in OER and how the haemodynamic response is coupled with the neuronal activity are not fully understood (Attwell and Iadecola, 2002; Buxton and Frank, 1997; Zheng et al, 2002), but this is crucially important for the neurophysiological interpretation of fMRI.
At macroscopic scale and assuming unidirectional oxygen flux from the blood, cerebral oxygen consumption and delivery are interrelated through:
Where CMRO2 is the cerebral metabolic rate for oxygen, Ya the arterial oxygen saturation, Hct the haematocrit and CBF the cerebral blood flow. It has been proposed that the disproportionate increase in CBF relative to CMRO2 by 2:1 (Hoge et al, 1999; Uludag et al, 2004) during increased brain workload results from limited capacity of oxygen diffusion from the capillaries (Buxton and Frank, 1997). The proposal is that oxygen requirement by the brain is the key factor to elicit the CBF response. Interestingly, data are accumulating to indicate that this may not be the case (Attwell and Iadecola, 2002; Lu et al, 2004; Mintun et al, 2001; Powers et al, 1996; Zonta et al, 2003). Neuroimaging studies have shown that neither glucose (Powers et al, 1996) nor oxygen (Mintun et al, 2001) availability in the blood has an effect on CBF response during brain activation, suggesting that this may be regulated directly by other factors than the need for energy substrates. Recently, Lu et al (2004) observed that after sustained visual stimulation, CMRO2 stays elevated, whereas both CBF and cerebral blood volume (CBV) return to control levels, suggesting dissociation between metabolism and flow in functioning brain. Furthermore, work on brain preparations has revealed that astrocytes may regulate tone in the cerebral resistance arteries through actions of glutamate (Zonta et al, 2003) or noradrenaline (Mulligan and MacVigar, 2004) receptors and signalling, pointing to involvement of neurotransmission in the regulation of CBF.
The interrelationship between oxygen delivery and consumption can be studied by manipulating the arterial oxygen content. Studies of brain activation during hyperoxia have indicated that the brain volume displaying BOLD is increased (Kashikura et al, 2000) and the BOLD peak size is greater (Kashikura et al, 2001) relative to normoxia. Mintun et al (2001) have reported that in mild hypoxic hypoxia with partial pressure for arterial O2 content (PaO2) down by ∼55% (equivalent to Ya of 0.8) baseline CBF, as determined by positron emission tomography (PET), is unchanged. Interestingly, they showed that the CBF response upon visual stimulation was the same in normoxia and hypoxia. The latter finding argues against involvement of O2 in the regulation of CBF response and disagrees with the hyperoxia studies above. As Equation (1) indicates, OER can adapt during low Ya according to the levels of CBF and CMRO2. In the present work, we have quantified the changes in CBF, blood oxygenation, and OER in the human visual cortex during reduced Ya using fMRI and proton nuclear magnetic resonance (1H NMR) spectroscopy techniques to study the role of oxygen availability in the regulation of cerebral haemodynamics and metabolism.
Materials and methods
Subjects
The protocol was approved by the Committee on the Ethics of Research on Human Beings of the University of Manchester and the Manchester Local Research Ethical Committee. Ten healthy volunteers (age range 26 to 49 years, two women) gave written informed consent before participation.
Activation Procedures and Recording of Visual-Evoked Potentials
Inhaled O2 content (FIO2) was either 21% (room air) or 12% (FIO2 balanced with N2 in a non-rebreathing circuitry, Hans Rudolph Inc., Kansas City, KS, USA). Arterial oxygen saturation (Ysat used for pulse oximeter saturation values) and pulse rate were monitored from the left index finger with a Pulse Oximeter (System 4500 MRI, In vivo Research Inc., Orlando, FL, USA). After an adaptation of about 7 mins to FIO2 of 12% during which a stable (variation ± 0.02) hypoxic Ysat level was reached, the magnetic resonance imaging (MRI) protocol was started and scans were run in a pseudorandomised manner for further 25 mins.
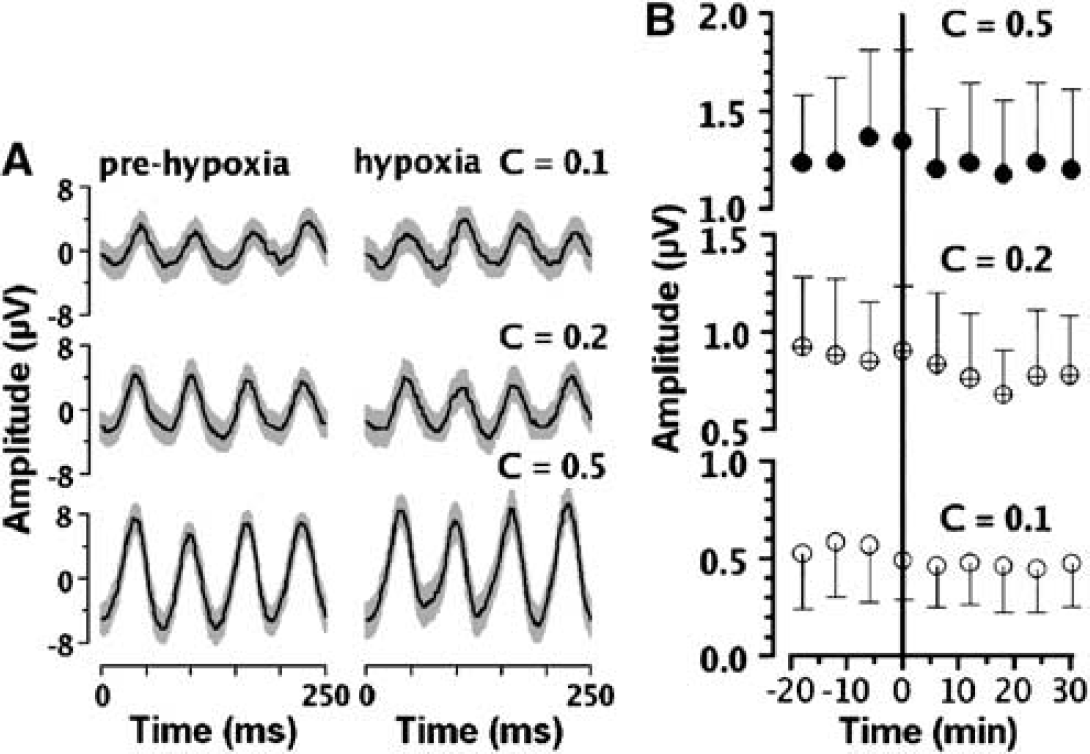
For visual stimulation, subjects were asked to fixate on the centre of a computer monitor on which contrast-reversing (8 Hz) black and white checkerboard stimuli were displayed. Contrast during fMRI scanning was constant at 0.5. Visual-evoked potentials (VEP) were also generated by contrast-reversing checkerboard stimuli. There was no change in light flux during a temporal cycle of the stimulus. Check size 60 inch, field size 7° × 9°, and mean luminance 50 cd/m2 were used. The stimulus was presented at 8 Hz for a period of 8 secs for each of three contrasts of 0.5, 0.2, and 0.1. This sequence was repeated eight times to give an overall sampling period of 3 mins 12 secs. Three of these trials were conducted before hypoxic breathing and between five and six were conducted during hypoxic breathing.
Visual-evoked potential signals were amplified using a CED1902 physiological amplifier (bandwidth 1.0 to 60 Hz with a mains notch filter) and averaged in time and frequency domain using a CED1401 smart interface (Cambridge Electronic Design Ltd, Cambridge, UK). Electroencephalogram (EEG) activity was sampled with 11 mm Ag–Ag scalp electrodes attached at locations Oz, O2, and mid-frontal, and an earth electrode was placed on the forehead. An 8 secs epoch (4096 points at 512 Hz) was used, which gave a temporal resolution of 0.125 Hz/bin and a maximum frequency of 256 Hz. To simulate MRI conditions, subjects were semisupine during recording session conditions. Ysat and pulse were continuously monitored as in the fMRI experiments.
Magnetic Resonance Protocols
Experiments were performed using a Philips Intera 1.5 T MRI scanner (Philips Medical Systems, Best, The Netherlands) using standard body coil transmission and SENSE head coil (in quadrature mode) reception. Eight contiguous transverse 3.5 mm slices were placed to cover primary visual cortex according to the localiser images and T2*-weighted BOLD images were acquired with a single shot gradient echo echo planar imaging (GRE EPI) (field of view (FOV) 240 mm, matrix 128 × 128, time to repetition (TR) = 1 sec, time ot echo (TE) = 40 ms, flip angle 54°). Gradient echo echo planar imaging series consisted of 140 dynamic scans, with three periods of 20 secs stimulations interleaved with equal length OFF periods. Cerebral T2* was quantified from six volunteers (one woman, five men) using the same GRE EPI sequence with four TEs of 11, 30, 64, and 82 ms, and TR = 3 secs. Pulsed arterial spin labelling (PASL) MRI was used to quantify perfusion changes associated with brain activations with a transfer-insensitive labelling technique (Golay et al, 1999) (field of view (FOV) = 240 mm, 10 mm slice, matrix 64 × 64, TR = 6 secs, TE = 10 ms, inversion delay = 1,000 ms). To achieve close anatomic match between the core of BOLD activation and PASL image, T2*-weighted BOLD images were analysed on-line using the software provided by Philips. A single PASL slice was positioned to cover the strongest BOLD activation area, covering typically the centre part of the calcarine cortex. Anatomic match between PASL and T2*-weighted images was also verified from the FOV coordinates of the perfusion and BOLD scans above. We have used an inversion delay that will suppress most of the macro-vascular contributions, yet have sufficient dynamic range to be exploited for perfusion imaging (Hendrikse et al, 2003). Pulsed arterial spin labelling series consisted of 60 scans containing three periods of 60 secs stimulations.
Oxygen extraction ratio was quantified from a subset of seven volunteers (one woman, six men) using the vascular space occupancy dependent (VASO)-based MRI method (Lu et al, 2003). The scanning parameters were as follows: FOV = 240 mm, 5 mm slice, matrix 80 × 80 (zero-filled to 128 × 128), TR = 3 secs, double gradient echo (TE pairs of 11/64 and 30/82 ms), and inversion time 767 ms to achieve effective blood nulling with a TR = 3 secs at 1.5 T. Vascular space occupancy-dependent fMRI series consisted of 90 scans, with four periods of 30 secs stimulation. A VASO slice was carefully positioned to cover the calcarine fissure matching the location of the PASL slice as closely as possible. Because the anatomic resolution and brain coverage of VASO images differed from BOLD fMRI above, we acquired T2*-weighted GRE EPI images also from the VASO slice using the same anatomic resolution with TR = 3 secs, TE = 30 ms.
For 1H NMR spectroscopy, a 3 × 3 × 3 cm3 voxel was positioned according to localiser images to cover brain structures encompassing calcarine cortices on both hemispheres. Double spin echo method with TR = 2 secs and TE = 136 ms was used for signal acquisitions collecting 128 averages for each spectrum. Proton nuclear magnetic resonance spectra (one set in normoxia and three in hypoxia) were acquired from four volunteers (one woman, three men). The checkerboard activation was on for 16 secs followed by an off period of 8 secs for ‘activated’ spectroscopy data collections.
Analysis of Magnetic Resonance Data
Statistical analysis of the fMRI data was performed using the FMRIB Software Library (http://www.fmrib.ox.ac.uk/fsl/). After delineation of activated brain areas, in-house Matlab™ routines (Matworks, Natick, MA, USA) were used for estimation of BOLD and PASL response amplitudes and pixel count determination. The T2*-weighted MR signal intensity in the brain parenchyma regions showing BOLD in different oxygen saturations were quantified. To this end, binary masks were created for each subject to identify activated pixels in different oxygenation states. Subtraction of a mask obtained in hypoxia from that in normoxic revealed the pixels that were active only in normoxia (subtraction mask value = 1), in both oxygenation states (value = 0) or only in hypoxia (value = −1). Cerebral T2* was estimated from a least-squares fit to the logarithm of the signal intensities. All images were motion corrected using MCFLIRT (Jenkinson et al, 2002). Pulsed arterial spin labelling and VASO images were smoothed with a Gaussian kernel (full-width at half-maximum 5 mm). Statistical analysis for all time series was performed using FILM (FMRIB's Improved Linear Model) with local autocorrelation correction. Z statistic images were thresholded using clusters determined by Z > 3.0 and a (corrected) cluster significance threshold of P = 0.01 (Forman et al, 1995; Friston et al, 1995; Worsley et al, 1992).
For OER determination, voxel series were collected from all the different echo series based on the activation map derived from the shortest echo VASO MRI images as described previously (Lu et al, 2004). Linear baseline correction was applied to the series to remove possible drift in signal intensity. The averaged voxel series were least-squares fitted point by point in time as a function of TE to obtain R2* in the resting and activated states. The fractional CBV in the activated state, CBVact, can be estimated using:
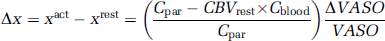
Where x is the water fraction of blood in the voxel, Δx is the difference in the water fraction between activated and rest state. Cpar = 0.89 and Cblood = 0.87 are the water contents in the parenchyma and blood, respectively, and the ΔVASO/VASO is the signal change at zero TE obtained from the VASO experiment. Water fraction in the resting state can be calculated using literature (Lu et at, 2004) values for CBVrest = 0.047 mL blood/mL parenchyma, and xrest = CBVrest × Cblood/Cpar. Venous O2 saturation, Yv,act, was calculated from the equation devised by Yablonskiy and Haacke, (1994):
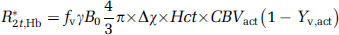
Where R*2t, Hb is the extravascular R2* change caused by blood (estimated from the fitted VASO signals), fv = 0.7 the venular CBV fraction, Δχ is the susceptibility difference between fully oxygenated and deoxygenated blood amounting to 0.31 ppm and Hct = 0.357 is the haematocrit in the micro vasculature. Finally, OER was computed using the relationship:

Proton nuclear magnetic resonance spectra were analysed for possible change in cerebral lactate content in frequency domain using the Java version of Magnetic Resonance User Interface (jMRUI, http://www.mrui.uab.es/mrui/). Free induction decays were zero filled to 4k data points and multiplied by an exponential function corresponding to a line broadening by 3 Hz in time domain before Fourier transform. The spectra were manually phase corrected and the spectra acquired during visual activation were subtracted from those collected during rest. Similarly, to assess possible lactate build-up because of low Ysat, the spectra acquired during non-stimulated conditions in steady-state hypoxia were subtracted from baseline spectra acquired in normoxia.
Visual-Evoked Potential Analysis
The amplitude and phase of the first and second harmonics of the VEP signals were extracted. For a presentation frequency of F (Hz) and for temporal frequencies above 8 to 10 Hz, the response power is concentrated at 2F (Hz). Data extraction was optimised for the frequency domain in that a sampling period of 8 secs was used. This meant that the data were well localised in the frequency domain (0.125 Hz/bin), but that a relatively long sampling period of 8 secs was required. However, our set-up allowed us to retrospectively reanalyse the data in the time domain using 0.25 secs sampling and this enabled the assessment of short-term changes in the data.
Statistical Analysis
Statistical significance of the fMRI results (pixel counts, response amplitudes, and OER) from normoxic and hypoxic fMRI groups was assessed using Wilcoxon's signed-rank test. In the VEP analysis, one-way analysis of variance (ANOVA) was used and errors shown in respective figures are 95% confidence intervals. The values shown are means ± s.d.
Results
Reduction of FIO2 to 12% decreased the steady-state Ysat from 0.99 ± 0.005 to 0.85 ± 0.03. The heart rate increased from 62 ± 8 to 74 ± 13 (P < 0.01). The level of FIO2 was well tolerated among the group of volunteers and only slight breathlessness was reported during transition to low oxygen gas mixture.
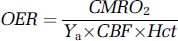
Typical PASL fMR images obtained during visual stimulation are illustrated for one subject in normoxia (Figure 1A) and hypoxia (Figure 1B). They reveal an increase in CBF in the brain structures localising to both primary and secondary visual cortex structures in both oxygenation states. Data from a number of volunteers show that both the amplitude of PASL signal (Figure 1C) and parenchymal volume showing PASL signal in the difference images (Figure 1D) on visual activation were unchanged over the Ysat range. These data argue that the CBF response in the visual cortex was the same under all oxygenation states consistently with a recent report using PET at the same FIO2 (Mintun et al, 2001).
Pulsed arterial spin labelling (PASL) images from a volunteer in normoxia (
Visual-evoked potentials were used as an index of function during oxygenation challenges (Figure 2). In Figure 2A, typical time domain VEP signals obtained with different contrasts of the checkerboard stimulus from a volunteer exposed to 12% FIO2 are plotted. The frequency domain analysis is illustrated in Figure 2B. Statistical analysis reveals the contrast effect to be highly significant across all subjects (P < 0.001). The data (Figure 2B) indicate that hypoxia (Ysat 0.82 ± 0.03) did not affect VEP amplitude at any contrast level. There is no statistical relationship between the amplitude of the second harmonic and time. Thus, both VEP and ASL fMRI data confirm that full functionality was retained in the visual cortex during mild hypoxic hypoxia.
Visual-evoked potentials (VEP) response traces (
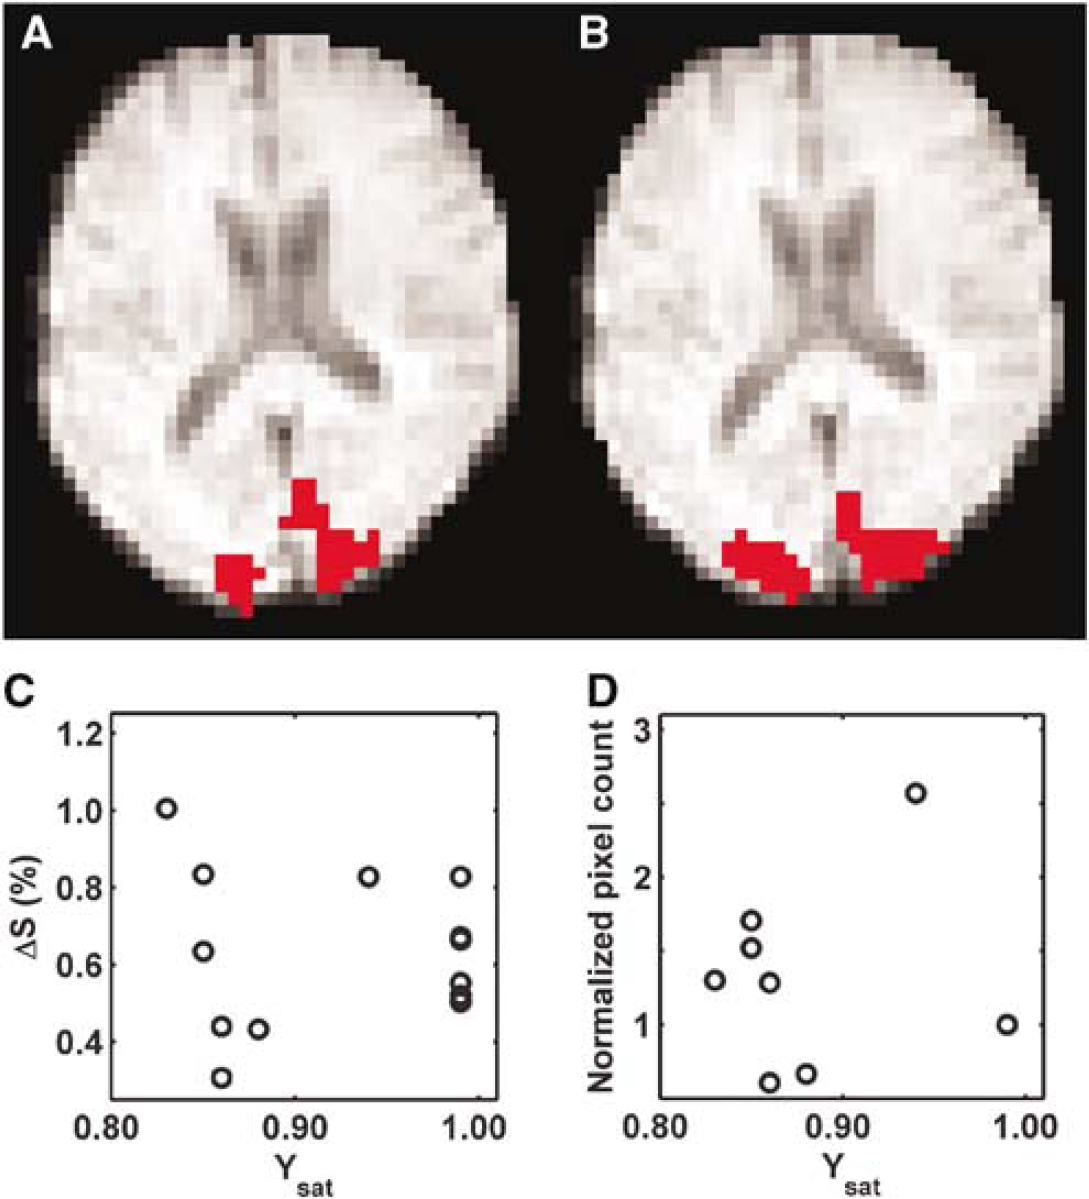
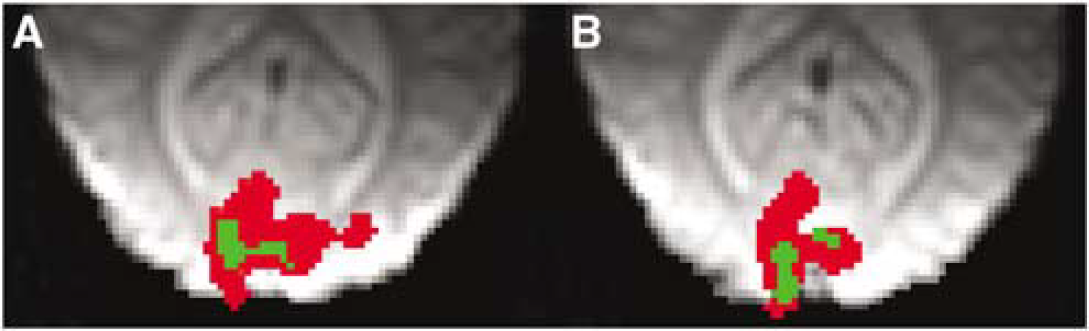
To study the oxygenation changes in the brain parenchyma associated with visual activation at different Ysat levels, T2*-weighted GRE EPI was used to quantify the BOLD response. A sequence of typical BOLD fMR images from a volunteer is illustrated (Figures 3A and 3B). The area of the visual cortex structures showing BOLD in normoxia (Ysat 0.99) is dramatically decreased in hypoxia (Ysat 0.85). The amplitude of the BOLD response (ΔS) from a number of subjects is not affected by arterial oxygen saturation over the range studied (Figure 4A). ΔS was 3.6% ± 0.7% and 3.9% ± 0.8% (pixels with binary mask value of −1) in normoxia and hypoxia, respectively. It is clear from Figure 4B, however, that the number of activated pixels in experiments with Ysat below 0.98 was lower than above this saturation level (P < 0.01, Wilcoxon's signed-rank test).
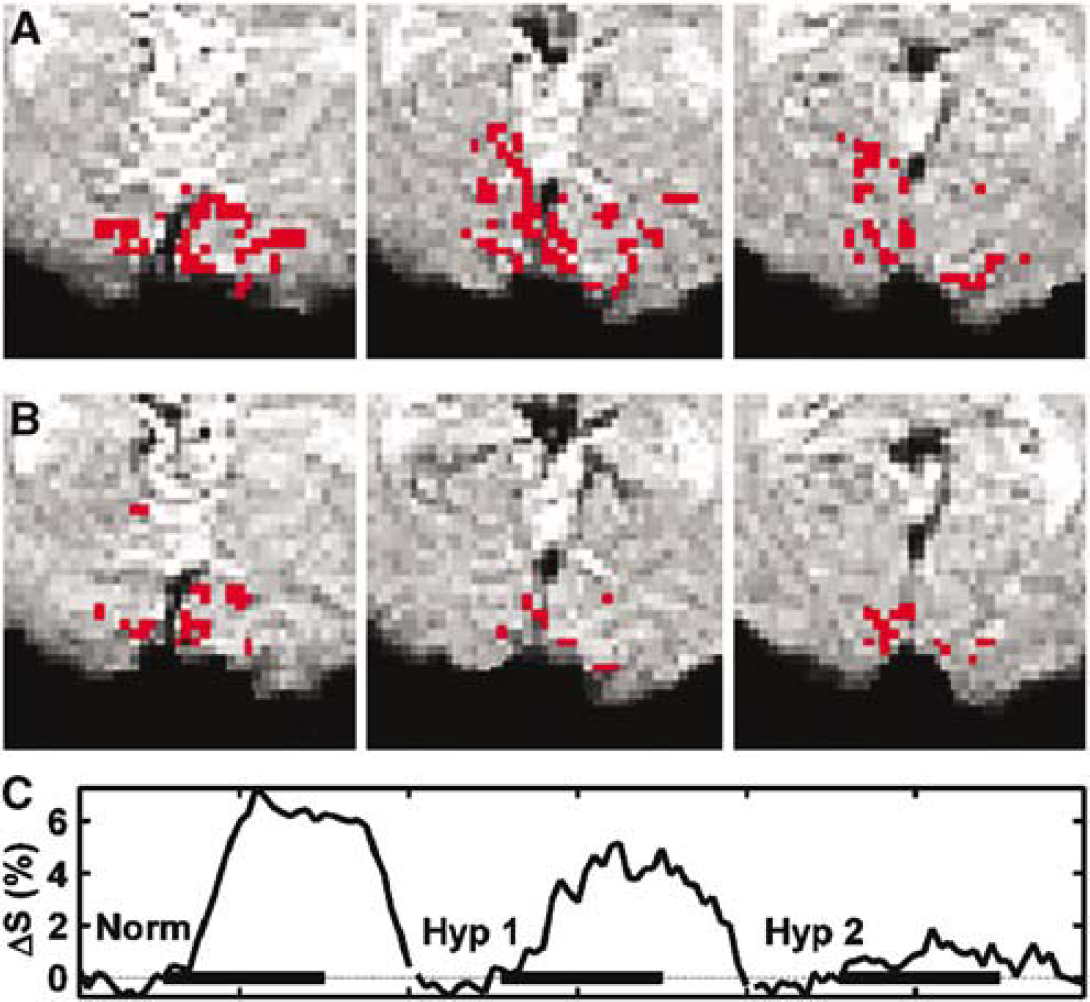
Three zoomed T2*-weighted MRI slices from a volunteer during normoxia and hypoxia and T2*-weighted MRI signal time course in the visual cortex. The activated areas are shown in red in the visual cortex in normoxia (row
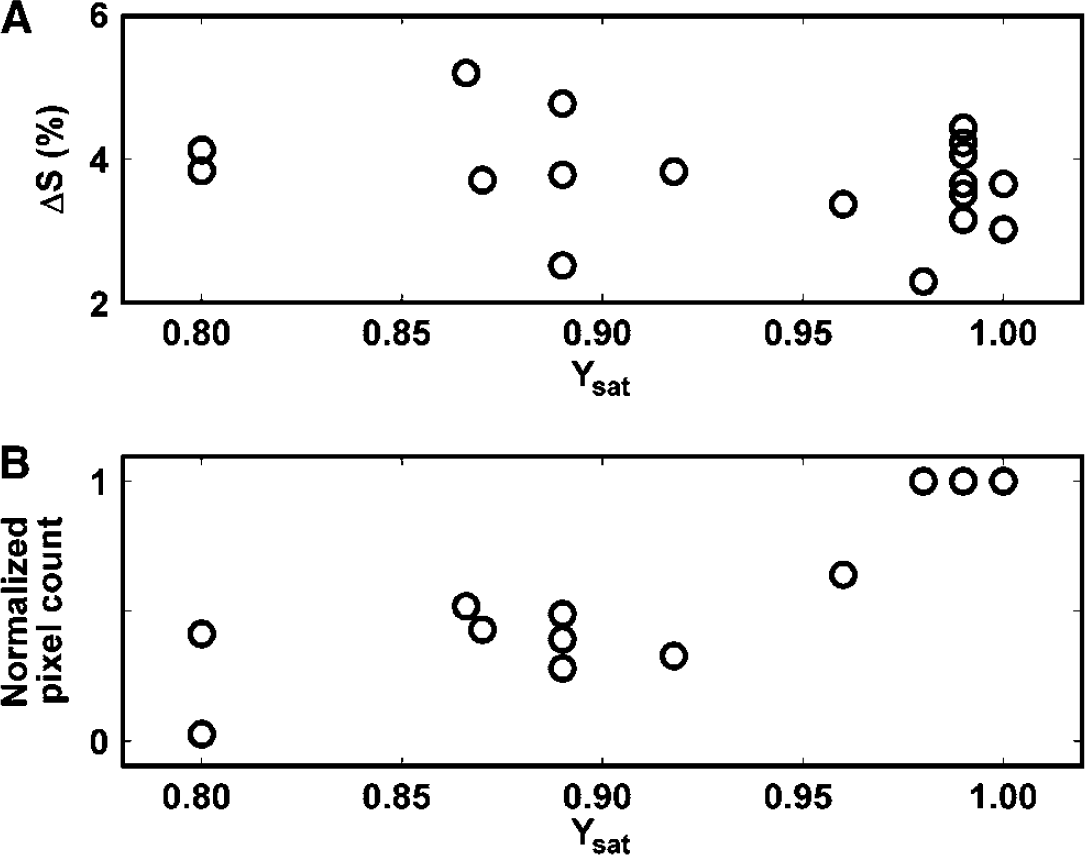
Blood oxygen level-dependent (BOLD) signal change (
We analysed the T2*-weighted MR signal intensity in the brain parenchyma regions showing BOLD in normoxia but not in hypoxia. As seen in Figure 3C, T2*-weighted images showed a consistent signal increase by 0.8% ± 0.4% during stimulation in hypoxia in parenchyma with a mask value of 1. In normoxia, BOLD signal increase in the same parenchyma was 3.6% ± 0.7%, a highly significant difference (P < 0.01 relative to hypoxia). T2* in the brain parenchyma adjacent to the BOLD positive brain areas was 63.4 ± 2.5 ms in normoxia and 61.5 ± 1.0 ms in hypoxia (not different). Signal intensity ratios of activation to rest in frontotemporal structures, determined from the T2*-weighted images, were 1.0006 ± 0.0020 and 1.0004 ± 0.0013 in normoxia and hypoxia, respectively (neither of these different from unity). Thus, the T2*-weighted MR signal increase was attenuated specifically in hypoxia in the cortical structures showing BOLD on visual stimulation in normoxia.
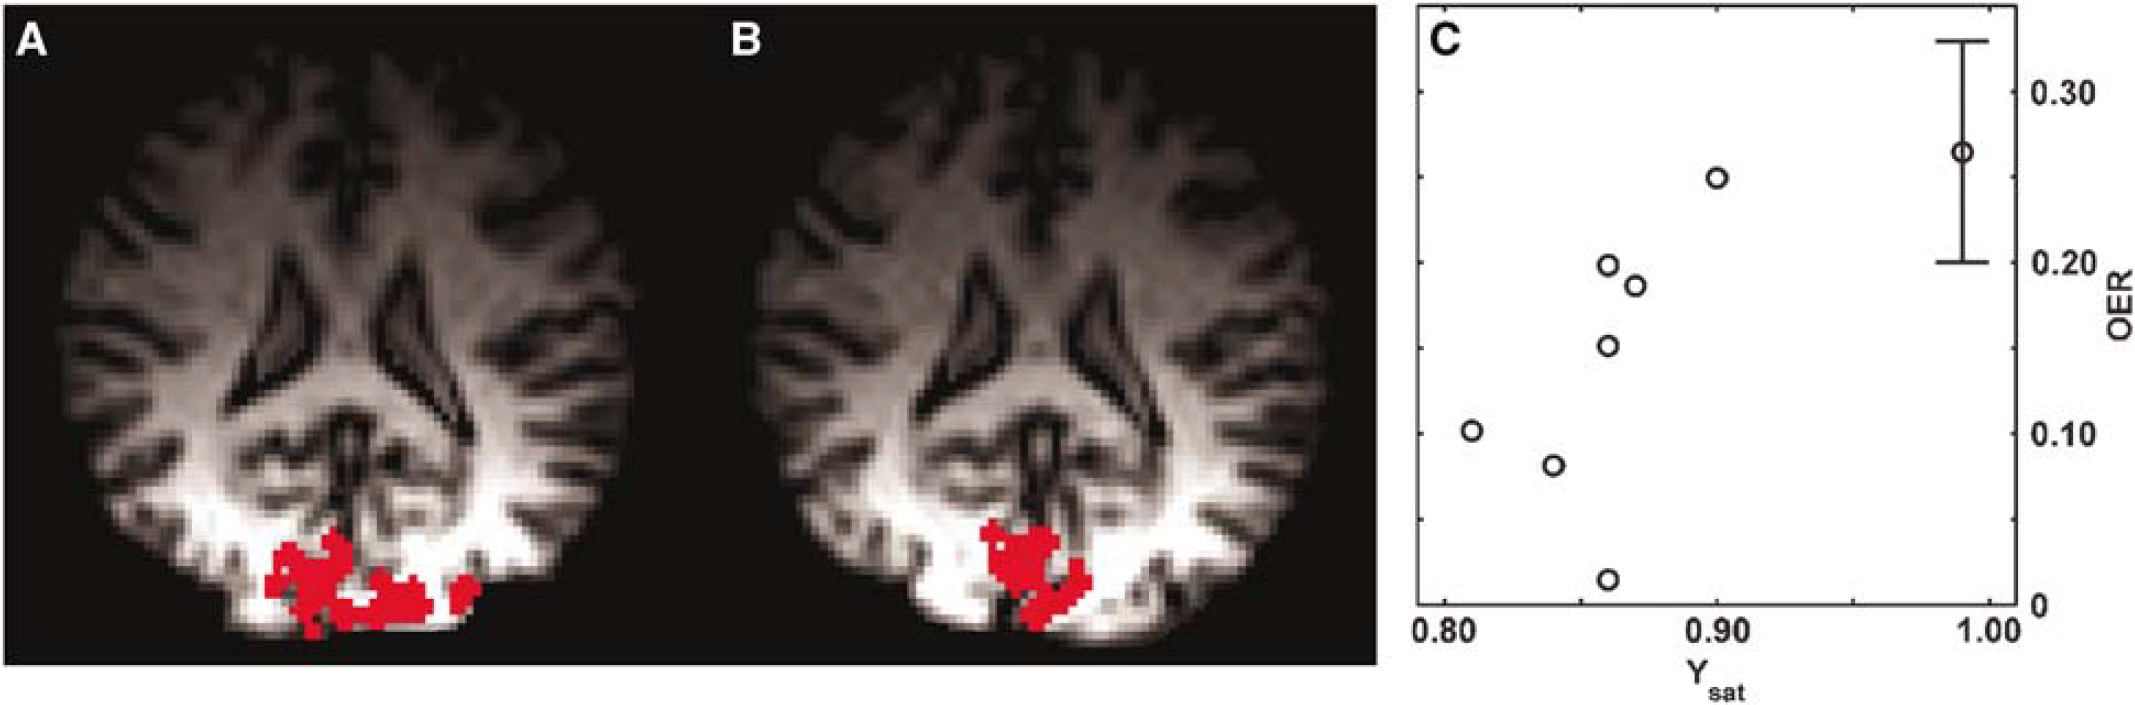
To address the relationship between CMRO2 and CBF as a function of Ysat (equation (1)), we quantified OER, the key factor influencing local deoxy-Hb concentration, by the method described by Lu et al (2004). The method exploits VASO fMRI to determine the pure extravascular R2* change associated with brain activity and the equations interrelating the relaxation change with the venous oxygen saturation (Yv) (Yablonskiy and Haacke, 1994). From VASO fMRI, one can also obtain microvascular CBVact. In association with the VASO images, BOLD fMRI was acquired from the same slice with the same anatomic resolution as well. The number of BOLD pixels in these low resolution T2*-weighted images declined from normoxic 152 ± 50 to hypoxic 75 ± 50 (P < 0.05), consistent with the data in Figures 3 and 4B. A typical set of VASO fMR images are shown (Figures 5A and 5B) for normoxia and hypoxia during visual activation. The OER values during visual activation in this subject were 0.183 and 0.082 for normoxia and hypoxia, respectively. The number of VASO pixels determined from the volunteers scanned did not change from normoxia (49 ± 26) to hypoxia (40 ± 26). Blood oxygen level-dependent response using the criteria determined in normoxia was observed in 89% ± 11% and 72% ± 22% of VASO pixels in normoxia and hypoxia, respectively (not different). Tendency towards lower overlap of VASO and BOLD pixels during hypoxia was because of the data from a subject with Ysat of 0.90. In this volunteer, the overlap was only 38% in hypoxia and the OER value determined during checkerboard stimulation was 0.24 (see Figure 5C). However, the VASO data sets from this volunteer fulfilled the criteria indicated in the Materials and methods section and the OER values are included in Figure 5C. Figure 6 illustrates the BOLD and VASO activation maps during visual stimulation in a volunteer. VASO pixels, from which OER was computed, were entirely within the BOLD activation volume. Anatomic localisation of activated pixels in VASO images varied between normoxia and hypoxia (Figure 6). The overlap of VASO pixels between normoxia and hypoxia was 42% ± 28% showing the degree of anatomic variation in determination of OER in the two oxygenation states. The average OER during visual activation in normoxia was 0.26 ± 0.06. The decrease of Ysat below 0.9 led to a substantial decline in OER as a function of Ysat. Oxygen extraction ratio was 0.14 ± 0.03 (P < 0.01 relative to normoxia) in the experiments with Ysat from 0.79 to 0.90.
Vascular space occupancy-dependent (VASO) images from a volunteer during normoxia (
Typical zoomed blood oxygen level-dependent (BOLD) activation maps overlaid with vascular space occupancy-dependent (VASO) images from a volunteer during normoxia (
This is a highly significant observation, suggesting that in the cortex displaying positive BOLD in hypoxia, OER becomes strongly attenuated. In fact, low OER explains the presence of BOLD effect in hypoxia at a similar magnitude as in normoxia, because in hypoxia Ysat and Yv are low with, respectively, shorter blood T2*, yet unchanged parenchymal T2*. It can be calculated that in normoxia increase from the resting Yv of 0.60 to 0.80 (Silvennoinen et al, 2003) is expressed by an average ΔS of BOLD by 3.6% under the present experimental conditions. In hypoxia with an average Ysat of 0.83, the resting Yv is calculated to be 0.47 based on the measured OER, CBF, and CMRO2 (Shimojyo et al, 1968). Using the linear model of BOLD signal dependency on Yv (Ogawa et al, 1993), ΔS of 0.8% translates to a Yv of 0.51 present during visual stimulation. It is therefore likely that OER decreased in these cortex structures much less than that determined with the VASO-based MRI method in the parenchyma in normoxia. Interestingly, CBVact in the visual cortex was the same in normoxia (0.077 ± 0.017) and hypoxia (0.075 ± 0.015).
It is important to ensure that aerobic metabolism is maintained during low Ysat. We therefore studied lactate metabolism during stimulation by acquiring 1H NMR spectra from visual cortex. The 1H NMR spectra did not reveal lactate in association with activations in normoxia (four sets of spectra analysed). Spectra from a volunteer in hypoxia during rest and visual activation are shown in Figure 7 with a difference spectrum. Hypoxia per se (Ysat 0.86 ± 0.02) did not cause lactate accumulation (four sets of spectra analysed). In hypoxia, no signs of lactate during stimulation were seen in 11 out of 12 sets of spectra analysed, but in a difference spectrum from an experiment with a Ysat 0.82 during spectral data acquisition, a peak at 1.33 ppm with a signal-to-noise ratio (SNR) of ∼2 was evident.
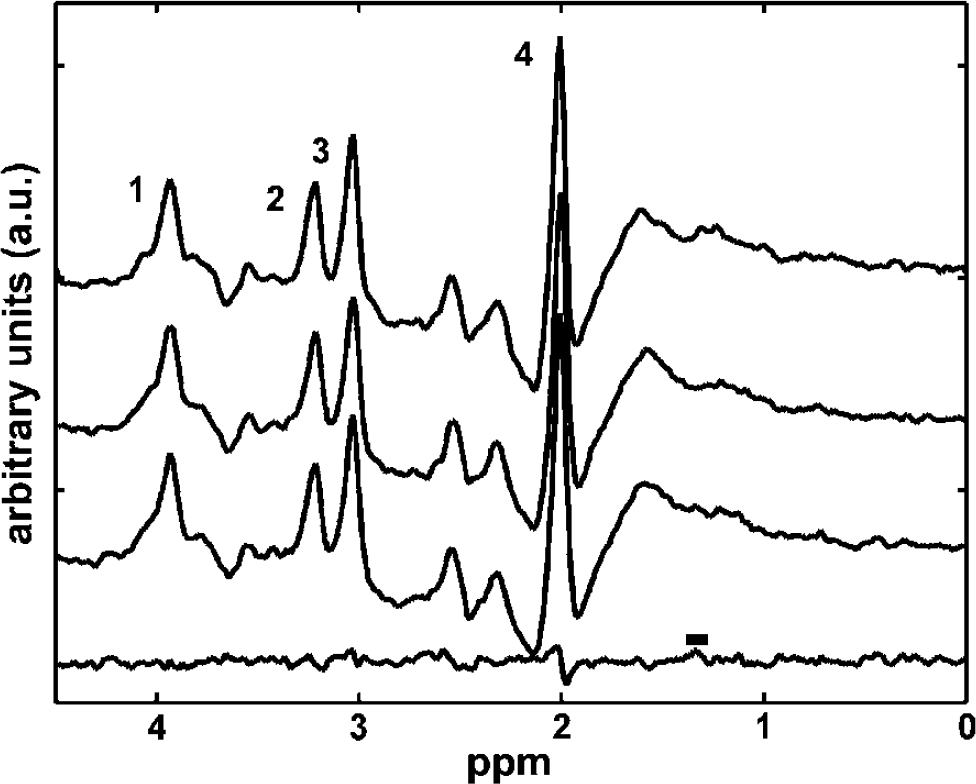
Proton nuclear magnetic resonance (1H NMR) spectra and a difference spectrum from visual cortex. Localised 1H NMR spectra from a volunteer was acquired during visual activation in normoxia (Ysat 0.98, top trace), hypoxia without visual activation (Ysat 0.88, 2nd from the top), hypoxia during visual activation (2nd from the bottom), and difference spectrum (bottom trace) of the two hypoxia spectra above are shown. Peaks are assigned as follows: 1, creatine + phosphocreatine; 2, choline-containing compounds; 3, creatine + phosphocreatine; and 4, N-acetylaspartate. Lactate-CH3 chemical shift at 1.33 ppm is marked with a horizontal bar on top of the difference spectrum. Signal from lactate methyl group, if present, will appear as negative deflection in the 1H NMR spectra at the echo time of 136 ms. If lactate was accumulated during visual activation, a difference spectrum (bottom trace) should show a negative deflection at 1.33 ppm.
Discussion
These results show that PASL response on visual stimulation in unaffected by mild hypoxia, but the size of T2*-weighted fMRI response becomes spatially heterogeneous, indicating mismatch of CBF and oxygenation changes. In the visual cortex with unchanged VEPs and no evidence for anaerobic glucose metabolism in 1H NMR spectroscopy at lowered Ysat to checkerboard activation, one can find cortex structures with evidence for high OER during stimulation relative to the values determined to equivalent stimulation in normoxia. Under the same conditions, we also found visual cortex structures with very low OER during activation. Thus, our data point to a heterogeneous OER, and inevitably CMRO2 as well, in the visual cortex, with high OER explaining smaller cortical volume showing the BOLD response in hypoxia, under these experimental conditions. To the best of our knowledge, spatial mismatch between oxygen metabolism and haemodynamics in the visual cortex has not been reported previously using fMRI techniques.
We use hypoxic hypoxia as a tool to manipulate the terms in Equation (1) and to study cerebral haemodynamics and metabolism in the stimulated brain. According to Berne et al (1981), baseline CBF abruptly increases below a certain level of Ya in response to reduced tone of resistance arterioles. In humans, CBF strongly increases at PaO2 < 35 mm Hg (equals to a Ya of 0.66) (Shimojyo et al, 1968), but it does not change within the Ysat range of 0.8 to 1 (Mintun et al, 2001; Shimojyo et al, 1968), despite reported increase in the velocity of blood in middle cerebral arteries during mild hypoxia as determined by a transcranial laser Doppler technique (Meadows et al, 2004). A possible confounding effect associated with respiratory challenges is that both hyperoxia (Kashikura et al, 2001) and hypoxia (Siesjö, 1978) may alter breathing volumes, potentially resulting in hypocapnia. We have determined Ysat with a noninvasive devise, but have no direct data from partial pressure for arterial carbon dioxide content (PaCO2). Studies exposing healthy volunteers to similar levels of hypoxia have shown that PaCO2 decreases by 2 to 3 mm Hg (Mintun et al, 2001; Shimojyo et al, 1968). The relevance of hypocapnia to the fMRI data interpretation is that previous human BOLD studies have indicated that PaCO2 < 30 mm Hg alone may decrease the BOLD response in the visual cortex (Posse et al, 2001; Weckesser et al, 1999). In contrast to these studies, a recent work showed (Cohen et al, 2002) an opposite effect in the BOLD signal change in hypocapnia with an end-tidal CO2 level at 27 mm Hg. Cohen and co-workers found that in mild hypocapnia, the BOLD signal amplitude increased and the peak width became narrower. Positron emission tomography studies addressing the effects of CO2 on the CBF response to visual activation found that in mild hypocapnia, the CBF response was reduced in size (Kemna et al, 2001; Shimosegawa et al, 1995). The present fMRI study and a PET study by Mintun et al (2001) observed CBF responses of similar size in the visual cortex during normoxia and mild hypoxic hypoxia. Further evidence against hypocapnia in the present experimental settings is obtained from the unchanged VEP amplitudes down to average Ysat of 0.82. This is consistent with a recent study using anaesthetised ventilated animals with maintained PaCO2 where it was observed that neuronal responses to whisker stimulation were not affected by hypoxia down to PaO2 of 45 mm Hg (equivalent to a Ya of 0.8) (Lindauer et al, 2003). Further, absence of lactate in baseline 1H NMR spectra of visual cortex structures argues against severe hypocapnia under the present experimental conditions (Kauppinen and Williams, 1998). Therefore, it is reasonable to claim that the fMRI observations we have made are caused by hypoxic hypoxia with little, if any, contribution from imminent superimposed mildly decreased PaCO2.
One factor that might reduce the BOLD fMRI response during hypoxia is shortened baseline parenchymal T2*. This would result in differing sensitivity of the T2*-weighted GRE EPI to BOLD in normoxia than hypoxia (Bandettini and Wong, 1995). We observed a tendency towards shorter baseline parenchymal T2* in hypoxia, the mean values differing by ∼2 ms. The difference is, however, too small to explain our observation for the T2*-weighted signal to be caused by change in the sensitivity of GRE EPI method for BOLD under different oxygenation states.
Oxygen reaches intracellular sites by diffusion from the vasculature. Recent results obtained by optical imaging methods show that brain tissue around arterioles and venules has uniform tissue oxygen tension (ptO2), and in fact, an oxygen gradient between the intravascular space and tissue can be found only in the immediate vicinity of arterioles with a diameter greater than 50 μm (Intaglietta et al, 1996). This indicates that oxygen is extracted not only at the capillary bed but also from the small arterioles with a diameter less than 30 μm, and thus, the surface area for O2 extraction is much greater than that provided by the capillary bed alone. In ischaemia, precapillary O2 loss has been considered to serve as an endogenous means to enhance OER in brain regions where CBF is compromised (Gröhn et al, 2000). In mild hypoxia with PaO2 of 44 mm Hg (equals to a Ya of 0.80), OER shows, as expected from Equation (1), a tendency towards slight elevation in the presence of unchanged CMRO2 and CBF (Shimojyo et al, 1968). The present 1H NMR spectroscopy results show no consistent signs for anaerobic lactate metabolism in the visual cortex during resting and activated state at Ysat > 0.82. This is a further evidence against decline in ptO2 below a critical ischaemia level under the experimental conditions of the present study. Thus, ptO2 provided by stimulated CBF of the magnitude determined here and previously by PET under comparable oxygenation state (Mintun et al, 2001) is sufficient to satisfy the needs of oxidative metabolism in the visual cortex during sensory stimulation at lowered Ysat.
The present results indicate that change in OER on visual activation is Ysat dependent. At physiologic arterial oxygen saturation, OER decreases by 35% on stimulation, consistent with PET (Fox et al, 1988) and fMRI (Golay et al, 2001; Oja et al, 1999a) data. Our results show that checkerboard stimulation results in heterogeneity in the T2*-weighted MR signal change during hypoxia in the visual cortex. There is inherent variation in BOLD signal because of the degree of contributions by different size veins (Haacke et al, 1994; Oja et al, 1999b; Song et al, 1996); however, the heterogeneity seen here in the T2*-weighted MR signal in the stimulated visual cortex during hypoxia is apparently not because of this effect, because the imaged tissue volume was the same under all oxygenation states. The VASO fMRI-based method quantifies OER in the parenchymal structures showing increased T2*-weighted signal because of BOLD. In the present experiments, the anatomic area of visual cortex, from which OER is measured by the VASO fMRI, varies within BOLD-activated pixels. The T2*-weighted GRE EPI revealed attenuated signal increase in the visual cortex structures outside the area displaying BOLD fMRI signal in hypoxia. The observations that ΔS and pixel count in PASL images were not influenced by hypoxia (Figure 1C) tend to favour the idea that the volume of the visual cortex showing perfusion change was similar under all oxygenation states. It should be noted, however, that PASL images were acquired with much poorer anatomic resolution than the BOLD images because of signal-to-noise considerations, and therefore, exact anatomic comparison of changes in perfusion and oxygenation in the visual cortex is not possible. Assuming that CBF response was uniform and taking into account the observation that parenchymal T2* was not significantly affected by hypoxia per se, the attenuated T2*-weighted signal increase during stimulation in part of the visual cortex structures is likely to be because of high OER.
Interpretation of fMRI results in terms of anatomic substrates requires understanding of contributions from individual vascular types to each fMRI technique. T2* BOLD signal at 1.5 T is dominated by contributions from postcapillary vasculature (Haacke et al, 1994; Song et al, 1996) with some  of the signal arising intravascularly (Silvennoinen et al, 2003). Pulsed arterial spin labelling represents tissue signal changes resulting from the exchange of ‘spin-labelled’ water with tissue water at the capillary site, with controllable contributions from macrovasculature (Hendrikse et al, 2003). Because the PASL technique exploits subtraction of two images acquired with the same short TE, BOLD contribution cancels out in the CBF images. Thus, Ysat will not directly influence PASL signal through blood oxygen saturation-dependent mechanisms. Furthermore, VASO fMRI is sensitised to the microvascular CBV by selecting the inversion delay to null the water in the intravascular compartment (Lu et al, 2003). Because of inherent sensitivities to vascular types, the anatomic localisation of brain responses with the used techniques inevitably varies. A further difference between the fMRI techniques is their contrast-to-noise ratios (CNR), that is, the dynamic range provided for indirect detection of brain activity. Blood oxygen level-dependent fMRI can be regarded ‘high CNR’ fMRI method in comparison to PASL and VASO, which provide only 30% to 50% of the dynamic range by BOLD at 1.5 T (Lu et al, 2003). This factor will inevitably influence the quality of PASL and VASO data for brain mapping; however, for the purpose of the present study, the scans for imaging of CBF and OER have comparable CNR as well as SNR in all oxygenation states. Pulsed arterial spin labelling images are commonly acquired with low resolution to improve CNR of the perfusion images, such as in those acquired in this study. The anatomic coverage of visual cortex in all PASL scans was the same, and therefore, the effects of Ysat on CBF can be compared between experiments. At 1.5 T, T1 of blood is not influenced by deoxygenation down to Ya of 0.5 (Lu et al, 2003), and thus, hypoxia per se is not affecting the PASL images. The observation that decline in BOLD activation volume was detected in images acquired at two different anatomic resolutions further argue that the varying spatial resolution does not influence the main thrust of the present T2*-weighted data. We are also confident that the effects of Ysat on CBF can be reliably determined with the fMRI method used, even when data were acquired with lower spatial resolution than the T2*-weighted MRI.
To conclude, the present results show that close to full arterial oxygenation (Ysat > 0.98) renders a mismatch between CBF and oxygen metabolism during brain activation. When oxygen availability declines because of low Ysat, heterogeneity in oxygen extraction, and inevitably also in metabolism, is observed in the visual cortex during stimulation without consistent 1H NMR spectroscopic signs of anaerobic metabolism. Firstly, in part of the visual cortex, the OER changes very little during stimulation. This observation suggests that OER may adapt to metabolic needs at given CBF change in the presence of low Ysat. Secondly, structures in the visual cortex are revealed where OER proceeds at a very low level during visual processing. In these cortical structures, oxygen requirements during increased workload do not apparently elicit the CBF response. Invasive methods used recently to determine ptO2 and CBF have provided evidence for spatially differing distribution for metabolic and haemodynamic responses in activated brain (Thompson et al, 2004). Thompson and co-workers observed that in the lateral geniculate body, ptO2 and blood flow respond differently in different regions during activation. They showed that CBF responses are not necessarily associated with oxidative metabolism, which is of major significance as far as fMRI data interpretation is concerned. Our data agree with this notion, suggesting that oxygen requirement during brain activation in mild hypoxia is heterogeneous.