
Abstract
Non-invasive mapping of cerebral perfusion is critical for understanding neurovascular and neurodegenerative diseases. However, perfusion MRI methods cannot be easily implemented for whole-brain studies in mice because of their small size. To overcome this issue, a transient hypoxia stimulus was applied to induce a bolus of deoxyhemoglobins as an endogenous paramagnetic contrast in blood oxygenation level-dependent (BOLD) MRI. Based on stimulus-duration-dependent studies, 5 s anoxic stimulus was chosen, which induced a decrease in arterial oxygenation to 59%. Dynamic susceptibility changes were acquired with whole-brain BOLD MRI using both all-vessel-sensitive gradient-echo and microvascular-sensitive spin-echo readouts. Cerebral blood flow (CBF) and cerebral blood volume (CBV) were quantified by modeling BOLD dynamics using a partial-volume-corrected arterial input function. In the mouse under ketamine/xylazine anesthesia, total CBF and CBV were 112.0 ± 15.0 ml/100 g/min and 3.39 ± 0.59 ml/100 g (n = 15 mice), respectively, whereas microvascular CBF and CBV were 85.8 ± 6.9 ml/100 g/min and 2.23 ± 0.27 ml/100 g (n = 7 mice), respectively. Regional total vs. microvascular perfusion metrics were highly correlated but a slight mismatch was observed in the large-vessel areas and cortical depth profiles. Overall, this non-invasive, repeatable, simple hypoxia BOLD-MRI approach is viable for perfusion mapping of rodents.
Keywords
Introduction
Proper cerebral perfusion is critical for maintaining brain homeostasis, delivering oxygen and nutrients, and removing neurometabolic wastes. Cerebral perfusion is thus a good biomarker of neurovascular and neurodegenerative diseases such as stroke, vascular dementia, Alzheimer’s disease, and tumor. 1 Therefore, it is critical to quantify perfusion metrics, including cerebral blood flow (CBF) and cerebral blood volume (CBV), with high sensitivity and repeatability for the follow-up progression and treatment of diseases. Numerous mouse models that recapitulate neurological disease phenotypes or progression also manifest with brain perfusion changes. This makes it imperative to non-invasively measure perfusion metrics in mice.
Magnetic resonance imaging (MRI) is widely used to obtain CBF and/or CBV using endogenous arterial blood or exogenous contrast agents as tracer. 2 Arterial spin labeling (ASL) techniques rely on magnetically labeled arterial water as an endogenous tracer and permit quantitative CBF measurements that can be repeated during the same experiment.3–5 However, the sensitivity of ASL depends on the spin labeling time and T1 of arterial blood. In mice, a high spatial resolution is required because of their small brain volume of ∼0.5 cm3 (vs. 2 cm3 in rats). Consequently, CBF in mice is often obtained in a few selected slices with extensive averaging.6–13 Alternatively, dynamic susceptibility contrast (DSC) MRI uses a bolus injection of a paramagnetic contrast agent whose concentration changes are dynamically observed via MRI during the first passage of the contrast agent.14,15 Because contrast agents change both T1 and T2/T2*, a proper sampling scheme to separate these two relaxation parameters is required for modeling of quantification. Leakage of contrast agents through the blood–brain barrier can be significant in pathological conditions such as a tumor, which can complicate quantification.16–18 Nonetheless, the DSC-MRI technique is highly sensitive, straightforward, and widely used in humans. Application of DSC MRI to mice is technically difficult because it requires an extremely short bolus injection of contrast agents into blood and rapid imaging. Therefore, there are currently limited studies in the literature on mouse cerebral perfusion.19–21
Similar to blood oxygenation level-dependent (BOLD) fMRI, 22 paramagnetic deoxyhemoglobin has been recently used as an endogenous contrast agent for DSC MRI in humans.23,24 A change in deoxyhemoglobin concentration modulates T2/T2* but not T1. 25 Recently, a method was introduced to obtain perfusion measurements using BOLD and hyperoxia-modulated changes in the concentration of deoxygenated hemoglobin. 26 As hyperoxia is known to cause an increase in the blood oxygenation level primarily localized to the venous vasculature, this contrast mechanism has been proposed as a means to measure venous blood volume. 27 Accordingly, a better approach is to modulate the arterial and venous oxygenation saturation level by applying hypoxia. With the adoption of DSC modeling to dynamic BOLD MRI with ∼25 s hypoxic stimulation, CBF and CBV were successfully obtained in humans. 24
In this study, we developed a BOLD-DSC MRI protocol with a transient hypoxia gas stimulus for mouse perfusion imaging and measured whole-brain quantitative CBF and CBV at 9.4 T. We examined the stimulus duration-dependent BOLD-MRI response, arterial oxygen saturation level changes, and associated baseline physiological changes. To quantify CBF accurately, the arterial input function was obtained by correcting the partial-volume effect of the arterial vessels. Whole-brain CBF and CBV of mice were mapped using all-sized-vessel-sensitive gradient-echo and microvessel-sensitive spin-echo data collection.
Materials and methods
Theoretical background
Deoxyhemoglobin is used as an endogenous blood-pool contrast agent; its dynamic change in response to transient hypoxia 28 is used for DSC perfusion modeling, similar to that used for the exogenous contrast agent.
Quantitative perfusion measurements from dynamic ΔR2* changes due to hypoxia
The change in the

To obtain quantitative perfusion indices from transient hypoxia data, we adopted theories in the widely used DSC MRI, which measures first-pass MRI signal change following the bolus injection of exogenous contrast agent.14,15,34–36 The exogenous plasma-based contrast agent concentration in the conventional DSC-MRI theory was replaced with the endogenous deoxyhemoglobin concentration. The change in deoxyhemoglobin concentration

Then, CBV (unit of ml blood/g tissue) can be quantified from the area under the curve (AUC) of
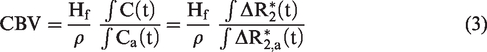
CBF (unit of ml blood/g tissue/min) can be obtained using equation (2) by deconvoluting the measured tissue concentration–time curve
Determination of arterial input function
Accurate determination of AIF is important for the quantification of cerebral hemodynamics. However, extracting AIF of pure arterial intravascular blood signals is difficult because of the partial-volume effect with a smaller-than-voxel arterial vessel diameter.42–46 Thus, a large blood-vessel voxel with the largest value in the area under the
Determination of relative CBV with iron oxide contrast agent
To examine the assumptions that i) CBV change is minimal during transient hypoxia and ii) large vessel voxels contain only intravascular signals, and to compare baseline CBV values determined by hypoxia vs. contrast agents, exogeneous susceptibility contrast monocrystalline iron oxide nanoparticle (MION) (Feraheme, AMAG Pharmaceuticals, USA; diluted with saline for an accurate injection dose) was injected into blood. Transient hypoxia experiments were performed without and with various doses of MION. The transverse relaxation rate change by MION under hypoxia is related to absolute CBV change due to hypoxia as:
47

Animal preparation and physiological monitoring
All animal experiments were approved by the Institutional Animal Care and Use Committee of Sungkyunkwan University, and were conducted in compliance with the Animal Welfare Act (AWA), National Institutes of Health Guide for the Care and Use of Laboratory Animals, and ARRIVE guidelines 2.0 (Animal Research: Reporting in Vivo Experiments). 48 Twenty-eight male mice (C57BL/6, 25–30 g, ages 2–5 months old, Orient Bio, Korea) were used. Mice were initially sedated using an intraperitoneal (IP) injection of a mixture of ketamine (100 mg/kg) and xylazine (10 mg/kg), and then maintained with a subsequent IP bolus injection of 25 mg/kg of ketamine and 1.25 mg/kg of xylazine at approximately every 45 min as needed.49,50
During the experiment, the heart rate and peripheral oxygen saturation (SpO2) values were monitored and recorded using an MR-compatible optical pulse oximeter (SA Instruments, USA) attached to the tail. A rectal temperature probe and respiration pad were used to record the temperature and respiration rate, respectively. End-tidal CO2 was monitored using a multi-parameter physiological monitor (LifeWindow LW9x, Digicare Biomed Tech, USA). Physiological data were monitored using a physiological monitoring system (Model 1030, Small Animal Instruments Inc., USA) and recorded using a data acquisition system (Biopac Systems, Inc., USA). The temperature of the mice was maintained at 37 ± 0.5°C using a circulating warm water blanket.
Transient hypoxia paradigm for perfusion measurements
Figure 1(a) shows a schematic of the experimental setup for the respiratory stimulation MRI. A three-channel programmable gas mixer (GSM-3 Gas Mixer, CWE, Inc. Ardmore. PA 19003 U.S.A) synchronized with the MRI scanner was used to precisely control the composition of output gas mixture from 100% N2 and 100% O2 input gases with in-house MATLAB-based software. The delivery time from the gas mixer to the mouse is dependent on the length and diameter of the tubing and the gas flow rate (1 L/min). The gas transfer delay from the gas mixer to the nose cone of the cradle was 5.51 ± 0.24 s, as measured by the CO2 sensor, and was corrected for data analysis. Transient hypoxia was induced by reducing the fraction of inspired oxygen (FiO2) from 44% to 0%, typically for 5 s. In our all experiments, a 44% FiO2 condition was set as the baseline.
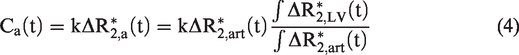
Experimental setup and anoxia duration-dependent responses. (a) Schematic of experimental setup. 100% N2 and 100% O2 gases were mixed by a computer-controlled gas mixer and delivered at a flow rate of 1 L/min to a mouse’s nose cone, which was attached to the home-built cradle. (b) The experimental procedure of anoxia stimulus with injections of 1 mg/kg MION for determining relative CBV changes. (c,d) BOLD-MRI responses to 3 s, 5 s, and 10 s anoxic stimulation in the whole cerebral cortex. Negative response was observed due to an increase in paramagnetic deoxyhemoglobin, and its peak response was −6.6 ± 0.1% (n = 5 mice; red), −8.2 ± 0.3% (n = 8; green) and -10.9 ± 0.8% (n = 3; blue) for 3 s, 5 s and 10 s stimulus, respectively. (e,f) Relative CBV changes of the entire cortex responding to 3 s, 5 s, and 10 s anoxic stimulation, computed from the difference between relaxation rate changes due to anoxia with different doses of MION (see Supplementary Figure 1 for details). Three combinations were used for checking consistency (e: no vs. 1 mg/kg MION, black; no vs. 2 mg/kg MION, yellow; 1 vs. 2 mg/kg MION, pink) and then averaged (f). The CBV increase was 9.4 ± 1.3% and 11.2 ± 1% during 3 s (n = 5; red) and 5 s anoxia (n = 8; green), respectively, whereas a larger and prolong CBV change was observed during 10 s anoxic stimulus (n = 3; blue). Gray shade or color bars represent the stimulation period. For clarity, only one-side error bars (standard deviation) are presented.
Arterial blood gas analysis
Arterial blood gas analysis (ABGA) was performed using various FiO2 settings (n = 6 mice). The femoral artery was catheterized by a catheter made using a PE-10 tube. Mice were placed on a cradle with the same setting for MRI experiments with added ECG monitoring. 0.95
MRI acquisitions
All MRI experiments were performed on a Bruker Biospec 9.4 T/30 cm horizontal bore instrument with an actively shielded 12.0 cm diameter insert. The mouse brain was positioned as close as possible to the isocenter of the magnet. A quadrature birdcage coil (86 mm inner diameter) was used for excitation, and an actively decoupled Bruker planar surface coil (10 mm inner diameter) positioned on top of the mouse head was used for detection. T2*-weighted single-shot gradient-echo echo-planar images (GE-EPI) were acquired for total vascular weighted perfusion mapping with the following parameters: repetition time (TR)/echo time (TE) = 1000/11 ms, flip angle = 50°, spatial resolution = 156 × 156 × 500 μm3, 20 continuous slices with interleaved order, and dummy scans of 10. Alternatively, T2-weighted single-shot spin-echo echo-planar images (SE-EPI) were acquired for microvascular perfusion mapping with the same parameters, except TE = 22 ms and flip angles = 90/180°.
To characterize BOLD responses to hypoxic stimulation and to quantify perfusion values, three experimental designs were used: 1) duration of anoxic stimulation, 2) determination of arterial oxygen saturation change, and 3) quantification of regional perfusion values. The first two experiments were performed with GE-EPI, while the last experiments were performed with GE-EPI and SE-EPI.
Data processing
Physiological data analysis
The recorded time-domain heartbeat and respiratory signals were transformed into the frequency domain through fast Fourier transformation. Then, the maximum value in the 120–360 bpm range was selected to obtain the heart rate (bpm, beats per min) from the pulse-oximetry pulse data and the respiration rate (bpm, breaths per min) from the motion-sensitive respiration signals. Dynamic pulse and respiration rates were averaged over repeated MRI trials in the same imaging session, resulting in averaged dynamic pulse and respiration rates for each subject.
Overall BOLD-MRI analysis
All BOLD data for each mouse were analyzed using MATLAB (MathWorks, USA), the Analysis of Functional Neuroimages (AFNI) package, 53 FMRIB Software Library (FSL), 54 and Advanced Normalization Tools (ANTs). 55
For individual EPI images, the following preprocessing steps were performed: slice timing correction, motion correction, linear detrending for signal drift removal, and trial averaging within the same imaging session. Spatial smoothing using a Gaussian kernel with a 156 μm full-width half-maximum (FWHM) was included to minimize potential misalignment and improve statistical power. All repeated BOLD-MRI runs in the same experimental condition were averaged in each animal. The preprocessed EPI images (156 × 156 × 500 μm3) were co-registered to the high-resolution anatomical T2-weighted image (78 × 78 ×500 μm3). Then, BOLD images were linearly interpolated 2 times, leading to a nominal resolution of 78 × 78 μm2. The anatomical T2-weighted image was spatially co-registered with the mouse brain atlas from the Allen Mouse Brain Atlas 56 using both affine and nonlinear transformations. The Allen Mouse Brain Atlas was used to define thirty right- and left-hemisphere ROIs covering most of the brain regions, and cortical layer ROIs in the primary somatosensory cortex for the cortical depth-dependent perfusion values.
Determination of dynamic CBV and SaO2 change by transient hypoxia (Expt. #1 – #2)
In 10 mice (Expt. #1), two mice were excluded from the analysis due to incomplete MION studies: one died after the 2nd MION injection and the other did not receive the appropriate MION dose. Relative CBV time courses in response to transient hypoxia were calculated in the whole cortex ROI of each animal with equation (5). 47
To determine the SaO2 change from MRI data (Expt. #2), hypoxia-induced
Estimation of corrected arterial input function
Candidate vascular voxels were selected based on a two-group hierarchy clustering method,
57
which clustered the vascular and tissue voxels in the first iteration. i) The voxel with the largest AUC value among the blood-vessel candidate voxels was selected for
Determination of quantitative perfusion values (Expt. #3)
Dynamic BOLD data of 5 s anoxic stimulus without MION were used for quantification of CBF and CBV. GE-EPI BOLD-DSC MRI in 15 animals was used for the quantification of total vascular-weighted perfusion with subject-specific AIF, while SE-EPI BOLD-DSC MRI in 7 animals was used to quantify microvascular perfusion values (mv-CBV and mv-CBF). Since SE-EPI AIF could not be obtained from arterial vessels due to the signal loss by flow-induced dephasing, and intravascular
Subsequently, multiple comparisons were also performed. 1) To check the consistency of perfusion measurements, perfusion metrics of the right- and left-hemisphere ROIs were compared. Bland-Altman plots were generated as percent differences between right and left ROI values vs. means of right and left ROI values. 2) Regional perfusion values determined using GE-BOLD MRI and SE-BOLD MRI were compared. 3) Regional quantitative perfusion values obtained from GE-BOLD MRI (CBV and CBF) or microvascular SE-BOLD MRI (mv-CBV and mv-CBF) were correlated with experimental parameters (∫
Statistical analysis
Standard normal distributions of perfusion values were confirmed by one-sample Kolmogorov-Smirnov test. Pearson’s correlation (r) was used to measure the degree of the relationship between two linearly related perfusion values. The significance was considered according to the p-value <0.05. All results are presented as the mean ± standard deviation (SD).
Results
Choice of stimulus duration
A proper stimulation duration was necessary to obtain sufficient sensitivity and AIF. Initially, 3 s, 5 s, and 10 s anoxic stimuli were used (Figure 1). During anoxic stimulation, the magnitude of decrease in BOLD signal in the cerebral cortex increased for longer stimulations (Figure 1(c)). The 3 s, 5 s and 10 s stimuli induced a negative peak change of −6.6 ± 0.1% (n = 5 mice; red), −8.2 ± 0.3% (n = 8; green), and −10.9 ± 0.8% (n = 3; blue), respectively (Figure 1(d)). For 10 s stimulation, a post-stimulus overshoot was observed.
To investigate the impact of brief anoxic stimulus on neurovascular physiology, relative CBV changes in the entire cortex were measured with different MION doses (Figure 1(e) and (f) and Supplementary Figure 1 for anoxia-evoked responses at three different MION levels). Since the contrast between the 2 mg/kg and 3 mg/kg MION doses was small (see Supplementary Figure 1), the 3 mg/kg MION data were not included in the CBV calculation. Relative CBV changes measured using different combinations are quite similar, thus averaged (Figure 1(e)). The 3 s and 5 s anoxic stimuli induced an average CBV increase of 9.4 ± 1.3% and 11.2 ± 1.0%, respectively (Figure 1(f)), and quickly returned to the pre-stimulus baseline level. The 10 s anoxia stimulus induced a prolonged increase in CBV. Although both 3 s and 5 s stimuli induced similar CBV changes, the latter was chosen for obtaining more data points of larger BOLD responses in further perfusion studies.
Systemic physiology changes responding to 5 s anoxic stimulus
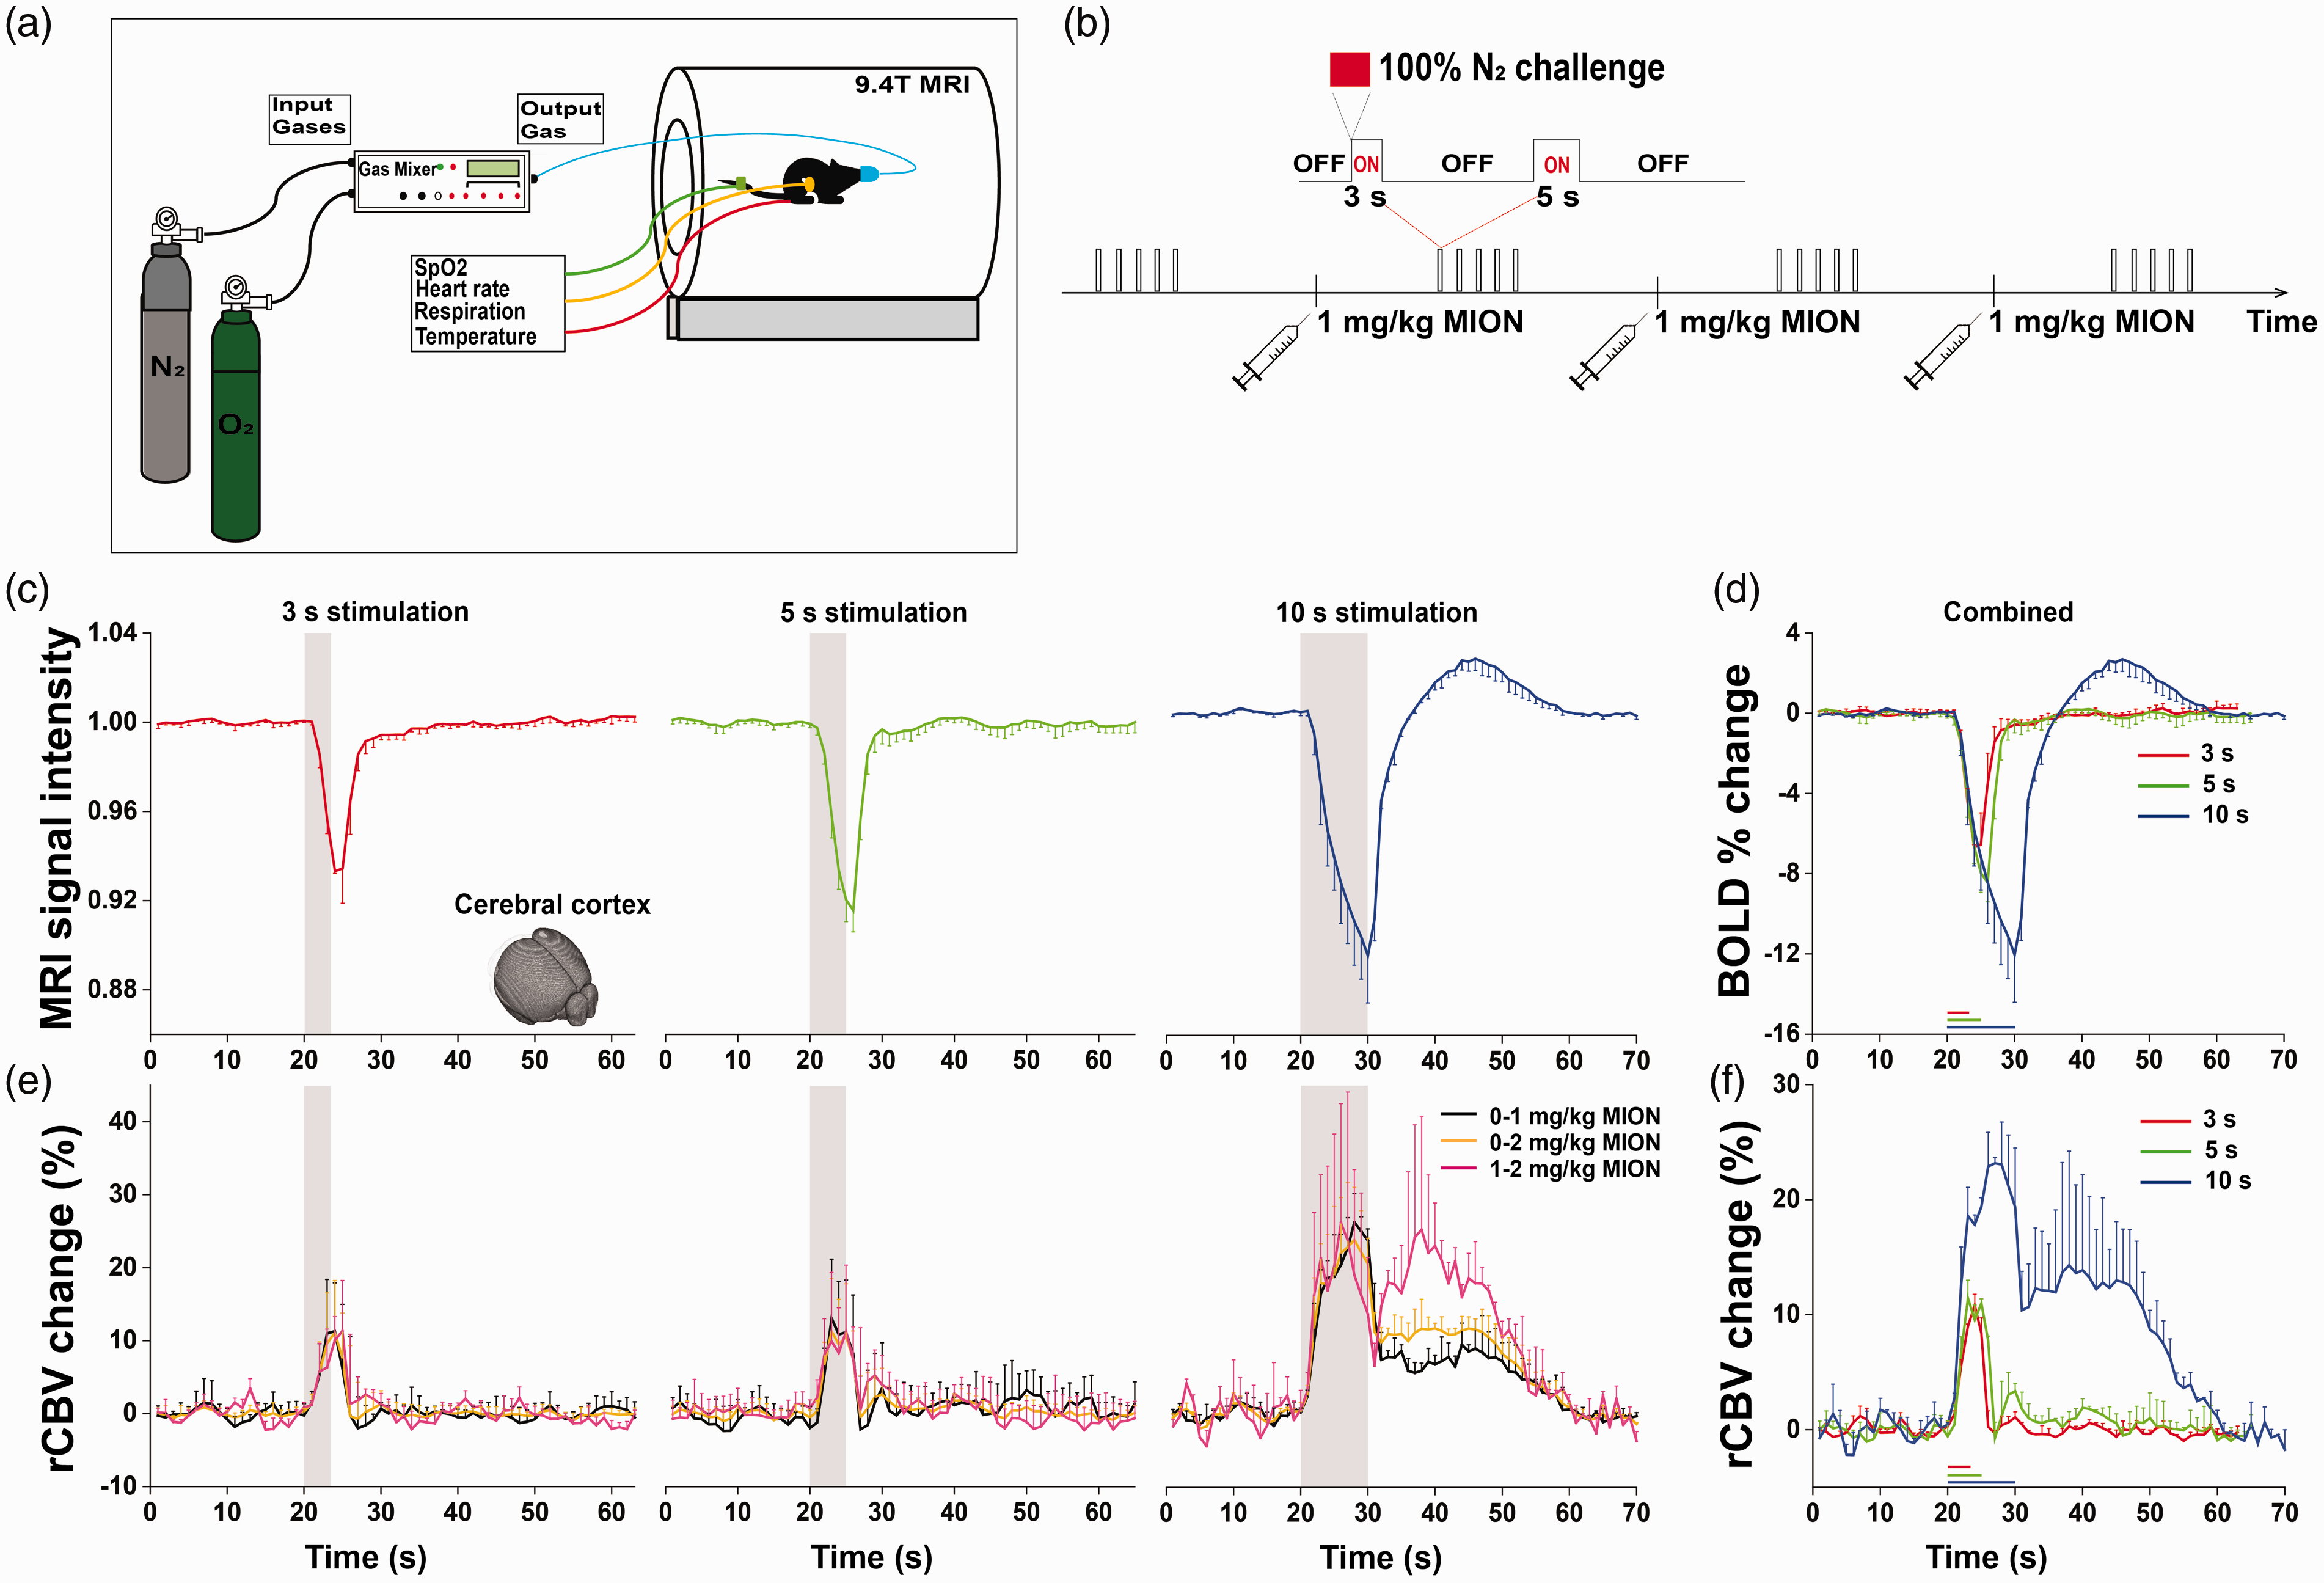
Next, we determined the oxygen saturation level change induced by the 5 s anoxia. BOLD-DSC MRI signals (yellow) were acquired with SpO2 responses (blue) at different FiO2 levels (green) of 10%, 20%, and 44% in addition to 5 s anoxia (Figure 2(a)). SpO2 followed BOLD-MRI responses but with a delay of a few seconds (Figure 2(b))
Physiological changes induced by 5 s anoxic stimulation. (a,b) BOLD-MRI signals (yellow) and peripheral oxygen saturation responses measured in tail (blue; SpO2) were acquired during different FiO2 levels (green) of 10%, 20%, and 44% in addition to 5 s anoxia. The red rectangle section in Figure 2(a) has been expanded in Figure 2(b). The SpO2 response followed BOLD MRI responses but with a few seconds of delay. Upward red arrows represent arterial blood sampling periods. (c) Box plot of arterial blood oxygenation levels measured at steady-state condition of 10%, 20%, and 44% FiO2 (left) and
As BOLD-DSC MRI signals reflect changes in cerebral oxygen saturation,22,25,32,33
Determination of corrected arterial input function
To quantify CBF and CBV accurately, it is critical to obtain an AIF. First, one large-vessel- and one arterial-like voxel were identified for each animal (blue and red dots in the images in Figure 3(a) and (c) and Supplementary Figure 2). The
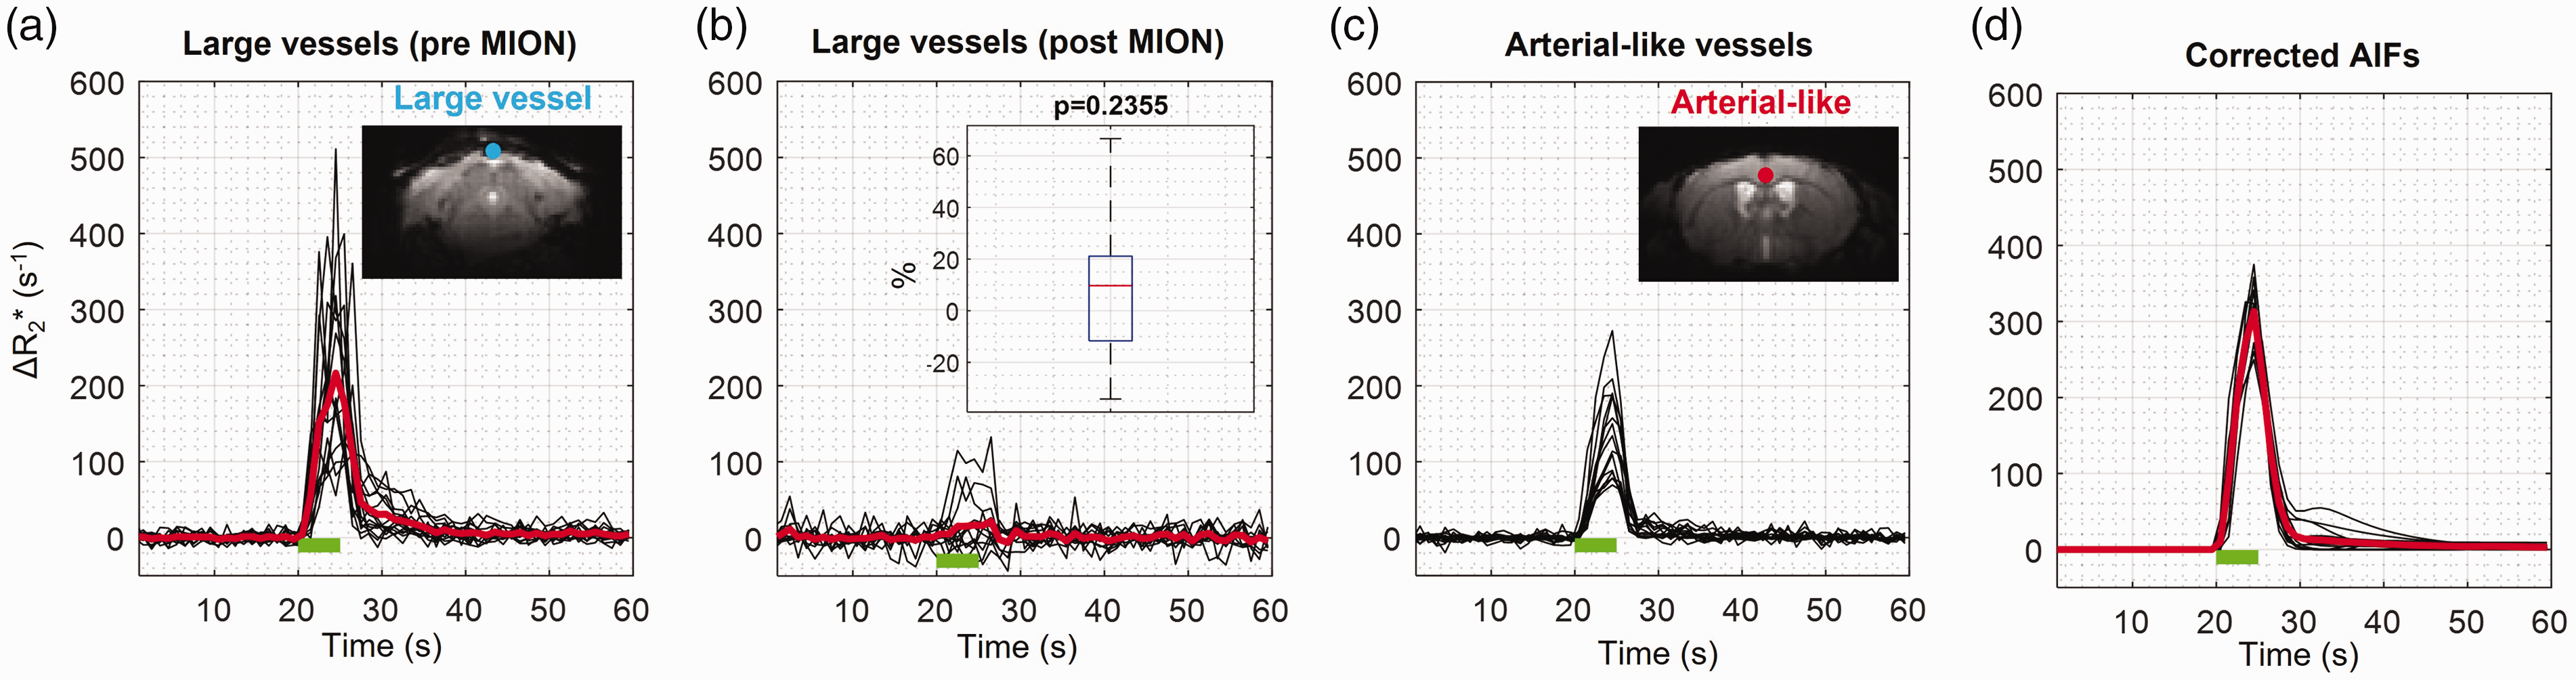
Determination of animal-wise arterial input function with the partial volume correction. The large-vessel and arterial-like voxels were found based on the area under the curve (AUC) and characteristics of dynamic
Regional total vs. microvascular cerebral perfusion values of mice
To obtain total and microvascular perfusion values, hypoxia-induced GE-BOLD MRI in 15 animals (92 runs with 5-10 runs per animal) and SE-BOLD MRI in 7 animals (175 runs with 20-30 runs per animal) were used, respectively. Thirty bilateral ROIs were selected based on the Allen Mouse Brain Atlas (Figure 4(a)). As examples, regional GE-BOLD MRI and SE-BOLD MRI responses to 5 s anoxic stimulation are shown (Figure 4(b) for the somatosensory area; see Supplementary Figure 3 for representative regions). CBF and CBV values were quantified by modeling BOLD-DSC responses with the corrected AIF (Supplementary Figure 4). Regional perfusion values between the left and right hemispheres were subsequently examined. Total perfusion metrics (CBV and CBF) showed more variation between the two hemispheres than microvascular perfusion metrics (mv-CBV and mv-CBF), likely due to the asymmetric large vasculatures between the two hemispheres (Figure 4(c) and (d) and Supplementary Figure 5 for Bland-Altman plots). These regional total and microvascular perfusion values were summarized in Table 1. Microvascular perfusion values were lower than the total perfusion values, but both total and microvascular perfusion values are highly correlated (Figure 4(e)). The magnitude of reduction using SE-BOLD relative to GE-BOLD MRI depends on the macrovascular contributions. Microvascular perfusion value was close to total perfusion in white matter corpus callosum (see also Supplementary Figure 3 for BOLD-DSC responses) but only to 40-50% of total perfusion rates in the dentate gyrus and medulla.
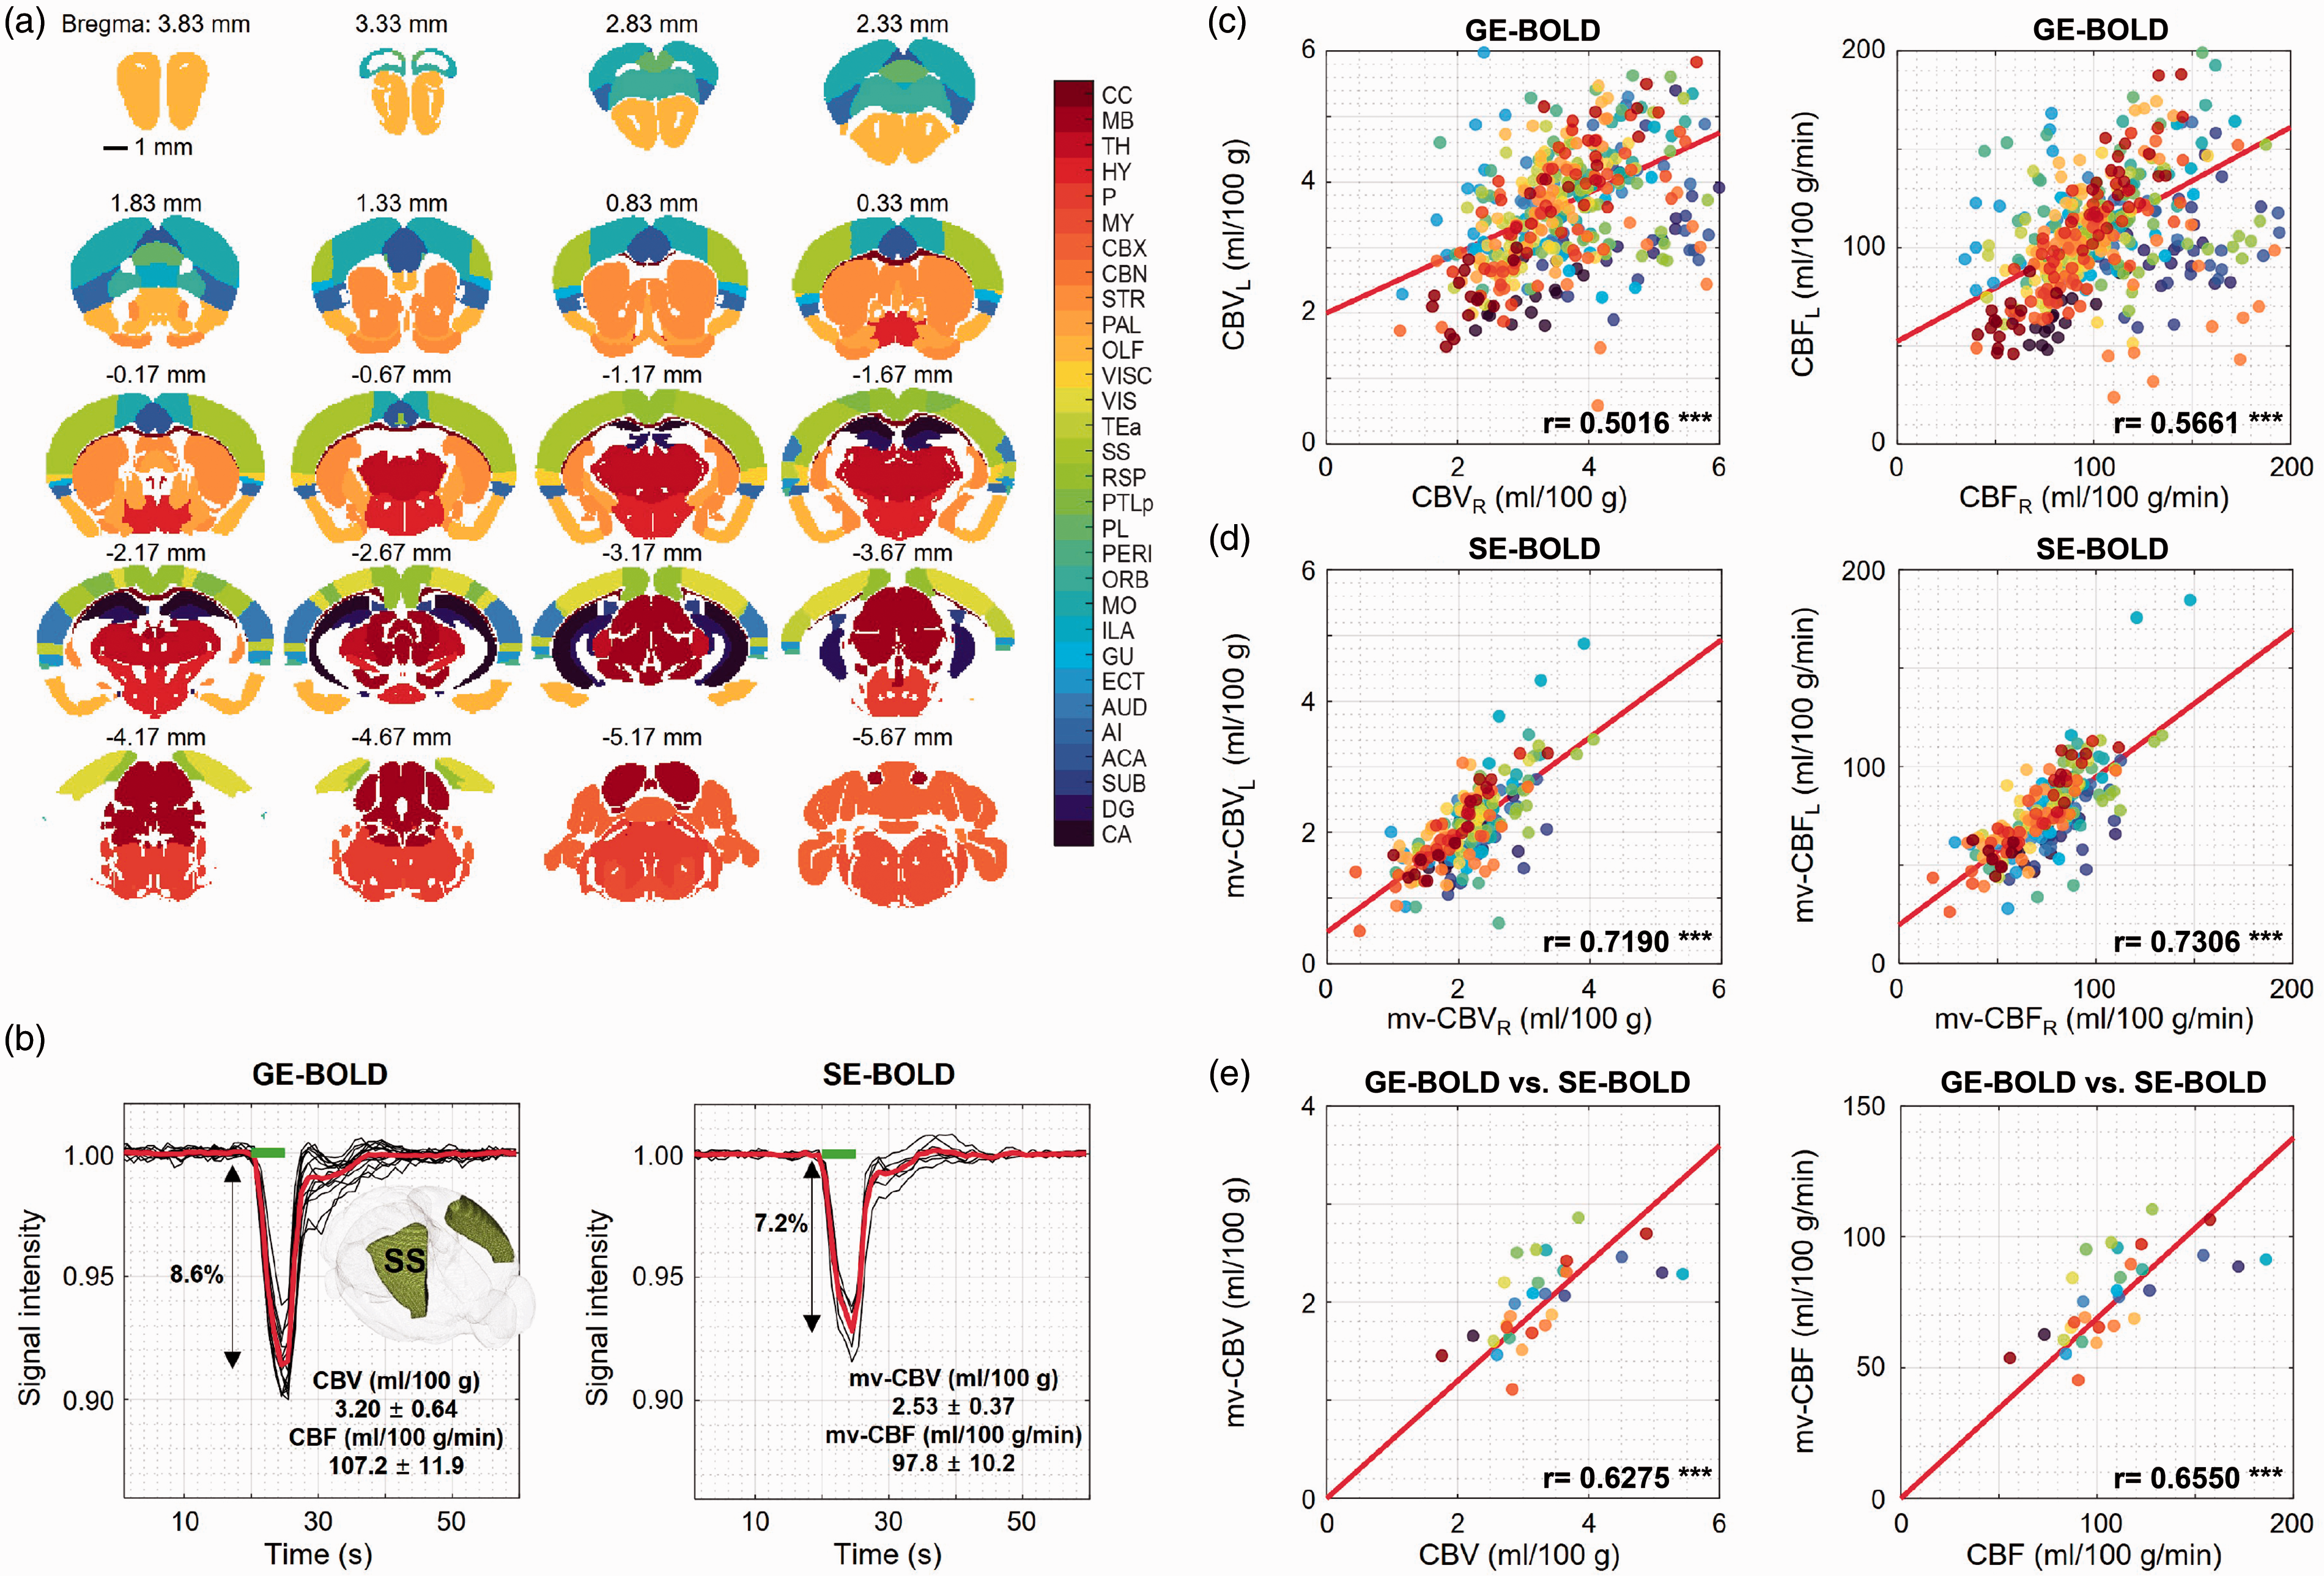
ROI analysis of gradient-echo and spin-echo BOLD-MRI responses to 5 s anoxic stimulus. Dynamic gradient-echo (GE; n = 15 mice) and spin-echo (SE; n = 7 mice) BOLD MRI were performed for measuring total and microvascular perfusion values, respectively. For each animal, 5–10 runs were averaged for GE BOLD and 20–30 runs for SE BOLD. (a) Thirty regions of interest (ROI) were defined based on the Allen Mouse Brain Atlas with anterior-posterior coordinates relative to bregma. (b) Regional GE- and SE-BOLD MR signal responses were obtained from the somatosensory ROI, where black and red lines represent individual and mean signal curves, respectively (see Supplementary Figure 3 for other representative ROIs). Cerebral blood flow (CBF) and cerebral blood flow (CBV) were quantified by modeling BOLD-DSC responses with the corrected AIF. The perfusion ratio of GE- to SE-BOLD is 1.1–1.3 for the somatosensory area. The inset image shows the ROI, while the green bar represents 5 s anoxic stimulus. (c,d) Perfusion values between left and right hemispheres were examined. Bland-Altman plots of right and left ROI values are shown in Supplementary Fig. 5. Each data point was derived from the same-colored ROI in each subject. Total vascular perfusion values (CBV and CBF) have more variations between the two hemispheres than microvascular perfusion metrics (mv-CBV and mv-CBF), likely due to the unsymmetric large vasculatures between the two hemispheres. (e) Microvascular perfusion values are highly correlated with total vascular values. Each data point represents a mean perfusion value in the same-colored ROI, and its values can be found in Table 1. CC: corpus callosum; MB: midbrain; TH: thalamus; HY: hypothalamus; P: pons; MY: medulla; CBX: cerebellar cortex; CBN: cerebellar nuclei; STR: striatum; PAL: pallidum; OLF: olfactory areas; VISC: visceral area; VIS: visual areas; TEa: temporal association areas; SS: somatosensory areas; RSP: retrosplenial area; PTLp: posterior parietal association area; PL: prelimbic area; PERI: perirhinal area; ORB: orbital area; MO: somatomotor areas; ILA: infralimbic area; GU: gustatory areas; ECT: ectorhinal area; AUD: auditory areas; AI: agranular insular area; ACA: anterior cingulate area; SUB: subiculum; DG: dentate gyrus; CA: cornu ammonis.
Regional total and microvascular CBV and CBF of ketamine/xylazine-anesthetized mouse.
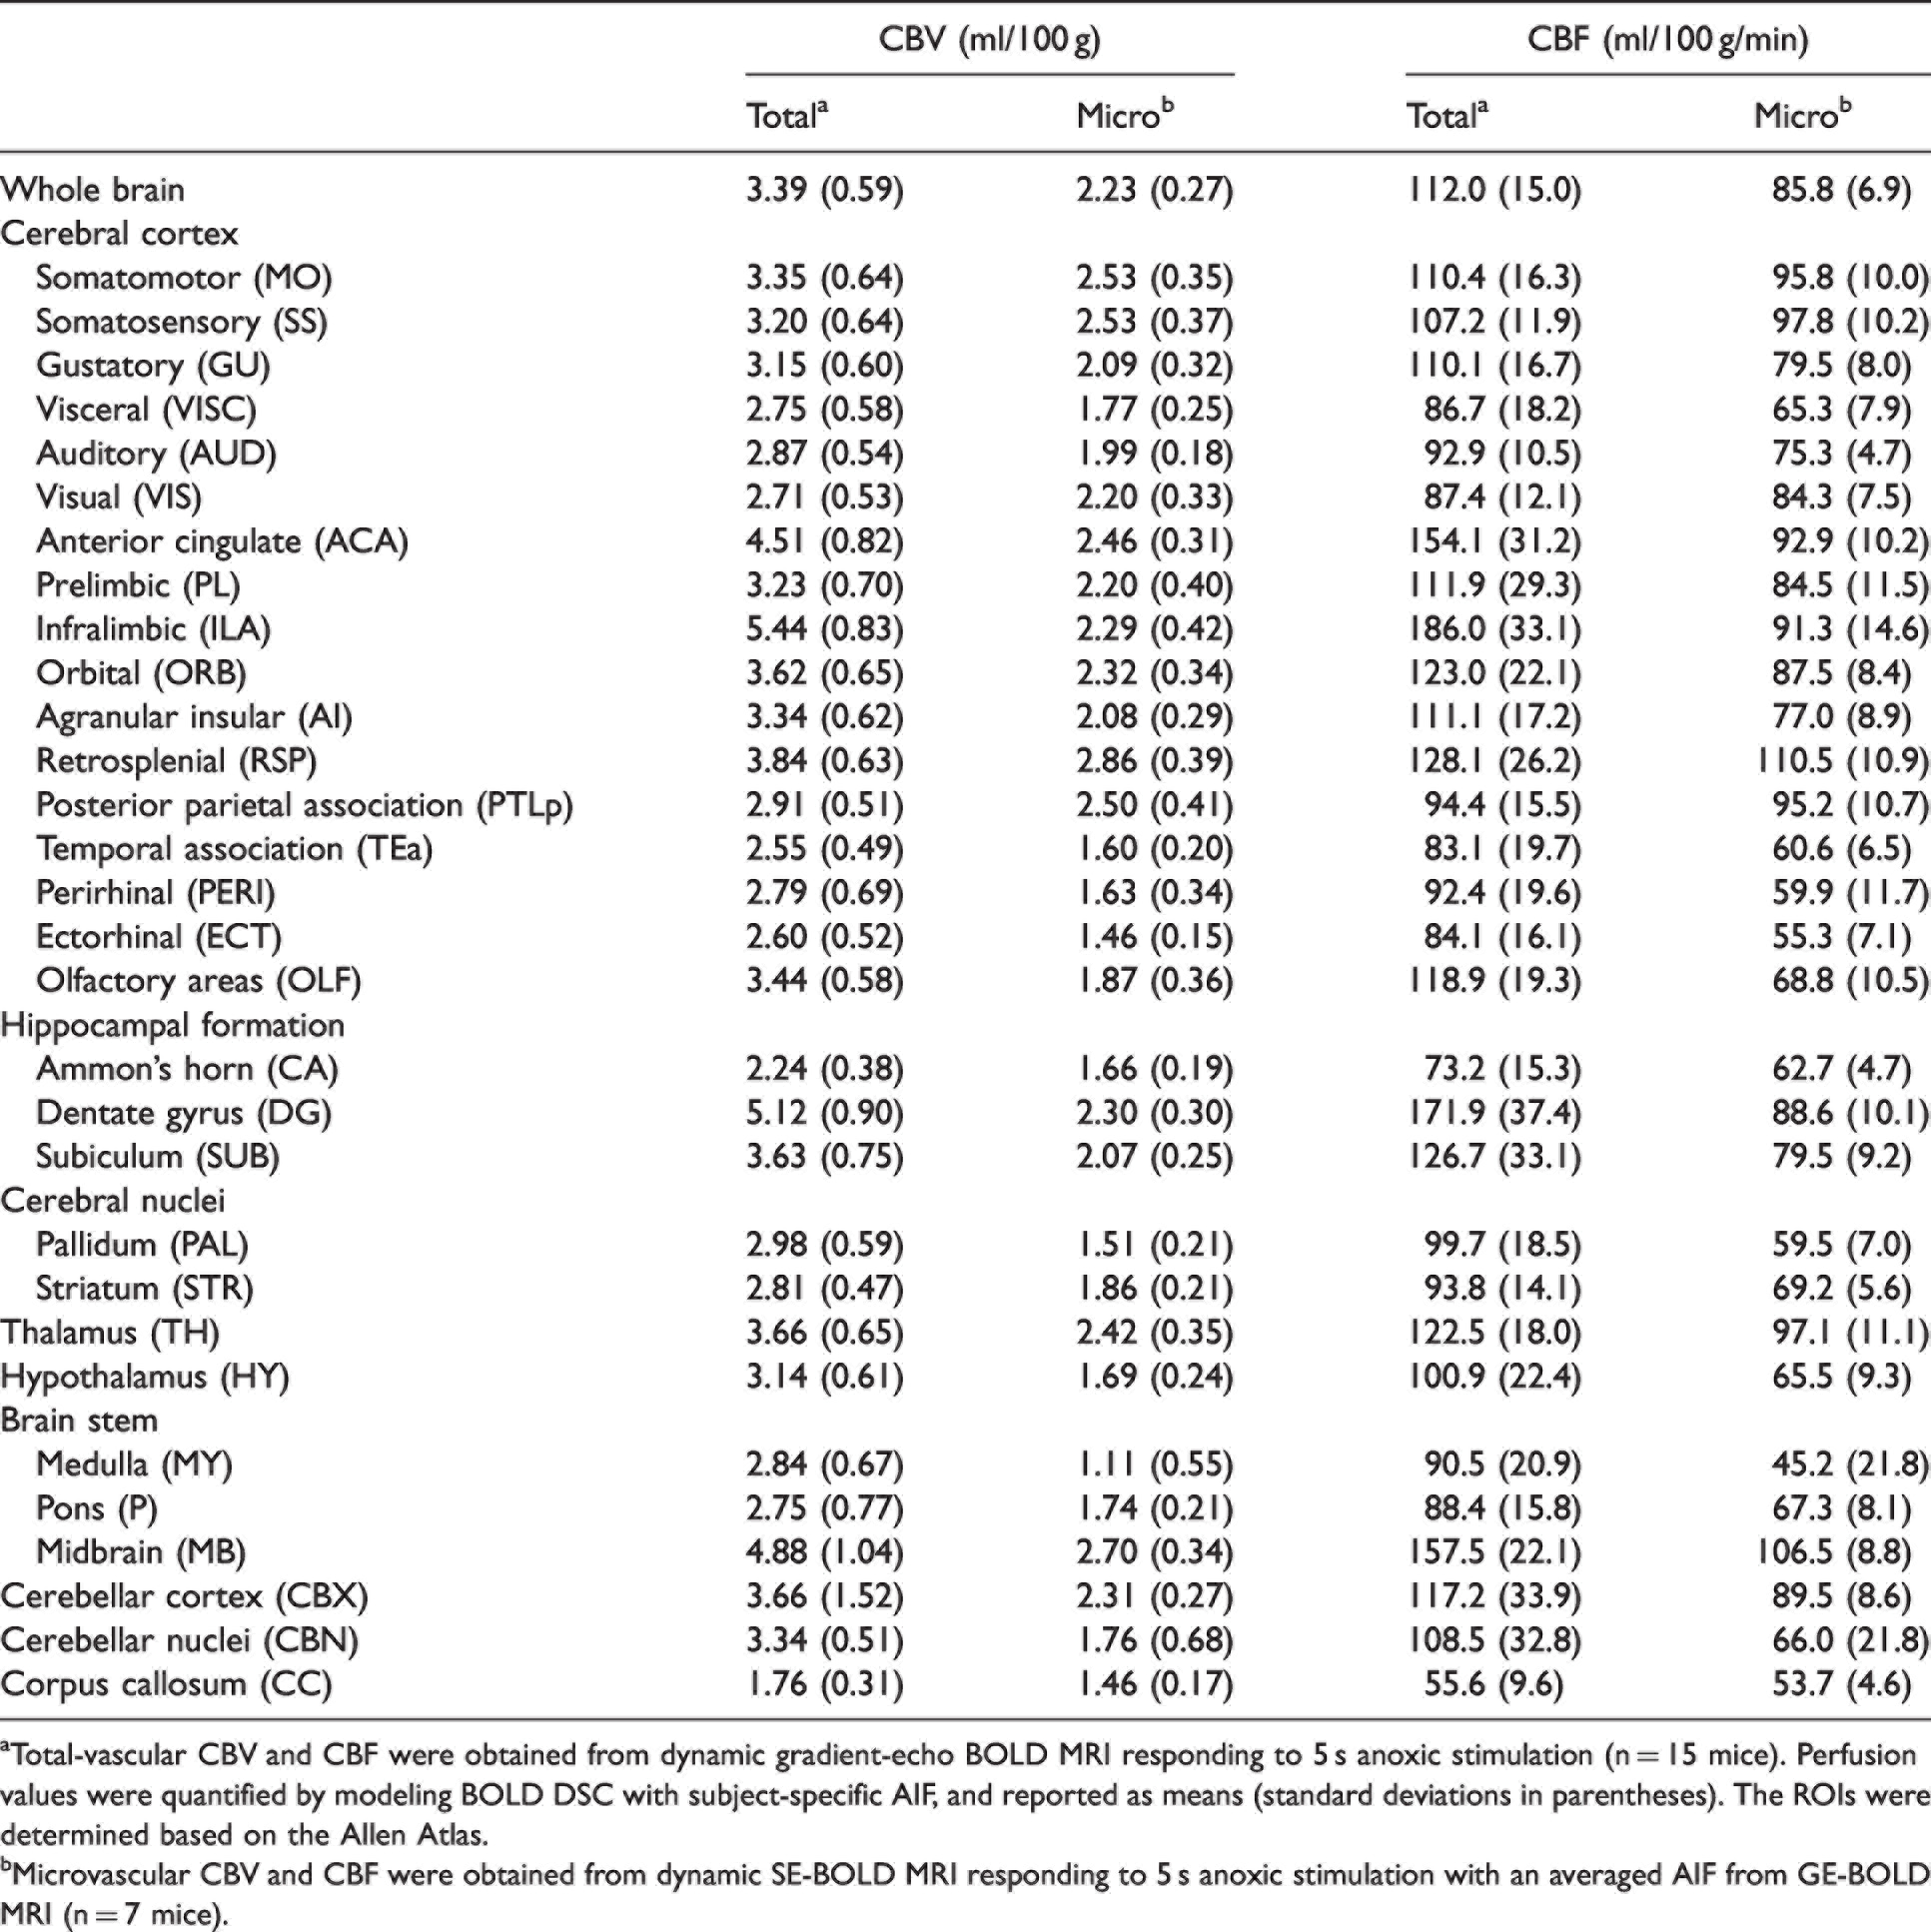
aTotal-vascular CBV and CBF were obtained from dynamic gradient-echo BOLD MRI responding to 5 s anoxic stimulation (n = 15 mice). Perfusion values were quantified by modeling BOLD DSC with subject-specific AIF, and reported as means (standard deviations in parentheses). The ROIs were determined based on the Allen Atlas.
bMicrovascular CBV and CBF were obtained from dynamic SE-BOLD MRI responding to 5 s anoxic stimulation with an averaged AIF from GE-BOLD MRI (n = 7 mice).
In the case where the AIF is not properly determined, the
Cerebral perfusion maps obtained from GE- and SE-BOLD MRI
The mean total perfusion maps of the 15 mice were generated from GE-BOLD MRI (Figure 5(a) and (c)), whereas the mean microvascular perfusion maps of the 7 mice were generated from SE-BOLD MRI (Figure 5(b) and (d)). CBV and CBF maps showed similar contrast in most brain regions for both total- and micro-vasculature, but high perfusion values obtained from GE-BOLD MRI (red arrows) were considerably reduced by the use of SE-BOLD MRI. The differences in perfusion values in the cortical, white matter (green arrowhead), and hippocampal regions were clearly distinguished. The ventricle area (black arrowhead) had no perfusion as expected.
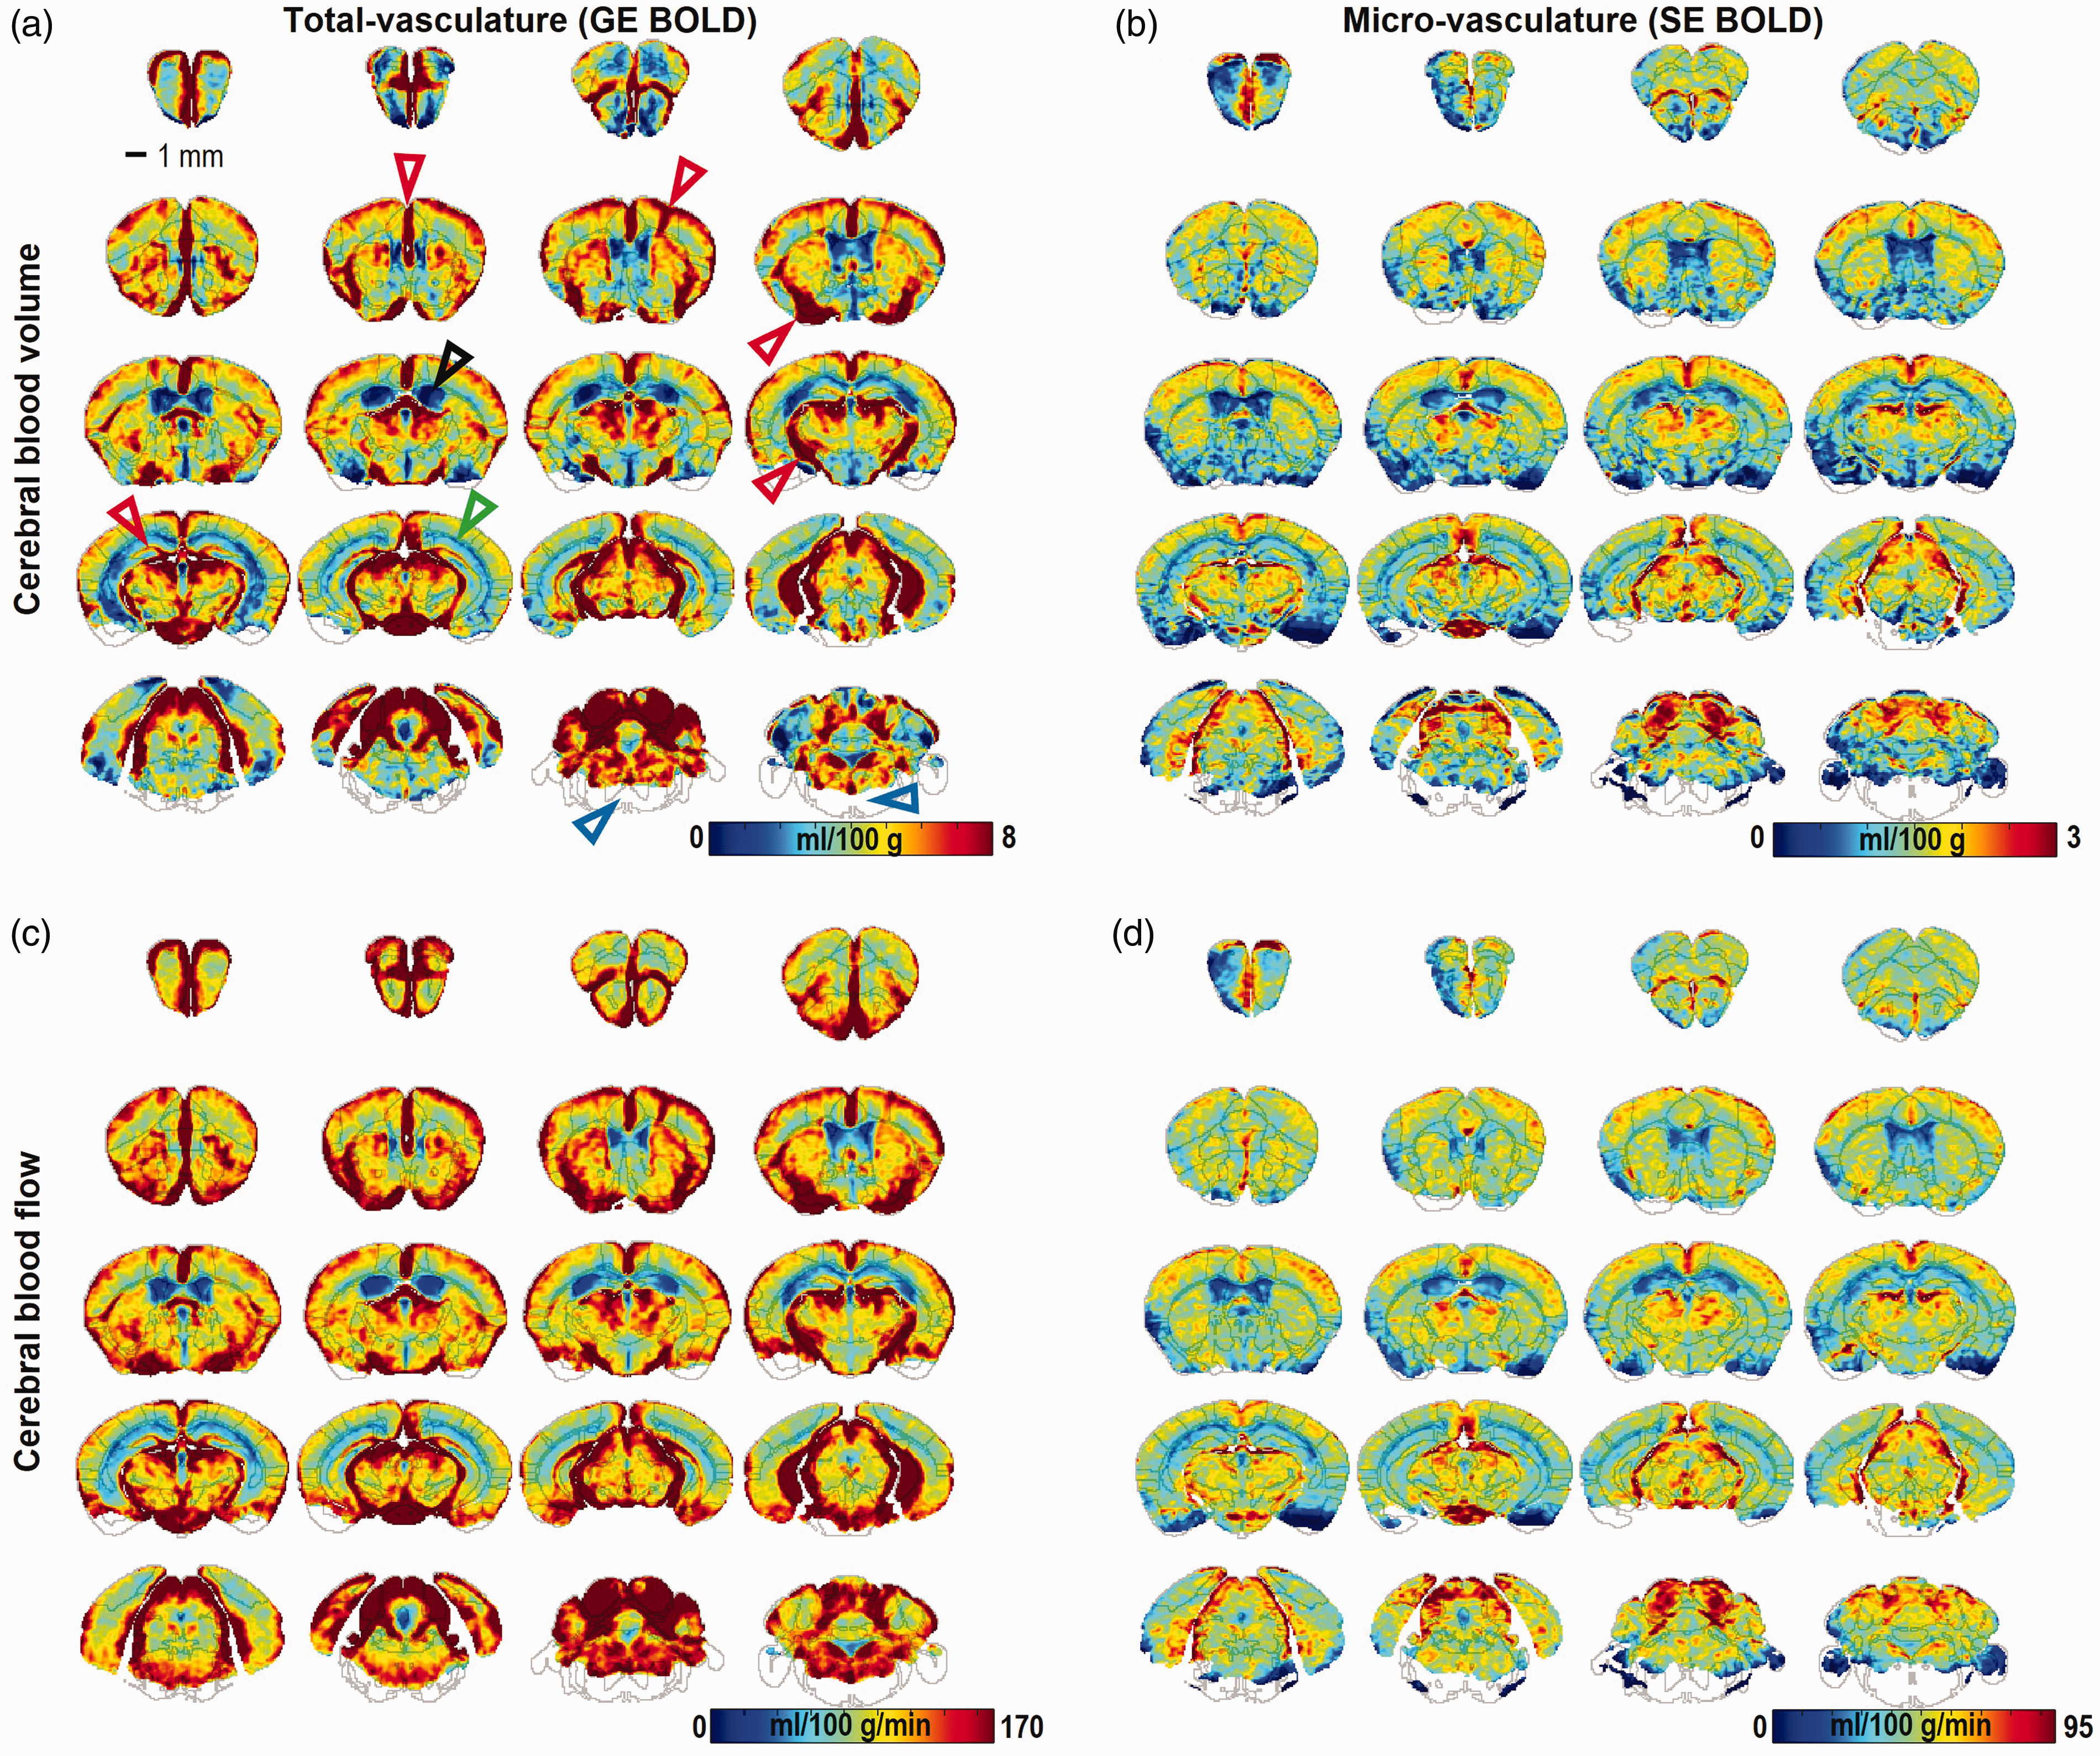
Whole-brain perfusion maps of mouse under ketamine and xylazine anesthesia. Total (a,c) and microvascular (b,d) perfusion maps were obtained from dynamic gradient-echo (GE; n = 15 mice) and spin-echo (SE; n = 7 mice) BOLD-MRI responses to a 5 s anoxic stimulation, respectively. For each animal, 5–10 runs were averaged for GE BOLD and 20–30 runs for SE BOLD. Cerebral blood volume (CBV) (a,b) and cerebral blood flow (CBF) maps (c,d) have similar contrasts for both total- and micro-vasculature. Black, green, and red arrows indicate cerebrospinal fluid, white matter, and vascular areas, respectively. In the brainstem medulla area (blue arrows), perfusion values were not computed due to low signal intensities (<half of the standard deviation).
For 12 mice with 3-5 mg/kg MION, quantitative total CBV values obtained from hypoxia-induced GE-BOLD MRI (without MION) were highly correlated with relative CBV indices obtained from steady-state MRI data before and after MION injection (see Supplementary Figure 7), indicating that hypoxia BOLD-DSC MRI measures CBV reliably. Voxel-wise correlation coefficient was higher with a higher dose of MION (r = 0.70 for 5 mg/kg vs. 0.63 for 3 mg/kg).
Cortical depth-dependent perfusion
Cortical depth-dependent perfusion values were examined in the somatosensory area for determining the feasibility of high-resolution perfusion studies. Cortical layers and sub-regions in the primary somatosensory cortex were defined using the Allen Atlas (Figure 6(a)). Total CBV and CBF peaked at layer 2/3 (L2/3), while microvascular CBV and CBF peaked at layer 4 (L4) for all sub-regions (Figure 6(b)). An average perfusion ratio of combined L2/3 and L4 to L6 is 1.53 and 1.39 for GE- and SE-based measurements, respectively. This indicates that larger-diameter vessels contribute more to the upper cortical layers.
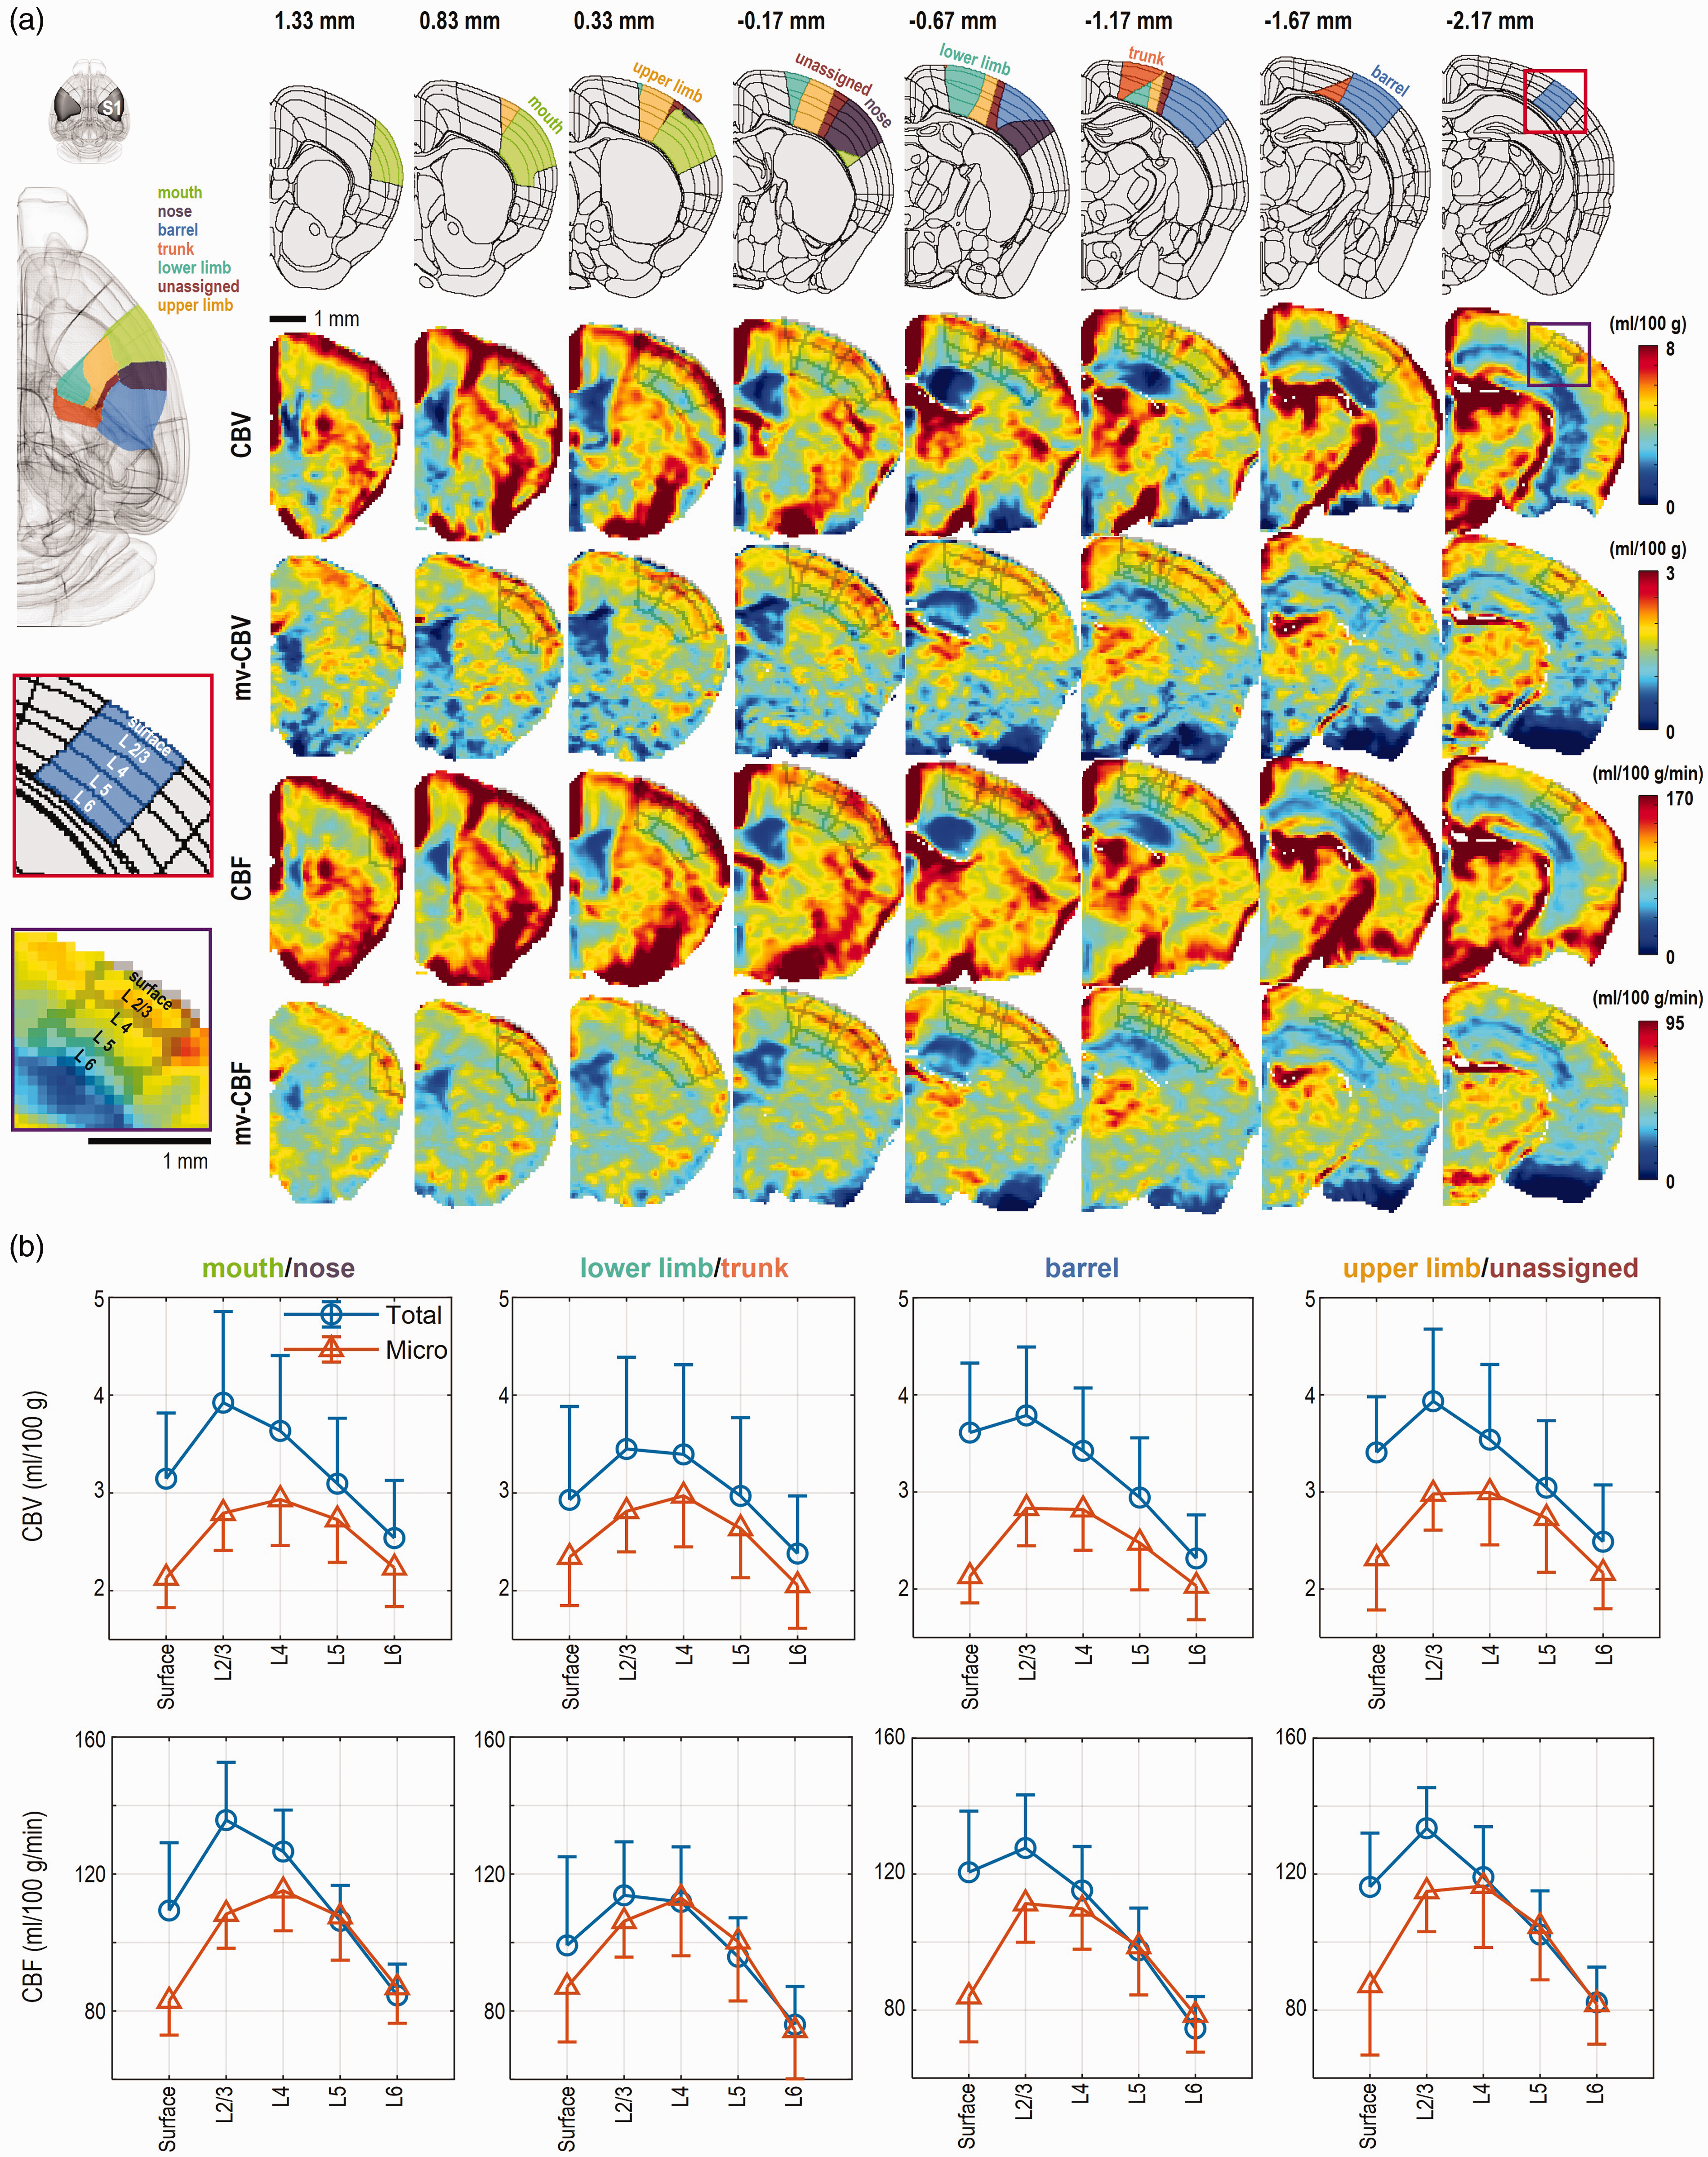
Depth-dependent perfusion values of the mouse somatosensory cortex. (a) Total and microvascular CBV and CBF maps (extracted from Figure 5) were compared in the somatosensory region (see ROI described in top row and left column), which was extensively investigated by somatosensory fMRI. One hemisphere brain atlas covering the somatosensory cortex is shown in a coronal view with anterior-posterior coordinates relative to bregma. Color perfusion maps in the T2-weighted image domain are presented with layer ROIs in the primary somatosensory cortex. Cortical layers and color-coded sub-regions in the primary somatosensory cortex were defined by Allen Atlas: lower limb, upper limb, trunk, nose, mouth, barrel field, and unassigned primary somatosensory area. (b) Total vascular CBV and CBF peaked at layer 2/3 (L2/3), while microvascular CBV and CBF peaked at layer 4 (L4). Note that the nearby sub-regions were combined to enhance the sensitivity for layer-dependent perfusion profiles. Data are represented as mean with one-side error bars (standard deviation).
Discussion
Herein, we presented a non-invasive perfusion MRI technique with dynamic BOLD contrast and short transient anoxia (5 s), allowing us to obtain quantitative CBF and CBV mapping in the entire mouse brain. Since the hypoxic approach utilizes paramagnetic deoxyhemoglobin as an endogenous tracer, it can be easily implemented in small animal studies with a gas switching system. Compared to existing exogenous contrast agent perfusion methods, the hypoxia approach has a more economical, reproducible, and repeatable tracer delivery with a much faster wash-out time. Consequently, whole-brain perfusion measurements can be repeated almost every minute. Since the newly developed perfusion MRI approach does not require any sophisticated pulse sequence, hardware, catheterization or blood gas analysis, it can be readily used to measure quantitative perfusion values and changes induced by drug treatments and vascular reactivity in health and diseases.
Anoxic stimulus and its effects to vascular physiology
The strength and duration of the hypoxic stimulus are important factors for maximizing sensitivity while minimizing physiological side effects. Our strategy was to adopt a strong and short stimulus that is sufficient to generate BOLD contrasts and maintain normal cerebral physiology. An increase in heart rate and respiration rate in response to the 5 s anoxic stimulus is likely due to the activation of peripheral chemoreceptors, which detect changes in arterial blood O2/CO2 and initiate reflexes in cardiorespiratory systems (respiratory rate and heart rate) for maintaining oxygen homeostasis.62–65
Hypoxia dilates the cortical vessels, thereby enhancing the delivery of oxygen to the brain.66,67 Anoxic stimulus duration of 10 s (or longer) violated the assumption that CBV does not change significantly, thus is not recommended. The 5 s anoxic stimulation induced a peak CBV increase of 11% in the mouse cerebral cortex, which can cause an error in absolute perfusion values up to 11%. To reduce hypoxia-induced physiology changes, a mild hypoxic stimulus can be considered. If arterial vessels used for the AIF curve are dilated similarly to cortical vessels, then overestimation would be cancelled out. Therefore, we did not attempt an error correction in our quantification. Nonetheless, the relative CBV and CBF values are well-preserved.
Errors of BOLD-DSC perfusion measurement and its translation to humans
An important issue is accuracy and precision of perfusion values measured by DSC MRI. In the Gd-DSC perfusion community, error sources have been extensively discussed.68–70 Error sources of the proposed BOLD-DSC approach are very similar to those in Gd-DSC (e.g., SNR, temporal resolution, AIF, deconvolution, and additionally hypoxia-induced physiology changes), as both change the magnetic susceptibility in the blood vessels. One simplifying factor in our approach is that the intravascular MRI signal is minimal at ultrahigh fields.
The macrovascular contribution to GE-BOLD-based measurements leads overestimation of perfusion values. As the extravascular dephasing effect in GE BOLD is extensively described in the fMRI field,29,31,71 it is closely dependent on the diameter and orientation of vessels and can extend to voxels proximal to the large vessels. This dephasing effect around large vessels can be refocused by the 180° radiofrequency pulse in SE-BOLD MRI. By combining GE and SE measurements, a weighted vessel size index can be determined, which is highly useful for angiogenesis research. 72
Translation of the BOLD-DSC method to humans should be cautious, even if it has been used in humans with ∼25 s anoxia stimulus at 3 T (inducing −7.9% in the gray matter). 24 The underlying assumption of our BOLD model is that the intravascular contribution is minimal, which is satisfied at ultrahigh fields. When the BOLD-DSC approach is applied at low fields, the dynamic BOLD model should include the intravascular BOLD contribution. 73 In human BOLD-DSC applications, the AIF is delayed and dispersed, unlike a bolus injection of contrast agent, causing additional errors of quantification. Thus, quantification of perfusion in humans is likely complicate.
Regional CBV and CBF values of mouse under ketamine and xylazine anesthesia
Cerebral hemodynamics are sensitive to the mouse strain, age, sex, and anesthetics used. Thus, comparisons with previously reported values should be performed cautiously. Here, we chose quantitative perfusion values obtained from C57BL/6 mice under ketamine/xylazine anesthesia. Quantitative CBF measured with gold-standard C14-iodoantipyrine autoradiography 74 is consistent with our data: 100 ml/100 g/min in the somatosensory cortex (vs. 107 ml/100 g/min in our GE-BOLD data), 121 ml/100 g/min in the thalamus (vs. 123), and 78 ml/100 g/min in the corpus callosum (vs. 56). When CBF was measured with ASL MRI, Zuloaga et al. 9 reported ∼120 ml/100 g/min in the cortex and ∼130 ml/100 g/min in the hippocampus.
Quantitative total CBV and microvascular CBV with <100 μm diameter vessels were measured using micro-computed tomography (CT) by filling the vasculature with a radio-opaque silicon rubber. 75 Average difference between total CBV and microvascular CBV is approximately 30%, but it is as much as 70% in the cortex. In our study, average difference between GE-based total CBV and SE-based microvascular CBV was 20–60% in the cortex, hippocampus, thalamus, and corpus callosum. Total CBV measured using micro-CT was 7.9% (vs. 3.6 ml/100 g in our study) in the cerebral cortex, and 3.7% (vs. 3.7 ml/100 g) in the thalamus, and 3.1% (vs. 1.8 ml/100 g) in the corpus callosum. Since large vessels near the surface of the cortex are not easily visible in GE-EPI images (see Figures 5 and 6), our GE-based CBV in the cortex is apparently similar to microvascular CBV of 4.6% in micro-CT studies. In general, CBV values measured using BOLD DSC with hypoxia agree well with those measured using micro-CT 75 and steady-state MION MRI studies (see Supplementary Figure 7).
Depth-dependent perfusion characteristics in the cortical somatosensory area
In depth-dependent perfusion mapping, the highest microvascular CBF and CBV peaks occurred at L4, while the highest total CBF and CBV peaks occurred at L2/3. This can be explained by the vessel-size-dependent laminar distribution; 76 the total vascular volume showed a peak at the cortical surface due to large pial vessels and decreased with an increase in cortical depth, while the microvascular volume density (diameter <6 µm) was the highest at L4 in the primary sensory area. 76 In the mouse barrel cortex, penetrating arterioles and venules had median diameters of 11 µm and 9 µm, respectively. 77
Limitation and alternatives of BOLD DSC with transient anoxia stimulus
Although the BOLD-DSC approach can be easily implemented, a computer-controlled gas switching system is needed. In our setup, three gases can be mixed as needed, thus CO2 gas can be added for vascular reactivity studies. When volatile anesthesia is used, it is critical to ensure stable or no anesthesia during hypoxic stimulation. Since the short duration without anesthesia may not change perfusion much, 5 s anoxia without anesthesia may be used as a stimulus. In our study, GE- and SE-based perfusion maps were separately obtained. Thus, future studies can use a combination of spin- and gradient-echo EPI (SAGE EPI) proposed by Schmiedeskamp et al.78,79 for obtaining both total and microvascular perfusion metrics simultaneously.
Supplemental Material
sj-pdf-1-jcb-10.1177_0271678X221117008 - Supplemental material for Whole-brain perfusion mapping in mice by dynamic BOLD MRI with transient hypoxia
Supplemental material, sj-pdf-1-jcb-10.1177_0271678X221117008 for Whole-brain perfusion mapping in mice by dynamic BOLD MRI with transient hypoxia by DongKyu Lee, Thuy Thi Le, Geun Ho Im and Seong-Gi Kim in Journal of Cerebral Blood Flow & Metabolism
Footnotes
Funding
The author(s) disclosed receipt of the following financial support for the research, authorship, and/or publication of this article: This work was funded by the Institute for Basic Science in Korea (IBS-R015-D1).
Acknowledgements
The authors acknowledge Mr. Chanhee Lee for his assistance with maintaining the 9.4 T MRI system, and Profs. Kamil Uludag, Fernando Calamante, and Ashley Stokes for helpful discussions.
Authors’ contributions
S-GK, DKL and TTL conceptualized and designed the study. DKL, TTL and GHI performed the data acquisition. DKL and TTL analyzed data. DKL, TTL and S-GK drafted the manuscript. DKL, TTL, GHI and S-GK contributed to the data interpretation and approved the final draft.
Declaration of conflicting interests
The author(s) declared no potential conflicts of interest with respect to the research, authorship, and/or publication of this article.
Supplemental material
Supplemental material for this article is available online.
References
Supplementary Material
Please find the following supplemental material available below.
For Open Access articles published under a Creative Commons License, all supplemental material carries the same license as the article it is associated with.
For non-Open Access articles published, all supplemental material carries a non-exclusive license, and permission requests for re-use of supplemental material or any part of supplemental material shall be sent directly to the copyright owner as specified in the copyright notice associated with the article.