
Abstract
The magnitude of the blood oxygenation level-dependent (BOLD) signal depends on cerebral blood flow (CBF), cerebral blood volume (CBV) and cerebral metabolic rate of oxygen (CMRO2). Thus, it is difficult to separate CMRO2 changes from CBF and CBV changes. To detect the BOLD signal changes induced only by CMRO2 responses without significant evoked CBF and CBV changes, BOLD and CBV functional magnetic resonance imaging (fMRI) responses to visual stimulation were measured under normal and hypotension conditions in isoflurane-anesthetized cats at 4.7T. When the mean arterial blood pressure (MABP) decreased from 89±10 to 50±1 mm Hg (mean±standard deviation, n = 5) by infusion of vasodilator sodium nitroprusside, baseline CBV in the visual cortex increased by 28.4%±8.3%. The neural activity-evoked CBV increase in the visual cortex was 10.8%±3.9% at normal MABP, but was negligible at hypotension. Positive BOLD changes of +1.8%±0.5% (gradient echo time = 25 ms) at normal MABP condition became prolonged negative changes of 1.2%±0.3% at hypotension. The negative BOLD response at hypotension starts approximately 1 sec earlier than positive BOLD response, but similar to CBV change at normal MABP condition. Our finding shows that the negative BOLD signals in an absence of CBV changes are indicative of an increase in CMRO2. The vasodilator-induced hypotension model simplifies the physiological source of the BOLD fMRI signals, providing an insight into spatial and temporal CMRO2 changes.
Keywords
Introduction
Neural activity induces metabolic and hemodynamic responses. Since the metabolic response is possibly a better indicator of neural activity than the hemodynamic responses, it has been of great interest to determine spatiotemporal changes of cerebral metabolic rate of oxygen (CMRO2). Functional magnetic resonance imaging (fMRI) has been used for determining CMRO2 changes (Kim and Ugurbil 1997) because the blood oxygenation level-dependent (BOLD) technique is sensitive to changes in venous oxygenation level (Ogawa et al, 1998). Specifically, the BOLD fMRI signal can be approximately described as α Δy/(1- y)-βΔCBVv; where α and β are constants, Δy is the change in venous oxygenation level (y) caused by the mismatch between cerebral blood flow (CBF) and CMRO2 changes, and ΔCBVv is a change in venous cerebral blood volume (CBV), respectively (Ogawa et al, 1998). It should be noted that the fractional change in oxygen extraction fraction (OEF) is equivalent to -Δy/(1-y). The constants α and β can be calibrated by quantitative measurements of CBF, CBV, and CMRO2 at the baseline condition (Kida et al, 2000), or by measurements of BOLD and CBF responses under hypercapnic conditions that are assumed to generate BOLD signal changes purely through CBF alterations (Davis et al, 1998; Hoge et al, 1999; Kim et al, 1999). The fractional CMRO2 change can be obtained from venous oxygenation level and CBF changes using the Fick's principle, ΔCMRO2/CMRO2 = (1-Δy/(1-y)) × (ΔCBF/CBF + 1). However, the CMRO2 change determined by fMRI studies is widely varied, ranging from almost none (Schwarzbauer and Heinke, 1999; Kastrup et al, 1999) to 0.8 times CBF response (Kida et al, 2000). For example, in the human visual cortex, ratios of CMRO2 to CBF changes were reported to be 0.04 (Kastrup et al, 1999), 0.35 (Davis et al, 1998), and approximately 0.5 (Hoge et al, 1999; Kim et al, 1999). Similarly, ratios of forepaw stimulation-induced CMRO2 to CBF changes in the rat somato-sensory cortex are 0.3 (Mandeville et al, 1999), 0.5 (Liu et al, 2004), and 0.8 (Hyder et al, 2000). These large variations across laboratories are partly due to different biophysical models and calibration procedures chosen. Additionally, since venous CBV cannot be measured easily, and is typically inferred from total CBV, an error in ΔCMRO2/CMRO2 estimation will occur by the uncertainty of venous CBV change (see Kim et al, 1999). Thus, it is necessary to develop an animal model in which the evoked CBF and CBV responses can be minimized without changing metabolic responses and neural activities. In this condition, dynamic changes in OEF responding to CMRO2 increase can be determined directly from BOLD fMRI with high spatial and temporal resolution.
When blood vessels dilate significantly, any further increase in CBF and CBV induced by neural activity is expected to be reduced. At low blood pressure (BP) conditions achieved by infusion of sodium nitroprusside (SNP) as an NO-enhancing vasodilator, baseline CBV increases by 37% at a mean arterial blood pressure (MABP) of 44 mm Hg (Schumann-Bard et al, 2005), while baseline CMRO2 remains unchanged (Schumann-Bard et al, 2005; Pinaud et al, 1989). Also, evoked neural activity and metabolic responses during visual stimulation in the cat visual cortex are maintained when MABP is reduced to ∼45mm Hg (Fukuda et al, 2004). We expect that the metabolic responses in the absence of evoked hemodynamic changes can be obtained under hypotension using the BOLD fMRI technique.
In this study, the BOLD and CBV responses were measured under normal and low BP conditions in isoflurane-anesthetized cats during visual stimulation. Cerebral blood volume changes were measured by injection of a monocrystalline iron oxide nanoparticle (MION). At normal BP, positive BOLD signals and increases in CBV were observed. At low BP induced by infusion of SNP, CBV changes induced by visual stimulation were minimal in the visual cortex, and, consequently, prolonged negative BOLD signal changes indicative of an increase in CMRO2 were detected. It should be noted that prolonged negative BOLD signals without changing CBF/CBV in this study differ from often-observed prolonged negative BOLD signals with decreased CBF and CBV responses (Harel et al, 2002). In our laboratory's companion article (Fukuda et al, 2005), intrinsic optical imaging and neural activities were measured in the cat visual cortex under similar experimental conditions.
Materials and methods
Animal Preparation
All animal procedures were approved from the Institutional Animal Care and Use Committee at the University of Minnesota, and performed within the standards of care set by the local animal care committee. Detailed animal procedures have been reported previously (Duong et al, 2001; Harel et al, 2002; Kim et al, 2000; Zhao et al, 2004). A total of 8 cats, weighing 750 to 1700 g, were initially anesthetized intramuscularly with a ketamine (10 to 25mg/kg) and xylazine (2.5mg/kg) cocktail. The animals were then intubated and mechanically ventilated by a Harvard ventilator (∼25 to 35 strokes/min, 15 to 30 cm3/stroke) with 1.5% to 2.0% isoflurane anesthesia in a 7:3 mixture of N2O:O2. Catheters were surgically placed into the descending aorta via both femoral arteries for BP and blood gas monitoring, and in the right femoral vein for injection of fluid and contrast agent. For blood gas measurements, ∼0.1mL of arterial blood was withdrawn into syringes. Arterial blood paO2, paCO2 and pH were measured using a blood gas analyzer (Radiometer America Inc, Westlake, OH, USA). Before the magnetic resonance (MR) experiments, blood gas paCO2 was adjusted to 28 to 32 mm Hg, and then end-tidal CO2 (EtCO2) was continuously monitored using a capnometer (Ultima, Datex-Ohmeda, Loisiville, CO, USA) to ensure constant EtCO2 levels. Average pH was 7.37±0.05, paCO2 was 30.3±1.4 mm Hg, and paO2 was 199.6±13.9 mm Hg (n = 5 animals used for both BOLD- and CBV-weighted fMRI studies). This physiological condition is considered to be normal in cats (Wei and Kontos, 1982, Mitruka and Eawnsley, 1977). End-tidal CO2 and arterial BP levels were recorded using a multi-trace recorder with a 100 Hz sampling frequency (AcqKnowledge, Biopac Systems, Santa Barbara, CA, USA). The heart rate and systolic and diastolic BP were obtained from arterial BP data. Mean arterial blood pressure was calculated as the sum of 2/3 of the diastolic BP and 1/3 of the systolic BP. A rectal temperature probe was connected to a feedback-controlled water blanket covering the body of animal, which was maintained at 38.0°C±0.5°C. The animal's pupils were dilated with a drop of atropine sulfate solution (Steris Lab, Phoenix, AZ, USA), and the eyes were refracted and focused on the stimulus using corrective contact lenses (Danker Lab, Sarasota, FL, USA). The animal was placed in a custom-designed stereotaxic frame and restrained in a cradle in a normal postural position. During stimulation studies, the isoflurane level was maintained at 1.0% to 1.2%.
Sodium Nitroprusside-Induced Low Blood Pressure
To dilate blood vessels, a vasodilator SNP dehydrate (Abbott Laboratories, IL, USA) was injected intravenously. The SNP was infused at a rate of 0.02 to 2 mg/kg body weight/h using a Harvard programmable infusion pump (model: PHD2000). The infusion rate was dynamically adjusted to maintain an MABP of ∼50mm Hg during ∼30 mins. After SNP infusion was terminated, an MABP recovered to the similar levels before the vasodilator injection.
Visual Stimulation
A binocular 10-secs square-wave black/white moving grating (0.15 cycle/deg, 2 cycle/sec) at a specific orientation was used. During control periods, a stationary grating pattern of identical spatial frequency and orientation was presented. A video projector (Resonance Technology, Northridge, CA, USA; resolution 640 × 480 pixels) was used to project visual stimuli onto a screen positioned ∼15 cm from the animal's eyes. The screen covered approximately 37° of the animal's visual field.
Blood Oxygenation Level-Dependent- and Cerebral Blood Volume-Weighted Functional Magnetic Resonance Imaging
All experiments were performed on a 4.7-T, 40-cm bore MR imaging system (Oxford Magnet; console by Varian Inc., Palo Alto, CA, USA) with a home-built 15-Gauss/cm (11-cm inner diameter (ID)) gradient set. After the animal was placed in the cradle, a surface coil (1.6-cm ID) was positioned on top of its head corresponding approximately to Horsley–Clark AP3. Based on anatomical images obtained using the TurboFLASH technique, a single 2-mm-thick coronal slice perpendicular to the surface of the visual cortex was selected for the fMRI studies (Harel et al, 2002; Zhao et al, 2004).
The single-shot gradient echo-planar imaging (EPI) technique was used for all fMRI studies with field of view = 2 × 2 cm2, matrix size = 64 × 64, and repetition time = 0.5 secs. To achieve the optimal sensitivity of fMRI studies, echo time (TE) was set to 25 ms for BOLD images and 15 ms for CBV images, respectively. The power level of the sinc-shaped RF pulse was adjusted to maximize signal intensity within the visual cortex. A total of 160 images were acquired for each fMRI run (60 images before stimulation, 20 images during stimulation, and 80 images after stimulation). Functional magnetic resonance imaging data acquisition was synchronized with collection of physiological data, including arterial BP and EtCO2 levels.
For CBV-weighted fMRI studies, a bolus of 10 mg/kg dextran-coated MION contrast agent (Weissleder's laboratory at the Massachusetts General Hospital) was injected intravenously with ∼1.5 mL/kg 10% dextran solution. A steady-state condition was reached within 10 mins after injection (data not shown). Since the half-life time of MION in blood is longer than 6 h in cats (Zhao et al, 2003), CBV measurements of 68 to 83 mins (from injection of MION to the end of CBV measurements under low BP condition) were supposed to be performed under similar MION concentration in blood.
The fMRI experiments were ordered as follows: BOLD fMRI at normal BP, at low BP, and after recovery, followed by CBV-weighted fMRI at normal BP, at low BP, and after recovery. Blood oxygenation level-dependent- and CBV-weighted fMRI images were acquired before and after bolus intravenous injection of MION, respectively. To determine changes in basal R*2 induced by MION without stimulation (ΔR*MION), baseline MRI data with a TE of 15 ms were acquired before and after MION injection. For each condition, 15 to 20 fMRI runs were averaged.
Analysis of Functional Magnetic Resonance Imaging Data
A boxcar cross-correlation analysis (Bandettini et al, 1993) was used to generate BOLD and CBV maps using Stimulate software (Strupp, 1996). To have a similar number of active pixels at normal BP condition, the thresholds of cross-correlation coefficient (CCC) were chosen at 0.3 for the BOLD studies and 0.5 for the CBV-weighted fMRI studies. A minimum cluster size of four pixels was imposed (Forman et al, 1995). All comparisons between measurements across animals were carried out by the region-of-interest (ROI) analysis; all activated pixels of the initial BOLD study at normal BP within the parenchyma of visual cortex were selected as an ROI. The same ROI was used to obtain time courses for the BOLD- and CBV-weighted fMRI, regardless of whether the pixels were active under all BP conditions. A linear baseline correction was performed to minimize signal drifts induced by unstable BP levels for all time courses. Region-of-interest-based basal R*2 changes induced by MION without any stimulation (ΔR*MION) were calculated as In(Spre-MION/Spost-MION)/TE, where Spre-MION and Spost-MION are the signal intensities before and after MION injection obtained at TE 15 ms. Stimulation-induced ROI-based R*2 changes in CBV-weighted and BOLD fMRI (ΔR*MION+stim and ΔR*stim, respectively) were calculated as ln(Scont/Sstim)/TE, where Scont and Sstim are the average signal intensities of images acquired during the control period before stimulation and during the stimulation period, respectively. ΔR*MION + stim is related to absolute CBV change as well as to the dose of contrast agent, but it also includes contributions of changes in deoxyhemoglobin (dHb). Relative CBV changes (ΔCBV/CBV) can be obtained by (ΔR*MION + stim-ΔR*stim)/ΔR*MION (Kennan et al, 1998).
To obtain temporal dynamics of BOLD and CBV responses, data with 0.5-sec temporal resolution were linearly interpolated into 0.1-sec resolution. From these interpolated time courses, time-to-peak and time points for 10%, 50%, and 90% of peak signal changes were determined. All data were reported as mean ± standard deviation (s.d.), and all figures were plotted as mean ± standard error of mean (s.e.m.). One-way analysis of variance (ANOVA) with repeated measures was performed on physiological and fMRI parameters; differences were considered to be significant at P<0.01.
Results
Blood Oxygenation Level-Dependent- and Cerebral Blood Volume-Weighted Functional Magnetic Resonance Imaging Without and With the Infusion of Vasodilator
Among eight animals studied with the injection of SNP, one animal was excluded because its BP could not be maintained at a steady state. Two animals were used in only BOLD studies. In the remaining five animals, low BP conditions were achieved at multiple times, allowing both BOLD- and CBV-weighted fMRI studies in the same animal. Infusion of SNP reduced the systolic and diastolic BP, as well as the difference between the systolic and diastolic BP (see Figure 1A and 1B); however, infusion at a constant rate did not result in stable MABP levels. The infusion rate was therefore dynamically adjusted to maintain MABP at ∼50mm Hg. Table 1 summarizes the vascular physiological parameters of the five animals under steady-state conditions when the BOLD- and CBV-weighted fMRI data were acquired. Heart rate did not change significantly. Systolic, diastolic and MABP values were similar at normal BP before the SNP infusion was initiated, and after the infusion ceased in both the BOLD- and CBV-weighted fMRI experiments. These parameters decreased during infusion of SNP (P<0.01) in both experiments. This suggests that the BOLD and CBV measurements were performed under similar physiological conditions, permitting direct comparison between the BOLD and CBV fMRI studies.
Vascular physiological variables (mean±s.d., n = 5)
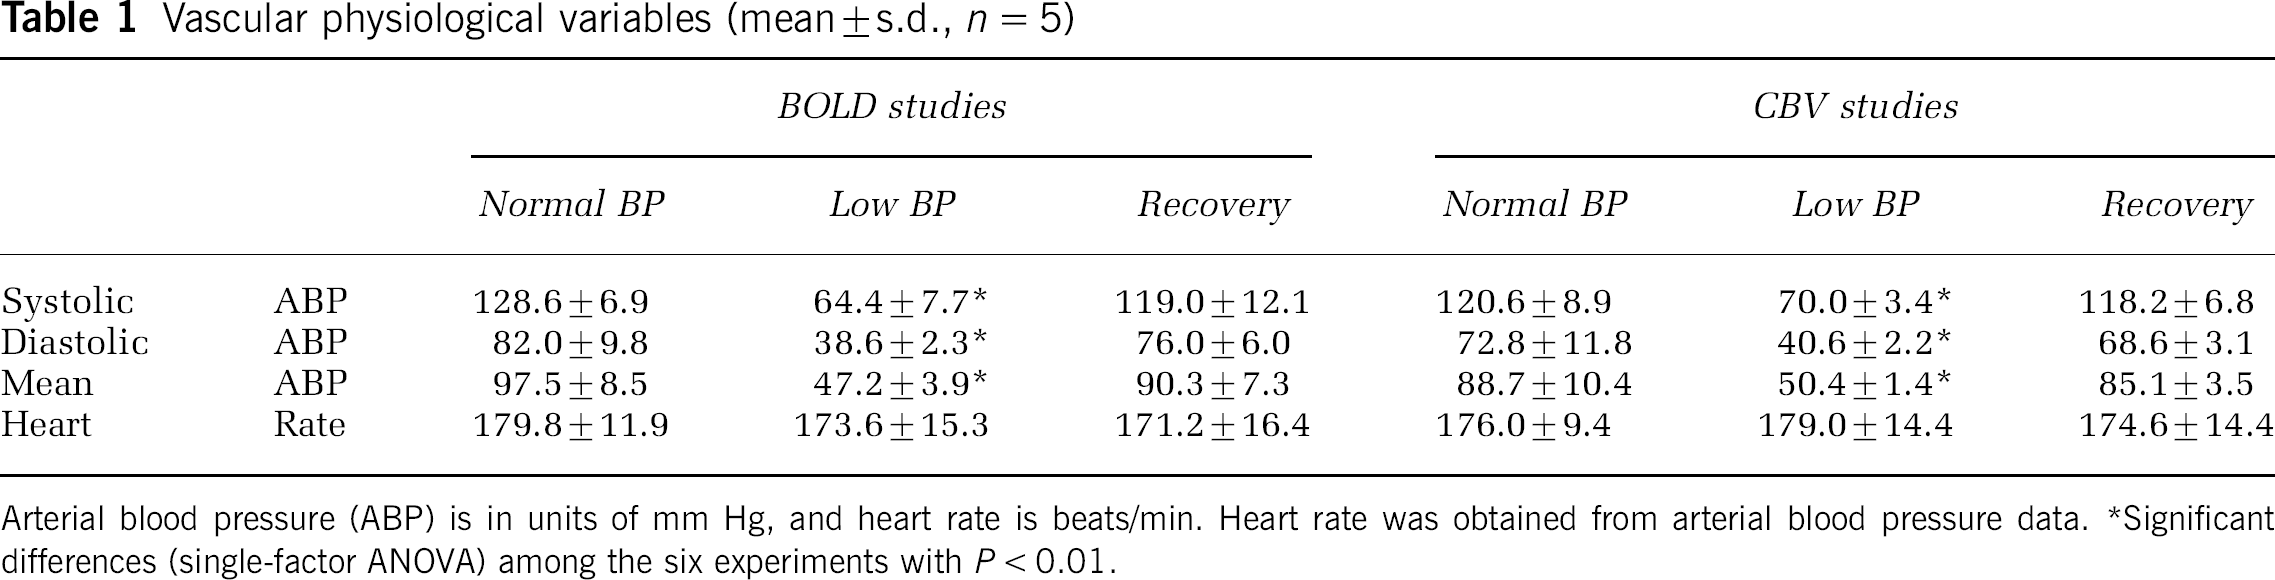
Arterial blood pressure (ABP) is in units of mm Hg, and heart rate is beats/min. Heart rate was obtained from arterial blood pressure data.
Significant differences (single-factor ANOVA) among the six experiments with P < 0.01.
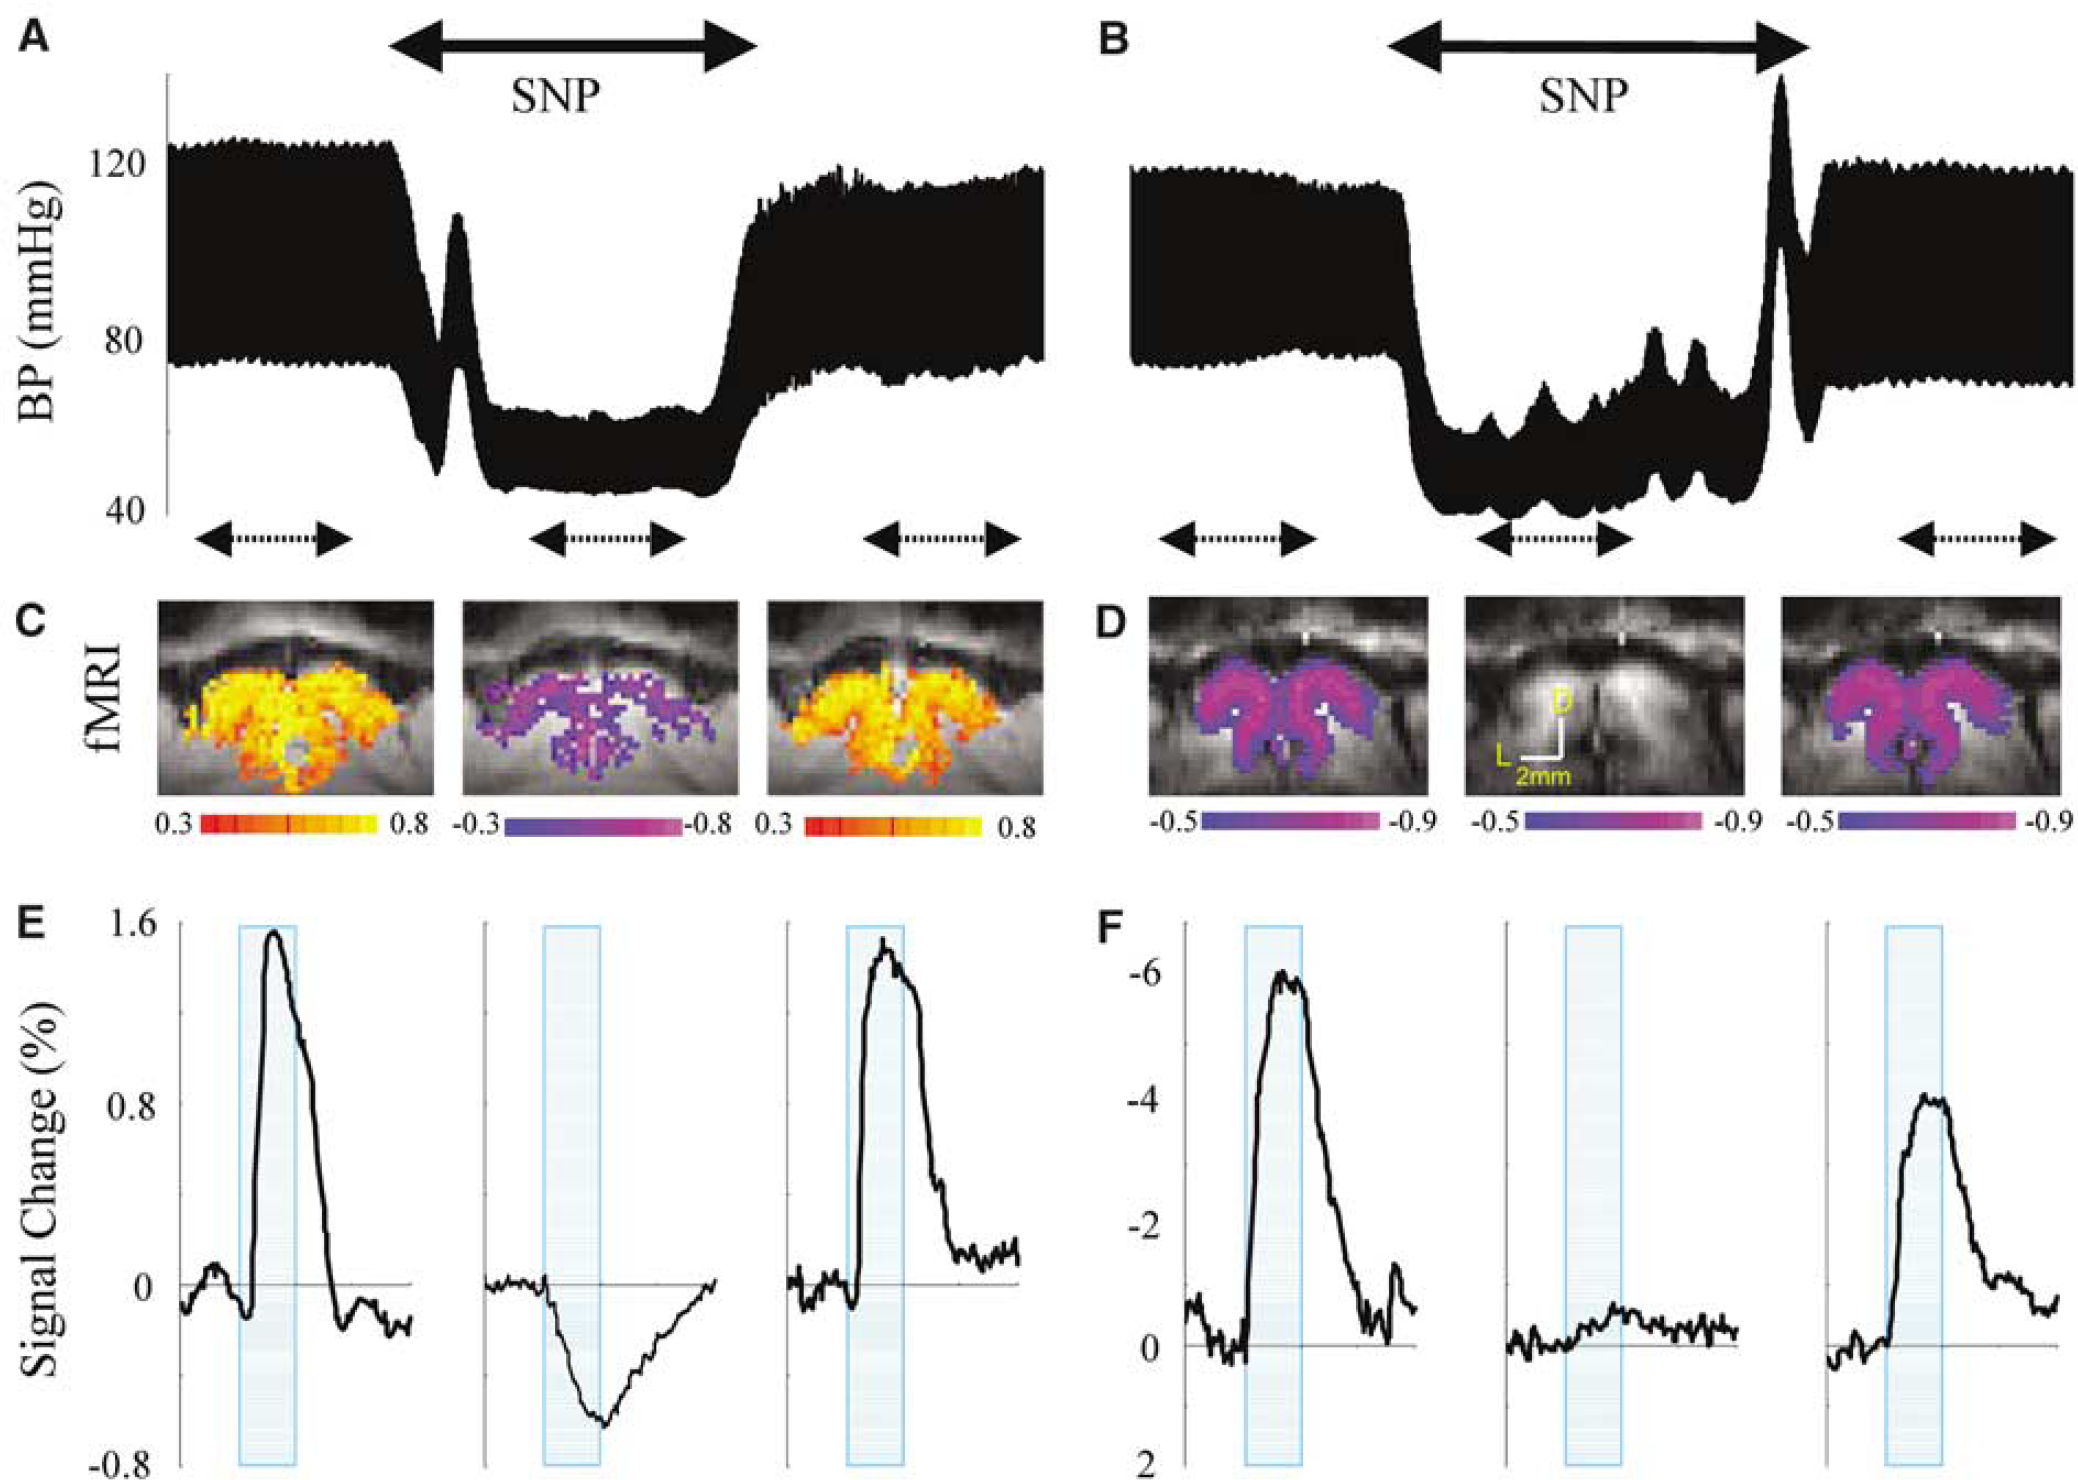
Blood oxygenation level-dependent- and CBV-weighted fMRI responses at normal and low BP conditions. (
The SNP induced an increase in baseline CBV by 28.4%±8.3% (n = 5). Interestingly, baseline BOLD signals had no significant change, which is consistent with previous observation in graded hemorrhagic hypotension (Zaharchuk et al, 1999). The fMRI runs were acquired before, during, and after infusion of SNP, as indicated by the double-arrow dashed lines, before (Figure 1A) and after (Figure 1B) MION injection. Under normal BP conditions before and after SNP infusion, positive BOLD signal changes (Figure 1C) were detected in the visual cortex (red/yellow pixels). These positive signal changes became prolonged negative BOLD signal changes (blue/purple) at low BP. In CBV-weighted fMRI in the same animal (Figure 2D), negative signal changes were observed at normal BP, indicating an increase in CBV. In contrast, at low BP, changes in CBV-weighed fMRI signals were very small, suggesting that functional CBV response was almost eliminated (ca. −5.5% versus −0.5% at normal and low BP, respectively).
Time courses of BOLD and quantitative CBV changes at normal and low BP conditions. Blood oxygenation level-dependent (
After SNP infusion was discontinued, BP recovered to normal levels (see Figures 1A and 1B). In contrast to a quick recovery of BP, functional recovery took > 1 h after termination of SNP in some of the hypotension trials, especially in the second trials during CBV studies. It is thus most appropriate to compare fMRI studies before and during SNP infusion, because the two measurements are close in time.
Changes in Blood Oxygenation Level-Dependent and Cerebral Blood Volume Without and With the Infusion of Vasodilator
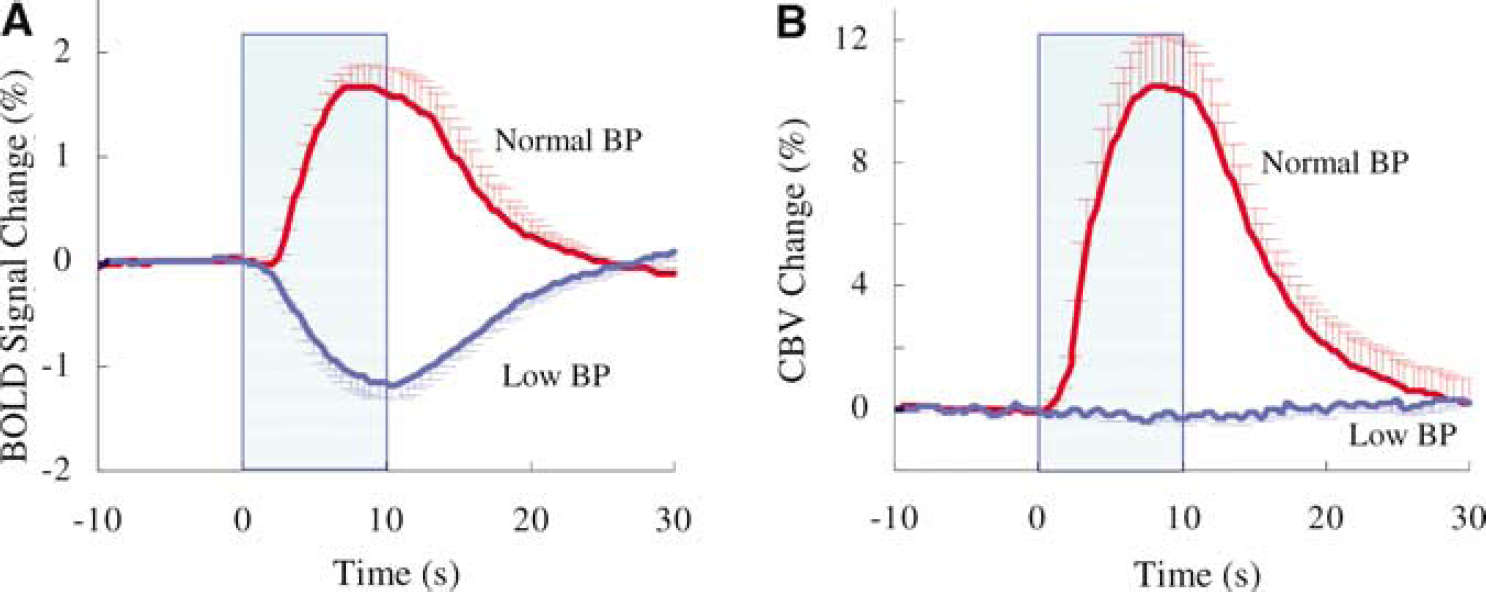
Figure 2 shows averaged time courses, obtained from an ROI of BOLD (A) and quantitative relative CBV changes (B) in five animals before (red) and during (blue) infusion of SNP. Peak amplitude of BOLD signal, CBV and ΔR*2 values are summarized in Table 2. Positive BOLD changes at normal BP became prolonged negative changes at low BP. The relative change in CBV was 10.8% ± 3.9% (n = 5) at normal BP, while it was negligible (0.04% ± 0.42%) at low BP (Figure 2, Table 2). The BOLD and CBV measurements taken together lead to the conclusion that the prolonged negative BOLD signals observed at low BP were due to increased OEF, which indicates a change in CMRO2. The dynamics of OEF changes induced only by CMRO2 increase can be directly obtained from BOLD fMRI time courses at hypotension.
Temporal dynamics, peak changes (%), and baseline signals of BOLD- and CBV-weighted Fmri at normal and low BP conditions (mean±s.d., n = 5)
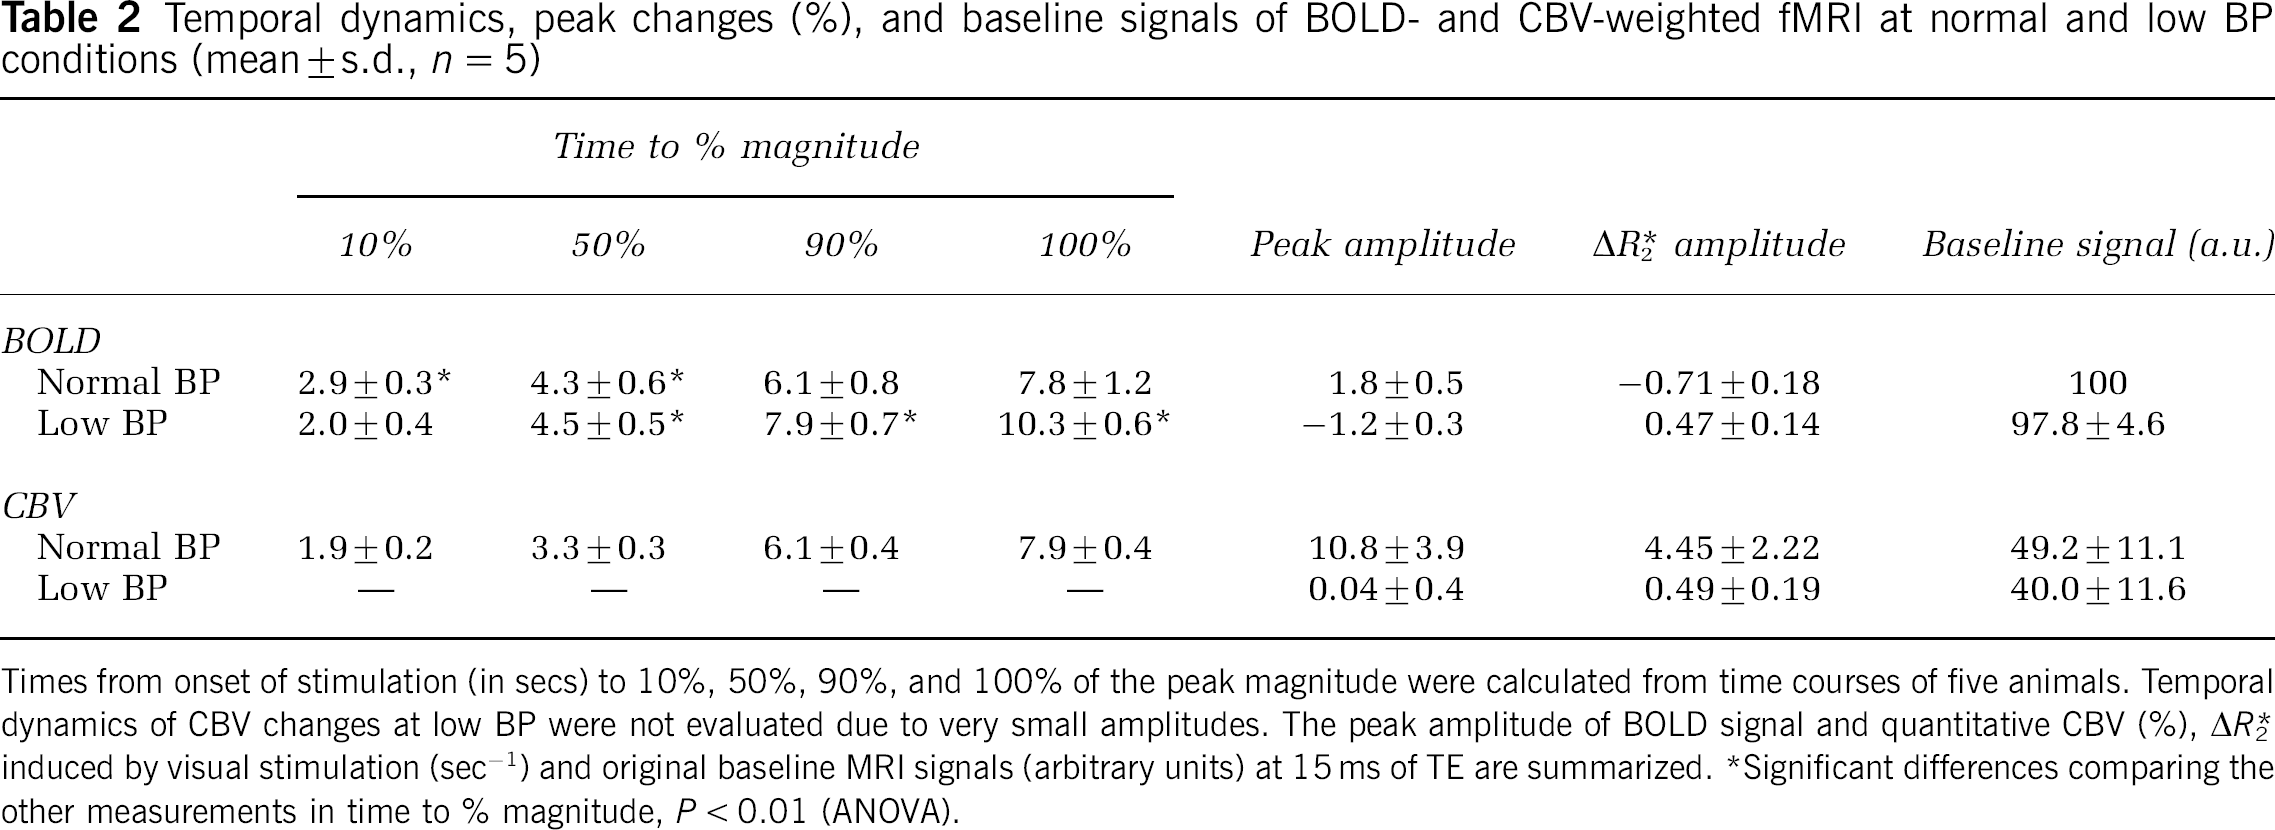
Times from onset of stimulation (in secs) to 10%, 50%, 90%, and 100% of the peak magnitude were calculated from time courses of five animals. Temporal dynamics of CBV changes at low BP were not evaluated due to very small amplitudes. The peak amplitude of BOLD signal and quantitative CBV (%), ΔR*2 induced by visual stimulation (sec−1) and original baseline MRI signals (arbitrary units) at 15 ms of TE are summarized.
Significant differences comparing the other measurements in time to % magnitude, P < 0.01 (ANOVA).
To determine the temporal dynamics of BOLD and CBV changes at normal BP and negative BOLD changes at low BP, the peak amplitude of each measurement was normalized to 1.0. Figure 3 shows the normalized dynamics of the conventional positive BOLD at normal BP (red), prolonged negative BOLD at low BP (blue), and total CBV (green) responses at normal BP. The time to reach 10%, 50%, 90%, and 100% of the peak magnitude is summarized in Table 2. The onset of positive BOLD signals at normal BP was significantly slower than negative BOLD signals at low BP and CBV at normal BP. Prolonged negative BOLD and CBV changes clearly started within 1 sec after the onset of stimulation (Figures 2 and 3).
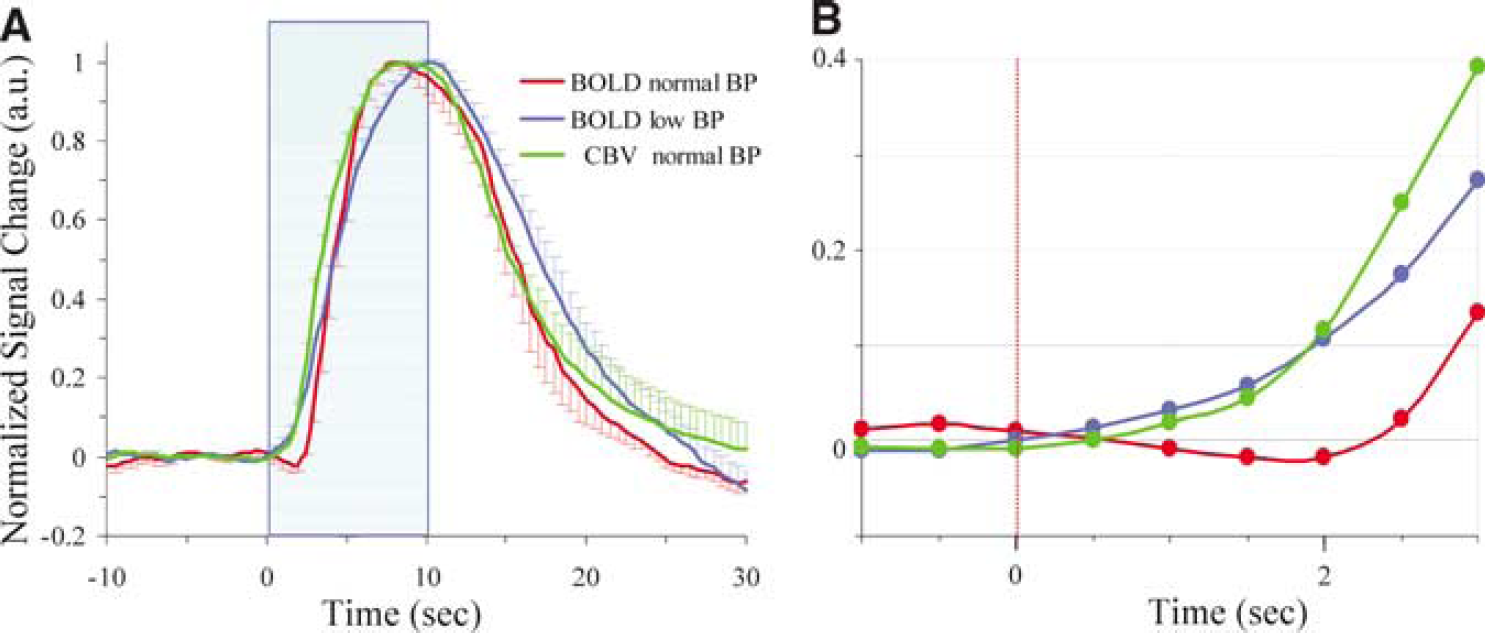
Temporal dynamics of positive BOLD, negative BOLD, and CBV changes of tissue. Peak amplitude for each measurement and subject was normalized to 1.0. Normalized time courses of individual animal were averaged. (
Discussion
Our results provided two main findings. First, a vasodilator-induced hypotension (low BP) animal model was developed to minimize the hemodynamic responses induced by visual stimulation. Second, under hypotensive conditions, there was a prolonged negative BOLD response during visual stimulation. This showed that the negative BOLD signal at low BP is mainly due to an increase in oxygen consumption.
A Vasodilator-Induced Hypotension Functional Magnetic Resonance Imaging Model
Under normal conditions, CBF is maintained at a relatively constant level by the adjustment of vessel diameters within a fairly broad range of arterial BP, referred to as CBF autoregulation (Lassen 1959; Sato et al, 1984). In hemorrhagic hemodilution models, CBF starts to decrease at an MABP of ∼60mm Hg. However, in drug-infused hypotension models CBF remains relatively constant down to ∼40mm Hg partly because the hematocrit level is not altered (Fitch et al, 1976; Kontos et al, 1978).
Sodium nitroprusside is widely used clinically to reduce BP, and is known to maintain cerebral oxidative metabolism (Endrich et al, 1987; Pinaud et al, 1989; Schumann-Bard et al, 2005; Grubb and Raichle, 1982) as well as extracellular fluid proton (H +), potassium (K +) ions (Morris et al, 1983), and low toxicity (McDowall et al, 1974). In experimental hypotension conditions induced by SNP with a MABP of ∼50mm Hg, such as those reported here, baseline CBV is increased by ∼30%, which is consistent with previous findings (Kontos et al, 1978; Schumann-Bard et al, 2005). Furthermore, it has also been shown that during SNP-induced hypotension baseline CBF is maintained (Pinaud et al, 1989), slightly decreased, or increased (Schumann-Bard et al, 2005) depending on the level of MABP, type of anesthetics, and depth of anesthesia. It was also reported that SNP-induced hypotension with a MABP of ∼40mm Hg does not alter CMRO2 (Schumann et al, 1998, 2005). At our experimental conditions, baseline CBF and CMRO2 (not measured) might be changed, potentially modifying oxygen tensions in capillary and tissue compartments. When MABP is reduced below the lower limit of the auto-regulated range, evoked neural activity might be reduced due to hypotension-induced hypoxia. However, at SNP-induced hypotension with an MABP of ∼45mm Hg, the magnitude of spiking activities and orientation selectivity of neurons in cat visual orientation columns are preserved (Fukuda et al, 2004, 2005), suggesting the sufficient availability of local oxygen transport in tissue. Furthermore, an increase in orientation-selective deoxyhemoglobin contents measured by intrinsic optical imaging is maintained at SNP-induced hypotension (Fukuda et al, 2005), implying that CMRO2 responses are intact in our experimental conditions.
At SNP-induced hypotension conditions, negative BOLD fMRI signals without evoked CBV response during visual stimulation can occur by either an increase in evoked CMRO2, and/or by an unlikely but theoretically possible decrease in evoked CBF. In our preliminary studies, we measured evoked CBF responses at similar hypotension condition using a laser Doppler flowmeter and found that the evoked CBF changes were negligible (data not shown). Thus, we can conclude that the negative BOLD response without concomitant CBV/CBF changes indicates an increase in CMRO2; consequently, this model allows direct measurement of dynamic OEF changes resulting from metabolic responses.
Dynamic Responses of Blood Oxygenation Level-Dependent, Cerebral Metabolic Rate of Oxygen and Cerebral Blood Volume
At a low BP condition, the observed negative BOLD signal without evoked CBV response is a direct index of OEF changes induced by CMRO2 increases. Here, we assumed that the signals originate from capillaries and small venules, not from large draining veins. Since an arteriovenous transit time of blood was reported to be 0.8 secs (Cox et al, 1993), BOLD signals within the parenchyma ROI at low BP are not convoluted by ‘slow’ vascular drainage effects, and represent dynamic OEF changes. Even though the OEF change can be obtained, dynamic, quantitative CMRO2 changes cannot be determined because oxygen transport across blood and tissue compartments, volumes of compartments, and pO2 of each compartment are unknown.
Cerebral blood volume at normal BP and negative BOLD changes at low BP condition started right after the onset of stimulation, and reached a 10% of maximum-time point within 2 secs, suggesting that initial dynamics in CBV and OEF by metabolism are similar. However, caution should be taken when comparing the dynamics of CBV and BOLD responses because of potentially different anatomical sources; early CBV response occurs mostly in arterial blood vessels (Lee et al, 2001; Woolsey et al, 1996; Vanzetta et al, 2005), while the BOLD response is detected at venous blood vessels. Without knowing the transit time of blood in capillaries, it is difficult to directly compare two different physiological parameters.
The positive BOLD signal at normal condition starts slower than the negative BOLD response at low BP and peaks earlier. Since the dynamics of BOLD is determined by CMRO2 and CBF changes, our BOLD dynamics can be explained if the CBF response starts slower than OEF change by CMRO2 and peaks faster. According to earlier dynamic CBF-weighted fMRI (Kim and Duong, 2002) and laser Doppler flow measurements (Malonek et al, 1997) in the cat visual cortex, the CBF response occurs approximately 2 secs after the stimulation onset. This can explain the slow start of the positive BOLD change.
In our BOLD study at normal BP condition, the early negative dip was extremely small. However, at the low BP condition with minimal CBV response, the prolonged negative BOLD signal (‘prolonged dip’) was detected. This indicates that phase and magnitude of the BOLD signals are closely related to animal physiology such as paCO2 and basal BP levels (Cohen et al, 2002; Harel et al, 2002; Kim and Duong, 2002; Martin et al, 2000). The major difference between the current and previous studies (Duong et al, 2000; Kim et al, 2000) is the use of different EtCO2 levels (approximately 28 to 32 versus 35 to 40 mm Hg). Physiological parameters in the previous studies (Kim et al, 2000; Duong et al, 2000) were optimized to enhance the initial dip, while those in the current study were set to a paCO2 level of ∼30 mm Hg, which is normal in awake cats (Wei and Kontos, 1982, Mitruka and Eawnsley, 1977) (see discussion and Figure 4 in Harel et al, 2002). Since the BOLD signals only induced by metabolic responses can be detected at low BP conditions, its spatial specificity is potentially improved to neuronally active sites. However, due to a limited spatial resolution, the spatial specificity of the dip was not investigated here. Thus, it is important to further investigate spatiotemporal responses of the prolonged BOLD dip.
Estimation of Cerebral Metabolic Rate of Oxygen at Steady-State Condition
Under steady-state conditions, the ΔCMRO2/CMRO2 induced by neural activity might be determined from positive BOLD at normal BP and negative BOLD at low BP. For this, we assume that baseline OEF is same at normal and low BP conditions, and that baseline and stimulation-induced CBV changes are predominant at arterial vessels (Endrich et al, 1987; Lee et al, 2001; Ito et al, 2005). Since it is assumed that a change in venous CBV is minimal, a change in venous oxygenation level Δy/(1-y) can be obtained from BOLD signals: BOLD change = α Δy/(1-y). At low BP conditions, the BOLD signal is −1.2% without significant CBF responses. Using the Fick's equation ΔCMRO2/CMRO2 = (1-Δy/(1-y)) × (ΔCBF/CBF + 1)-1, ΔCMRO2/CMRO2 is found to be 1.2α*, where α* is 1/α. We further assume that visual stimulation-induced ΔCMRO2/CMRO2 is same at low and normal BP conditions.
Under normal BP conditions, the positive BOLD signal of 1.8% is related to an increase in venous oxygenation level induced by the mismatch between CBF and CMRO2 changes; Δy/(1-y) is 1.8α*. Since the CBV induced by visual stimulation is 10.8% at normal BP, the fractional change in CBF is expected to be ∼31% according to the relationship between CBF and CBV (Grubb et al, 1974; Lee et al, 2001). By inserting ΔCMRO2/CMRO2 of 1.2α* (this assumes that the CMRO2 contribution to the BOLD signal is the same under normal BP conditions as under low BP conditions), Δy/(1-y) of 1.8α*, and ΔCBF/CBF of 0.31 into the Fick's equation (Grubb et al, 1974), the constant α* of 0.087 is determined and consequently ΔMRO2/CMRO2 is estimated to be 10%. However, since ΔCMRO2/CMRO2 is sensitive to ΔCBF/CBF (which was not measured here), the ratio ΔCMRO2/CMRO2 to ΔCBF/CBF was calculated; the ratio of ∼0.3 agrees reasonably well with that observed in the human visual cortex (Davis et al, 1998; Hoge et al, 1999; Kim et al, 1999). Our indirect CMRO2 determination relies on many unknown assumptions aforementioned; further studies are required, including measurements of baseline and evoked tissue oxygen tensions and CBF at normal and low BP conditions.
Conclusions
We developed an animal model to isolate metabolic responses from hemodynamic responses during neuronal stimulation. Under SNP-induced hypotensive conditions, the conventional positive BOLD responses became a prolonged negative response due to a suppressed hemodynamic change during visual stimulation. Accordingly, we concluded that the negative BOLD signals under hypotension were indicative of the dynamics of OEF changes induced by CMRO2 increase. Changes in oxygen consumption induced by neural activity were significant. Our data showed that the magnitude and time-to-peak of the BOLD signal are closely dependent on the dynamics of blood flow and oxygen consumption changes. The hypotension animal model may provide an insight into how metabolic response induced by neural activities occurs in space and time.
Footnotes
Acknowledgements
SG Kim thanks Drs C Iadecola, I Kanno, O Paulson, and L Sokoloff for a helpful discussion of low blood pressure conditions.