
Abstract
After its discovery in 1990, blood oxygenation level-dependent (BOLD) contrast in functional magnetic resonance imaging (fMRI) has been widely used to map brain activation in humans and animals. Since fMRI relies on signal changes induced by neural activity, its signal source can be complex and is also dependent on imaging parameters and techniques. In this review, we identify and describe the origins of BOLD fMRI signals, including the topics of (1) effects of spin density, volume fraction, inflow, perfusion, and susceptibility as potential contributors to BOLD fMRI, (2) intravascular and extravascular contributions to conventional gradient-echo and spin-echo BOLD fMRI, (3) spatial specificity of hemodynamic-based fMRI related to vascular architecture and intrinsic hemodynamic responses, (4) BOLD signal contributions from functional changes in cerebral blood flow (CBF), cerebral blood volume (CBV), and cerebral metabolic rate of O2 utilization (CMRO2), (5) dynamic responses of BOLD, CBF, CMRO2, and arterial and venous CBV, (6) potential sources of initial BOLD dips, poststimulus BOLD undershoots, and prolonged negative BOLD fMRI signals, (7) dependence of stimulus-evoked BOLD signals on baseline physiology, and (8) basis of resting-state BOLD fluctuations. These discussions are highly relevant to interpreting BOLD fMRI signals as physiological means.
Introduction
In 1990, Ogawa and colleagues at AT&T Bell Laboratories studied responses to global physiological stimulus in rat brains at 7 T and reported that functional brain mapping was possible using venous blood oxygenation level-dependent (BOLD) magnetic resonance imaging (MRI) contrast (Ogawa et al, 1990a, 1990b; Ogawa and Lee, 1990). This BOLD contrast relies on changes in deoxyhemoglobin, which acts as an endogenous paramagnetic contrast agent (Pauling and Coryell 1936). Therefore, changes in the local deoxyhemoglobin concentration in the brain lead to alterations in MRI signal intensity (Thulborn et al, 1982; Ogawa et al, 1990a, 1990b; Ogawa and Lee, 1990). Application of BOLD contrast to human functional brain mapping soon followed (Bandettini et al, 1992; Kwong et al, 1992; Ogawa et al, 1992). In recent years, functional MRI (fMRI) has been the tool of choice to visualize neural activity in the human brain, with >3,000 papers with the keyword ‘fMRI’ published annually. Thus, it is critical to understand the origins of BOLD fMRI responses.
Figure 1 depicts the components on cellular (Figure 1A) and vascular (Figure 1B) levels affected by neural activity induced by task execution or stimulus exposure, which give rise to BOLD fMRI signals (Figure 1C). Neural activity can be broadly classified by local field potentials (LFPs) and spiking activity; LFP is generally believed to represent synaptic activity including neural input, while spiking activity in cell bodies represents suprathreshold neural output. Increased neural activity is accompanied by an increased flux of Na+, K+, and Ca+2, and increased ATP production via glucose consumption. These changes induce astrocytes (yellow in Figure 1A) and neuronal cells (round green regions in Figure 1A) to send vasoactive signals into nearby arterioles and capillaries (dark bands in Figure 1A), consequently dilating the upstream arterial vessels. The exact signaling mechanism remains an area of intense research, with excellent review articles available (Attwell et al, 2010; Petzold and Murthy, 2011), as this tight neurovascular coupling is a key to understanding vascular-based fMRI approaches. Also relevant (and as yet undetermined) are the contributions of neuronal versus astrocyte signaling, the contributions of excitatory versus inhibitatory neurotransmission, and the spatial extent and dynamic properties of neural versus vascular responses.
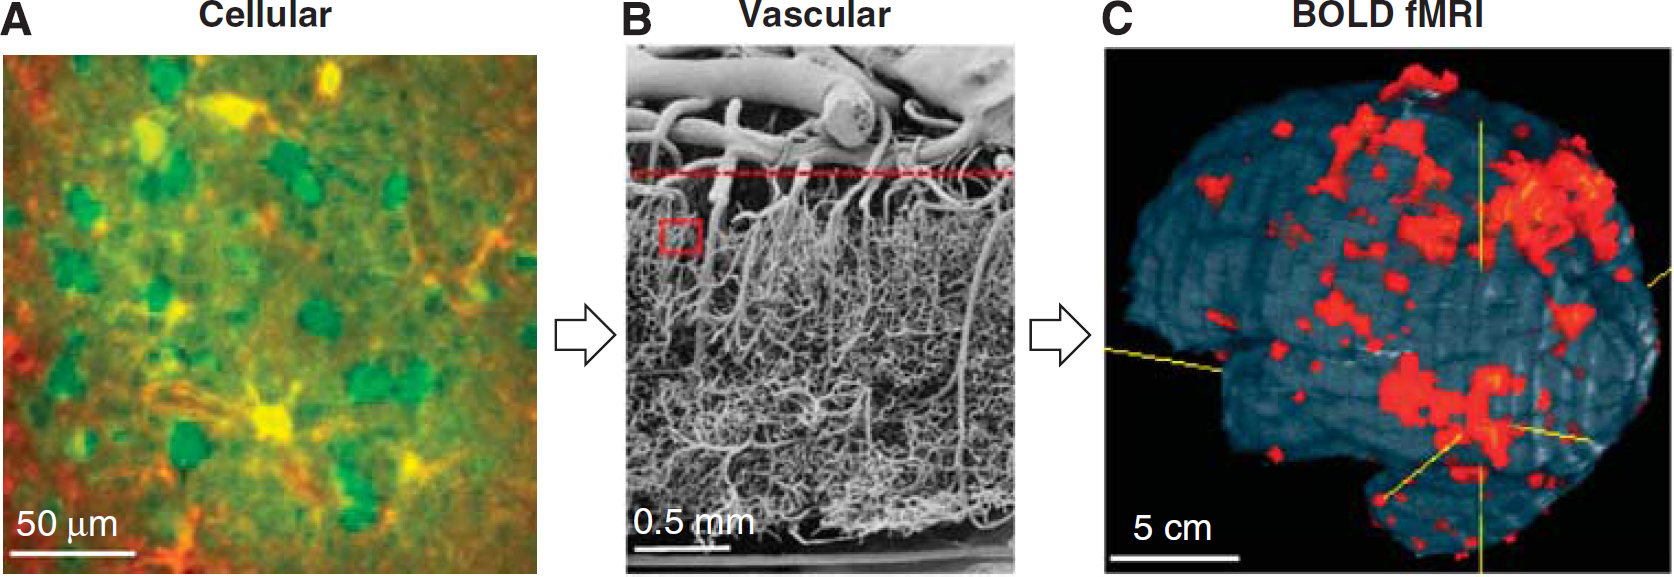
Relationship between neurovascular components and BOLD fMRI. (
A focal increase in cerebral blood flow (CBF) can be considered to directly relate to neuronal activity because glucose metabolism and CBF changes are closely coupled (Raichle, 1987). However, based on the positron emission tomographic measurements of CBF and cerebral metabolic rate of oxygen utilization (CMRO2) in humans during somatosensory and visual stimulation (Fox and Raichle, 1986; Fox et al, 1988), the increase in CBF surpasses the increase in CMRO2, resulting in an
In this article, we will focus on the biophysical and physiological sources of BOLD fMRI signals and discuss what is currently known about stimulus-evoked vascular changes. Since BOLD fMRI measures signal changes induced by neural activity, we will evaluate the contribution of various fMRI signal components. We will also discuss nonBOLD fMRI approaches that are sensitive to changes in single parameters such as perfusion or blood volume. Topics also reviewed are the spatial specificity of BOLD fMRI, physiological sources of stimulus-evoked fMRI responses, and resting-state fMRI. Since the BOLD fMRI field is now >20 years old, many excellent review articles are available on human applications and neurophysiology (e.g., Logothetis, 2008; van Eijsden et al, 2009; Glover, 2011). Our review will therefore focus instead on findings based primarily on our animal studies, which afford the systematic assessment of physiological sources and the combination of fMRI with invasive approaches. Topics discussed here, however, should also be relevant to human fMRI studies.
Vascular architecture relevant to hemodynamic-based functional magnetic resonance imaging
Since hemodynamic-based fMRI signals originate from vessels, understanding the vascular structure is highly important. Thus, we review what is known about vascular structure and density within human cortex, based on an influential paper by Duvernoy (Duvernoy et al, 1981). Vessels can be broadly classified as either pial or intracortical (see vessels above and below the dashed red horizontal line in Figure 1B, respectively). Pial vessels are larger and less dense than intracortical vessels, and connect to penetrating arteries and emerging veins. Intracortical vessels can be subdivided into arteries, veins, and the capillary network. Capillaries with ∼5
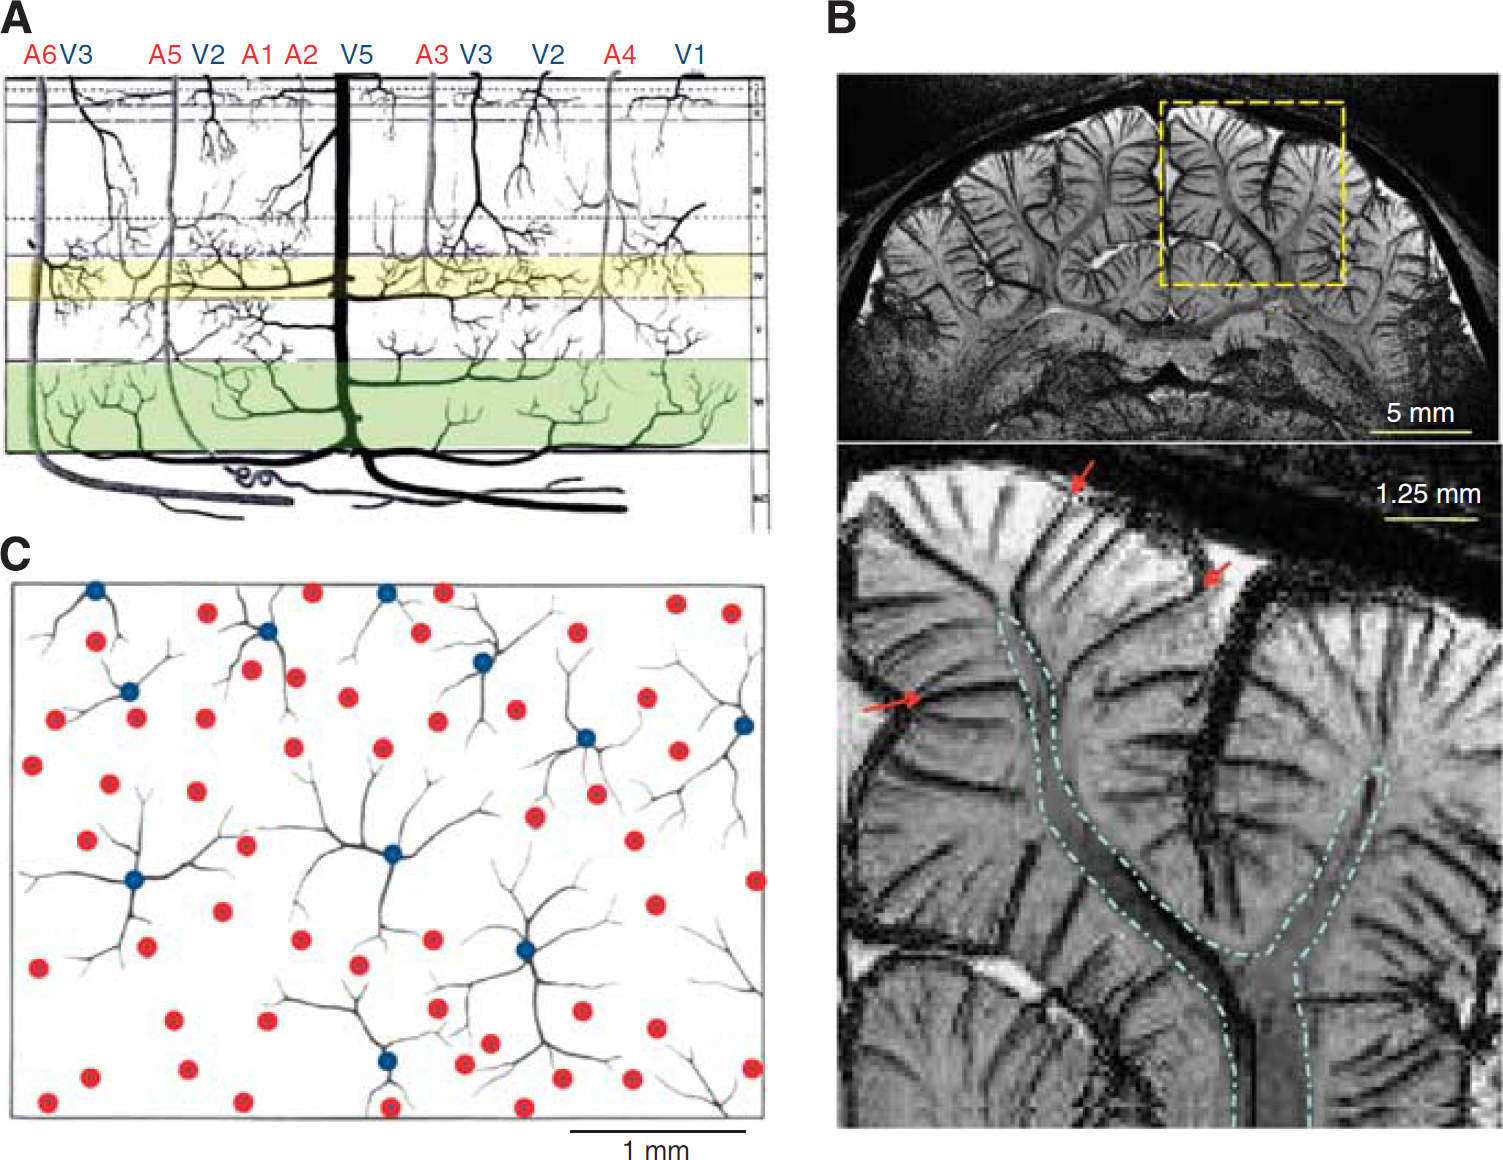
Vascular architecture relevant to hemodynamic-based fMRI. (
Contribution of physiological parameters to baseline magnetic resonance imaging signals
Examining individual contributions to MRI signals is an important step toward understanding BOLD fMRI mechanisms. Pixel sizes in typical fMRI studies are a few millimeters; each pixel may therefore include blood, extravascular tissue, and cerebrospinal fluid (CSF) components. Since arterial blood and venous blood have different
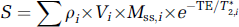
where subscripts,
Water Proton Spin Density (ρ ) and Volume Fractions (V )
Water proton spin density is directly related to a water content, which is 0.88 g/mL for extravascular tissue (obtained from the gray matter value in Table 1 in Herscovitch and Raichle, 1985) and 0.87 g/mL for arterial and venous blood with a hematocrit level of 35% (see further details in Table 2 in Herscovitch and Raichle, 1985). Arterial and venous blood compartment values for
Inflow and Cerebral Blood Flow (T 1∗)
Inflow and CBF can act to decrease the
Blood Oxygenation Level-Dependent Relaxation Parameters (T 2 and T 2∗)
The field gradient generated by deoxyhemoglobin decreases by (
Non-blood oxygenation level-dependent contribution to functional magnetic resonance imaging signals
The relative contributions from spin density/volume fraction, inflow/CBF (
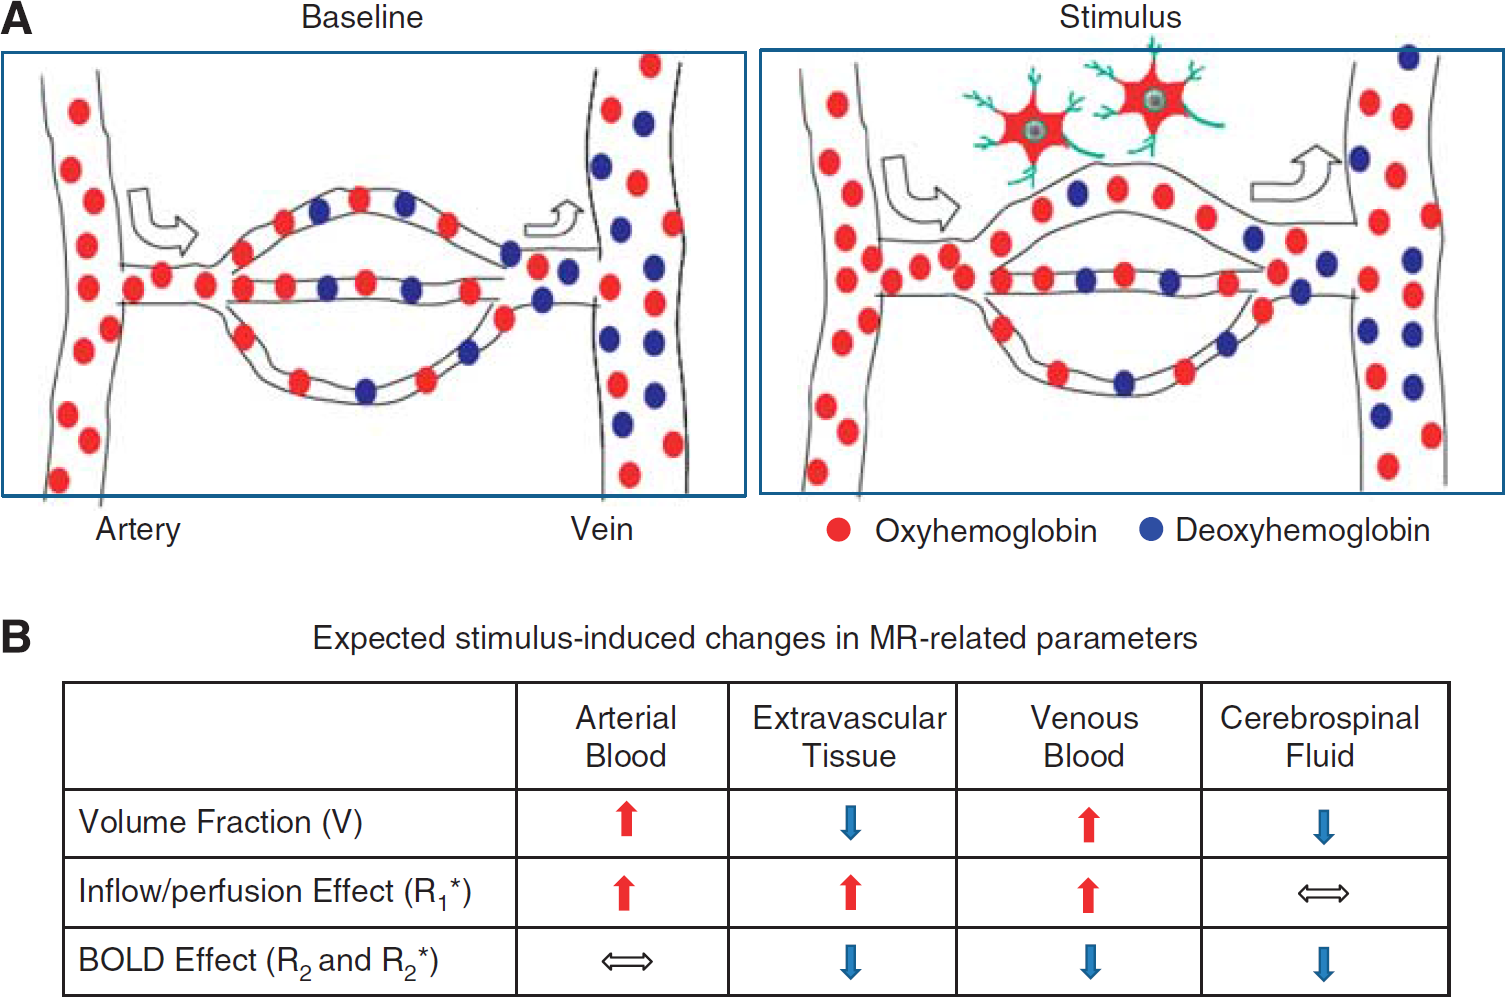
Vascular responses to neural activity and expected changes to MR-related parameters. (
Effect of Water Proton Spin Density (ρ ) and Volume Fractions (V )
Stimulus-induced dilation of vessels increases CBV, thus increasing the volume fractions of arterial and venous blood. Under the constraint of constant intracranial brain volume dictated by the Monro–Kellie doctrine, there must be a corresponding reduction of the volume fractions of extravascular tissue and CSF. Indeed, the vascular space occupancy technique (Lu et al, 2003) showed that increases in CBV reduce the tissue volume fraction in pixels without CSF. Cortical surface boundaries may then expand, reducing the CSF volume fraction (Jin and Kim, 2010).
In fMRI studies, it may be not possible to separate changes in
Effect of Inflow and Cerebral Blood Flow (T 1∗)
Stimulus-induced increases in blood velocity/inflow in pixels containing large vessels act to reduce blood
Blood oxygenation level-dependent contributions to gradient-echo and spin-echo functional magnetic resonance imaging signals
To understand the biophysical basis of BOLD-based fMRI, it is important to examine intravascular and extravascular contributions to the BOLD signal. Note that more complete BOLD modeling of intravascular and extravascular contributions has been reported recently (Uludag et al, 2009; Griffeth and Buxton, 2011), which is beyond the scope of this review.
Intravascular Blood Oxygenation Level-Dependent Components
The intravascular BOLD signal almost linearly increases when TE<blood T2 for SE studies or TE<blood T2∗ for GE studies becomes maximal at TE=
Extravascular Blood Oxygenation Level-Dependent Components
During the TE typically chosen for fMRI studies (∼50 ms), water molecules diffuse 10 to 20
Separation of Intravascular and Extravascular Blood Oxygenation Level-Dependent Components
The relative contribution of intravascular versus extravascular signals to BOLD fMRI responses can be examined using small diffusion gradients (e.g.,
Summary of intravascular attenuation by diffusion gradients in BOLD studiesa
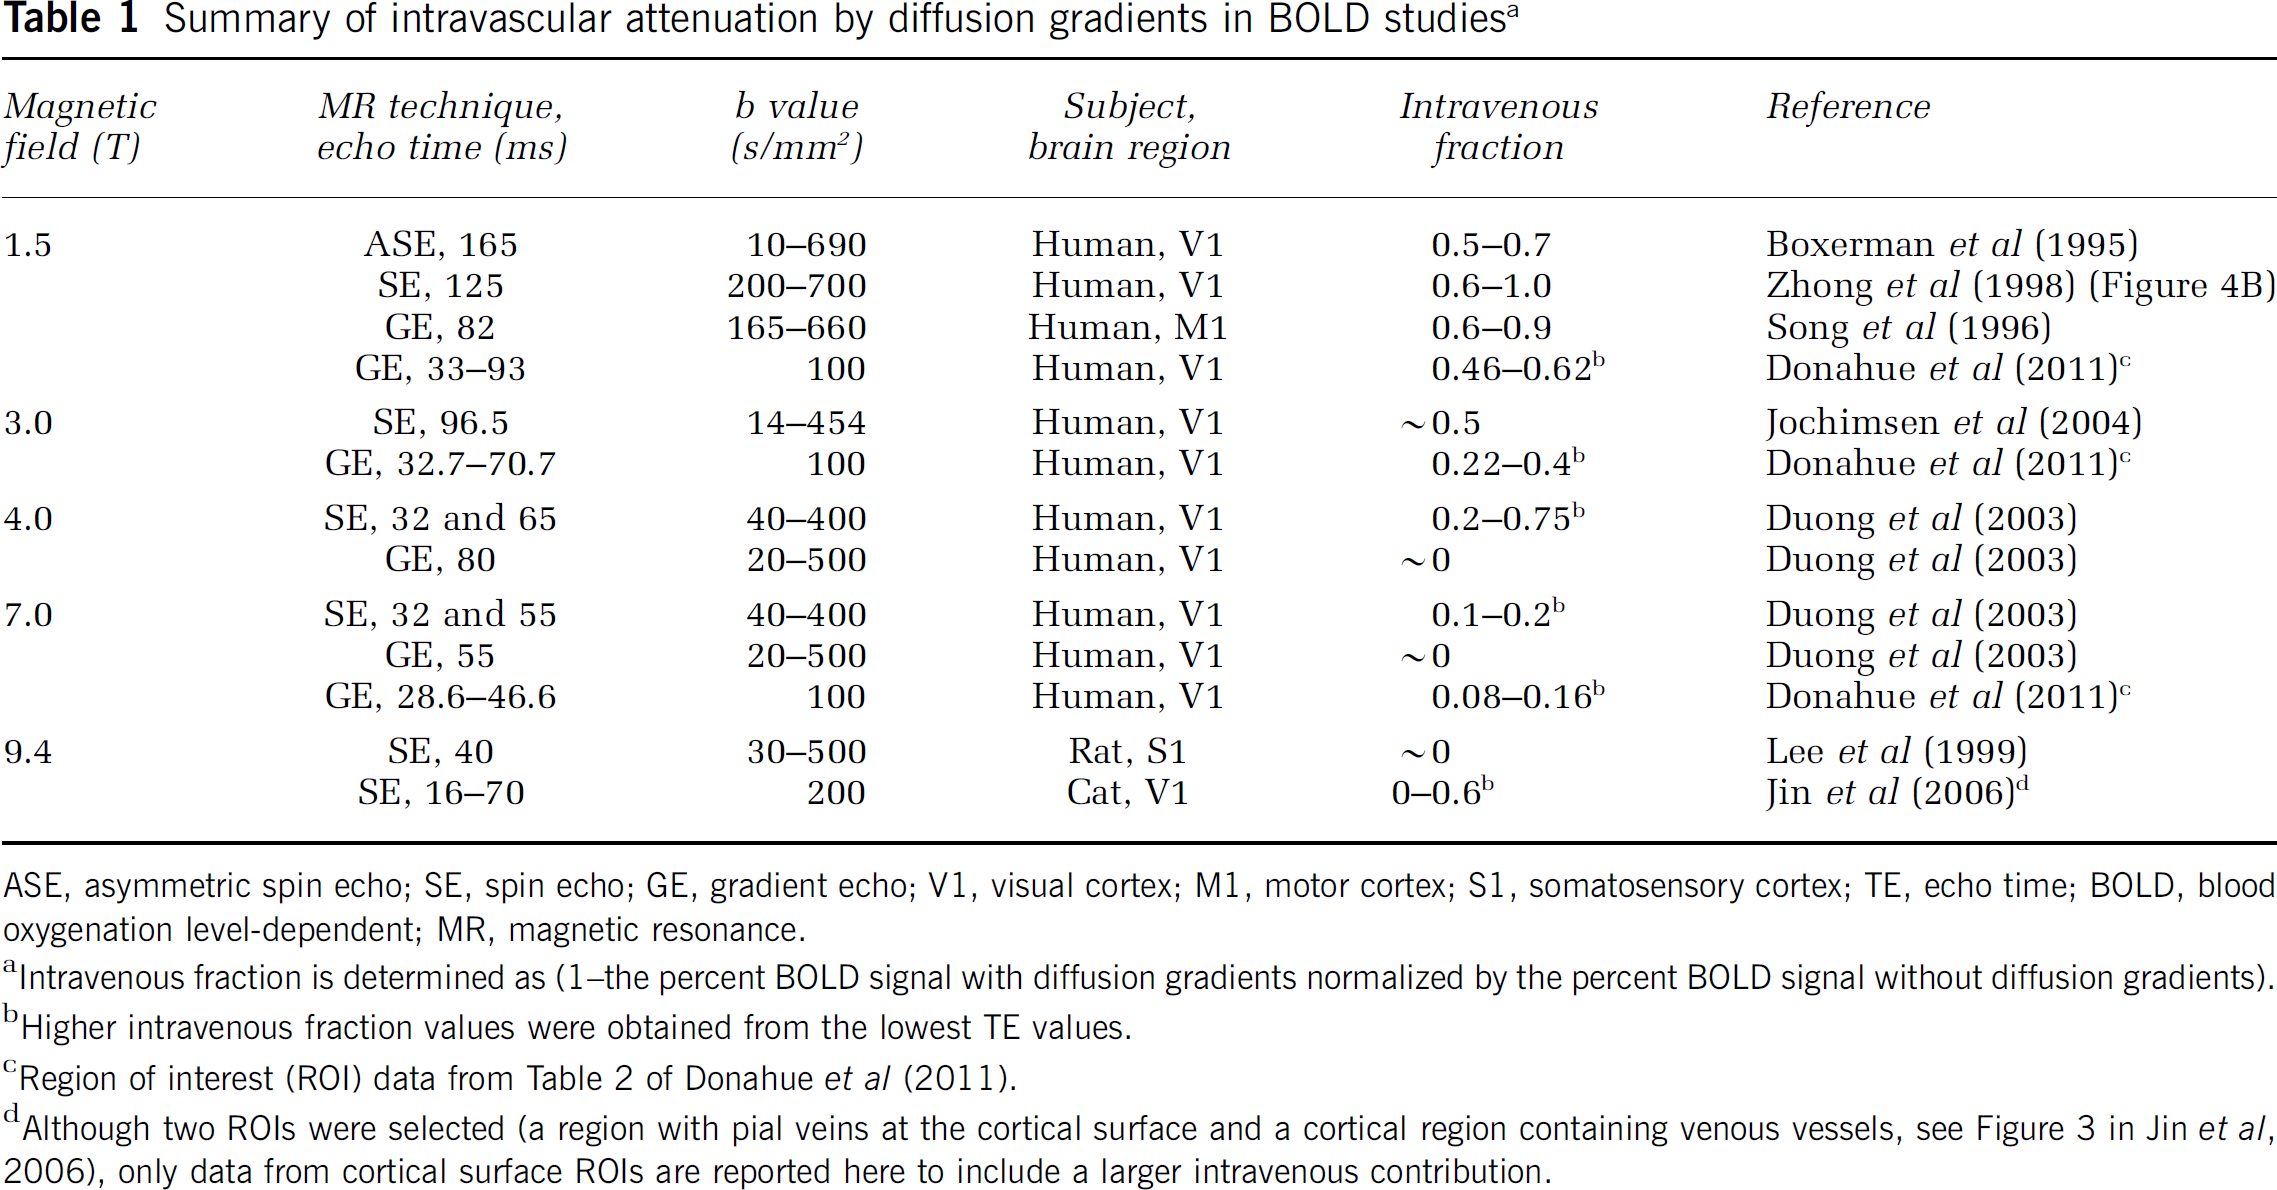
ASE, asymmetric spin echo; SE, spin echo; GE, gradient echo; V1, visual cortex; M1, motor cortex; S1, somatosensory cortex; TE, echo time; BOLD, blood oxygenation level-dependent; MR, magnetic resonance.
Intravenous fraction is determined as (1–the percent BOLD signal with diffusion gradients normalized by the percent BOLD signal without diffusion gradients).
Higher intravenous fraction values were obtained from the lowest TE values.
Region of interest (ROI) data from Table 2 of Donahue et al (2011).
Although two ROIs were selected (a region with pial veins at the cortical surface and a cortical region containing venous vessels, see Figure 3 in Jin et al, 2006), only data from cortical surface ROIs are reported here to include a larger intravenous contribution.
Spatial specificity and sensitivity of blood oxygenation level-dependent functional magnetic resonance imaging
Spatial resolution of BOLD fMRI is determined not only by intrinsic hemodynamic responses, but also by the vascular structure. One important issue for extremely high-resolution studies is that pixels with different baseline CBVv values will have different BOLD fMRI signal changes for similar oxygenation level changes. To compare BOLD signals across pixels, it is therefore important that pixels have similar vascular properties (both density and diameters).
In BOLD fMRI studies, draining of deoxyhemoglobin from the capillaries (spatially specific to regions of neural activation) to intracortical veins and then to pial veins is one major concern of spatial specificity. As the diameters of these downstream vessels progressively increase, this deoxygenated blood combines with blood draining from other sources. The deoxyhemoglobin change in these draining veins is therefore dependent on their distance from the activated area (Turner, 2002), and on the spatial extent of neural response. When the area of activation is small, this deoxygenated blood is quickly diluted with blood from inactivated regions, effectively reducing the oxygenation level change in adjacent regions. Thus, GE BOLD fMRI is capable of differentiating small functional modules such as single whisker barrels (Yang et al, 1996). However, when a large brain area responds to stimulus, much of the blood draining into the large downstream vessels also has origins from activated regions, so in addition to the spatially specific contributions, there will also be nonspecific contributions from large vessels. This is the case in the GE BOLD fMRI example of cat visual cortex in Figure 4, where nonspecific contributions are seen in pial vessels at the cortical surface and in CSF regions (yellow pixels in green-outlined regions). These nonspecific signal changes can be significantly reduced with SE BOLD fMRI (Figure 4B), improving the spatial specificity to small-sized vessels and nearby tissue, whose location correlates well with the dilations of cortical vessels as seen in the results of CBV fMRI using exogenous intravascular contrast agent with high susceptibility (Kennan et al, 1998; Mandeville et al, 1998; van Bruggen et al, 1998; see Figure 4C).
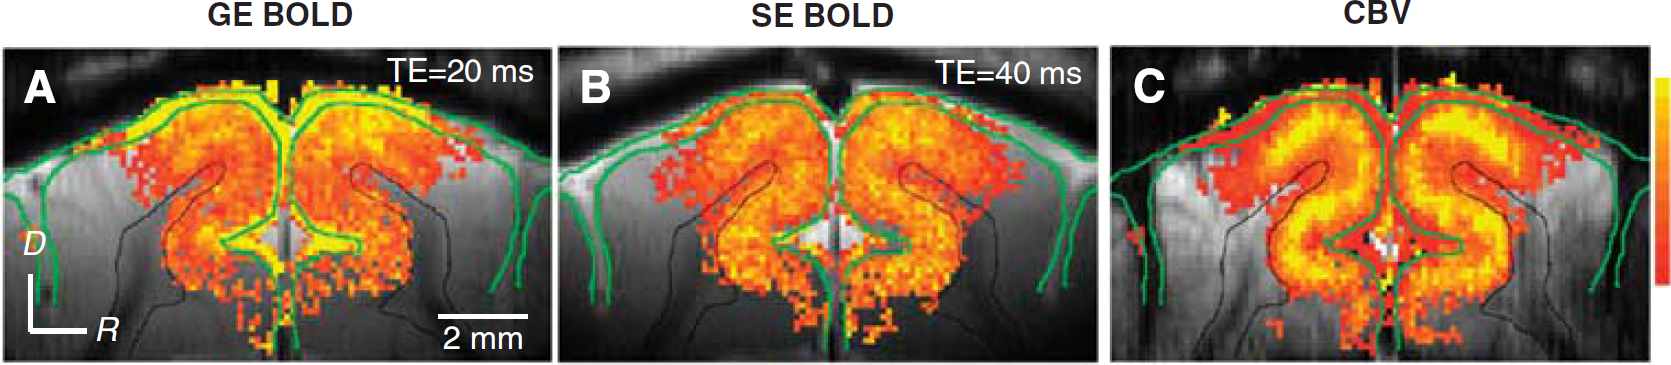
High-resolution fMRI of cat visual cortex. GE BOLD, SE BOLD, and CBV fMRI studies were performed at 9.4 T with 156
The SE BOLD fMRI technique at high magnetic field is thus preferable for mapping submillimeter functional structures if the nonspecific large vessel contribution is significant. Note that SE BOLD fMRI with small diffusion gradients improves spatial specificity (similarly to the effect of acquiring SE BOLD fMRI at high magnetic field). But since SE BOLD signal sensitivity is significantly reduced due to refocusing of the dephasing effect around large vessels, and since the additional refocusing radiofrequency pulse increases power deposition to tissue, the GE BOLD technique is often the tool of choice. Large vessel contributions can also be reduced by postprocessing approaches as described below. The location of large pial venous vessels can also be determined from venographic images obtained with high-resolution
The ultimate spatial specificity of hemodynamic-based fMRI ultimately depends on how finely the blood flow is regulated. If intracortical arteries are independently regulated, then spatial resolution can be as fine as 0.33 to 2 mm for arterial blood-based fMRI measurements (Duvernoy et al, 1981). If precapillary arterioles regulate the hemodynamic changes, then achievable spatial resolution is even better. Studies by fMRI suggest that intrinsic CBF and CBV fMRI responses are reasonably specific to submillimeter functional domains (Duong et al, 2001; Zhao et al, 2005), which in cat cortex are on the order of 0.5 to 0.7 mm in diameter (roughly corresponding to the diameter of the arterial unit for groups 2 to 3 arteries). Recent papers indicate that precapillary arterioles indeed dilate during stimulus via astrocyte-capillary signaling (see review articles, Attwell et al, 2010; Petzold and Murthy, 2011). In fact, capillary network responses precisely outline regions of neural activity in the rat olfactory bulb (Chaigneau et al, 2003), suggesting that spatial resolution of hemodynamic-based fMRI can be on the order of ∼100
Physiological sources of blood oxygenation level-dependent functional magnetic resonance imaging signals
The functional change in venous blood oxygenation level (
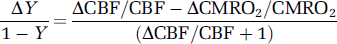
where Δ refers to the stimulus-induced change. An increase in venous oxygenation level decreases the blood OEF (oxygen extraction fraction) from blood to tissue (1−Y=OEF). When relative changes in CBF and CMRO2 are similar, Δ
Assuming that hematocrit level in venous blood does not change with stimulus, the BOLD signal change in extravascular tissue can be approximated (Davis et al, 1998) as
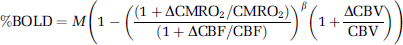
where
Calibration constant
To easily conceptualize equation (3), a first-order linear approximation can be performed (Kim et al, 1999) as
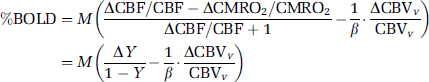
This approximation shows that an increase in
Since CBF, CMRO2, and CBVv responses contribute to BOLD fMRI dynamics (see equation (4)), these physiological contributions can be explained with biophysical models (e.g., Ogawa et al, 1993b; Boxerman et al, 1995; Ogawa et al, 1998). Quantitative contribution of physiological changes to BOLD fMRI responses requires knowledge of constants (e.g.,
Dynamic Cerebral Blood Flow Responses
The CBF changes can be measured by perfusion-based fMRI techniques using arterial blood water as an endogenous flow tracer. Numerous CBF measurements have been performed with various stimuli (e.g., Kwong et al, 1992; Edelman et al, 1994; Kim, 1995). Perfusion-based fMRI methods have poor temporal resolution due to the requirement that spins from arterial blood outside the imaging slice must have sufficient time to move into capillaries and exchange with extravascular tissue water, and because control images must also be acquired. Usually, stimulus onset causes CBF to initially rise to an ‘overshoot’ level, after which the increase in CBF decreases to a slightly lower ‘plateau’ level during stimulus continuance. These increased CBF levels will increase venous oxygen saturation, which is directly related to a positive BOLD response.
Dynamic CBF responses at high temporal resolution can be obtained with a conventional laser Doppler flowmeter or from fMRI (e.g., Silva and Kim, 1999). Since blood flow dictates that arterial blood responses precede those of venous vessels, the CBF response is ∼0.5 to 1 second earlier than the BOLD response. To show the difference in hemodynamic onset times, CBF and BOLD responses in the rat somatosensory cortex to forepaw stimulus are plotted in Figure 5A (Silva et al, 2000); the CBF increase occurs ∼0.5 second after stimulus onset, while the BOLD response occurs ∼0.5 second later.
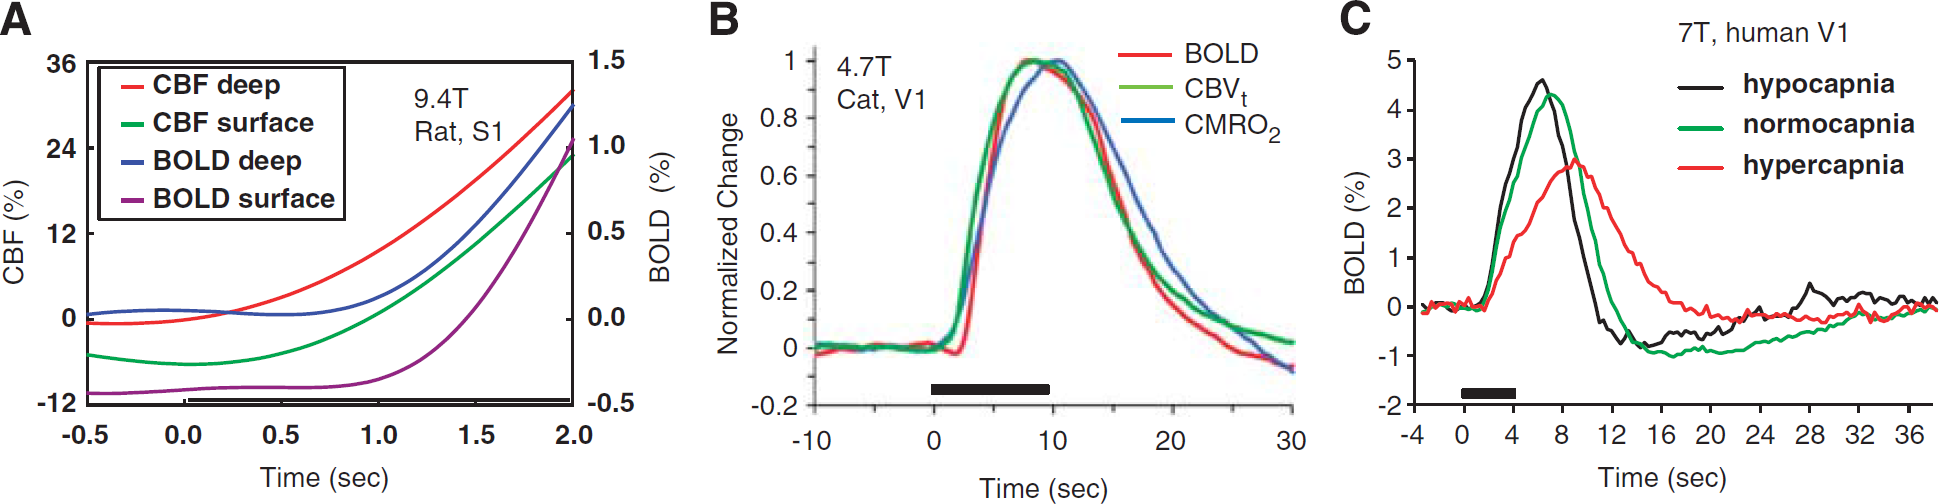
Dynamic changes in stimulus-induced CBF, BOLD, CBV, and CMRO2-related fMRI signals. Stimulus starts at time=0 second and stimulus periods are indicated by black horizontal bars. (
Dynamic Cerebral Metabolic Rate of Oxygen Utilization-Related Changes
It is well accepted that the CBF increase with stimulus more than compensates for the functional CMRO2 increase, and it was also generally assumed that CMRO2 increases rapidly and peaks quickly after stimulus onset. Most
The above confounds are removed when a vasodilator is infused to suppress CBF and CBV functional responses (Fukuda et al, 2006; Nagaoka et al, 2006), such that stimulus-induced dynamic changes in blood oxygenation levels measured by fMRI indicate solely CMRO2 responses. This approach shows a functional CMRO2 response that begins earlier, but surprisingly peaks later than the BOLD response (Nagaoka et al, 2006) (see blue versus red time courses in Figure 5B). A similar slow functional CMRO2 response compared with CBF response was also observed in tissue oxygen tension data (Masamoto et al, 2008). The delayed peak in functional CMRO2 response (versus BOLD and CBF) may be explained by the astrocyte-neuron-lactate-shuttle hypothesis (reviews in Pellerin et al, 2007), in which lactate is produced by increased glycolysis in astrocytes and then becomes the primary substrate for oxidative metabolism in neurons.
An alternative reason for observing delayed peaks in CMRO2 responses by fMRI may involve temporal latencies between mitochondrial oxygen consumption and changes in venous blood oxygenation levels. This issue was recently examined by measuring dynamic cellular CMRO2 changes with flavoprotein autofluorescence imaging (Vazquez et al, 2012), where it was found that the tissue mitochondrial CMRO2 responds relatively fast (time constant ∼1 second) compared with the venous oxygenation level change (time constant ∼10 seconds), showing that dynamic CMRO2 responses obtained from BOLD fMRI do not instantaneously reflect temporal changes in tissue mitochondrial metabolic rates.
Dynamic Cerebral Blood Volume Responses
Dynamic CBF and CBV changes are intercorrelated, since CBF is dependent on CBV and velocity changes. The total CBV (CBVt) change can be estimated from the CBF change (Grubb et al, 1974), or can be measured with intravascular injection of contrast agent (Kennan et al, 1998; Mandeville et al, 1998; van Bruggen et al, 1998) (see Figures 4C and 5B) or by the vascular space occupancy method (Lu et al, 2003). In some early studies, the BOLD contribution to CBV-weighted fMRI was not corrected, leading to errors in quantifying dynamic CBV changes. More recently, it has been consistently observed that the CBVt response occurs earlier than the BOLD response (see green versus red time courses in Figure 5B).
Total CBV can be subdivided into arterial and venous components. Since ∼60% to 80% of baseline CBVt is from CBVv (Ito et al, 2001; Lee et al, 2001; An and Lin, 2002b), it is often assumed that stimulus-induced CBVt changes are dominated by CBVv changes (Buxton et al, 1998; Mandeville et al, 1999). This assumption has been used to determine changes in venous oxygenation level and CMRO2 from BOLD fMRI data. But determination of CMRO2 from CBF and BOLD fMRI data depends on understanding venous—not total—CBV changes (see equation (4)).
Compartment-specific CBV studies indicate that the CBVv change is actually much less than the CBVt change. Within a short stimulus period (<15 seconds), rat fMRI studies showed that arterial CBV (CBVa) changes are dominant, while CBVv changes are minimal (Kim et al, 2007). During a long stimulus period, CBVv increases slowly in cat studies (Figure 6A), eventually reaching a magnitude similar to the CBVa change (Kim and Kim, 2011). At a steady state, the relative change in CBVv is about half that of CBVt in rat studies (Lee et al, 2001). Similar observations were also detected in optical studies in rodents, where arterial dilation was dominant with short stimulus duration (Hillman et al, 2007; Vazquez et al, 2010; Drew et al, 2011; see also Figure 6D), and venous dilation occurred slowly with extended stimulus (Drew et al, 2011). After stimulus offset, cat fMRI studies show that CBVa rapidly decreases to baseline values or exhibits a small prolonged poststimulus undershoot, while CBVv is slow to return to baseline values (Figure 6A). Although low sensitivity and large signal fluctuations indeed complicate identification of poststimulus CBVa undershoots, it should be noted that similar poststimulus undershoots were observed in CBF fMRI data from the same animal model (see Figure 1D in Jin and Kim, 2008) and in surface arteriolar vessel diameters measured by two-photon microscopy in mice after termination of a 30-second vibrissae stimulus (see Figure 2 in Drew et al, 2011). In humans, positron emission tomographic studies showed that the CBVa change is dominant during hypocapnia and hypercapnia, while the CBVv change is minimal (Ito et al, 2005). Venous CBV can be noninvasively determined with the MRI technique named VERVE (venous refocusing for volume estimation) (Stefanovic and Pike, 2005), which relies on multispin-echo measurements with different interpulse delays. Recent fMRI measurements with VERVE in humans show that functional CBVv responses are significant during stimulation and the power exponent,
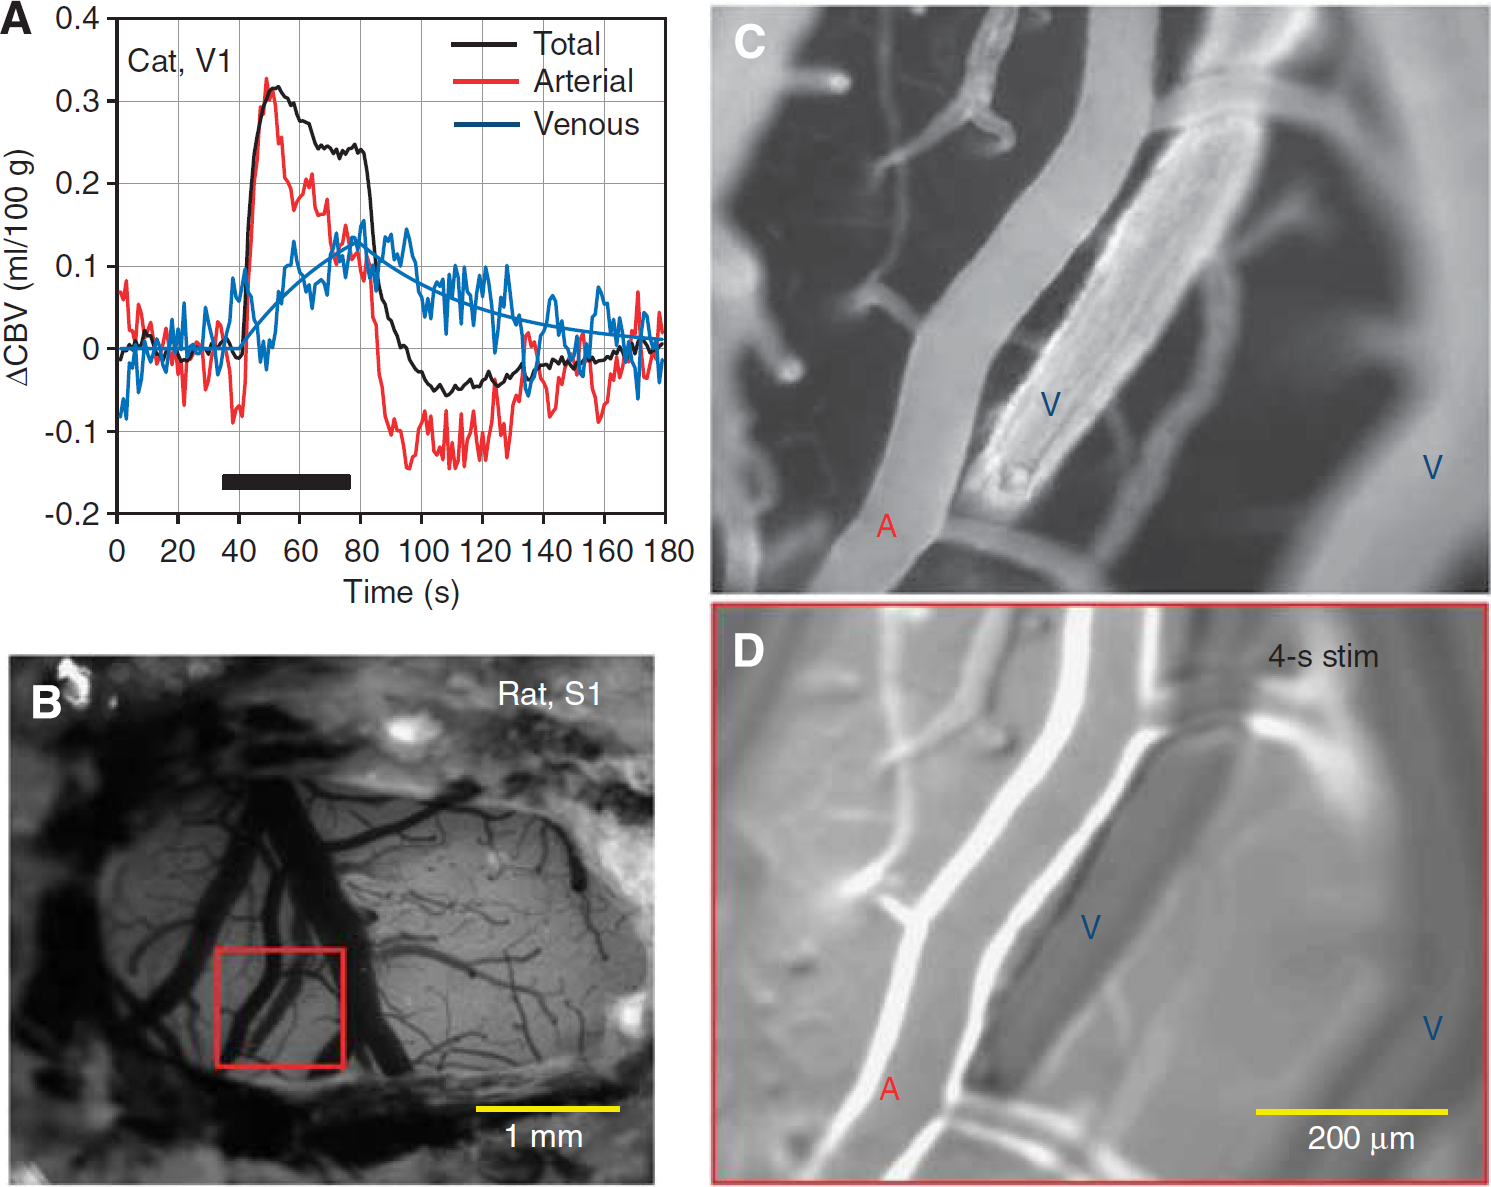
Compartment-specific CBV changes during sensory stimulus. (
The recent CBVv studies have three important implications for BOLD quantification: (1) since during stimulus the relative CBVv change is less than relative CBVt change, relative CMRO2 changes are underestimated when obtained with equation (3) and an
Dynamic Blood Oxygenation Level-Dependent Responses
The BOLD response function is determined by CBF, CMRO2, and CBVv changes. Since the BOLD response is sensitive to the draining effects from capillaries to pial veins, pixel-to-pixel differences in vascular content mean that even if stimulus-induced changes in CBF, CMRO2, and CBVv were identical across pixels, BOLD dynamic responses (onset time, time-to-peak, etc.) would still be expected to vary across pixels (Lee et al, 1995). This draining of blood into pial veins makes the BOLD response in the middle of the cortex start ∼0.5 second before the BOLD response at the cortical surface in rat somatosensory cortex (Silva et al, 2000; Tian et al, 2010), cat visual cortex (Jin and Kim, 2008), and human visual cortex (Siero et al, 2011). If instead fMRI signals from all pixels within an image originate mostly from microvessels including capillaries, then onset times should correspond to the capillary response times, which are likely to be similar across regions. If the microvessel contribution is dominant, then the difference in hemodynamic responses between regions may then be used to infer sequential neural activity (Buckner et al, 1996; Richter et al, 1997; Menon et al, 1998; Ogawa et al, 2000).
Sources of initial blood oxygenation level-dependent dips, poststimulus blood oxygenation level-dependent undershoots, and prolonged negative blood oxygenation level-dependent functional magnetic resonance imaging signals
Prolonged positive responses (where stimulus-induced signals are higher than baseline signals) are not the only type of response observed with conventional BOLD fMRI. Understanding signal sources of negative BOLD fMRI signals (signals lower than baseline), such as initial dips, poststimulus undershoots, and prolonged negative signals is of great interest.
Initial Blood Oxygenation Level-Dependent Dips
Optical spectroscopy studies by Malonek and Grinvald (1996) showed a delayed hemodynamic response that was diffuse with large spatial extent and also an initial CMRO2-based deoxyhemoglobin signal increase (termed the ‘optical dip’) that was highly localized to the site of neuronal activity. Although the exact origin of the deoxyhemoglobin-weighted optical dip is still controversial (Malonek and Grinvald, 1996; Sirotin et al, 2009), it has been commonly observed. Similarly to the optical dip, a small initial BOLD dip has been detected in humans (Ernst and Hennig, 1994; Menon et al, 1995; Hu et al, 1997) and in animals (Kim et al, 2000) (see also red BOLD time course in Figure 5B), though existence of this response is still debated (Buxton, 2001). The initial BOLD dip may reflect (1) an increase in deoxyhemoglobin concentration due to CMRO2 increases before the CBF response and (2) an increase in CBVv preceding the CBF response. Recent measurements of vessel diameters (Drew et al, 2011) and CBV fMRI (Kim and Kim, 2011) during stimulus show a slow increase in CBVv (see Figure 6A), with no evidence of significant venous vessel dilation during the initial period, suggesting that the initial BOLD dip is due to an early mismatch between CMRO2 and CBF changes. However, detection of a highly localized initial BOLD dip requires both high spatial resolution and high temporal resolution, and the resulting reduction in sensitivity may not be practical for high-resolution fMRI studies.
Poststimulus Blood Oxygenation Level-Dependent Undershoots
One or more physiological factors may contribute to a poststimulus BOLD undershoot, including a poststimulus CBF undershoot (Hoge et al, 1999a; Jin and Kim, 2008; Chen and Pike, 2009b), a slow poststimulus return of CBVv to baseline (Mandeville et al, 1998; Chen and Pike, 2009b; Hua et al, 2011; Kim and Kim, 2011), and a slow poststimulus return of CMRO2-related oxygenation values to baseline (Frahm et al, 1996; Yacoub et al, 2006; Hua et al, 2011). One should be careful when interpreting early findings, because (1) CBVt responses are often measured instead of CBVv, (2) at high magnetic field studies, both CBF and CBV responses often contaminate the BOLD signal, and (3) there is no direct means of dynamically measuring CMRO2. In recent BOLD, CBF, and CBVv fMRI studies to explain the poststimulus BOLD fMRI undershoot, one report (Hua et al, 2011) suggested that ∼80% of the BOLD fMRI undershoot is from a slow return of CMRO2-related contributions, with the remainder related to a slow return of CBVv contributions, and no CBF undershoot contributions, while another paper (Chen and Pike, 2009b) reported that both a CBF undershoot and a slow return of CBVv to baseline are contributors. Exact contributors of the poststimulus undershoot may also depend on stimulus type and duration.
Even if CMRO2-related factors are dominant contributors to the poststimulus BOLD undershoot, this is still not an indication of an increase in cellular CMRO2 during the poststimulus period, as discussed previously in ‘Dynamic CMRO2-related changes’. More importantly, is the poststimulus BOLD undershoot useful for high-resolution fMRI? The answer is the same as for initial BOLD dips: although any CMRO2-related BOLD signal would improve spatial specificity to areas of neuronal activity, both high spatial resolution and high temporal resolution would be required to localize deoxyhemoglobin in capillaries before it drains into large vessels, with the resulting loss of sensitivity. Therefore, the usefulness of the poststimulus BOLD undershoot for high-resolution functional imaging studies is dependent on its signal sources.
Prolonged Negative Blood Oxygenation Level-Dependent Functional Magnetic Resonance Imaging Signals
Negative BOLD signals occurring during a stimulus period may be explained by (1) a decrease in CBF due to neural inhibition (Shmuel et al, 2002, 2006; Boorman et al, 2010; Wade and Rowland, 2010), (2) a decrease in CBF due to redistribution of CBF (the steal effect) into nearby active regions (Harel et al, 2002), (3) an increase in CMRO2 without concomitant CBF increase (Schridde et al, 2008), and (4) an increase in vasoconstrictive neurotransmitter with increased neural activity in subcortical areas (Shih et al, 2009). In areas where vascular reactivity is hampered, a negative BOLD response is likely due to increased CMRO2 without a concomitant increase in CBF. The physiological basis of negative BOLD signals therefore depends on stimulus type and brain region (e.g., cortical versus subcortical areas).
Influence of global hemodynamic baseline conditions on stimulus-evoked blood oxygenation level-dependent responses
It is well known that global CBF can be modulated by changes in arterial partial pressures of carbon dioxide and oxygen. It has also been shown or suggested that global perturbation of CBF can result from the intake of commonly used substances (e.g., caffeine, nicotine, and alcohol), changes in the concentration of endogenous substances (e.g., estrogen and adrenaline), or experimental administration of various drugs (e.g., cocaine or acetazolamide). These global CBF changes can affect the dynamics and magnitude of BOLD responses (Hoge et al, 1999a; Kemna and Posse, 2001; Cohen et al, 2002). Typically, when baseline CBF (and consequently baseline venous oxygenation) is low, the BOLD response is fast and intense (Cohen et al, 2002; Lu et al, 2008). For example, a faster and larger stimulus-evoked BOLD response occurs under hypocapnic conditions (black trace in Figure 5C) or with intake of the vasoconstrictor caffeine (Mulderink et al, 2002), while a slower and smaller response occurs with alcohol intake (Levin et al, 1998). Baseline-condition dependence of BOLD responses may be due to (1) a nonlinear relationships between BOLD responses versus baseline-dependent values of
Additionally, the hemodynamic response is sensitive to age (Yamada et al, 2000; Desposito et al, 2003), patterns of resting-state fluctuations, and resting-state neurotransmitter levels (Muthukumaraswamy et al, 2009). When the stimulus-induced fMRI response is compared under different physiological or pharmacological states, investigators must distinguish between effects resulting from altered neural activity and those resulting merely from global hemodynamic influences.
Basis of resting-state blood oxygenation level-dependent fluctuations
A seminal report by Biswal et al (1995) showed that in the resting-state, slow temporal fluctuations (<0.1 Hz) in BOLD responses were correlated between functionally related areas, as defined by conventional stimulus-evoked fMRI, suggesting that large-scale neural networks could be mapped without task performance. Despite some concern that some contributions to these fluctuations could be due to vasomotor oscillations (Mitra et al, 1997), there is sufficient evidence of neural contributions to resting-state BOLD fluctuations. The field of resting-state fMRI expanded greatly after large-scale ‘default-mode networks’ was discovered in humans (Raichle et al, 2001) and in anesthetized monkeys (Vincent et al, 2007). Resting-state BOLD fMRI has become an important tool for empirically mapping various interhemispheric and intrahemispheric local and global networks and assessing connectivity in normal and diseased brains. Still, the relationship between resting-state BOLD fMRI and neural activity or neurovascular coupling is an area of intense research (see review article, Fox and Raichle, 2007). In monkey studies, Leopold and Logothetis (Leopold et al, 2003) measured fluctuations in band-limited power of LFP signals and found high coherence over cortical distances >1 cm, indicating that resting-state BOLD fluctuations reflect ongoing (spontaneous and coherent) neural activity. A question that needs to be answered by systematic investigation is whether the sources of resting-state BOLD responses are similar to those of stimulus-induced responses.
Concluding remarks
The BOLD effect in fMRI is very complex, and thus is still an area of intense research. However, the following conclusions can be drawn from our experiences and review of the existing literature.
Contrast in BOLD fMRI is determined by both intravascular and extravascular signal changes. With higher magnetic fields and longer TEs, the extravascular contribution increases and the intravascular contribution decreases; and therefore, the spatial specificity to parenchyma improves. The magnitude of a BOLD fMRI response is weighted by baseline CBVv and stimulus-induced venous oxygenation level changes. This means that if one pixel has a higher value for baseline CBVv than another pixel, that pixel would show a higher BOLD response if all other factors were equal (including oxygenation level changes). Since vascular density and structure are unlikely to be similar across pixels in extremely high-resolution images, BOLD fMRI response magnitudes should therefore not compared across pixels. Spatial resolution in BOLD fMRI is determined by the size of each venous vascular unit (∼1 mm diameter when signals from intracortical emerging veins contribute). Spatial resolution is also dependent on the area of activation, and can be improved by acquisition with SE sequences at high magnetic fields. Steady-state CMRO2 changes are often determined from BOLD and CBF data by estimating the CBVt change from the CBF response with Grubb's formula and a volume-flow power term of 0.38. However, it is the CBVv response (not CBVt) that is relevant for BOLD fMRI, and at steady state, the CBVv responses are only about half of CBVt changes; therefore, functional CMRO2 changes reported in the literature are significantly underestimated when calculated from CBVt. Functional CBF, CBVv, and CMRO2 responses contribute to the dynamics of BOLD fMRI responses. The CBVv response is sluggish, and negligible for short stimulus periods. This lack of significant CBVv contributions to short stimulus-induced BOLD responses simplifies the BOLD biophysical model. Dynamic CMRO2 changes obtained from the BOLD biophysical model do not reflect dynamic cellular CMRO2 changes in mitochondria; and therefore, dynamic CMRO2 values obtained from BOLD data should not be interpreted as dynamic cellular responses. This pertains, for example, to interpretation of CMRO2-related contributions to the poststimulus BOLD undershoot. The initial BOLD dip originates from an early increase in CMRO2, but the source of poststimulus BOLD undershoot is still controversial. Investigating the sources of these signals will definitely aid our understanding of neurovascular coupling, but both high spatial and temporal resolutions would be required to use these signals for fMRI, and thus sensitivity would likely be low. Dynamic properties and magnitudes of BOLD functional responses are dependent on many physiological parameters as well as baseline conditions. In patients with neurovascular disorders, the BOLD response could be sluggish, or even decreased relative to baseline. This should not be interpreted simply as a decrease in neural activity, because neurovascular coupling may be hampered. Resting-state fMRI studies are widely performed, but its physiological source needs to be systematically investigated.
Footnotes
Acknowledgements
The authors thank colleagues at the University of Pittsburgh, especially Alberto Vazquez for providing unpublished images and Kristy Hendrich for proofreading and providing critical comments on this manuscript.
Disclosure/conflict of interest
The authors declare no conflict of interest.