
Abstract
Hypercapnia induces cerebral vasodilation and increases cerebral blood volume (CBV), and hypocapnia induces cerebral vasoconstriction and decreases CBV. Cerebral blood volume measured by positron emission tomography (PET) is the sum of three components, that is, arterial, capillary, and venous blood volumes. Changes in arterial blood volume (Va) and CBV during hypercapnia and hypocapnia were investigated in humans using PET with H215O and 11CO. Arterial blood volume was determined from H215O PET data by means of a two-compartment model that takes Va into account. Baseline CBV and values during hypercapnia and hypocapnia in the cerebral cortex were 0.034 ± 0.003, 0.038 ± 0.003, and 0.031 ± 0.003 mL/mL (mean ± s.d.), respectively. Baseline Va and values during hypercapnia and hypocapnia were 0.015 ± 0.003, 0.025 ± 0.011, and 0.007 ± 0.003 mL/mL, respectively. Cerebral blood volume changed significantly owing to changes in PaCO2, and Va changed significantly in the direction of CBV changes. However, no significant change was observed in venous plus capillary blood volume (= CBV-Va). This indicates that changes in CBV during hypercapnia and hypocapnia are caused by changes in arterial blood volume without changes in venous and capillary blood volume.
Keywords
Introduction
Hypercapnia induces cerebral vasodilation and increases cerebral blood flow (CBF), and hypocapnia induces cerebral vasoconstriction and decreases CBF (Ito et al, 2000; Kety and Schmidt, 1948; Raper et al, 1971). The increase in cerebral blood volume (CBV) during hypercapnia has been shown in animals to be less than the increase in CBF (Bereczki et al, 1993; Grubb et al, 1974; Keyeux et al, 1995; Lee et al, 2001). The degree of decrease in CBV during hypocapnia has also been shown in animals to be less than that in CBF (Grubb et al, 1974). Recently, we investigated changes in both regional CBF and CBV in humans during hypercapnia and hypocapnia; investigation was by positron emission tomography (PET) with 15O-labeled water (H215O) and 11C-labeled carbon monoxide (11CO) (Ito et al, 2003). Our results showed changes in CBF during hypercapnia and hypocapnia to be greater than those in CBV, similar to changes seen in the animal studies. Cerebral blood volume in a brain region measured by PET is the sum of three components, that is, arterial, capillary, and venous blood volumes (Ito et al, 2001; Lammertsma and Jones, 1983; Mintun et al, 1984; Ohta et al, 1996). Whether each CBV component changes during hypercapnia and hypocapnia is unknown, however.
15O-labeled water is a tracer that can diffuse freely through the blood-brain barrier. After intravenous infusion of H215O, the radioactivity concentration in capillary and venous blood is same as that in brain tissue (Iida et al, 1991), but it differs from that in arterial blood. The radioactivity concentration in the arterial blood can be differentiated on a regional time-activity curve by kinetic analysis; thus, the arterial blood volume in a brain region can be determined (Ito et al, 2001; Ohta et al, 1996). Previously, we have reported the human arterial fraction of CBV at rest condition measured by PET to be 37% in average (Ito et al, 2001). In the present study, we investigated changes in arterial blood volume and CBV during hypercapnia and hypocapnia using PET with H215O and 11CO.
Methods
Subjects
Six healthy men (21 to 24 years of age) were recruited and gave written informed consent to participate in the study. The subjects were judged healthy on the basis of their medical history, a physical examination, blood tests, and magnetic resonance imaging (MRI) of the brain. The study was approved by the Ethics Committee of the Akita Research Institute of Brain and Blood Vessels.
Positron Emission Tomography Procedures
The Headtome-V PET system (Shimadzu Corp., Kyoto, Japan) used for all studies provides 47 slices with center-to-center distances of 3.125 mm (Iida et al, 1996). The intrinsic spatial resolution is 4.0 mm in plane and 4.3 mm full-width at half-maximum (FWHM) axially. Reconstruction with a Butterworth filter resulted in a final in-plane resolution of approximately 8 mm FWHM. Data were acquired in two-dimensional (2D) mode.
15O-labeled water and 11CO PET studies were performed under three conditions: at rest (baseline), during hypercapnia, and during hypocapnia with the eyes closed. Studies were performed at rest, during hypercapnia, and during hypocapnia in two subjects and at rest, during hypocapnia, and then during hypercapnia in the other four subjects. Hypercapnia was induced by inhalation of 7% CO2 gas starting 1 min before scanning and continuing until the end of scanning. Hypocapnia was induced by hyperventilation starting 1 min before scanning and continuing until the end of scanning (Kanno et al, 1988).
15O-Labeled Water Positron Emission Tomography Study
All H215O PET studies were performed after transmission scanning. The interval between studies was at least 15 mins. Dynamic scanning (360 secs) was performed after continuous intravenous infusion of H215O over 2 mins. The scanning sequence consisted of six 5-sec frames, six 15-sec frames, and eight 30-sec frames. The dose of radioactivity was 1.1 to 1.8 GBq at the start of scanning. The arterial input function was obtained by continuous beta probe measurement of radioactivity in arterial whole blood taken from the radial artery. Dispersion and delay of arterial whole blood radioactivity in the beta detector system and in the internal arterial line were corrected as reported previously (Iida et al, 1986, 1988). Dispersion was corrected by deconvolution with a single exponential function, assuming a dispersion time constant of 4 secs. The delay was corrected by a nonlinear curve fitting to the whole brain time-activity data (PET scanner gantry coincidence curve) with a single-tissue compartment model that accounts for the delay. Two arterial blood samples were taken, one at the beginning and one at the end of scanning, for measurement of arterial CO2 gaseous pressure. A head fixation system with individualized molds for each subject was used to minimize head movement during PET.
11C-labeled Carbon Monoxide Positron Emission Tomography Study
11C-labeled carbon monoxide PET studies were then performed to measure CBV (Phelps et al, 1979). After 5 mins of continuous inhalation of 11CO gas (total approximately 5 GBq by mouth), static PET scanning was started at 5, 19, and 33 mins. Each scan was performed at rest and during hypercapnia and hypocapnia, with a scan time of 4 mins. Three arterial blood samples were taken during each scanning for measurement of whole blood radioactivity concentration and arterial CO2 gaseous pressure.
Regions of Interest
Regions of interest (ROIs) were drawn on the PET images. Regions of interest were defined for four neocortical regions representing the frontal, temporal, parietal, and occipital lobes (Yamaguchi et al, 1986). The ROIs were elliptical in shape with a short axis of 16 mm and a long axis of 32 mm. Each ROI was drawn in three adjacent sections, and data were pooled to obtain the average radioactivity concentration for the whole volume of interest. To obtain regional time-activity curves, regional radioactivity was calculated for each frame, corrected for decay, and plotted against the time.
Kinetic Analysis
The CBV (mL/mL) in a brain region is assumed to be the sum of the three components as follows (Ito et al, 2001; Lammertsma and Jones, 1983; Mintun et al, 1984; Ohta et al, 1996):

where Va is the arterial blood volume (mL/mL), Vc is the capillary blood volume (mL/mL), and Vv is the venous blood volume (mL/mL).
To describe the kinetics of H215O in the brain, the two-compartment model that takes Va into account was used. According to this model, the radioactivity concentration in a brain region is expressed as follows (Iida et al, 1991; Ito et al, 2001; Ohta et al, 1996):

where Cb(t) is the radioactivity concentration in a brain region, Ca(t) is the radioactivity concentration in the arterial whole blood (arterial input function), K1 is the influx rate constant (mL/mL min), k2 is the efflux rate constant (min−1), and ⊗ is the convolution integral. The influx rate constant K1 corresponds to the CBF. The K1/k2 ratio is defined as the distribution volume of water in the brain (Vd, mL/mL). In this model, Va includes a part of capillary blood volume because of a limited first-pass extraction fraction of H215O (Ohta et al, 1996). The rate constants and Va were estimated by a nonlinear curve fitting to the regional time-activity curves for each ROI in a least-squares manner (Marquardt, 1963). Average values of the four neocortical regions were calculated.
Results
Average PaCO2, PaO2, pH, blood pressure, and heart rate during each PET scanning are given in Table 1. PaCO2 values increased significantly during hypercapnia (P<0.01) and decreased significantly during hypocapnia (P<0.01) in both H215O and 11CO PET studies. Arterial hemoglobin concentrations and hematocrit were 15.5 ± 0.8 g/dL and 46.0% ± 2.2%, respectively (mean ± s.d.). No significant differences were observed in systolic blood pressure or heart rate between studies.
Blood gases, blood pressure (BP), and heart rate (HR) during positron emission tomography (PET) scanning
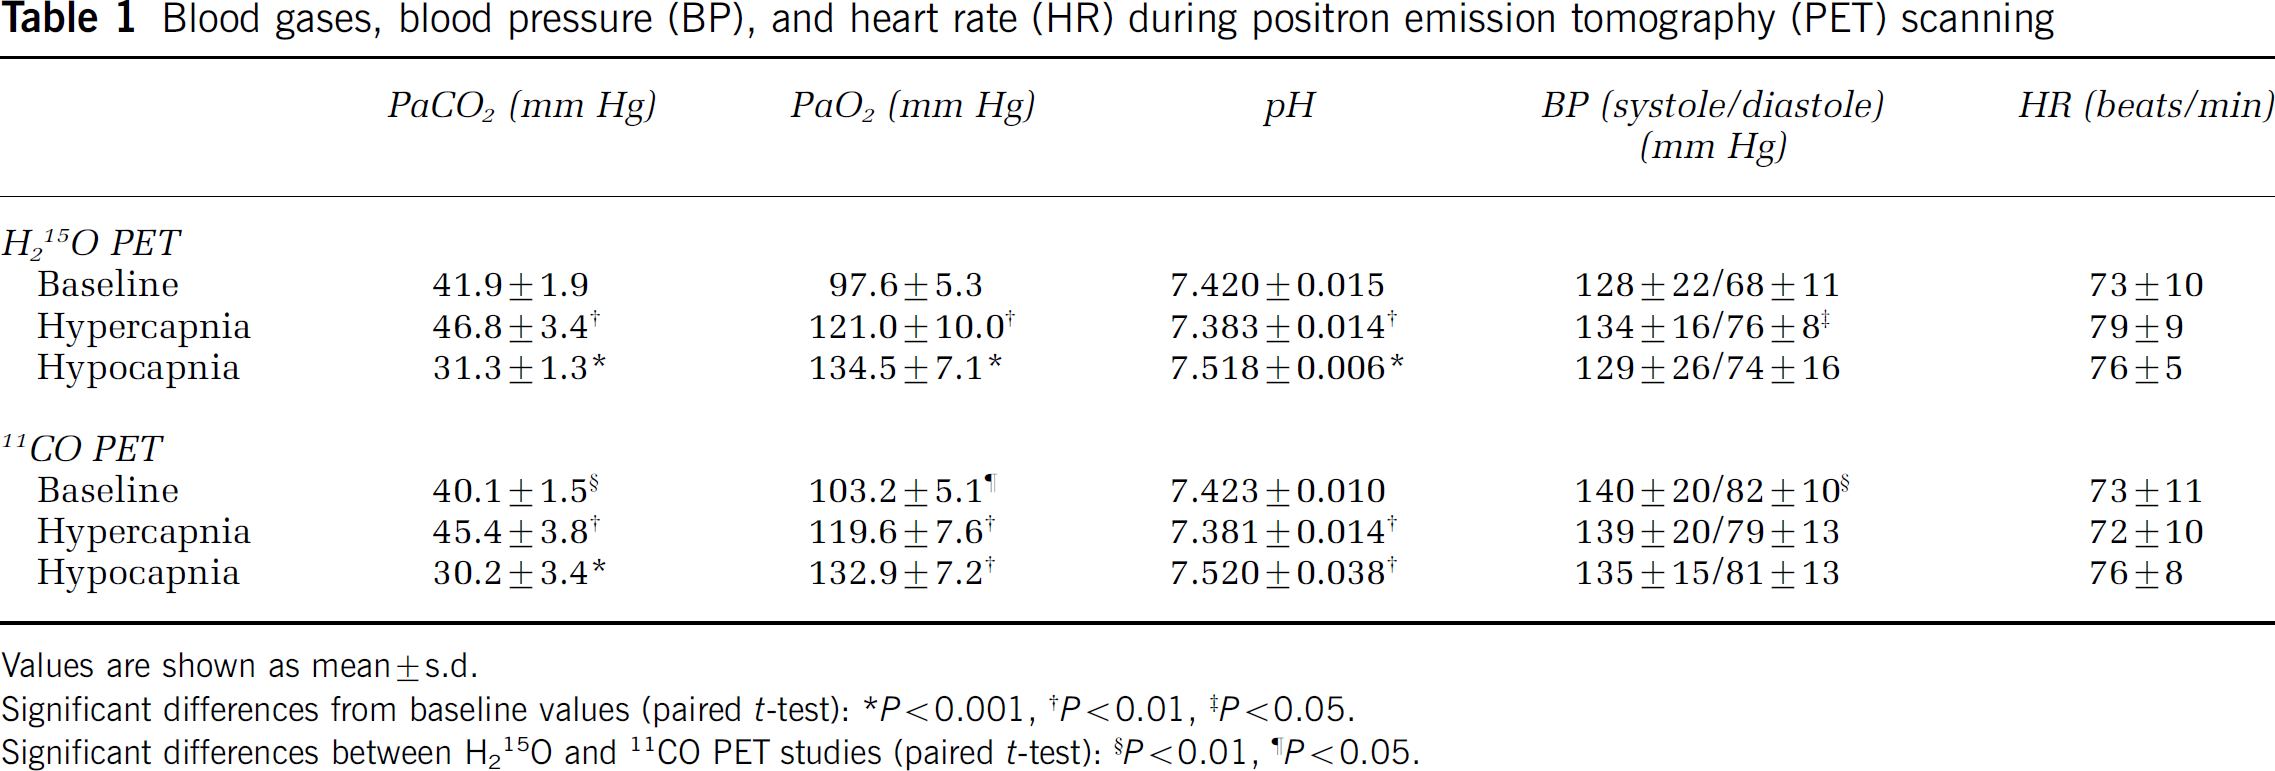
Values are shown as mean±s.d.
Significant differences from baseline values (paired t-test): * P<0.001, † P<0.01, ‡ P<0.05.
Significant differences between H215O and 11CO PET studies (paired t-test): § P<0.01, ¶ P<0.05.
Baseline K1 and Vd, and values during hypercapnia and hypocapnia in the cerebral cortex are given in Table 2. K1 increased significantly during hypercapnia (P<0.05) and decreased significantly during hypocapnia (P<0.01). No significant changes were observed in Vd during hypercapnia or hypocapnia.
K1 and Vd of the cerebral cortex in the three study conditions
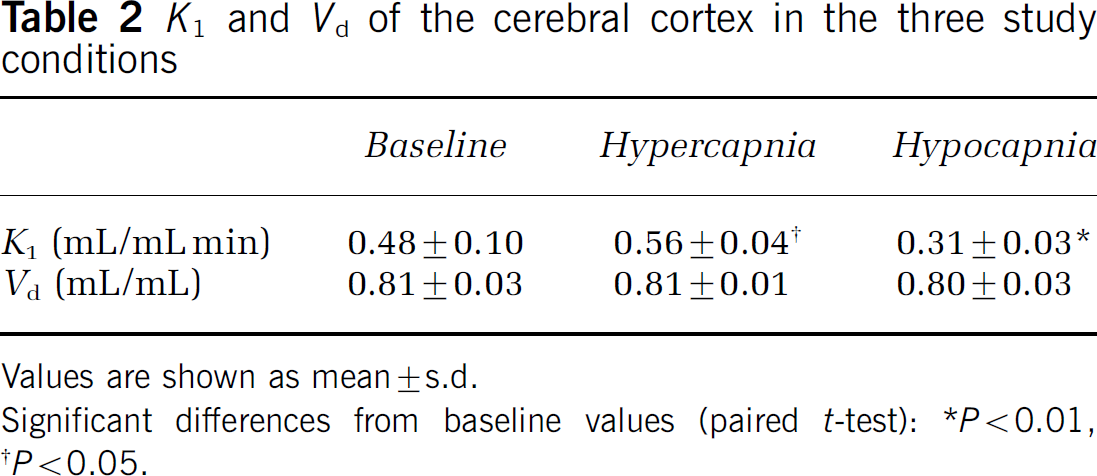
Values are shown as mean±s.d.
Significant differences from baseline values (paired t-test): *P<0.01, †P<0.05.
Baseline CBV, Va, Vv + Vc (= CBV-Va), and the arterial fraction of CBV (Va/CBV), and values during hypercapnia and hypocapnia in the cerebral cortex are shown in Table 3 and Figure 1. Cerebral blood volume increased significantly during hypercapnia (P<0.01) and decreased significantly during hypocapnia (P<0.01). Va and the arterial fraction of CBV decreased significantly during hypocapnia (P<0.05). A significant difference was observed in Va and the arterial fraction of CBV between hypercapnia and hypocapnia (P<0.05). No significant differences were observed in Vv + Vc between the three study conditions.
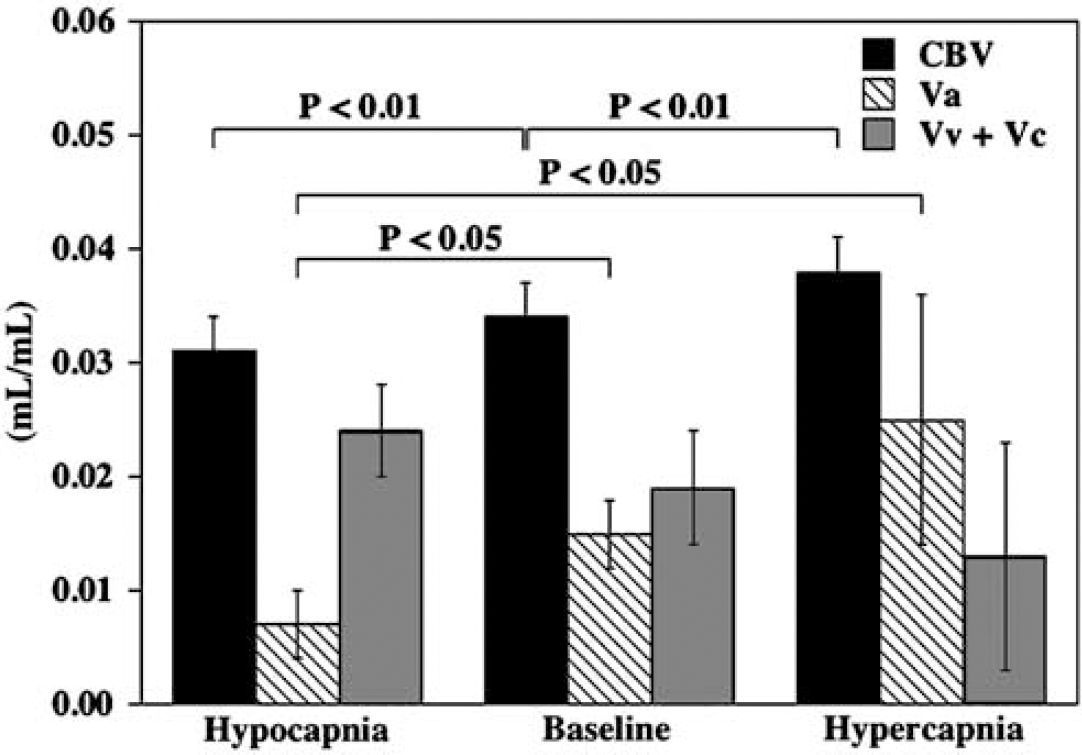
CBV, Va, and Vv + Vc of the cerebral cortex in the three study conditions.
CBV, Va, Vv + Vc, and arterial fraction of CBV (Va/CBV) of the cerebral cortex in the three study conditions
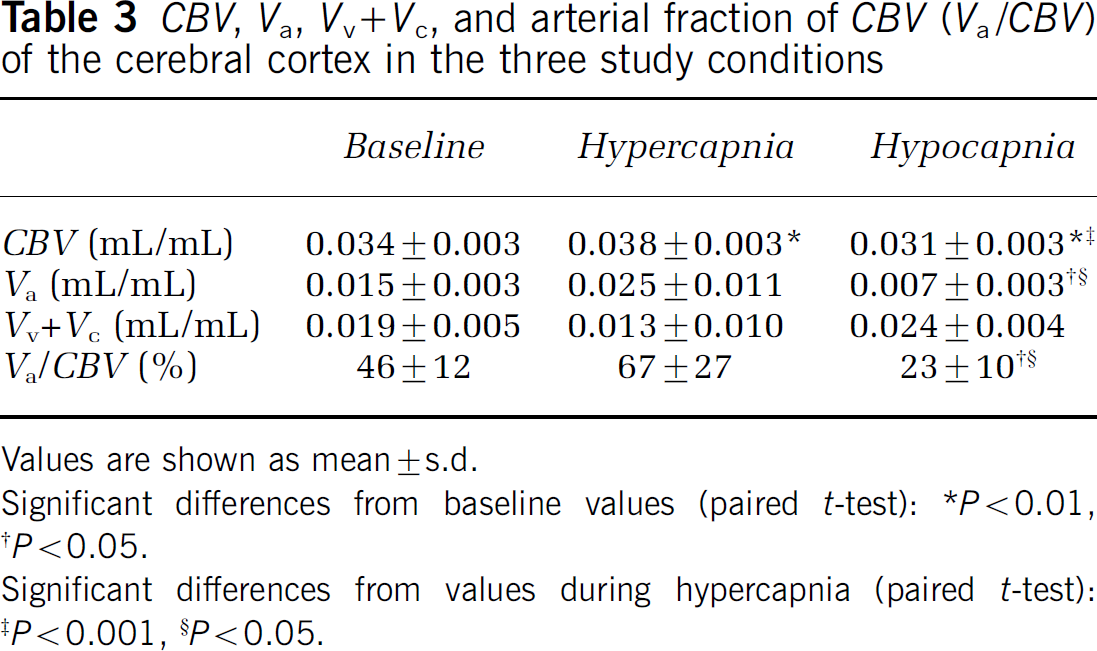
Values are shown as mean±s.d.
Significant differences from baseline values (paired t-test): * P<0.01, †P<0.05.
Significant differences from values during hypercapnia (paired t-test): ‡ P<0.001, § P<0.05.
Discussion
Previously, we have measured the human Va at rest condition using PET, in which coefficient of variation was approximately 30%, indicating the limitation of accuracy for measurement of Va (Ito et al, 2001; Ohta et al, 1996). Although interindividual variation of PaCO2 was relatively large, especially during hypercapnia and hypocapnia, PaCO2 was almost same between H215O and 11CO PET studies. This indicates reproducibility of changes in PaCO2 between studies. In the present study, the CBV changed significantly because of changes in PaCO2, and Va changed significantly between hypocapnia and baseline and between hypocapnia and hypercapnia in the direction of CBV changes. However, no significant change was observed in Vv + Vc during hypercapnia and hypocapnia. This indicates that changes in Va but not Vv and Vc contribute to changes in CBV during hypercapnia and hypocapnia. Increases in blood volume and vessel diameter in arteries but not veins during hypercapnia have been observed in rat brain by means of 19F NMR study (Lee et al, 2001). Carbon dioxide diffuses through the blood-brain barrier and introduces change in extracellular pH (Gotoh et al, 1961; Heistad and Kontos, 1983; Lassen, 1968). Changes in extracellular pH induce changes in the diameter of arterioles as a direct result of H+ affecting the vascular smooth muscle (Greenberg and Reivich, 1977; Kontos et al, 1977a, b; Wahl et al, 1970). Because Va includes the blood volume of cerebral arterioles, our results correspond well to these previous observations. In addition, an increase in Va during acetazolamide stress has also been observed in human brain (Okazawa et al, 2001). Vc is considered to be negligibly small (Mintun et al, 1984); however, Vc in the living human brain is unknown. However, the fraction of Vc per total volume of brain tissue was reported to be approximately 2% in cat (Pawlik et al, 1981).
15O-labeled water tracer diffuses freely through the blood-brain barrier, but the capillary permeability-surface product (PS) of H215O is not infinite, indicating that the first-pass extraction fraction of H215O (E) is less than 1 (Eichling et al, 1974; Herscovitch et al, 1987). Because radioactivity in the capillary and vein increases to greater than that in the brain tissue when E is less than 1 (Ohta et al, 1996), Va is greater than the true intravascular volume of the artery. The Va value obtained in the present study therefore includes a part of the intravascular volume of the capillary and vein. The estimated arterial fraction of CBV (Y) is expressed with the first-pass extraction fraction of H215O and true arterial fraction (X) as (Ito et al, 2001)

E is dependent on CBF and expressed

E = 1 - e−PS/CBF Assuming PS to be 1.38 mL/mL min (Eichling et al, 1974), the true arterial blood volume will be 7% or 8% less than the estimated Va at baseline or during hypercapnia, respectively. The true Va will be same as the estimated Va during hypocapnia.
In determining CBV, we measured the radioactivity concentration of 11CO-labeled hemoglobin. Therefore, CBV was calculated assuming the small-to large-vessel hematocrit ratio to be 0.85 (Phelps et al, 1979). However, a decreased hematocrit in cerebral vessels during hypercapnia has been reported (Bereczki et al, 1993; Keyeux et al, 1995), perhaps leading to underestimation of CBV during hypercapnia. A cerebral hematocrit reduction of 16% during hypercapnia was observed in rats (Bereczki et al, 1993), indicating that the underestimation of CBV during hypercapnia might be 16%.
If Va during hypercapnia is overestimated by 8% and CBV during hypercapnia is underestimated by 16% as mentioned above, Vv + Vc during hypercapnia is underestimated by approximately 60% (Table 3). When this underestimation is corrected, Vv + Vc during hypercapnia will be in good agreement with baseline Vv + Vc. Conversely, Vv + Vc during hypocapnia may be overestimated. Thus, we speculate that changes in CBV during hypercapnia and hypocapnia are caused by changes in Va with no changes in Vv + Vc. In the present study, the distribution volume of water in the brain (Vd) was nearly identical in the three study conditions. Under the conditions that the first-pass extraction fraction of H215O is unity and the brain-blood partition coefficient of H215O is unity, Vd is the sum of the extravascular tissue volume Vt (mL/mL), Vc, and Vv in a brain region (Lammertsma and Jones, 1983), that is,

which indicates no changes in Vv + Vc during changes in PaCO2. In addition, the total volume of brain tissue in a brain region (V, mL/mL) is described as (Lammertsma and Jones, 1983)

which indicates that the total volume of brain tissue may slightly change with changes in PaCO2. In the present study, Vd + Va (= V) was ranged from 0.81 to 0.84 mL/mL for three study conditions.
In conclusion, CBV changed significantly because of changes in PaCO2, and Va changed significantly in the same directions. However, no significant change was observed in Vv + Vc. Thus, changes in human CBV during hypercapnia and hypocapnia are caused by changes in arterial blood volume without changes in venous and capillary blood volume.
Footnotes
Acknowledgements
Assistance of members of the Akita Research Institute of Brain and Blood Vessels in performing the PET experiments is also gratefully acknowledged.