
Abstract
Two measures used in brain imaging are binding potential (BP) and the specific to nonspecific equilibrium partition coefficient (V3“). V3” determined using the 5-HT1A ligand [11C]WAY-100635 is sensitive to changes in the free and nonspecific binding of the ligand in the reference region (V2). Healthy female volunteers have higher 5-HT1A BP but not V3“ compared with men, because V2 is higher in women. While there could be several explanations for this observation, we hypothesized that women have more 5-HT1A receptors in the cerebellum. We explore the cerebellum to define a subregion that more accurately represents the free and nonspecific binding, potentially allowing the use of V3”. A quantitative autoradiogram in human brain using [3H]WAY-100635 identified a cerebellar subregion devoid of 5-HT1A receptors. In vivo 5-HT1A receptors were evaluated using [11C]WAY-100635 in 12 healthy women and 13 healthy men. Each subject had a metabolite-corrected arterial input function. The autoradiogram demonstrates the lowest concentration of 5-HT1A receptors in the cerebellar white matter (CW) and highest concentration in the cerebellar vermis (CV). The CW volume of distribution (VT) is lower than CV. Cerebellar white matter is adequately modeled by a one-tissue compartmental model, while a two-tissue model is necessary to model CV or the total cerebellum (CT). Women have a higher CW VT compared with men, suggesting a difference in V2. Use of CW improves identifiability and time stability of BP in cortical regions. Cerebellar white matter might be a better reference region for use in future 5-HT1A studies using [11C]WAY-100635. With CW as a reference region, V3“ cannot be used to detect differences in 5-HT1A receptors between men and women, suggesting the need for arterial input functions to determine BP.
Introduction
Serotonergic dysfunction has been implicated in psychiatric disorders ranging from depression and anxiety to autism and schizophrenia. Consequently, there have been many recent in vivo studies of serotonin receptors, with the serotonin transporter and 5-HT1A receptors being the subject of the most intense investigation in the last decade. The availability of radioligands that target these receptors and the development of statistical and mathematical approaches to modeling the data have facilitated these endeavors. However, there still remain a variety of technical problems in adequately quantifying binding, and many of the approaches to measuring this parameter rely on using a reference region considered to have only nonspecific binding, usually the cerebellum.
Serotonin (5-HT) neurons from the dorsal and median raphe nuclei innervate all regions of the forebrain (Steinbusch, 1981). 5-HT1A receptors are somatodendritic autoreceptors in the raphe nuclei and postsynaptic in the neocortex, hippocampus, and other limbic structures (Blier et al, 1998; Wright et al, 1995). Alterations in these receptors are implicated in psychiatric disorders (Arango et al, 2001; Drevets et al, 1999; Sargent et al, 2000; Tauscher et al, 2002) and are thought to play a role in the therapeutic action of antidepressants (Blier et al, 1990). WAY-100635 (N-(2-(4-(2-methoxyphenyl)-1-piperazinyl)ethyl)-N-(2-pyridinyl) cyclohexane carboxamide) is a 5-HT1A antagonist with high affinity and selectivity for 5-HT1A receptors (KD = 0.1 to 0.4 nmol/L) (Forster et al, 1995; Gozlan et al, 1995) that has been widely used as a PET radioligand.
In most PET studies comparing populations, several outcome measures can be used, including binding potential (BP) (Bmax/KD), BP' (f1Bmax/KD) and V3” (f2Bmax/KD). While BP requires no assumptions about differences or their lack in f1 (free fraction of the radioligand in plasma) or f2 (free fraction of the radioligand in the brain), it does require an arterial input function. V3“, however, does not require an input function, eliminating the need for arterial cannulation and the measurement of an input function measurement and the rate of metabolism of the radioligand. We have previously shown that compartmental modeling is the best method for quantification of 5-HT1A binding using [11C]WAY-100635 (Parsey et al, 2000). Subsequently, we found that women have higher BP but not V3” compared with age-matched men in several regions of interest (ROI) (Parsey et al, 2002). We also found that women have significantly higher cerebellar VT compared with men, raising the question of whether 5-HT1A receptors are present in the cerebellum. As noted before, the cerebellum has been thought to possess very few, if any, 5-HT1A receptors (Hall et al, 1997). Using the estimates of receptor density from Table 2 (Hall et al, 1997), the white matter 5-HT1A density after buspirone is 3.46 fmol/mg tissue and the total cerebellar 5-HT1A density in cerebellum is 6.26 fmol/mg tissue. If we assume that the white matter density after buspirone is a measure of nonspecific binding and the total cerebellar binding is specific and nonspecific, then we can estimate that roughly 48% (6.26–3.46/6.26) of the cerebellar VT represents specific binding. We examined a human postmortem cerebellum as a guide for determining a subregion of the human cerebellum that had the fewest Detectable 5-HT1A in PET scans. We then examined the effects of this new reference region on the determination of BP and V3“ in our man-woman comparison and on test-retest reproducibility, time stability, and identifiability of BP. The delineation of an appropriate reference region is vital for the determination of specific binding and the interpretation of brain-imaging studies.
Effect of reference region on test-retest, identifiability, and time stability of binding potential
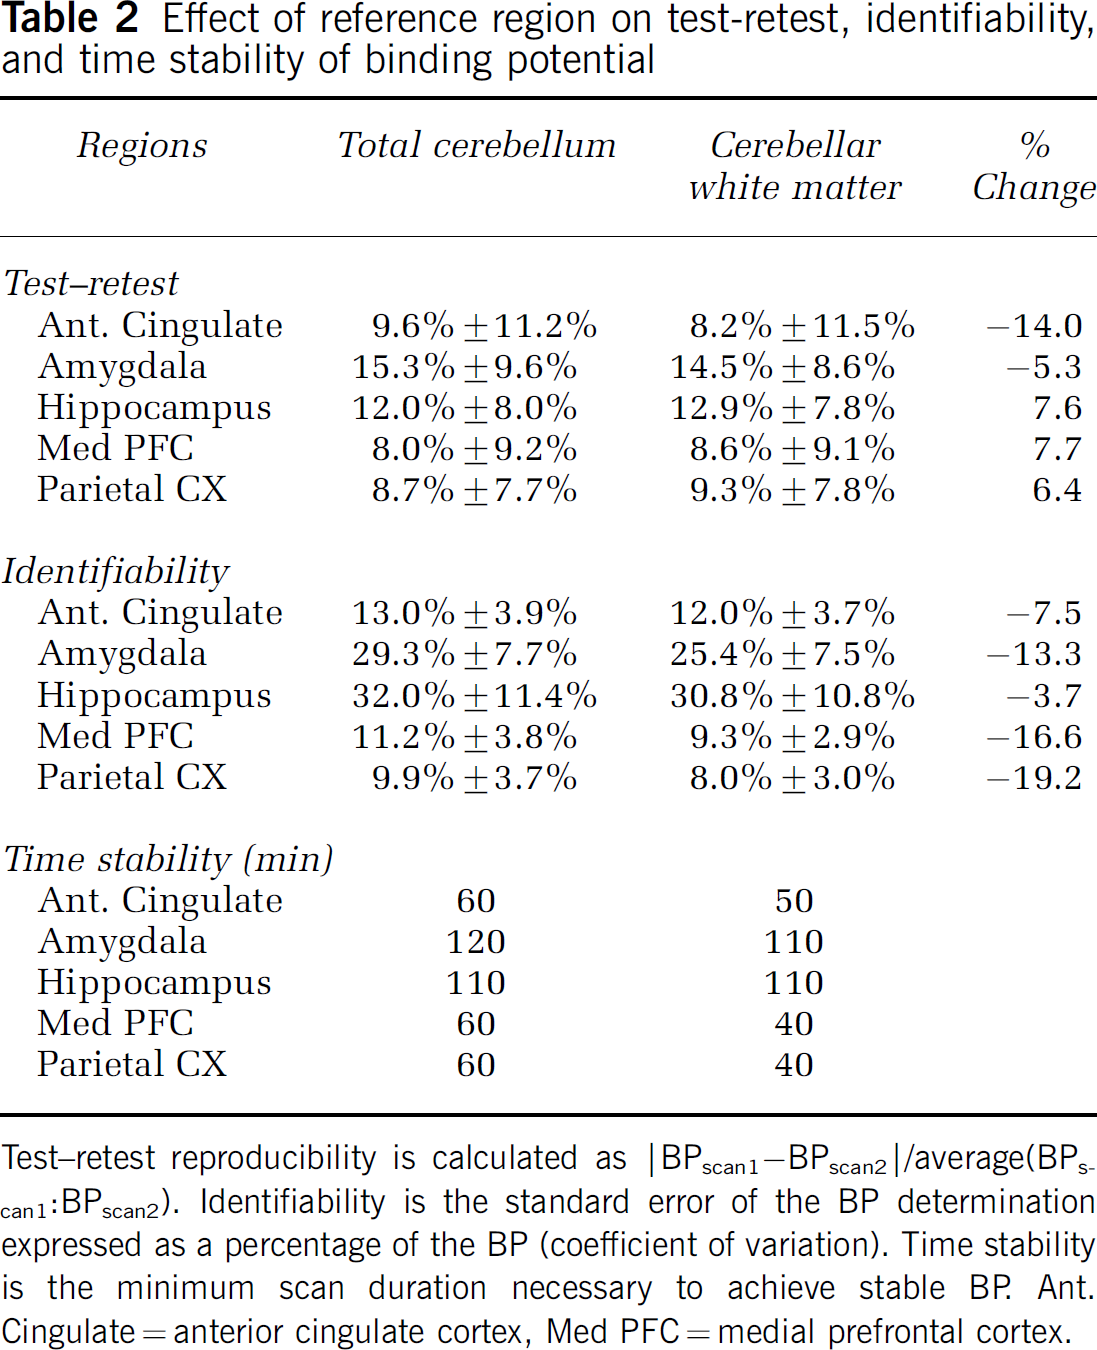
Test-retest reproducibility is calculated as |BPscan1-BPscan2|/average(BPscan1BPscan2). Identifiability is the standard error of the BP determination expressed as a percentage of the BP (coefficient of variation). Time stability is the minimum scan duration necessary to achieve stable BP. Ant. Cingulate = anterior cingulate cortex, Med PFC = medial prefrontal cortex.
Materials and methods
Data from 12 healthy women (ages 41.0±15.7 years) and 13 healthy men (ages 39.6±15.5 years) previously studied (Parsey et al, 2002) were re-examined for this study. Men and women did not differ in age (P = 0.83), the injected dose (P = 0.78), injected mass (P = 0.40), or clearance of the [11C]WAY-100635 compound (P = 0.33). Study criteria for healthy volunteers included: (1) age 18 to 65 years; (2) absence of medical, neurological, and psychiatric history (including alcohol and substance abuse or dependence) based on a complete structured psychiatric interview with the SCID-NP and SCID II, medical examination and laboratory tests; (3) absence of any medications for at least 2 weeks; (4) absence of exposure to 3,4-methylenedioxymethamphetamine (MDMA, ecstasy); (5) absence of significant medical conditions including a history of head injury with loss of consciousness; and (6) absence of pregnancy. Volunteers with a history of a mood or psychotic disorder in their first-degree relatives were excluded. All subjects were off all medications (prescription, over the counter, or herbal) for at least 2 weeks before the imaging day, and this was verified before the scan by a urine drug screen. None of the women were on hormone replacement therapy. Women were not scanned at the same time during their estrous cycle because it does not affect 5-HT1A binding in any region except the hypothalamus (Flugge et al, 1999), a region that has so few receptors that it cannot be distinguished in vivo and is not quantified in this study. The Institutional Review Boards of Columbia University Medical Center and the New York State Psychiatric Institute approved the protocol. Subjects gave written informed consent after an explanation of the study.
PET Acquisition
Imaging (Parsey et al, 2000) and preparation of [11C]WAY-100635 (Hwang et al, 1999) were performed as described previously. Briefly, after an Allen test and subcutaneous administration of 2% lidocaine, a catheter was inserted in the radial artery. A venous catheter was inserted in a forearm vein on the opposite side. Fiducial markers filled with 11C (approximately 2 μCi marker at the time of injection) were taped on the subject's head. Head movement was minimized with a polyurethane head immobilizer system (Soule Medical, Tampa, FL, USA), molded around the head of the subject. PET imaging was performed with the ECAT EXACT HR + (Siemens/CTI, Knoxville, TN, USA) (63 slices covering an axial field of view of 15.5 cm, axial sampling of 2.46 mm, in 3D mode. A 10-min transmission scan was acquired before injection. After injection of [11C]WAY-100635 as an intravenous bolus over 45 secs using an injection pump, emission data were collected for 110 mins as 20 successive frames of increasing duration (3 × 20 secs, 3 × 1 min, 3 × 2 mins, 2 × 5 mins, 9 × 10 mins). Images were reconstructed using the 3D-RP algorithm implemented on a vector processor (CTI, Knoxville, TN, USA) to a 128 × 128 matrix (pixel size of 1.7 × 1.7 mm2) with attenuation correction and a Shepp 0.5 filter (cutoff 0.5 cycles/projection rays) resulting in an in-plane and axial resolution (i.e. full width half-maximum) of 4.4 mm and 4.1 mm in air and at the center of the field of view (Brix et al, 1997). Scatter correction was performed using the technique implemented by the manufacturer (Watson et al, 1995).
Image Analysis
Image analysis was performed using MEDX software (Sensor Systems, Inc., Sterling, VA, USA). All PET images were coregistered within a dynamic study to the previous frame using the Oxford Centre for Functional Magnetic Resonance Imaging of the Brain (FMRIB) Linear Image Registration Tool (FLIRT) (Jenkinson et al, 2002). The dynamic scans were reviewed in a cine or ‘movie’ mode with overlaid grids to verify the accuracy of the motion correction. No correction for transmission-emission mismatch was attempted. PET frames were then coregistered to the MRI using FLIRT. This coregistration step was verified by loading all MRI drawn ROI (see below) on the coregistered PET image. Regions of interest were traced as previously described (Parsey et al, 2000). Three cerebellar regions were drawn, including the total cerebellum (CT), cerebellar vermis (CV), and cerebellar cortex white matter (CW). Data analysts were masked to subject sex.
Input Function Measurement
Input function and measurement of metabolites was conducted as described previously (Parsey et al, 2000). Briefly, after radiotracer injection, 30 arterial samples were collected every 5 secs with an automated sampling system for the first 2 mins, and manually thereafter at longer intervals. After centrifugation (10 mins at 3800 g), plasma was collected in 200-μL aliquots and radioactivity was counted in a gamma counter (Wallac 1480 Wizard 3 M Automatic Gamma Counter). Five samples were processed to measure the fraction of unmetabolized [11C]WAY-100635 by high-pressure liquid chromatography (HPLC). The five measured unmetabolized [C-11]WAY-100635 fractions were fit with the Hill function (Gunn et al, 1998). The input function was the product of total counts and interpolated unmetabolized [11C]WAY-100635 fraction. The measured input function values (Ca(t), μCi/mL) were fit to a straight line from time zero to the peak followed by the sum of three exponentials after the peak. The fitted values were used as input to the kinetic analysis. For the determination of the plasma free fraction (f1), triplicate 200-μL aliquots of plasma collected before injection were mixed with a radiotracer, pipetted into ultrafiltration units (Centrifree, Amicon, Danvers, MA, USA) and centrifuged at room temperature (20 mins at 3800g). Plasma and ultrafiltrate activities were then counted, and f1 was calculated as the ratio of ultrafiltrate to total activity concentrations (Cleare and Bond, 2000).
MRI Acquisition and Analysis
MRIs were acquired on a GE 1.5 T Signa Advantage system. A sagittal scout (localizer) was performed to identify the AC-PC plane (1 min). A transaxial T1-weighted sequence with 1.5 mm slice thickness was acquired in a coronal plane orthogonal to the AC-PC plane over the whole brain with the following parameters: three-dimensional SPGR (Spoiled Gradient Recalled Acquisition in the Steady State); TR 34 msecs; TE 5 msecs; flip angle 45°; zero gap; 124 slices; field of view 22 × 16 cm2; with 256 × 192 matrix, reformatted to 256 × 256, yielding a voxel size of 1.5-mm x 0.9 mm x 0.9 mm; time of acquisition of 11 mins.
Raw coronal MRI images were cropped to remove nonbrain material utilizing the exbrain v.2 utility (Lemieux et al, 2003). On the rare occasion where exbrain was unable to process a MRI, the Oxford Centre for FMRIB Brain Extraction Tool (BET) v1.2 (Smith, 2002) was used along with manual removal of nonbrain matter left after utilizing BET. The FMRIB's Automated Segmentation Tool (FAST) v3.3 (Zhang et al, 2001) was then used to segment MRI images into three classes, gray matter, white matter, and cerebrospinal fluid. The segmentation routine we employed does not correctly classify tissue types in subcortical regions or the cerebellum and hence was not used in these regions.
Quantitative Analysis
Regional distribution volumes of [11C]WAY-100635 were derived from kinetic analysis using the arterial input function and a two-tissue compartment (2T) model as the general framework (see Parsey et al (2000) for details). The model included the arterial plasma compartment (Ca), the intracerebral free and nonspecifically bound compartment (nondisplaceable compartment, C2), and the specifically bound compartment (C3).
The equilibrium distribution volume of a compartment i (V i , mL/g) was defined as the ratio of the tracer concentration in this compartment to the free plasma concentration at equilibrium

V2 and V3 were defined as the distribution volumes of the second (nondisplaceable) and third (specific) compartments, respectively. V3 is equal to the ratio of the receptor density (Bmax, nmol/L per g of tissue) and affinity (1/KD, nmol/L per mL of brain water) (Laruelle et al, 1994; Mintun et al, 1984). VT was defined as the total regional equilibrium distribution volume, equal to the sum of V2 and V3. Given the presence of 5-HT1A receptors in the cerebellum (see Results), we refer to quantification of radiotracer in the cerebellum as VT and not V2.
The contribution of plasma total activity to the regional activity was calculated assuming a 5% blood volume in the ROI and subtracted from the regional activity before analysis. All kinetic parameters were derived by nonlinear regression using a Levenberg-Marquart least-squares minimization procedure implemented in MATLAB (The Math Works, Inc., South Natick, MA, USA). Given the unequal sampling over time (increasing frame acquisition time from beginning to end of the study), the least-squares minimization procedure was weighted by the square root of the frame acquisition time. Determination of BP, Akaike Information Criteria (AIC), test-retest reproducibility, identifiability, and time stability was performed as described previously (Parsey et al, 2000). As before, the parameter (VT or BP) was considered stable relative to scan duration after time t if all results derived from time t to 120 mins had a mean within 10% of the reference value and a standard deviation that did not exceed 15% of the mean.
Quantitative Receptor Autoradiography of the Cerebellum
The human postmortem tissue was from one healthy control without any DSM-IIIR diagnosed psychiatric condition on the basis of a psychological autopsy and free from any drugs on the basis on toxicological analysis of blood, urine, and brain. Neuropathological examination ruled out neurological disorders. We used [3H]WAY-100635 (82.0 Ci/mmol/L; Amersham, England) to label 5-HT1A receptors. Large horizontal cerebellar sections taken through the dentate nucleus (20 μm) were mounted on glass slides and preincubated for 30 mins at 23°C in 50 mmol/L Tris buffer (pH 7.7) containing 4 mmol/L CaCl2. Total binding was determined with 2 nmol/L of [3H]WAY-100635 for 60 mins (23°C). Nonspecific binding was determined in parallel incubation in the presence of 1 μmol/L 5-HT. After the incubations, sections were washed twice in ice-cold buffer for 10 mins and briefly dipped in ice-cold deionized water to remove buffer salts. Sections were quickly dried under a stream of desiccated cold air, and exposed to a tritium-sensitive film (Hyperfilm, Amersham), alongside tritium standards (American Radiolabeled Chemicals, Inc., St Louis, MO, USA). After 8-week exposure at 4°C, films were developed, fixed and quantified as previously described (Arango et al, 1995).
Results
In Vitro Receptor Autoradiography
In the human cerebellum 5-HT1A binding is greatest in the CV (2.12 ± 0.14 fmol/mg tissue) followed by the cerebellar cortex, with the least number of binding sites in the CW (0.03 ± 0.01 fmol/mg tissue, Figure 1). For comparison purposes, Hall et al (1997) report the highest binding of 128 fmol/mg tissue in the entorhinal cortex and intermediate binding of 50 fmol/mg tissue in the insular cortex. Based on the distribution of specific binding, we drew ROI on CW and CV (Figure 2) on MRI and transferred the regions to coregistered PET images. We could not distinguish the individual components of the vermis on MRI or PET and therefore included the entire structure.
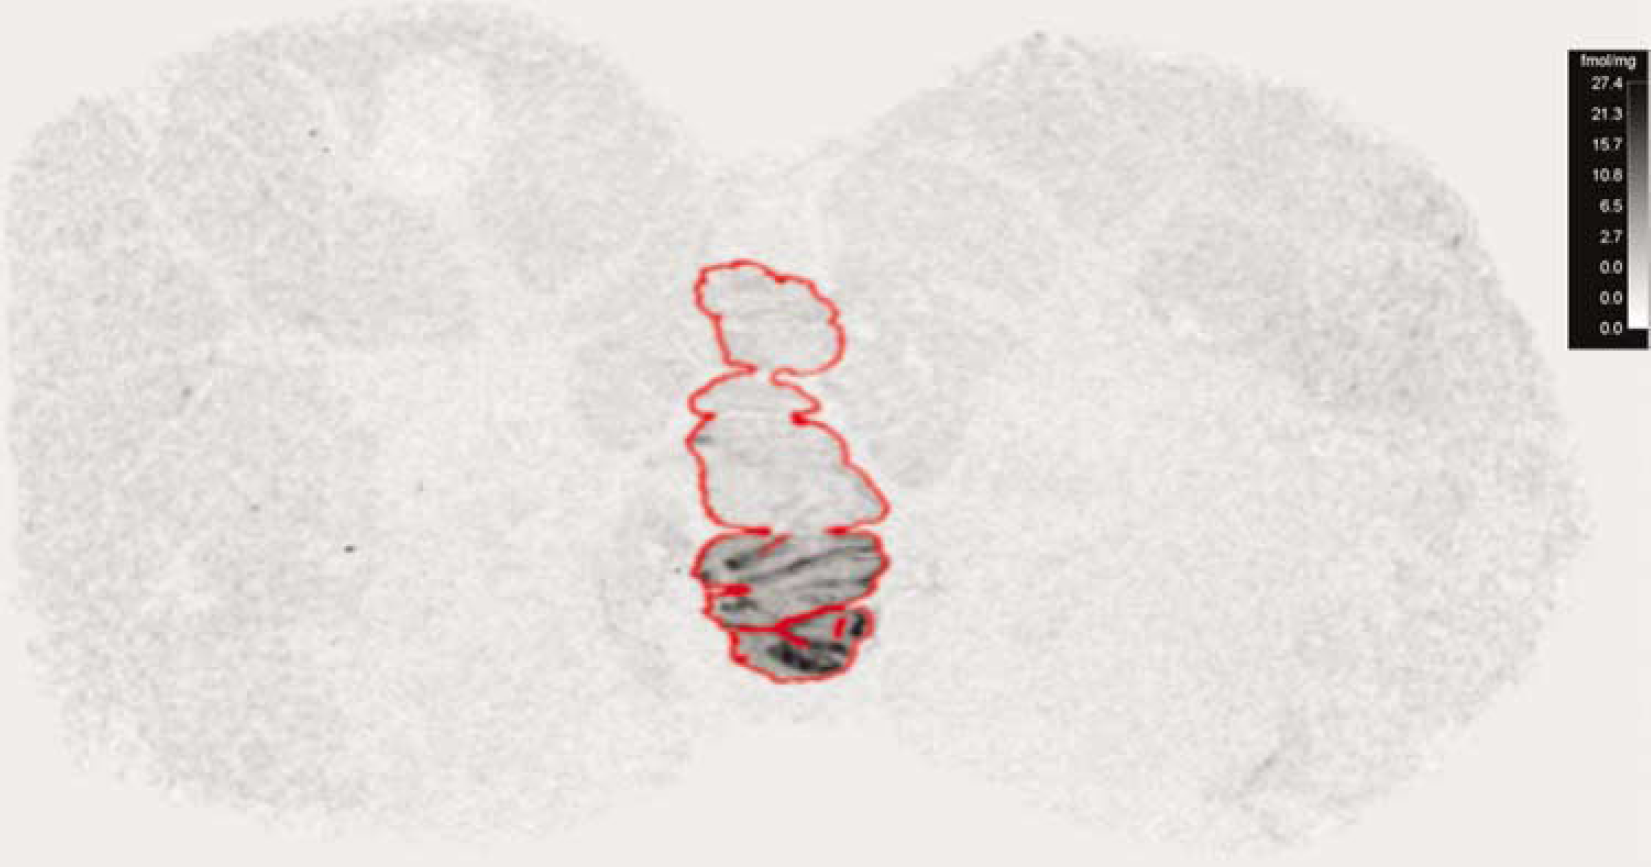
Axial postmortem autoradiogram of the human cerebellum using [3H]WAY-100635. Outline indicates the CV. Calibration bar in the upper left hand corner in fmol/mg tissue.
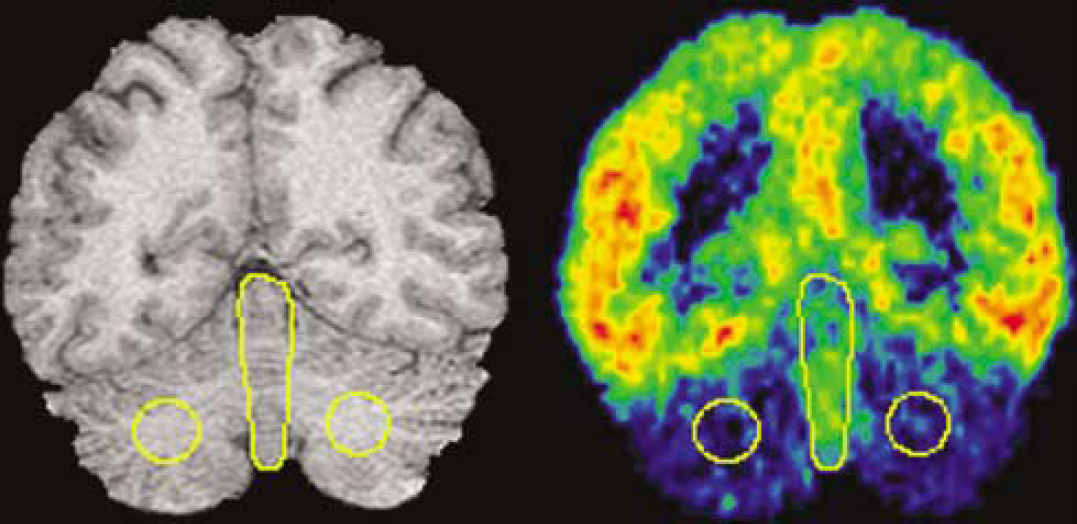
Determination of cerebellar reference region by MRI (left panel) and coregistered [11C]WAY-100635 scan (right panel). The circular ROI is intended to measure nonspecific binding in the CW and the single large centered ROI is intended to measure 5-HT1A receptors in the CV.
In Vivo Quantification of Cerebellar Subregions
As expected from our autoradiography findings (Figure 2), there is a significantly higher cerebellar VT in the CV compared with the CW in vivo (P<0.001, Figure 3). Based on the apparent lack of 5-HT1A receptors in CW, we explored the optimal model for quantifying [11C]WAY-100635 binding in CW. Several ligands (Frost et al, 1989; Ito et al, 1998; Lammertsma and Hume, 1996; Logan et al, 1990), including [11C]WAY-100635 (Farde et al, 1998; Gunn et al, 1997; Parsey et al, 2000), require the use of a 2T model in the cerebellum where in the absence of specific binding theoretically a 1T model should suffice. One possible explanation for this discrepancy is the presence of receptors in the reference region. Using data from the CT (the reference region most commonly used in imaging studies), a 1T model is clearly insufficient to describe the data (Figure 4A). If CW is truly devoid of 5-HT1A receptors, then we hypothesized that a 1T model is sufficient to describe the CW time-activity curve (TAC). The fit of the CW TAC with the 1T model appears to be adequate (Figure 4B). As expected, the goodness of fit for a 2T model is better than for the 1T model, but the AIC is not significantly different between the two models (Table 1). The identifiability of the cerebellar VT was significantly worse with a 2T model compared with the 1T model (Table 1). Finally, the time stability of 1T CW is better than 2T; the mean 1T fit is within 95% of the entire data set with data sets as short as 20 mins, whereas the mean VT from the 2T fits deviates to 105% just by decreasing the data set by one time point (100 mins compared with 110 mins). Gross visual inspection of all slices of all PET studies confirmed that there was no region of the brain with lower radioligand uptake than the CW.
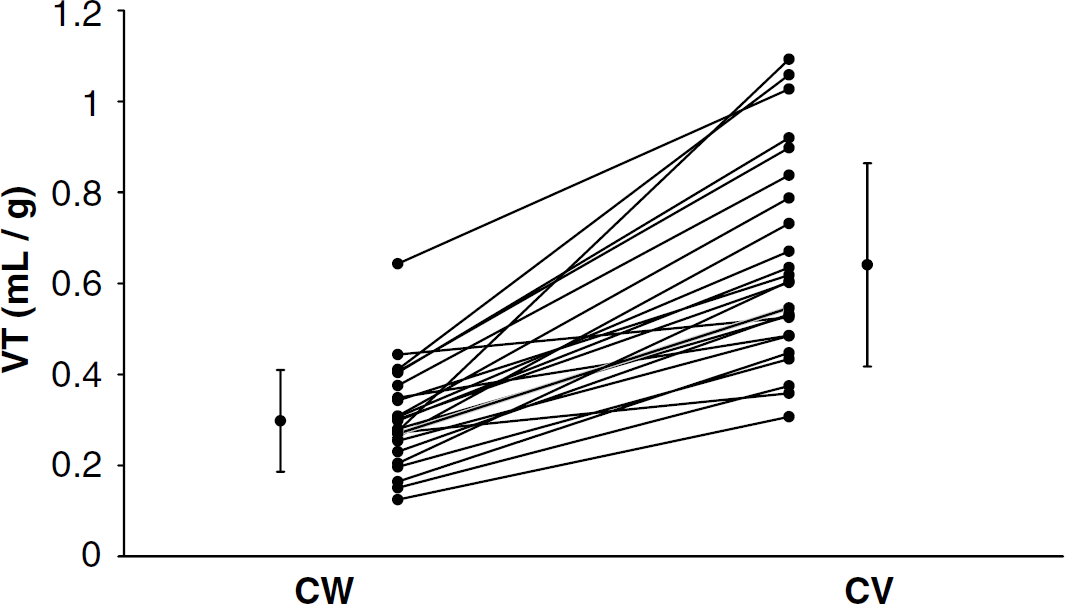
Significantly lower cerebellar VT in CW compared with CV (P<0.001). Lines connect determinations made in the same subject. Symbols to the far left and right of the figure reflect the mean and standard deviation of CW and CV, respectively.
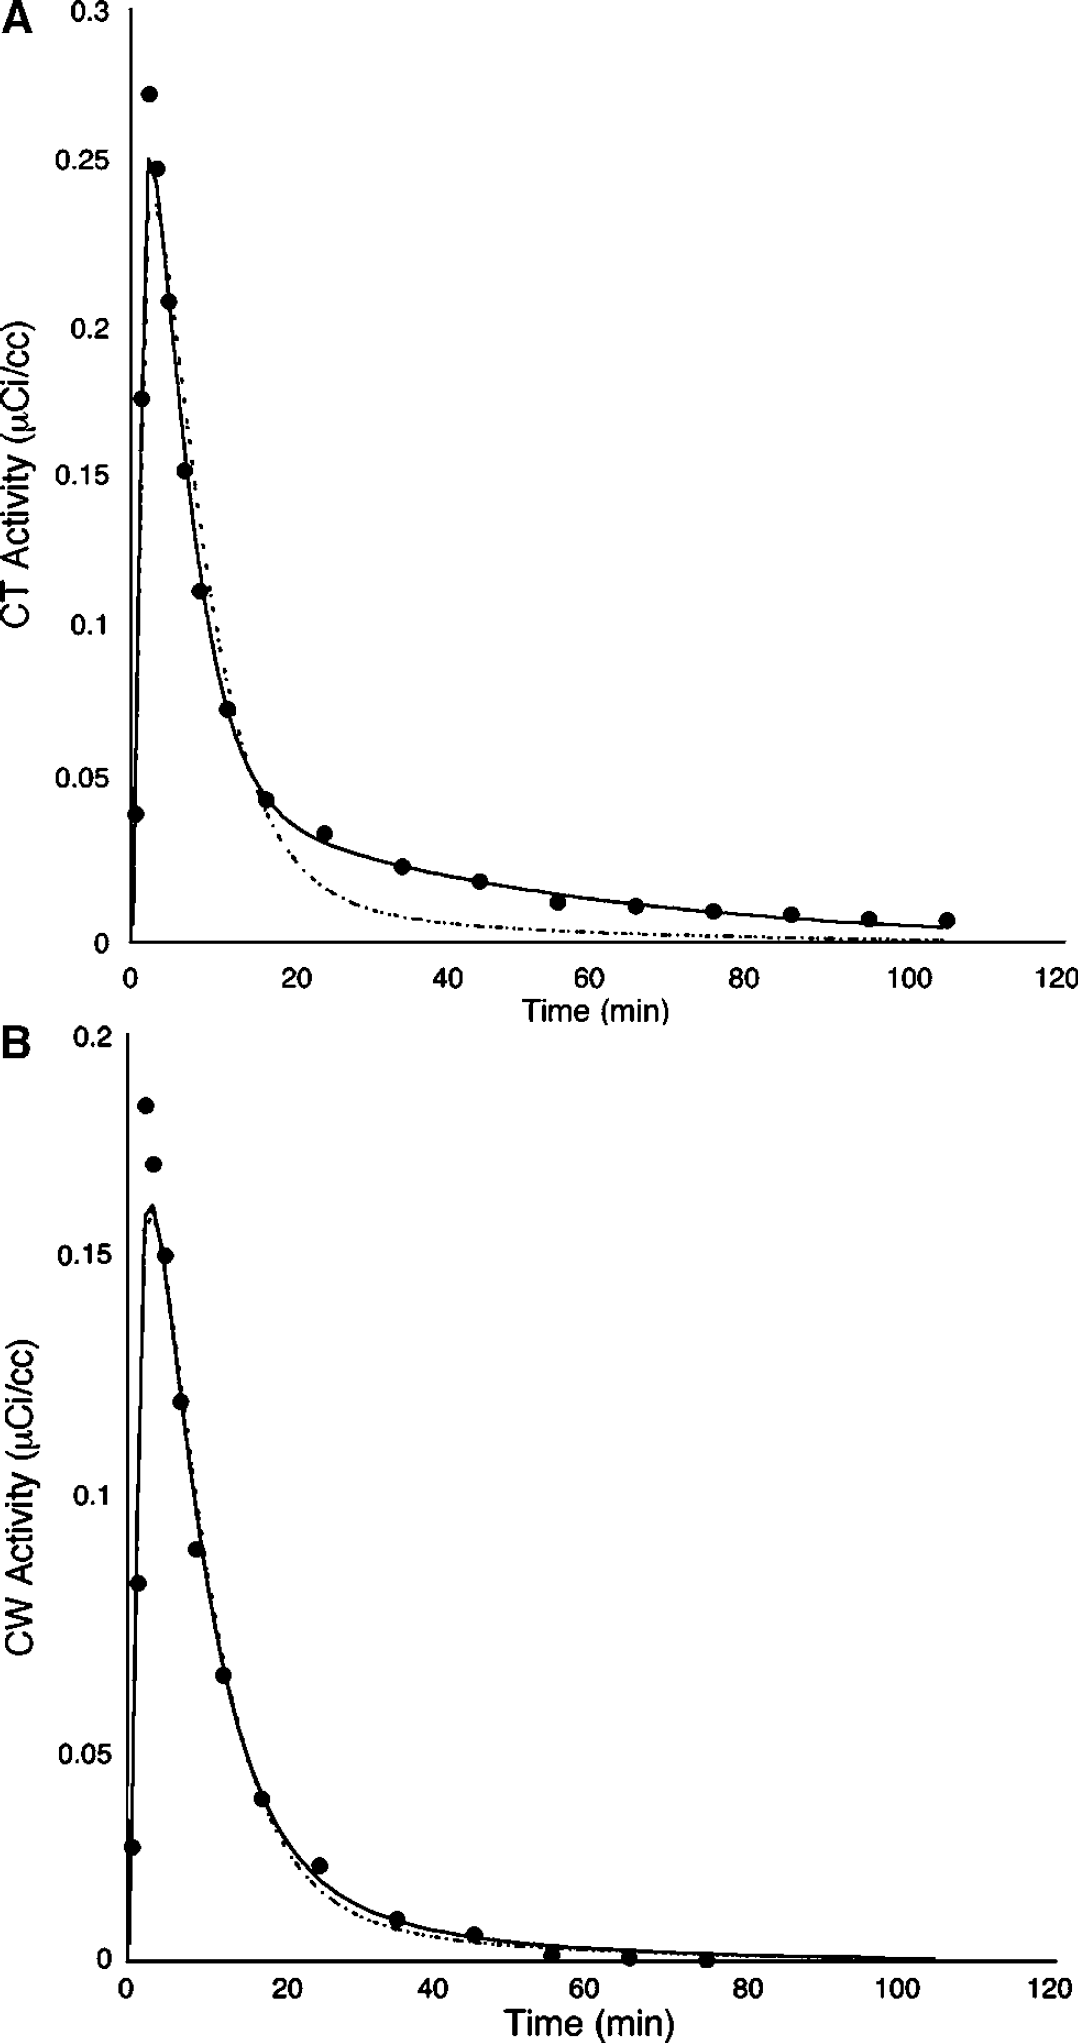
One-tissue (dashed lines) and two-tissue (solid lines) compartmental kinetic modeling fits to the CT data (
Comparison of 1 tissue and 2 tissue models of the cerebellar white matter
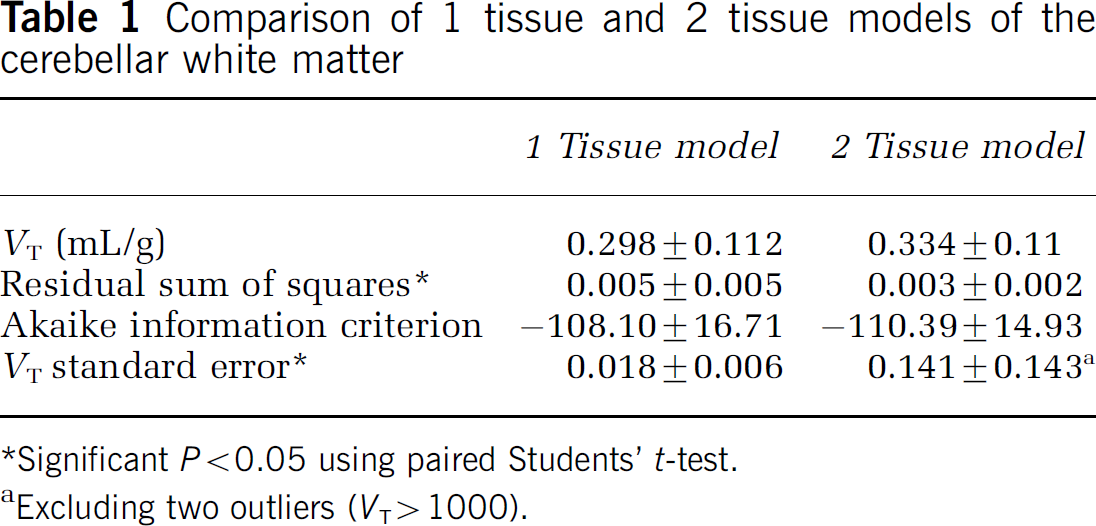
Significant P<0.05 using paired Students' t-test.
Excluding two outliers (VT>1000).
Sex Effects on [11C]WAY-100635 Binding
Having defined a reference region with few or no 5-HT1A receptors (CW), we reexamined our previous finding of a difference in cerebellar VT between men and women. There is a small but significantly (P<0.05) higher CW VT in women (0.351 ± 0.130 mL/g) compared with men (0.249 ± 0.065). The difference in CW VT is not due to differences in the amount of [11C]WAY-100635 free in the plasma (f1) as CW VT after correcting for f1 is still significantly higher in women (3.93 ± 1.18) than in men (2.81 ± 0.90, P = 0.016).
In our previous analysis using the total cerebellar ROI as a reference region, BP was 33% higher in women compared with men in the hippocampus (HIP, P = 0.006). V3” was 11% higher (P = 0.111). Using CW as the reference region, BP is still 35% higher (P = 0.001) and V3“ is 11% higher (P = 0.012).
Effect of Reference Region on Binding Potential Determination
The above data suggest that CW is a more appropriate reference region for quantification of 5-HT1A receptors using [11C]WAY-100635 based on the presence of receptors in subregions of the cerebellum. We also examined the effects of the reference region on the test-retest reproducibility, identifiability, and time stability of BP (Table 2) determination on previously acquired and published data (Parsey et al, 2000). There are no statistically significant differences in test-retest reproducibility when using CW or the CT as the reference region. Using CW, test-retest reproducibility improves modestly in some regions and worsens in others. The identifiability of BP improves in every region between 3.7% and 19.2%. Time stability is either the same or better in every region.
Discussion
In vitro receptor autoradiography of 5-HT1A sites in the human cerebellum shows a regional heterogeneity in 5-HT1A receptors, which is greatest in the CV and least in CW. This postmortem analysis was not intended to be an exhaustive examination of the anterior-posterior extent of the cerebellum because the resolution of the PET imaging limits our ability to accurately quantify binding in smaller ROIs. The postmortem results guided us in in vivo determination of ROIs in the cerebellum. We could identify the CW and CV regions on MRI and observed qualitatively and quantitatively that the CV had higher [11C]WAY-100635 binding than CW and that it did not appear by gross examination that there was any region of the brain with lower binding than CW. Furthermore, binding in CW could be best modeled with a 1T model as expected if the region were truly devoid of 5-HT1A receptors. Choosing CW as a reference region does not alter the test-retest reproducibility of BP, but does improve its identifiability and time stability. Thus, CW appears to be the optimal reference region for future studies of 5-HT1A binding.
The use of a white matter-based reference region is supported by in vitro human autoradiographic studies which show that nonspecific binding, as assessed by either 8-OH-DPAT, pindolol, or buspirone displacement of the WAY-100635 compound, reveals no differences in the remaining nonspecific binding between gray and white matter (see Figure 7; Hall et al, 1997). It is possible that the radiotracer may preferentially partition in gray or white matter; however, based on our data and Table 2 of Hall et al (1997), there is no region of the brain that has fewer receptors than the white matter. The thalamus and dorsal caudate, regions with gray and white matter, have VT on the same order of magnitude as CW (0.50 ± 0.18 and 0.37 ± 0.13, respectively). If there were a differential partitioning between gray and white matter, the consequences of this are minimal to undetectable in the BP outcome measure. As stated in Results, whether we choose CW or the CT as the reference region, the difference in BP between men and women is detectable and of the same magnitude. This issue could best be addressed in future studies after a fully blocking dose of a 5-HT1A antagonist. In addition, an alternative explanation for the need for only a 1T model in the CW could be due to regional heterogeneity in the cerebellar subregions, that is, changes in K1 or k2. Given the autoradiography data this seems unlikely, but this possibility could be explored by studies before and after fully saturating doses of WAY-100635. The fact that the total cerebellar TAC is best fit by a 2T compartment might be a result of subregions of the cerebellum having different 1T kinetics.
As we have shown previously (Parsey et al, 2002), only when we use BP can we detect differences between men and women in the ROI analysis. Using either the CT or CW, when using V3”, from the simplified reference tissue model (SRTM; Lammertsma and Hume, 1996) or any other method, one cannot detect a difference in ROI binding between men and women, presumably due to the much larger impact of difference in V2 values on V3“ (BP/V2) as an outcome measure compared with BP (V3-V2/f1). Consequently, an arterial input function is still required because without an arterial input these differences in the cerebellum would be undetectable, and the only outcome measure related to binding using reference tissue modeling methods is V3”.
An assumption in human in vivo brain imaging studies has been that the cerebellum can be used as a reference region because there are relatively low numbers of receptors in this region. Our findings suggest that regardless of whether there are receptors in the cerebellum, there might be differences in the nonspecific binding. Such differences have to be ruled out or identified in any study of disease or treatment effect to be able to conclude that differences in outcome measures between groups or after treatment are due to changes in specific binding. CV VT is in the same direction but is not significantly different between men and women (0.593 ± 0.204 versus 0.692 ± 0.241, P = 0.276), further supporting the notion that the sex differences observed are not due to differences in receptor density.
Since the radioactivity in the blood is higher than that in the cerebellum, correction for blood volume in the modeling could potentially affect the compartmental nature of the cerebellum. We use the plasma radioactivity to correct for the blood volume contribution, as the ratio of whole blood radioactivity to plasma radioactivity does not change as a function of time. While scaling the blood volume in this way may alter the shape of the cerebellar TAC, the alteration is modest. As we showed previously (Parsey et al, 2000), changing the blood volume component from 5% to 7.5% (scaling for the plasma to whole blood ratio of approximately 2) changes BP estimation by only 1% and V3“ by 4%. Most importantly, the same blood volume correction is applied in this study for the CT and CW. This and the fact that we now know that the CV has 5-HT1A receptors suggest that CT TAC is altered by the presence of receptors. The lack of partial volume correction in the current study means the CW might be slightly overestimated by the spillover of activity from the vermis and surrounding cerebellar cortex, although the magnitude of this is small given the relative low binding in these structures compared with the cerebral cortex (see Figure 2).
In humans, [11C]WAY-100635 is metabolized to [11C]cyclohexanecarboxylic acid, but this accounts for only 21% of the radioactivity at 10 mins at its peak and is rapidly metabolized (Osman et al, 1998). The authors conclude that this metabolite most likely does not significantly affect quantification of 5-HT1A receptors using [11C]WAY-100635. Differences in CW VT between men and women are puzzling and could potentially be caused by differential uptake of the metabolite or the rate or quantity of production of the metabolite. However, using HPLC, we could not detect this metabolite in men or women.
Another possible cause for the differences in CW VT between men and women might be related to PET instrumentation or acquisition-related differences. It is unlikely that the errors are associated with deadtime or count-rate differences as our injected doses were not different between the men and women and were well below the saturation limits of the camera (Brix et al, 1997). It is also unlikely that the differences are due to differential attenuation correction as this correction was performed using each individual's 10-min transmission scan. Finally, differences could be due to differential scatter correction as men and women are known to have smaller intercranial volumes (Coffey et al, 1998).
We had previously shown that a limitation of the SRTM is that the magnitude of the discrepancy in determining V3” is determined by relative blood flow in a region (R1), the true value of k3/k4, and whether the reference region is a true 1T compartment (Slifstein et al, 2000). Even using CW (nearly a perfect 1T reference region) as a reference region results in an underestimation of V3“ as determined by SRTM relative to nonreference tissue-determined compartmental models (i.e. slope of V3” kinetic versus SRTM is 0.76, intercept 0.88).
Combining human postmortem autoradiography and fully quantitative receptor modeling, we have identified a cerebellar reference region that can be used in future quantitative 5-HT1A PET studies. Unfortunately, the sex difference in V2 precludes the use of reference tissue methods and necessitates the continued use of a metabolite corrected arterial input function.
Footnotes
Acknowledgements
The technical staff of the Brain Imaging Division and the Kreitchman PET Center at Columbia University assisted in conducting the PET studies and aspects of image analysis. Suham A Kassir contributed to the autoradiography work. This work was supported by US PHS grants MH62185, MH40695, MH62185, MH40210, and MH01603, NARSAD, American Foundation for Suicide Prevention, and the Stanley Research Foundation funded Center for the Applied Neuroscience of Bipolar Disorders.