
Abstract
To investigate the developmental changes of cerebral blood flow (CBF) and hemodynamic responses to changing neural activity, we used the arterial spin label (ASL) technique to measure resting CBF and simultaneous CBF / blood-oxygen-level dependent (BOLD) signal changes during visual stimulation in 97 typically developing children and young adults (age 13.35 [6.02, 25.25] (median [min, max]) years old at the first time point). The longitudinal study protocol included three MRIs (2.7 ± 0.06 obtained), one year apart, for each participant. Mixed-effect linear and non-linear statistical models were used to analyze age effects on CBF and BOLD signals. Resting CBF decreased exponentially with age (p = 0.0001) throughout the brain, and developmental trajectories differed across brain lobes. The absolute CBF increase in visual cortex during stimulation was constant over the age range, but the fractional CBF change increased with age (p = 0.0001) and the fractional BOLD signal increased with age (p = 0.0001) correspondingly. These findings suggest that the apparent neural hemodynamic coupling in visual cortex does not change after age six years, but age-related BOLD signal changes continue through adolescence primarily due to the changes with age in resting CBF.
Introduction
Dynamic changes in cerebral blood flow (CBF) during brain activity are the basis for many functional neuroimaging techniques, including the non-invasive functional magnetic resonance imaging (fMRI). Functional MRI is an indirect measurement of changes in neural activity via hemodynamic responses. The signal in the widely used blood oxygenation level dependent (BOLD) fMRI reflects the interplay among dynamic changes of CBF, cerebral metabolic rate of oxygen (CMRO2), and cerebral blood volume (CBV) in response to changing neural activity.1,2 In general, BOLD signal change (ΔBOLD) is positively associated with CBF change (ΔCBF) but is also affected by changes of other coupling factors. Despite efforts to understand hemodynamic responses to neural events and develop mathematical models for these relationships, 3 knowledge of neuro-hemodynamic brain responses is incomplete, and even less is known about developmental changes in neuro-hemodynamic coupling processes of the human brain. While BOLD fMRI is increasingly used in children to study developmental changes of brain function, clarification of the developmental changes of neural-hemodynamic coupling in the brain will aid design and interpretation of fMRI studies of cognitive functions in children4,5 and provide new insights into processes of the brain maturation.
Resting CBF, CBV, and CMRO2 have distinct developmental trajectories. The earliest studies of developmental changes of brain hemodynamics used positron emission tomography (PET) and were often limited to small patient populations because of radioactive exposure from PET tracers. Nevertheless, these studies showed that global CBF increases from newborn to about age five to seven years old, and then decreases with age through adolescence and regional differences of the CBF developmental trajectory were also noted.6,7 The introduction of arterial spin labeling (ASL) MRI techniques 8 to measure CBF non-invasively facilitated large-scale studies of brain hemodynamics in typically developing children.9–11 These studies corroborated the major findings from early PET studies and revealed more detailed patterns of CBF changes with age effects on regional developmental trajectories. The ASL technique also allows simultaneous measurement of CBF and BOLD signal changes to neural activity, providing a crucial tool to investigate the relationships between BOLD and CBF responses. Several recent studies have used simultaneous CBF and BOLD measurement to study developmental changes in brain responses during auditory,12,13 motor, 14 and memory 15 tasks. While the resting CBF was consistently shown decreasing with age during developmental years, the age effects on dynamic changes of absolute CBF, fractional CBF, and fractional BOLD signal to neural activities were unclear among these studies.
Here, we report longitudinal measurements of simultaneous CBF and BOLD visual responses in a large sample of typically developing children and healthy young adults (age 6 to 27 years). Based on previous studies in which the resting global or lobar CBF decreased with age from six year to young adulthood, and BOLD signal models of the complex relationships between CBF and BOLD signal, we hypothesized a significant age effect on BOLD signal in this age range, and sought to develop a statistical model to support planning and analysis of fMRI studies in pediatric populations. We measured the resting CBF of the whole brain and characterized the age effects on the resting CBF for four brain lobes (frontal, temporal, parietal, and occipital). In a separate session among the same participants, we measured simultaneous BOLD and CBF responses to visual stimulation and investigated the age effects on the BOLD and CBF responses. With a large sample and longitudinal data, the results revealed the developmental pattern of CBF, its effect on BOLD signal in fMRI studies, and added new insights in this area of research.
Material and methods
Participants
The study was approved by the St. Jude Children’s Research Hospital Institutional Review Board and conducted in accordance with the declaration of Helsinki. Written informed consent was obtained from each participant or his/her guardian and children also gave informed assent to participate in the study. All participants were native speakers of English with no history of central neural system injury or disease, no history of attention deficits or learning disability, no major physical, neurological, or psychiatric condition, having not been treated with psychostimulants or psychotropic medications within two weeks before MRI, and not wearing orthodontic appliances. Ninety-seven (39 females and 58 males) typically developing children and healthy young adults (age 13.35 [6.02, 25.25] (median [min, max]) or 13.58 ± 0.53 (mean ± stderr) years old at the first time point) were enrolled for the study. The study protocol included three MRI measurements, one year apart, for each participant. Figure 1 illustrates the timeline and age-distribution of the participants obtained for the study.
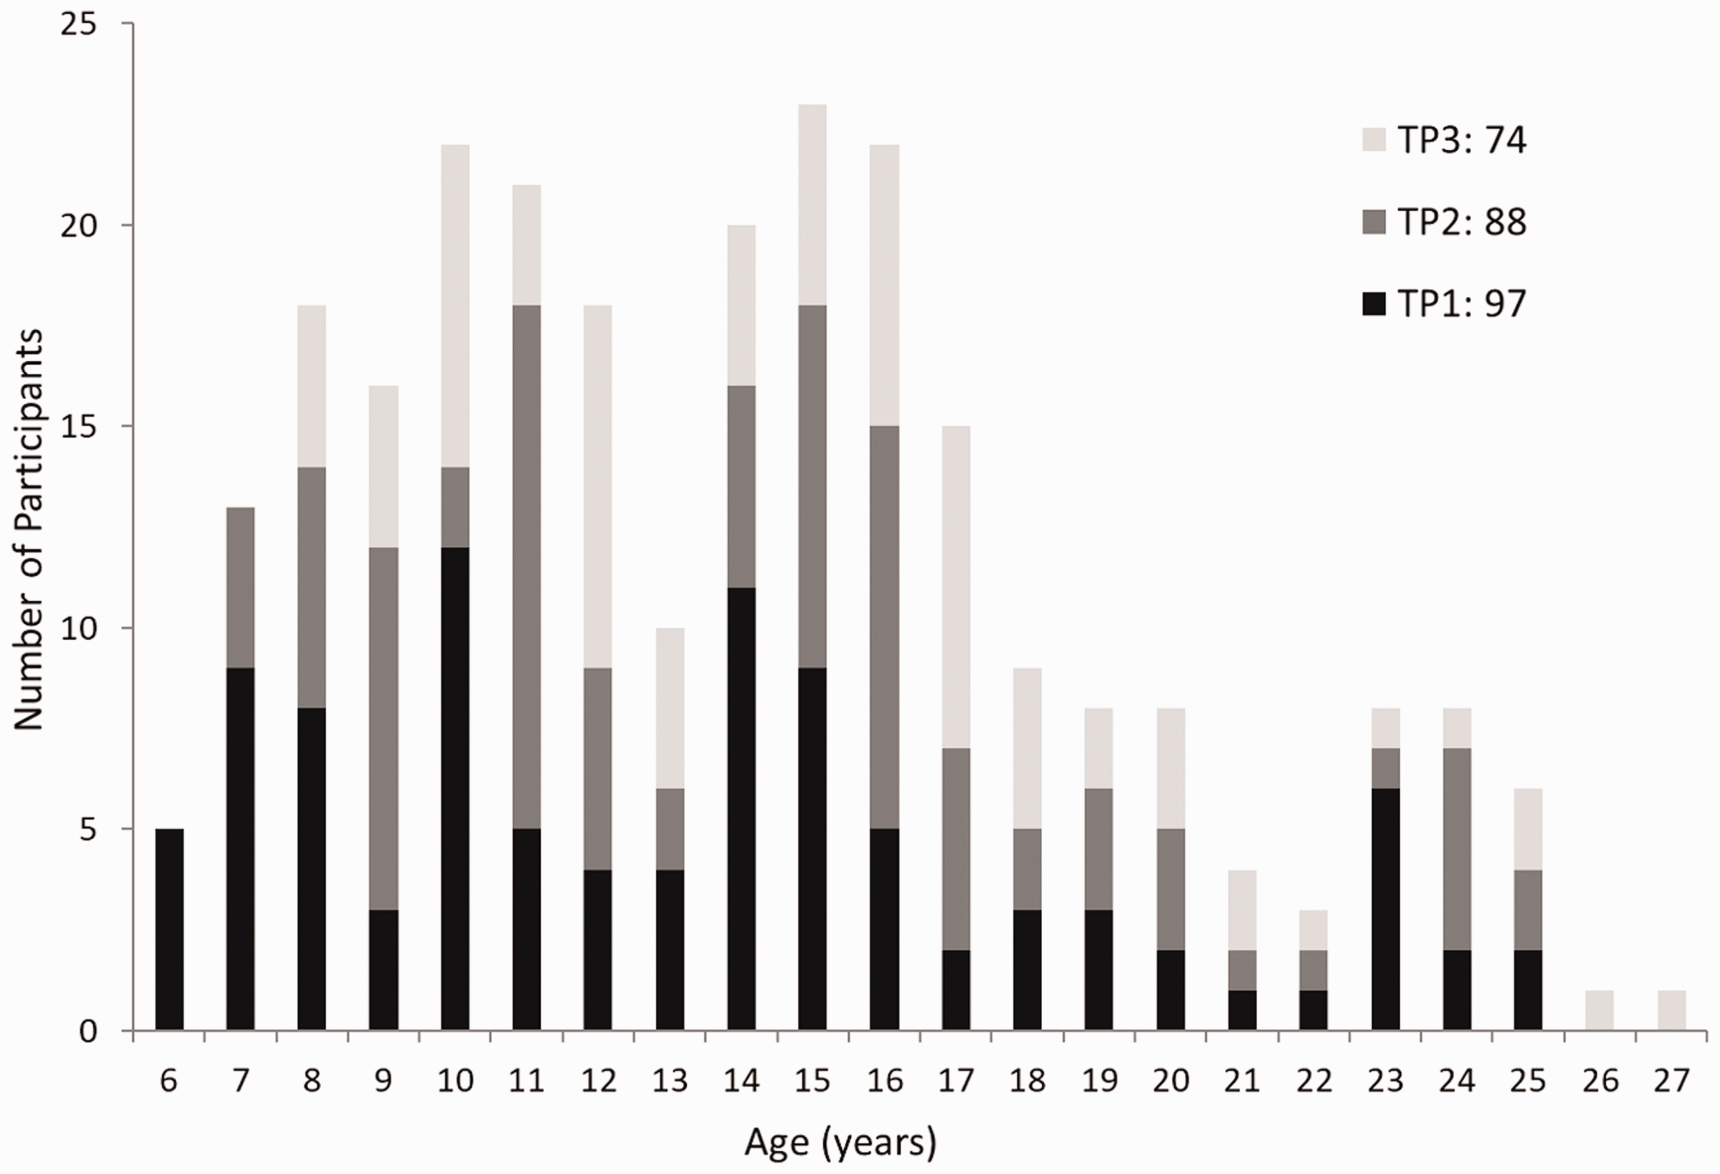
Age distribution of participants. The study protocol included three MRIs, one year apart, for each participant; but some participants did not complete all three time points. The first time point (TP1, at enrollment) had 97 participants (age 13.58 ± 0.53 years old); the second time timepoint (TP2) had 88 participants (age 14.44 ± 0.52 years old); and the third time point (TP3) had 74 participants (age 15.19 ± 0.55 years old).
MRI
MRI data were acquired with a 3 T Siemens Scanner. A pulsed ASL Q2TIPS sequence, 18 with parameters TR =2270 ms, TE = 23 ms, matrix = 64 × 64, FOV = 210 ×210 mm, slice thickness = 5 mm, TI1 = 700 ms, TI1s =1200 ms, and TI2 = 1400 ms was used. The tissue equilibrium magnetization image (M0) was obtained with the sequence from the calibration scan. Two separate sets of ASL MRI data were acquired for each participant: one was during a resting condition and the other was during visual stimulation (the task fMRI condition). For the resting condition, 101 volumes (1 M0, 50 pairs of tagged and control) of ASL images were acquired in 3.8 min; and for the task fMRI condition, 175 volumes (1 M0, 87 pairs of tagged and control) of images were acquired in 6.6 min. A 3D T1 structural image (with FOV = 256 × 256 mm and matrix = 256 × 256) was also obtained for each participant and co-registered with ASL images for segmentation, normalization, and visualization purposes.
Visual stimulation paradigm
The visual stimulus was a black and white checkerboard with color reversal at 8 Hz. It was projected on a screen at the end of the magnet bore and viewed via a mirror mounted on the head coil. The stimulus was presented in a block design with 8 blocks that each consisted of 10 volumes (22.7 s) of stimulation followed by 10 volumes (22.7 s) of rest (a small fixation cross gray background). The first stimulus was on at the 15th volume. This kind of visual stimulation paradigms is simple and known to elicit strong brain activation in primary visual cortex 19 and was selected to minimize effects of developing cognitive abilities on brain neural responses in the study.
Data analysis
Resting ASL data
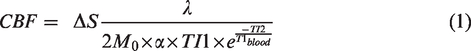
ASL images obtained without visual stimulation for each participant were realigned, averaged, and co-registered with the 3D T1 image using SPM8. The differential image (ΔS) was calculated as the difference between the average of tag images and the average of control images from ASL images. The nominal CBF value was calculated as
18
ASL images were co-registered to the 3D T1 image. The 3D T1 image was segmented into gray matter and white matter; and gray matter masks for occipital, temporal, parietal and frontal lobes were generated. The masks were applied to the co-registered CBF image to calculate an average gray matter CBF value for each lobe in each participant. The 3D T1 image was also normalized to the MNI space, and the normalization parameters were applied to the co-registered CBF image to obtain a CBF map in the MNI space for the participant. The normalized CBF maps were used to produce group average CBF maps.
ASL data with visual stimulation
The fMRI ASL images for each participant were preprocessed (realigned and smoothed) and statistically analyzed using SPM8 software (https://www.fil.ion.ucl.ac.uk/spm). The general linear model used to analyze the functional ASL time-series with visual stimulation included three covariates of interests 24 : ASL control-tag condition (a vector of alternating 0.5 and −0.5), BOLD signal activation (the convolution of stimulation paradigm and the canonical HRF), and CBF activation (modulating the BOLD regressor with the control-tag condition). Activated voxel clusters in the primary visual cortex were identified from BOLD activation, from CBF activation, and from the intersection of BOLD and CBF activations.
The ASL signal time-course was retrieved from the BOLD activation cluster for subsequent analysis. For each participant, the ROI was the 100-voxel cluster surrounding the peak of BOLD activation in the primary visual cortex. A variable threshold, usually stricter than the standard threshold (p = 0.05 FWE), was required to obtain the 100-voxel peak activation cluster because robust BOLD visual activation yielded large activation clusters in the primary visual cortex (Figure 2). Our analysis of a fixed-size cluster of peak activation differs from earlier studies that included all voxels within a primary cortex exceeding a fixed threshold.12,14 Using the same threshold, individuals with higher peak BOLD responses are likely to have more extensive activated regions, which include more voxels with low BOLD responses relative to the peak BOLD signal. Thus, for a ROI that includes all suprathreshold voxels, the calculated average BOLD response for the individual with higher peak BOLD signal may be relatively attenuated. However, the average signal from a ROI defined as a fixed-size cluster of peak BOLD activation is un-biased and more directly reflects the BOLD signal strength.
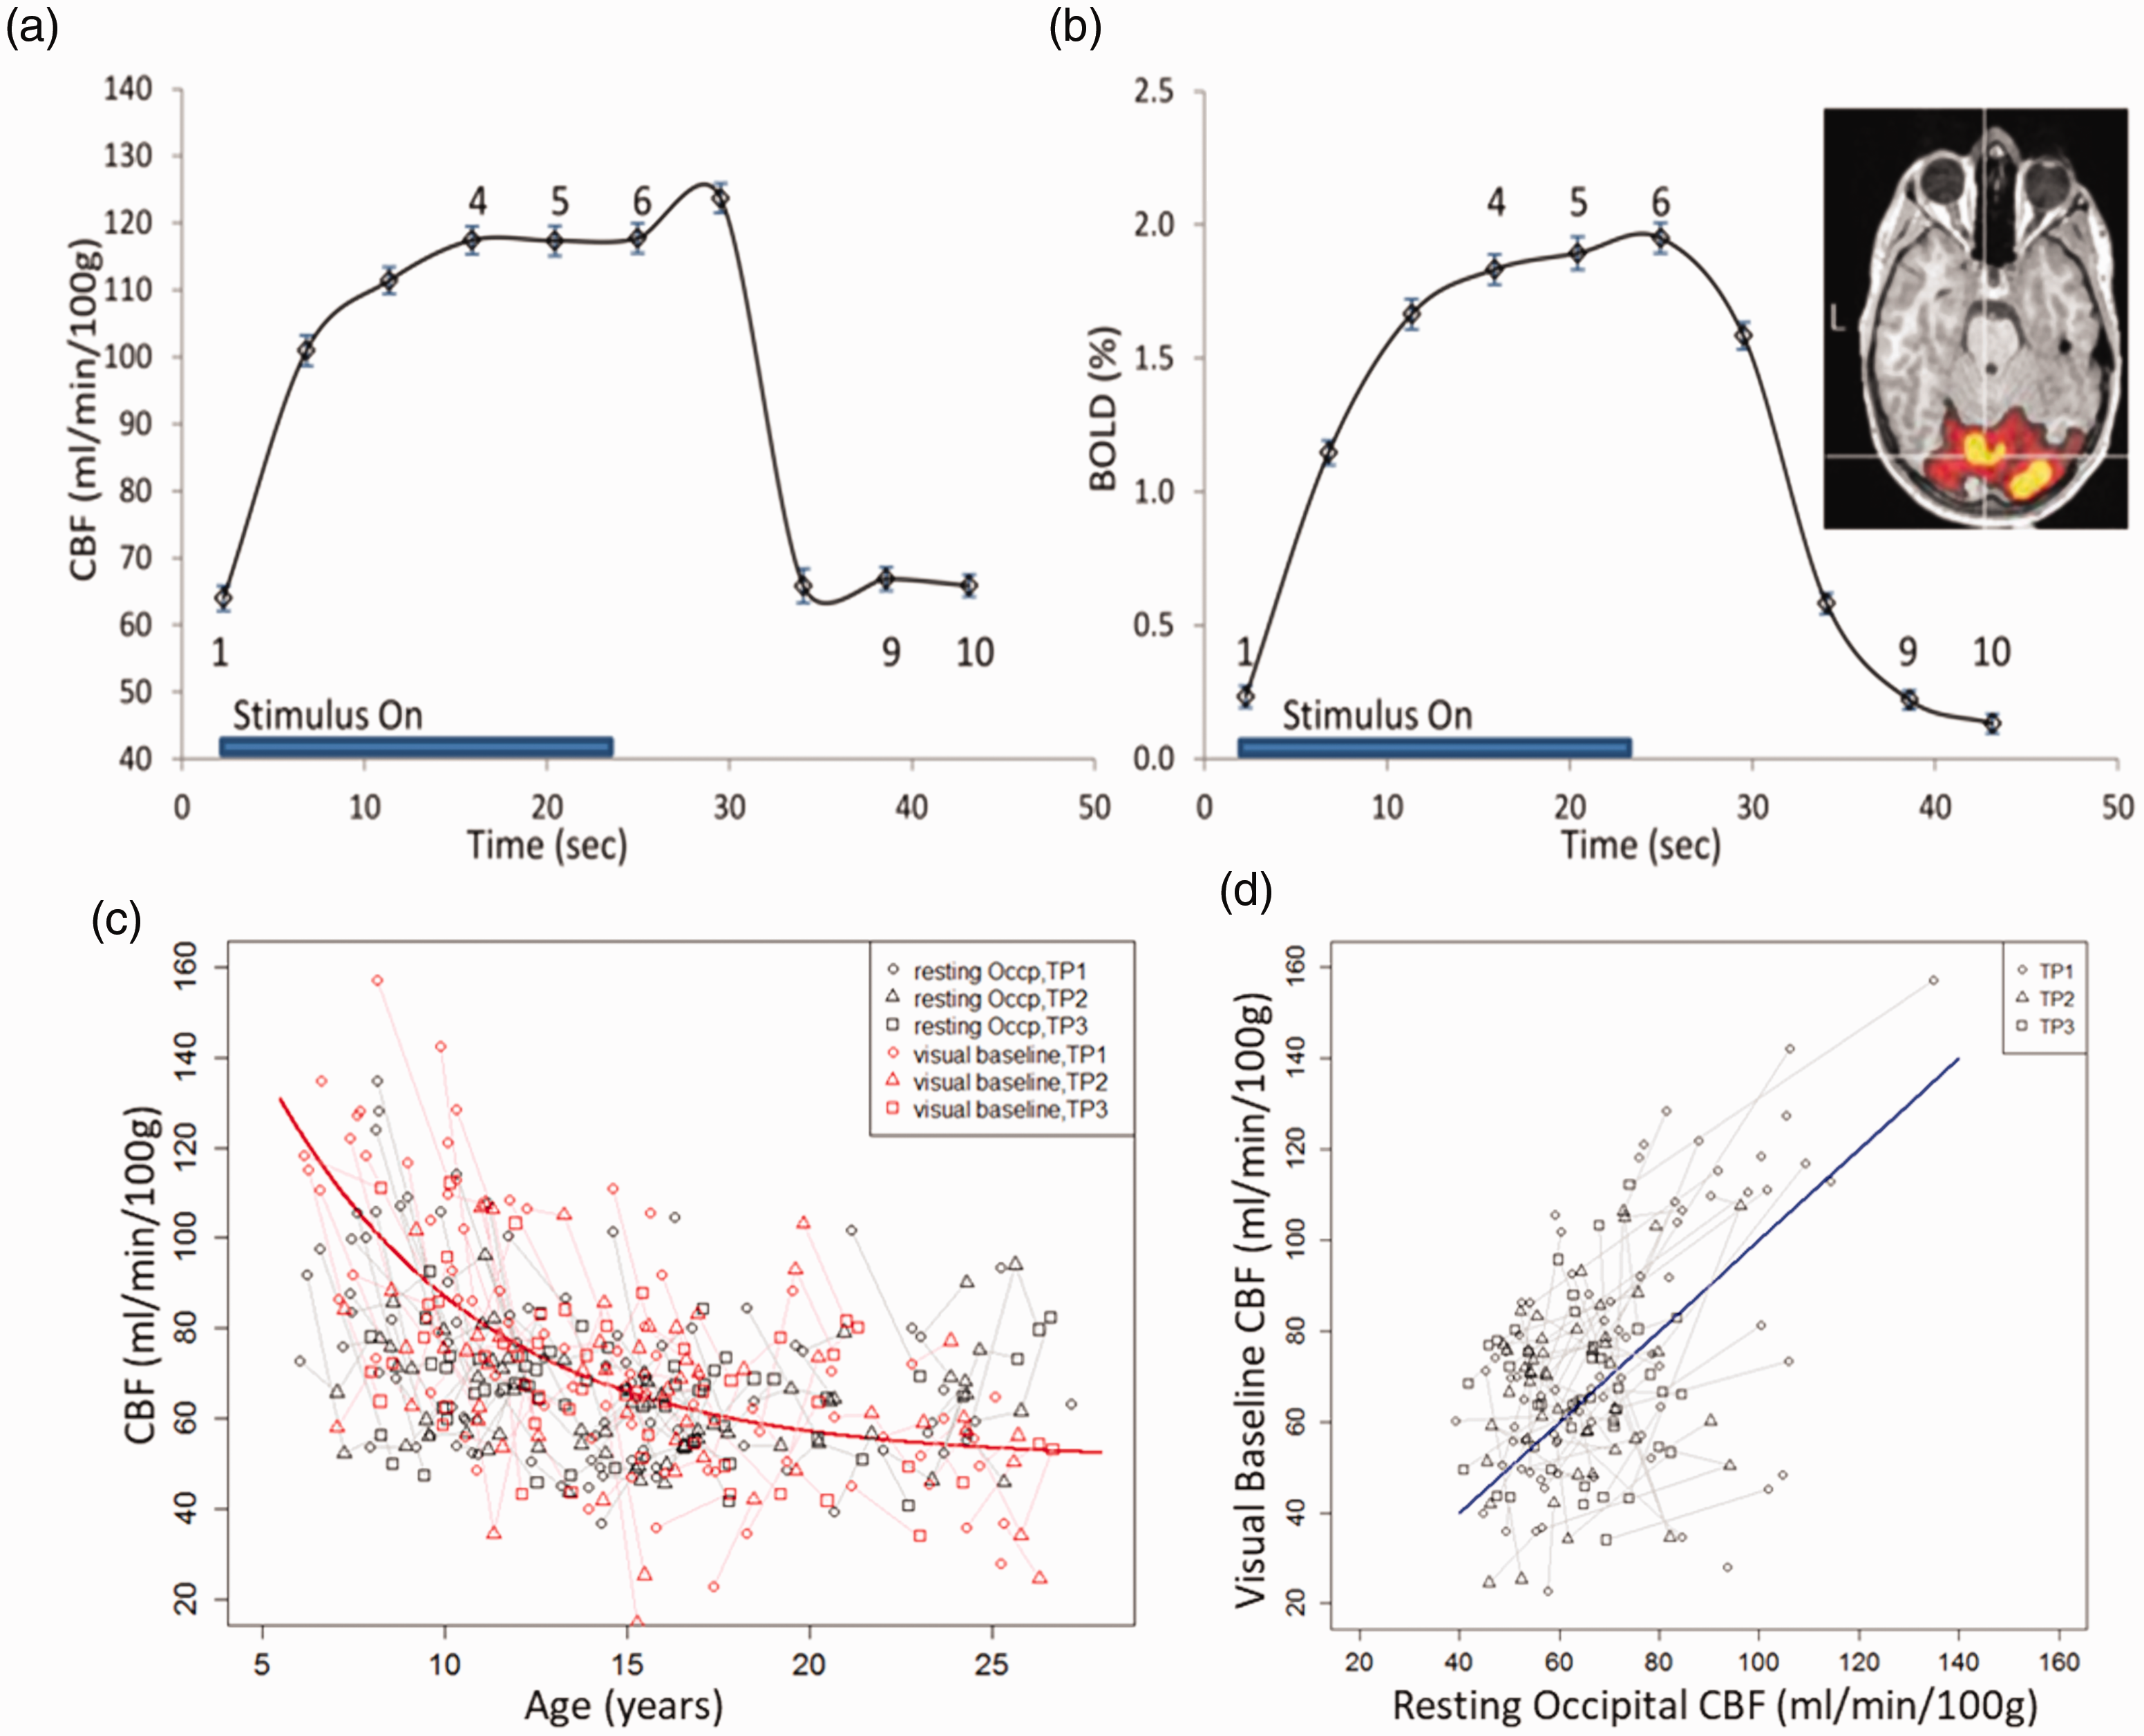
CBF and BOLD responses to visual stimulation and resting occipital gray matter CBF. (a) and (b) shows the CBF and BOLD responses obtained from the block-wise average of the time courses from peak clusters of significant BOLD activation over all participants. The error bars represent standard error. For data analysis, baseline was defined as the average value of data points 1, 9 and 10; and height was defined as the average value of data points 4, 5, and 6 in the graph. Brain activation from a participant who had the median BOLD response height is shown on the upper right corner. With standard threshold (p = 0.05 FWE-corrected), activation (red and yellow) in the visual cortex was extensive; with a higher threshold (t = 13, p < 10−12 FWE), peak activation (yellow only) was shown and the 100-voxel ROI of peak activation in the primary visual cortex (pointed by white cross-hair) was used to retrieve ASL time course for estimating the CBF and BOLD responses. (c) and (d) shows the relationships between visual baseline CBF and resting occipital CBF. Visual baseline CBF was the baseline of the CBF responses to visual stimulation from (a) and resting occipital CBF was the averaged CBF value of the occipital lobe gray matter calculated from the ASL data of the resting condition session. There was no significant difference (p = 0.14) between visual baseline CBF and resting occipital CBF over the age range. The developmental trajectory for visual baseline CBF was CBFvb = 50.9 + 73.3×exp(−(age−6)/5.69). All fitted parameters were significant (p < 0.001). Short line segments connect the data points of the same participant at different timepoints.
For each control time-point in the ASL time-course, a tag signal was calculated as average of the two neighboring tag signals to filter linear trends in the data. 25 The BOLD time course was calculated as the average of the control and the tag signals at each time-point; the CBF time course was calculated as the difference between the control and the tag signals at each time-point.25,26 The CBF time course of each participant was quantified using equation (1). Finally, for each participant, the CBF and BOLD responses were calculated as the block-wise average of the complete time courses (Figure 2(a) and (b)). For CBF or BOLD responses, we defined baseline as the average signal when stimulation was off excluding transient period (data points 1, 9 and 10 in Figure 2(a) and (b)), height as the average signal plateau during stimulation (data points 4, 5, and 6 in Figure 2(a) and (b)), and percentage change = 100 × (height–baseline)/baseline.
CBF baselines estimated from the ASL/BOLD data during visual stimulation (visual baseline CBF) and the mean occipital gray matter CBF values estimated from the resting ASL data (resting occipital CBF) were compared and tested for differences (Figure 2(c) and (d)).
We also estimated the apparent coupling parameter k of a heuristic model
16
:
Statistical models for age effects
To account for longitudinal measurements in our data, we used mixed-effect models in the statistical analysis. The Akaike information criterion (AIC) was used to select a linear or non-linear model to characterize the age effect on the data. Based on AIC, the linear mixed-effect model was selected to model age effect on absolute CBF change and age effect on parameter k. It was also selected to test differences between the resting occipital CBF values and the visual baseline CBF values. The linear mixed-effect model was in the form


The non-linear model was also selected to model age-effect on the resting CBF data for each brain lobe. Additional parameters for lobe effects on the three coefficients of the exponential model were added to test if the resting CBF changes with age differed significantly among lobes (see Supplement). Gender effect and gender-age interaction effect (see Supplement) were also included to test for gender differences in the developmental trajectory of brain hemodynamics.9,27
Results
Out of the 97 participants who had MRI at enrollment (TP1, 13.58 ± 0.53 years old), 88 repeated the MRI one year later (TP2, 14.44 ± 0.52 years old), and 74 repeated the MRI again two years later (TP3, 15.19 ± 0.55 years old), yielding an average of 2.7 ± 0.06 MRI measurements per participant. The age distribution of participants and their timeline (at each time point) is shown in Figure 1. There were a total 222 data sets with visual stimulation and 241 data sets without visual stimulation obtained for all three time points using the ASL sequence (Table 1): 24 (10.8%) ASL data sets with the visual stimulation and 45 (18.7%) data sets without visual stimulation were deemed to have poor image quality (artifacts, distortion, ASL tagging failures, insufficient brain coverage) and were excluded from statistical analysis.
Number of participants for each time point and ASL data sets obtained.
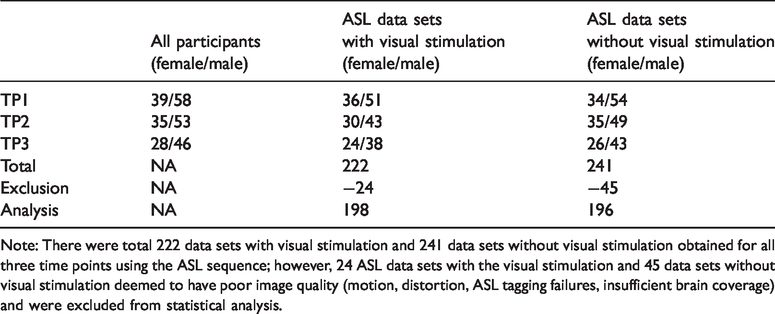
Note: There were total 222 data sets with visual stimulation and 241 data sets without visual stimulation obtained for all three time points using the ASL sequence; however, 24 ASL data sets with the visual stimulation and 45 data sets without visual stimulation deemed to have poor image quality (motion, distortion, ASL tagging failures, insufficient brain coverage) and were excluded from statistical analysis.
Globally, gray matter CBF decreased with age, starting at six years, and approached maturity levels in adolescence. Age-related changes were apparent in resting CBF maps (Figure 3), and the changes varied across lobes (Figure 4). The nonlinear exponential model revealed significant age effects (p < 0.03 for β3) for all lobes. There were no significant gender effects nor gender–age interactions detected for any of the lobes. With lobe effect parameters included for all three coefficients, the lobe effect for
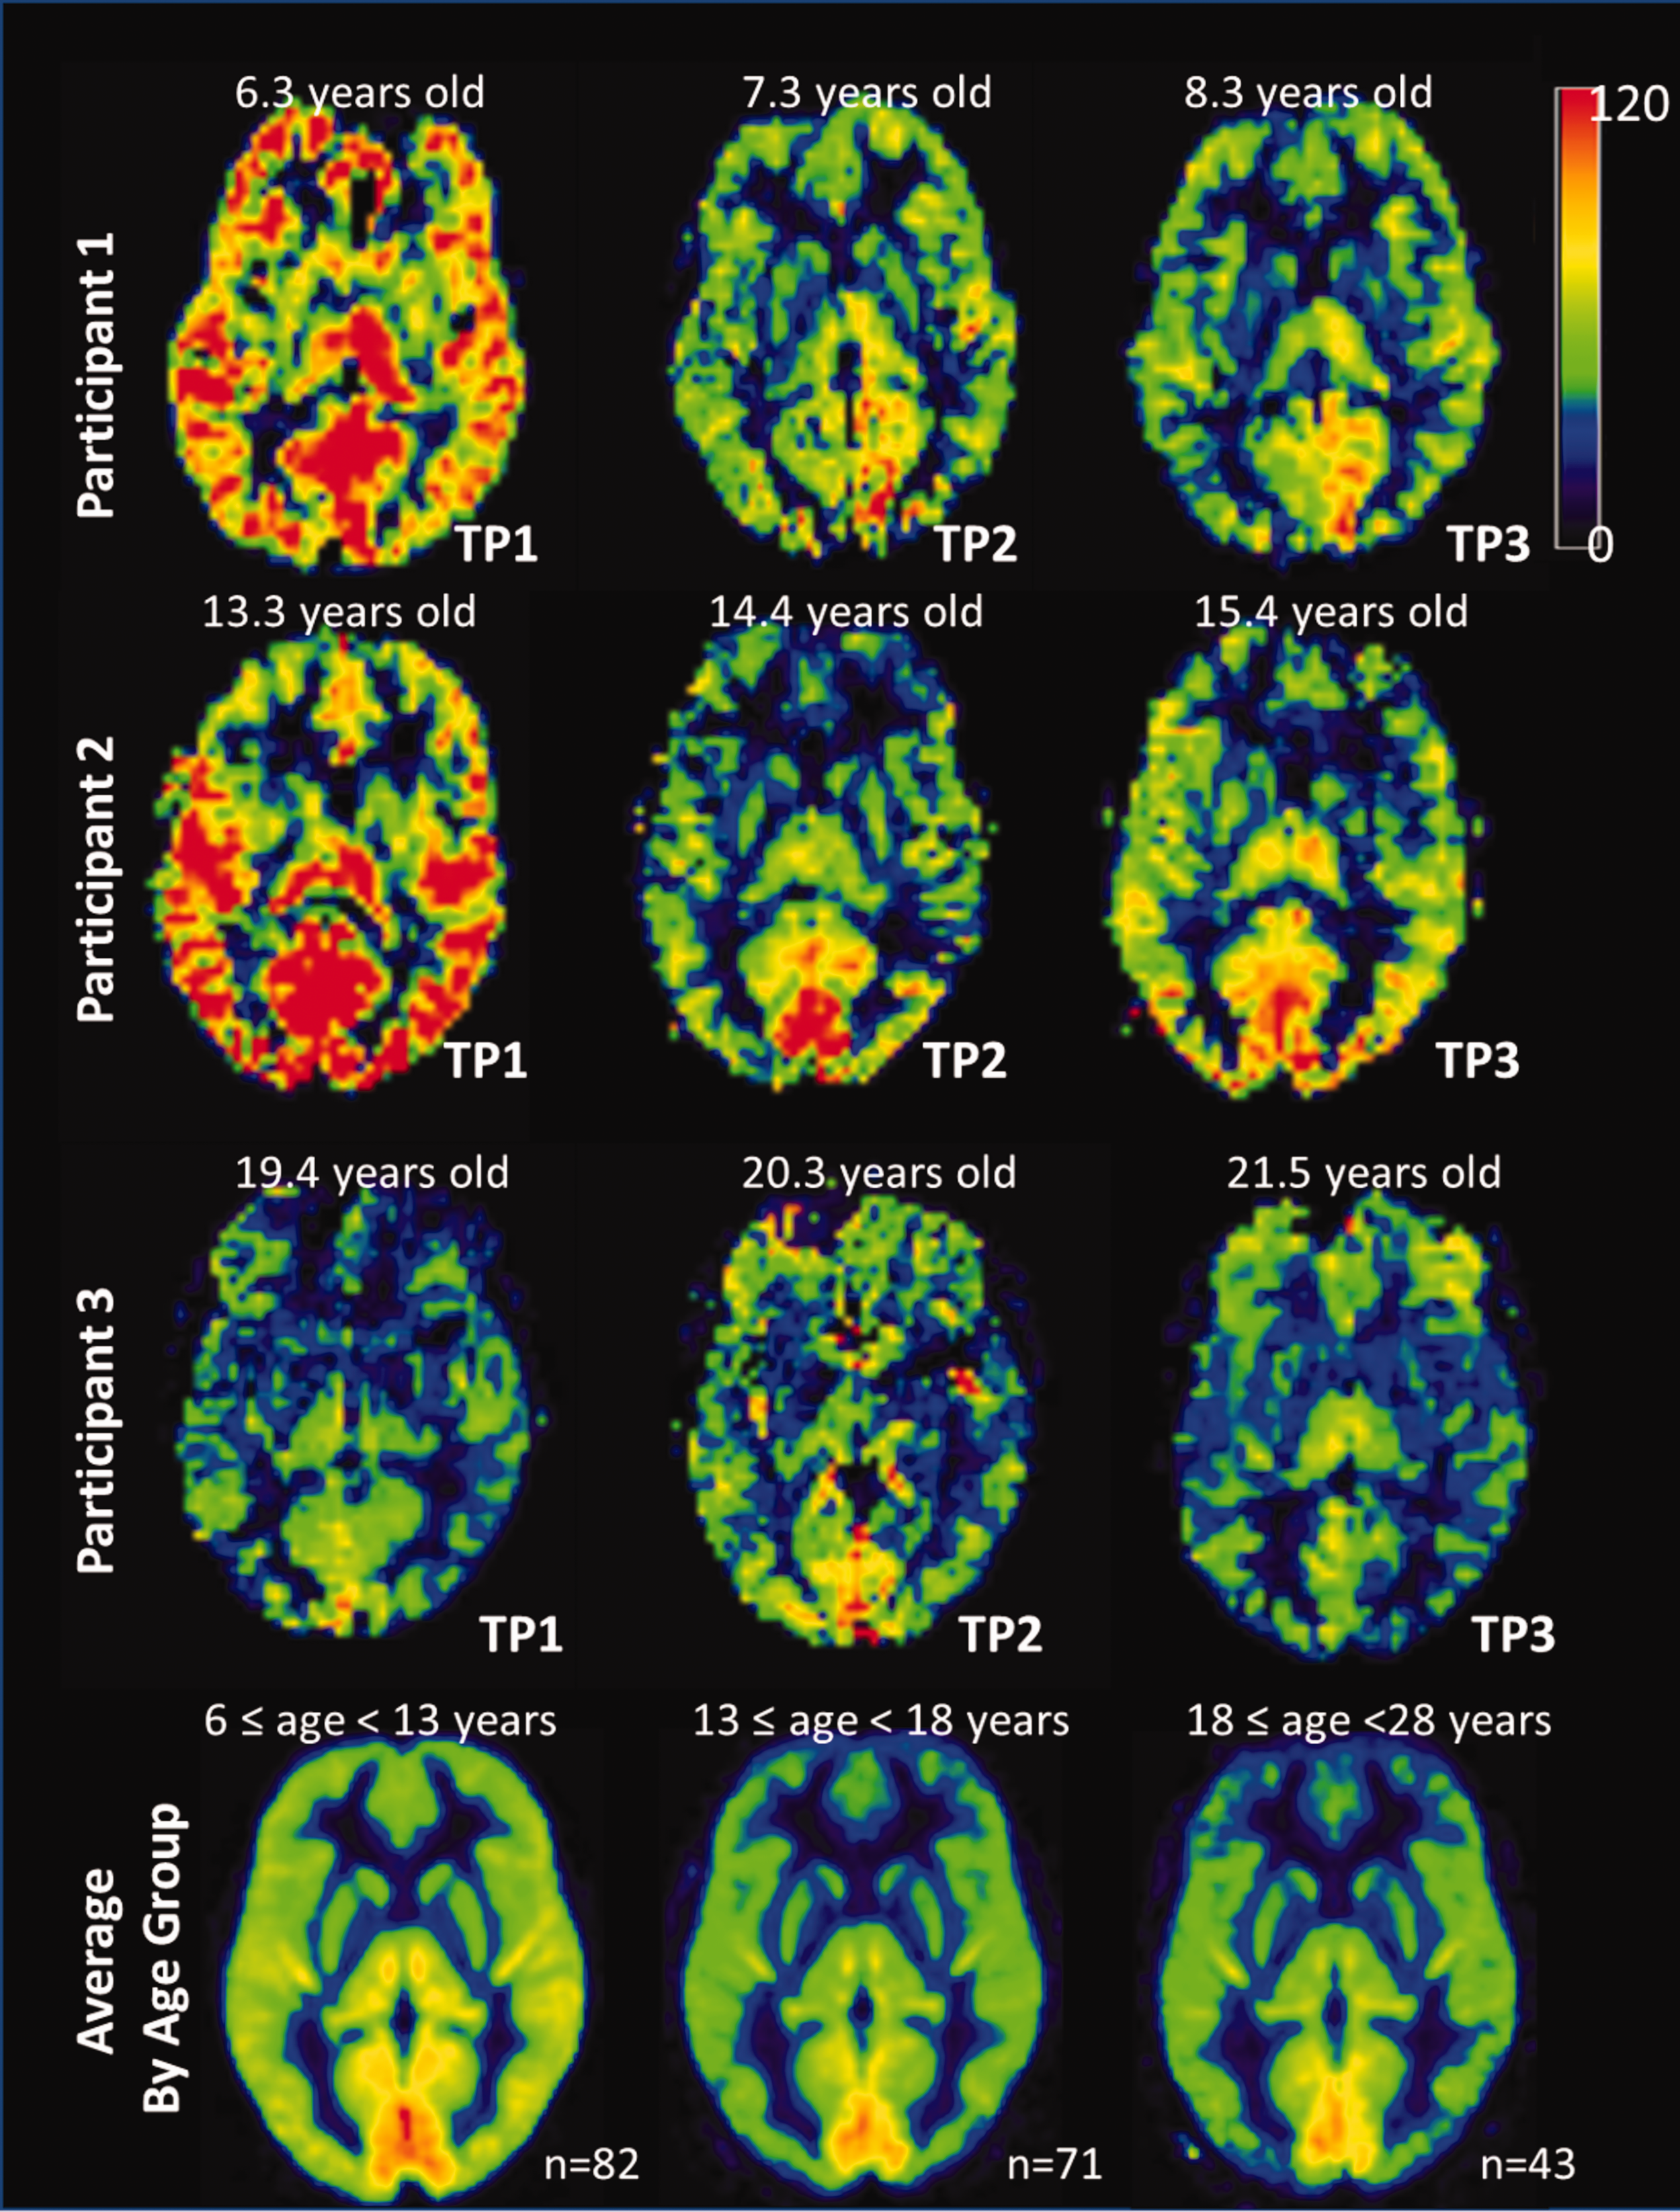
Resting CBF maps for different age groups. All the CBF maps are shown on the same scale from 0 to 120 ml/min/100 g. Representative individuals from the three age groups at their 3 time points are in the individual space. The average group maps were calculated from individual CBF maps that were normalized into the MNI standard space. There were 82 participants in the group of 6 ≤ age < 13 years, 71 participants for the group 13 ≤ age < 18 years, and 43 participants for the group of 18 ≤ age < 28 years.
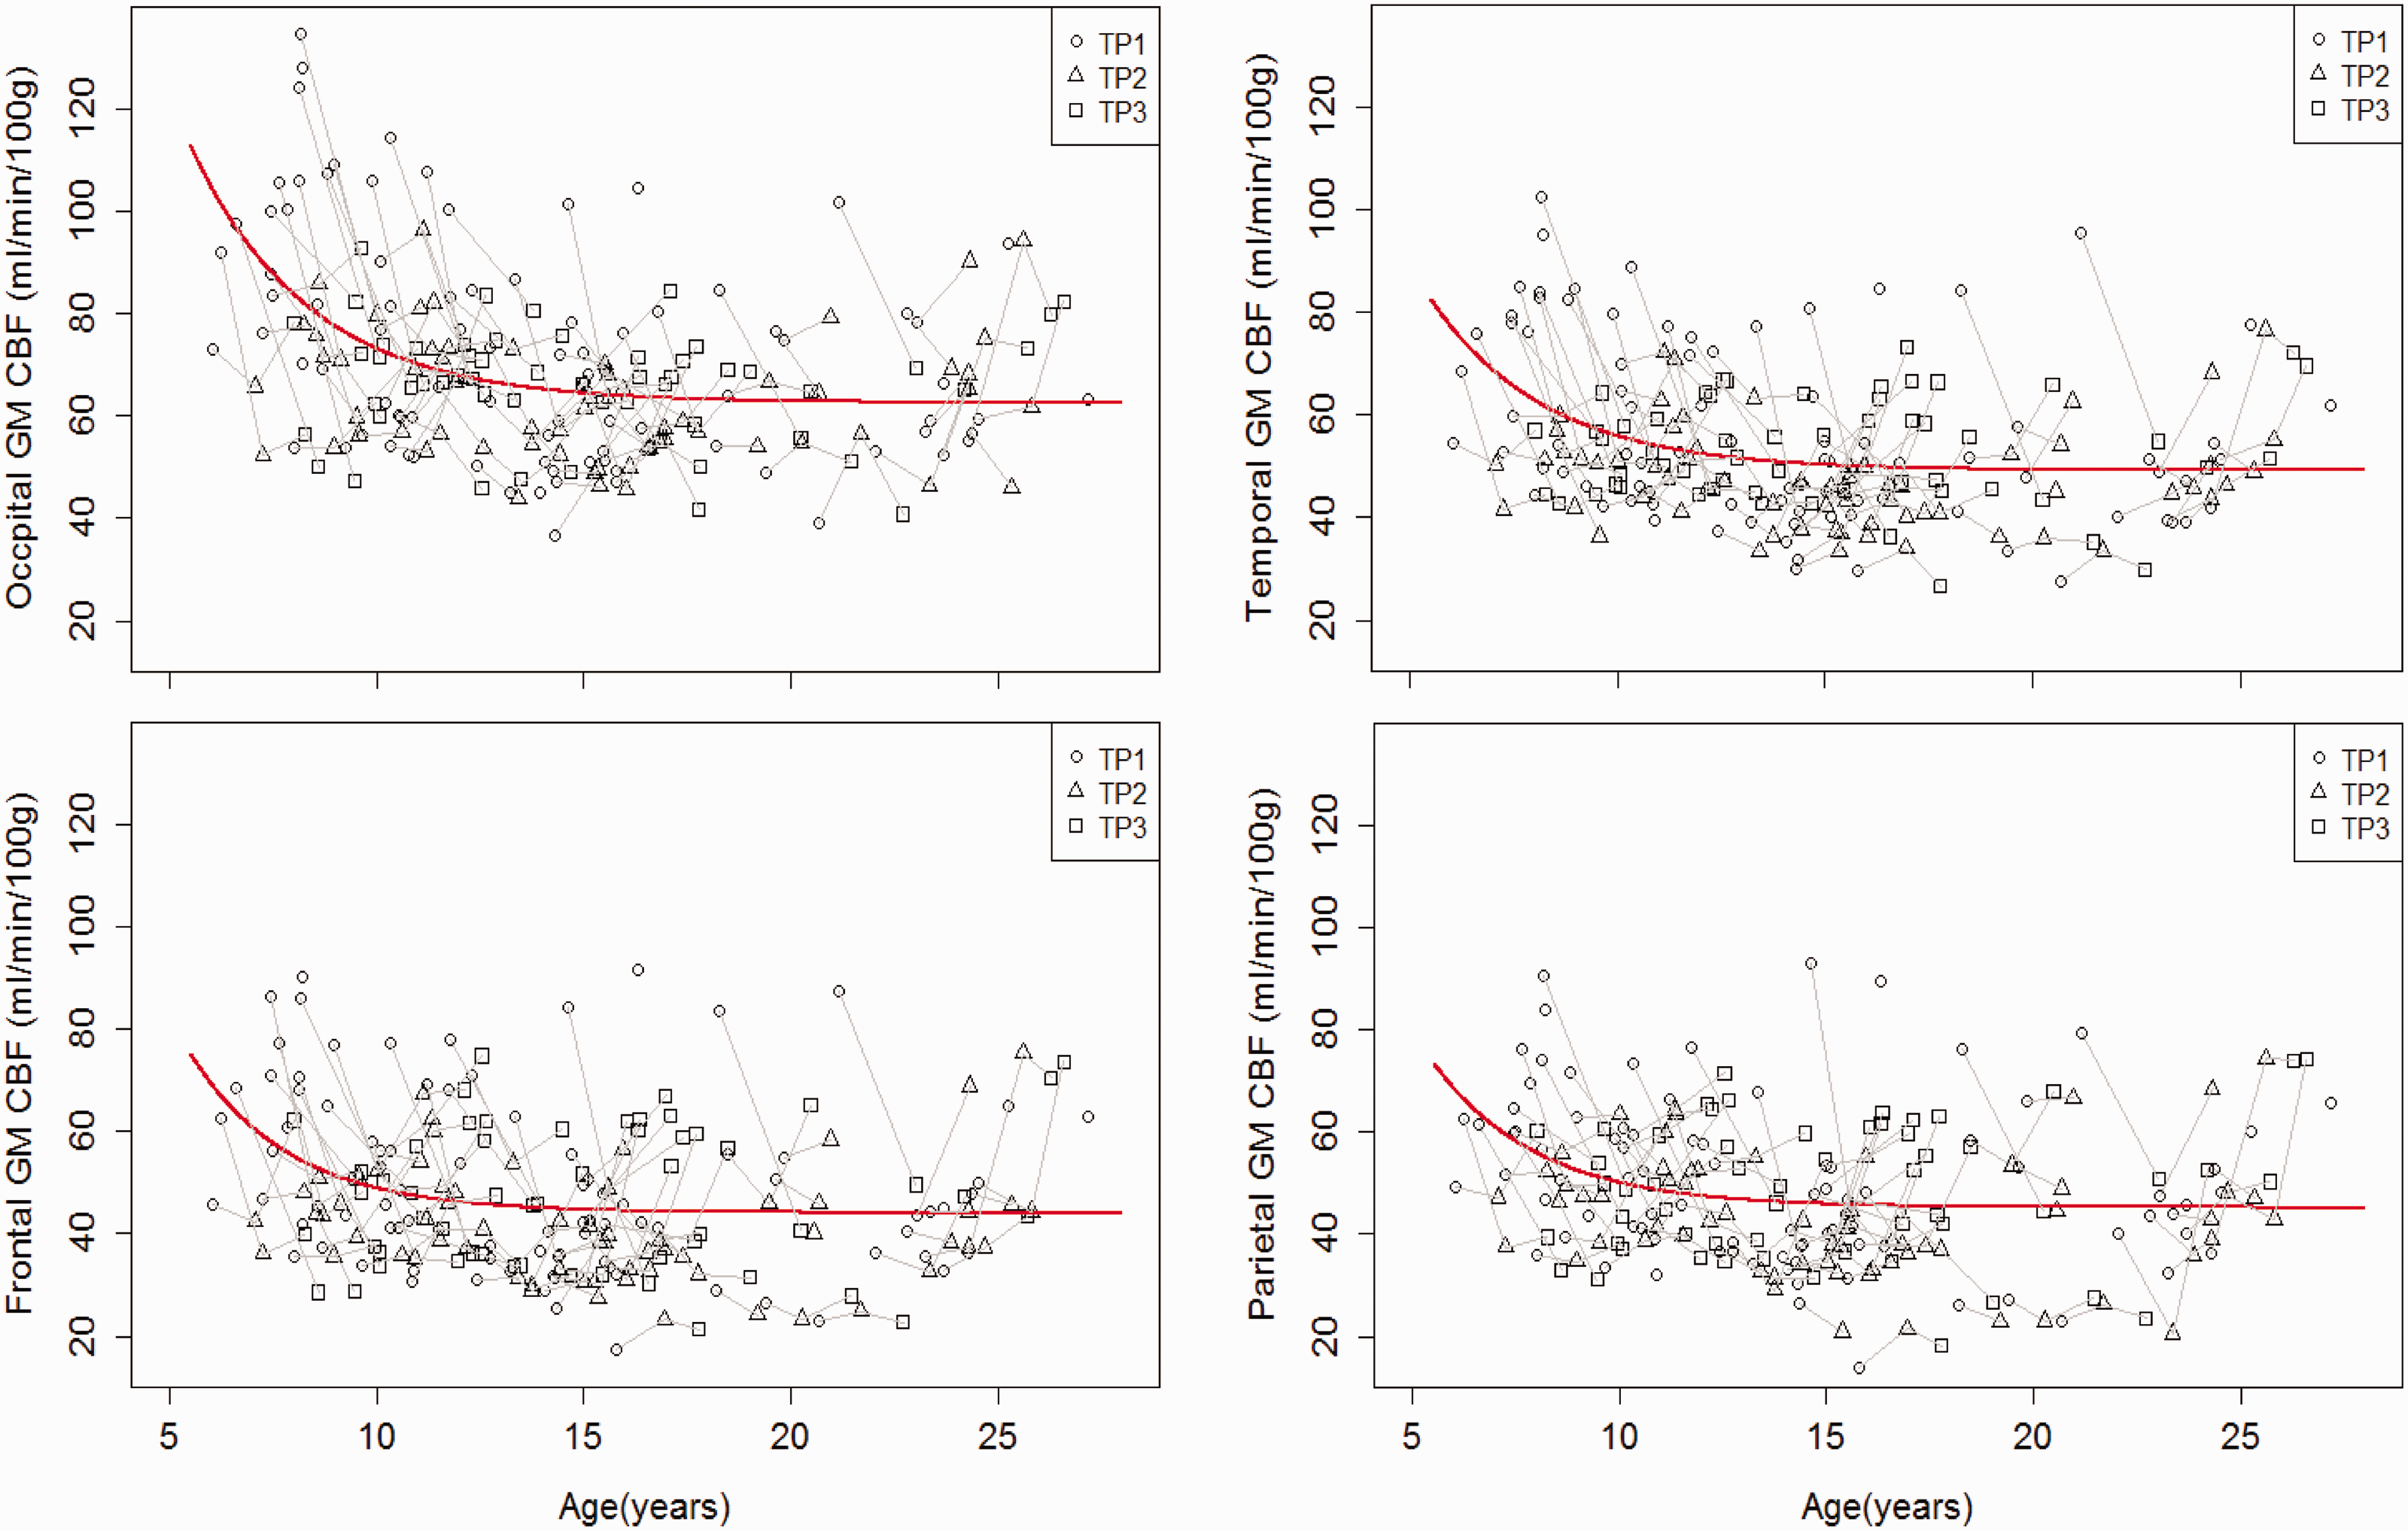
Resting gray matter CBF of brain lobes vs. age. Significant age effects were detected for each lobe (p < 0.001). The non-linear mixed effect model revealed an exponential growth trajectory of resting CBF in each lobe, and can be fitted as: CBF = 62.5 + 42.2×exp(−(age−6)/2.89) for occipital lobe, CBF = 44.1 + 25.2 × exp(−(age−6)/2.4) for frontal lobe, CBF = 49.1 + 27.9×exp(−(age−6)/2.8) for temporal lobe, and CBF = 45.2 + 23.3×exp(−(age−6)/2.55) for parietal lobe. All fitted parameters were significant (p < 0.0001). Short line segments connect the data points of the same participant at different timepoints.
Resting gray matter CBF values for four brain lobes based on the statistical models.

Note: CBF values in ml/min/100 g and age in years.
ASL with visual stimulation revealed robust visual cortex activation. The time courses of CBF and BOLD responses from the peak BOLD activation regions, averaged over all participants, are shown in Figure 2(a) and (b). The visual baseline CBF calculated from the peak BOLD activation region response was not significantly different (p = 0.14) from the resting occipital CBF measured with resting ASL (Figure 2(c) and (d)). The non-linear mixed-effect model shows visual baseline CBF decreased exponentially with age: CBFvb = 50.9 + 73.3×exp (−(age−6)/5.69) (p< 0.001 for all the parameters). Linear mixed-effect models show that the absolute change of CBF (ΔCBF) to visual stimulation (Figure 5(a)) did not change significantly with age (p = 0.11) and the estimated mean value of change was 58.6 ± 4.2 ml/min/100 g. However, the percentage CBF (ΔCBF%) change to visual stimulation (Figure 5(b)) increased significantly with age (p = 0.0001) and was fitted as ΔCBF% = 102–69.6 × exp (−(age−6)/4.85). There was a significant age effect on the BOLD signal (p= 0.0001), and the BOLD signal was fitted as: BOLD = 2.03–1.26×exp (−(age−6)/3.8) (Figure 5(c)). There were no significant gender differences nor gender-age interactions detected for visual baseline CBF, absolute change of CBF, and BOLD signal to visual stimulation. The percentage CBF change to the visual stimulation was lower in females than in males (p = 0.003), but there was no age-gender interaction effect detected. No age effect was detected for the apparent coupling parameter, k.
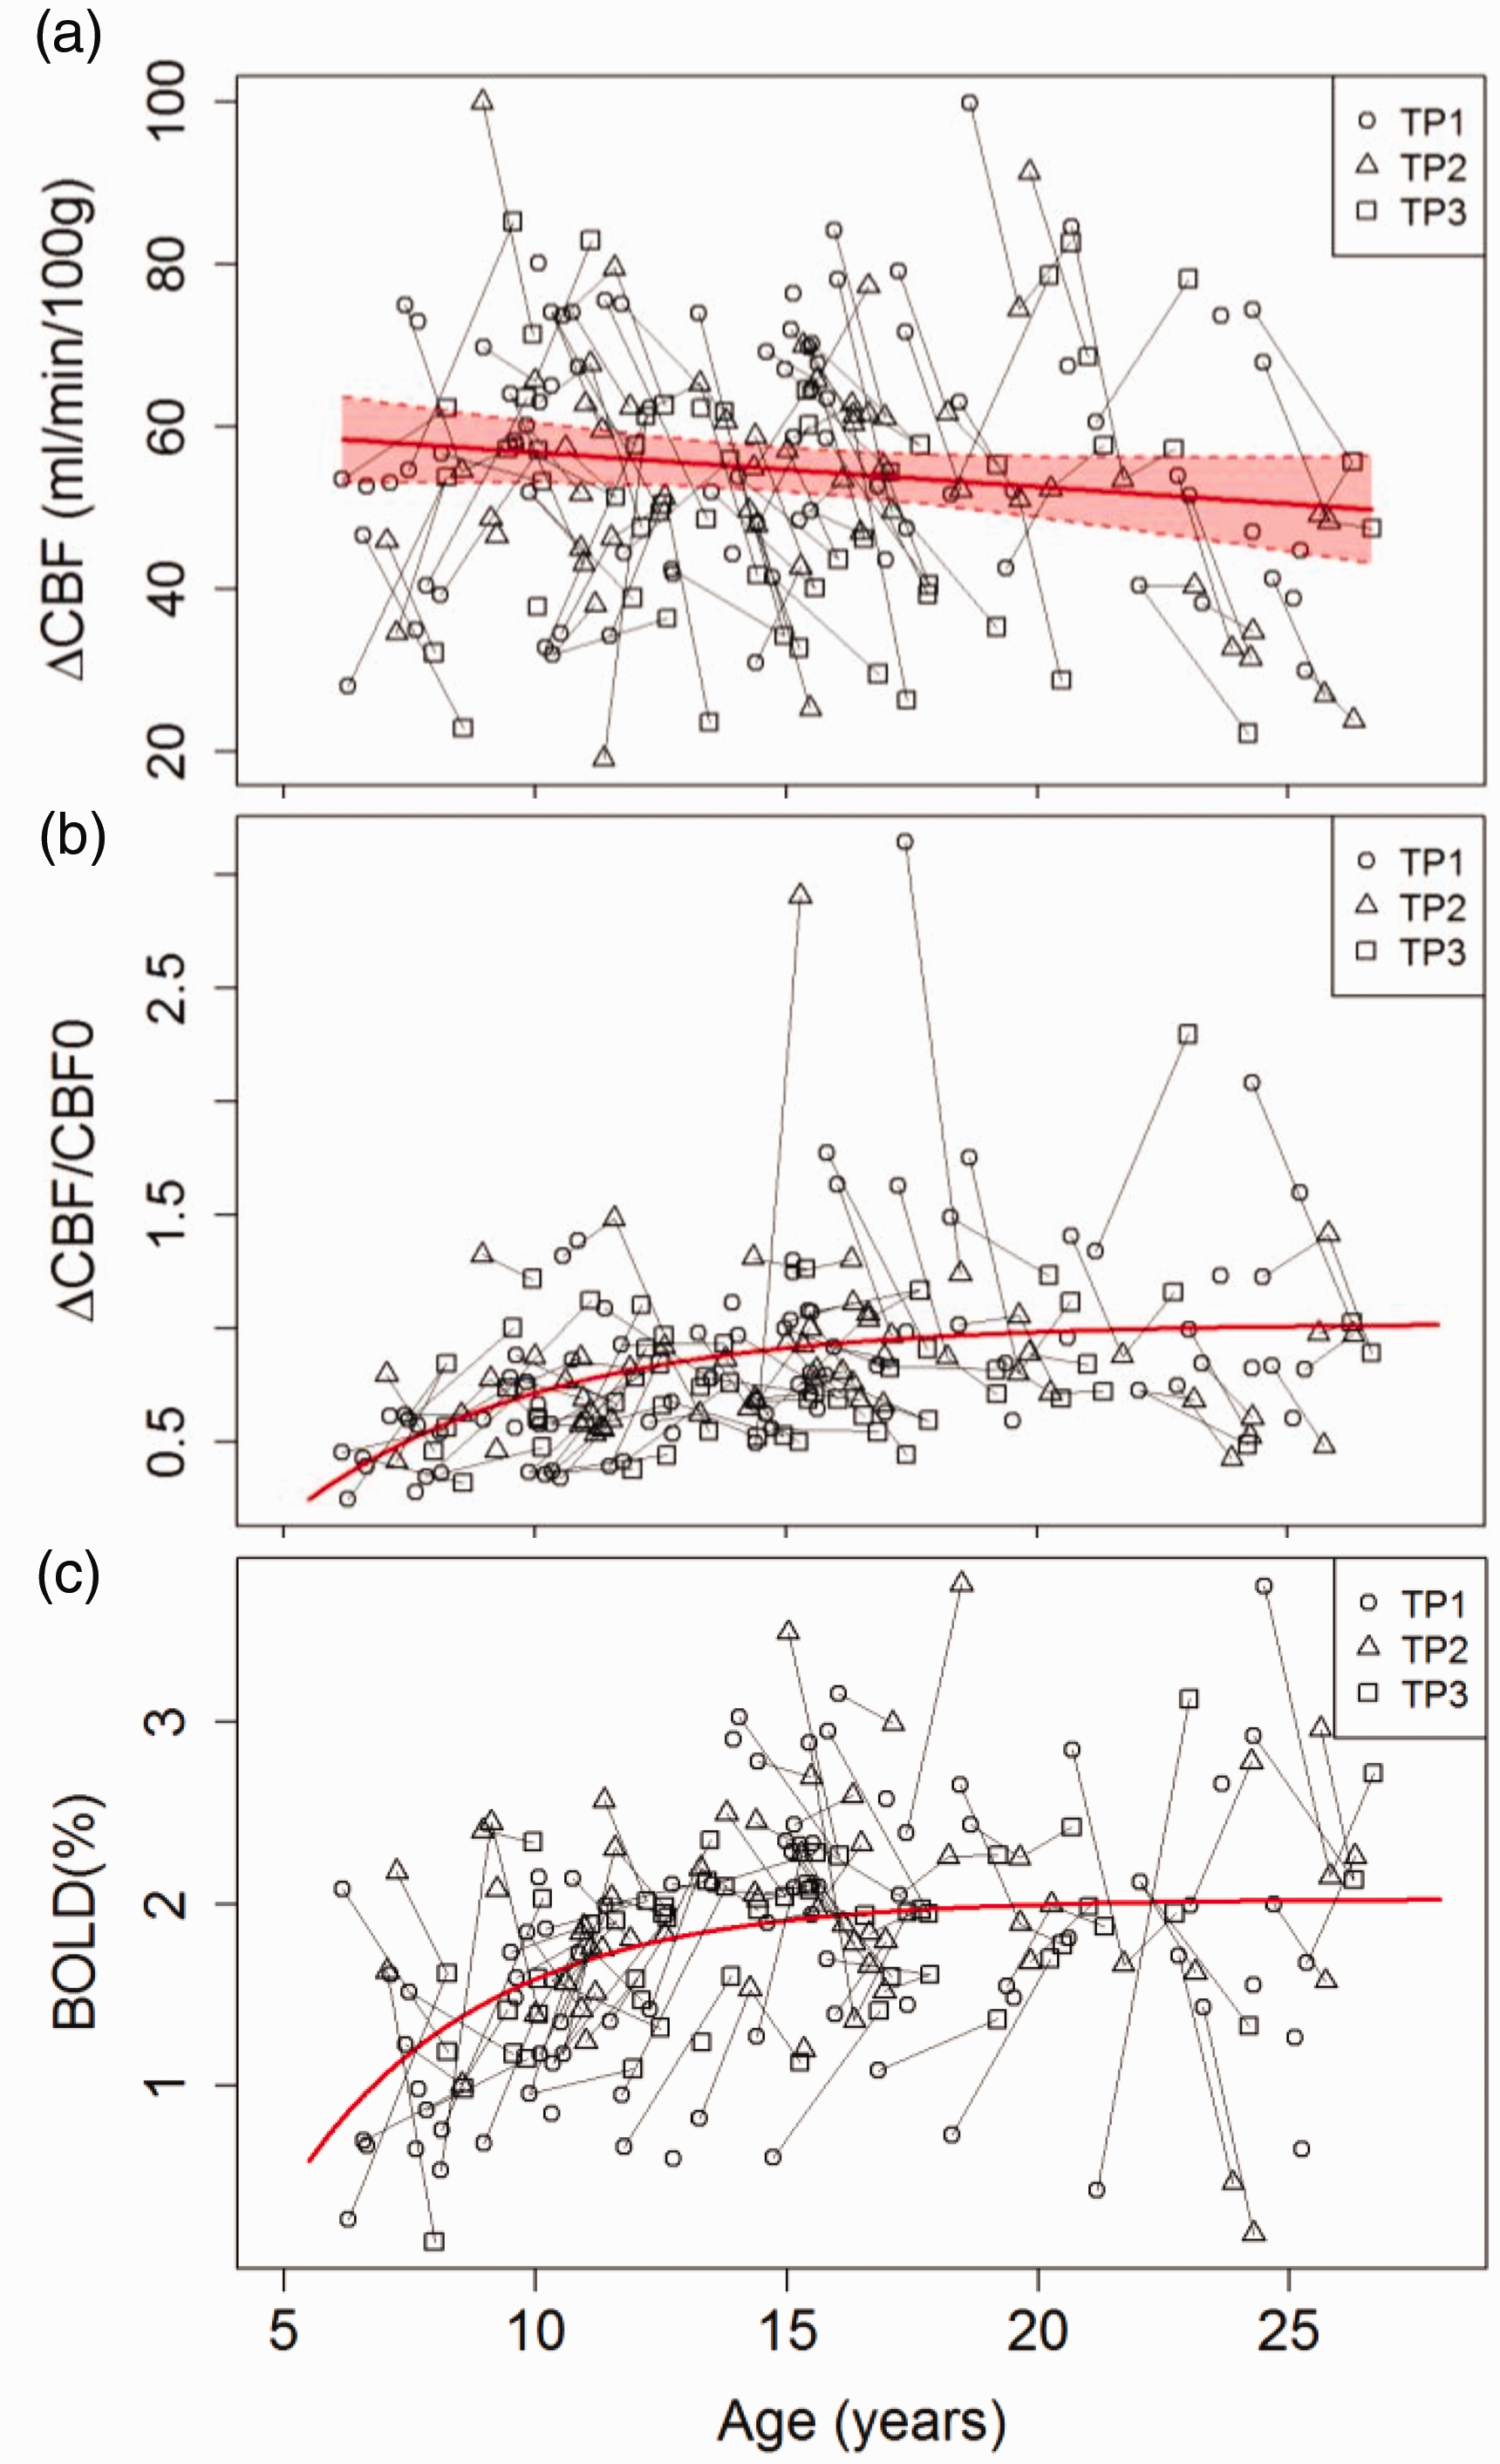
Age effects on CBF changes and BOLD signal during visual stimulation. (a) The absolute CBF change, ΔCBF = CBF–CBF0, did not change significantly with age (p = 0.11) and was estimated as ΔCBF = 57± 4.2 ml/min/100 g; The shaded area shows the 95% confidence interval. (b) The percentage CBF changes, ΔCBF% = 100×ΔCBF/CBF0, increased significantly with age (p = 0.0001) and can be modeled as ΔCBF% = 102–69.6 × exp(−(age−6)/4.85). (c) BOLD signal increased significantly with age (p = 0.01) and can be modeled as: BOLD = 2.03–1.26×exp(−(age−6)/3.8). Short line segments connect the data points of the same participant at different timepoints.
Discussion
Our data characterized developmental changes in CBF, a key factor coupling brain function to imaging signals, and corresponding changes in BOLD fMRI signals. Our findings corroborated the known decrease of resting CBF with age during childhood and adolescent years.9,11,22,27 We did not detected gender differences in the resting CBF at the whole brain or lobe levels in agreement with some previous studies,9,22 though gender differences during adolescent years were reported in certain brain cortexes. 27 Our statistical models showed developmental trajectories of resting gray matter lobar CBF for age 6 to 27 years: CBF decreases at highest rate between age 6 and 12, with maturation in frontal and parietal lobes followed by the temporal lobe, and then occipital lobe. These nonlinear and spatial patterns of gray matter CBF development may be associated with corresponding patterns of brain structural changes, such as cortical gray matter volume 28 and cortical thickness and gray matter density, 29 among the four lobes during the adolescent years.
Our most interesting finding is that the measured absolute change of primary visual cortex CBF during simple visual stimulation was constant over the age range. Thus, because baseline CBF decreased with age, the fractional CBF changes and the BOLD response increased with age. Also, because visual baseline CBF (The CBF measured during baseline periods of the visual stimulation) matched the resting occipital CBF (occipital gray matter CBF measured during rest), our findings strongly suggest that age-related increase in BOLD response to visual stimulus was largely due to the age-related decrease of resting CBF.
Decreasing baseline CBF and increasing BOLD signal strength with age demonstrate an inverse relationship between resting CBF and BOLD signal strength during typical development. The statistically stable absolute CBF response to the visual stimulus and decreasing resting CBF between age 6 and 27 years naturally lead to a larger fractional CBF change, and in turn a higher BOLD signal, consistent with the positive relationship between BOLD signal and fractional CBF change. 17 Age-by-lobe interaction effects on the resting CBF demonstrate that age-related BOLD signal effects vary in different parts of the brain. Thus, with everything else equal, it may be harder to detect the BOLD signal for a given neural activity in younger children than in adolescents and young adults simply because the baseline CBF is higher in children.
The finding of stable absolute CBF response to the visual stimulus between age 6 and 27 years may shed light on the mechanisms of developing neural-hemodynamic coupling. A study with baseline CBF modulated by hypercapnia challenge in healthy adults found that absolute CBF response to the visual stimulation was constant across varying baseline CBF levels and concluded that the absolute change in CBF may be more closely coupled with the underlying increase in neural activity to a stimulus than with the relative CBF change. 30 If we assume that the simple strong visual stimulus used in our fMRI study evoked the same change of neural activity in the primary visual cortex, then the same magnitude of absolute CBF change across the age range suggests a rather steady (or mature) neural-vascular coupling from age 6 to 27 years, at least for the primary visual cortex. One early PET study showed that while regional CBF and CMRO2 changed with age from infancy to adolescence, regional oxygen extraction fraction (OEF) did not change during childhood. 7 A recent study using ASL to investigate developmental trajectories of cerebral hemodynamic responses during working memory tasks 15 also found that while global CBF and CMRO2 decline with age (7 to 18 years), OEF was stable. We detected no age effect on the apparent coupling parameter, k in the heuristic model, 16 where k relates the dynamic coupling between CBF change and BOLD signal. Parameter k is a combination of imaging, baseline physiological, neural, hemodynamic, and other related coupling factors. While our data did not allow determinations of the separate factors and we cannot know how the combined changes in physiological, neural, and hemodynamic factors yield a constant value of k constant during development, it seems that the basic neural and hemodynamic coupling mechanism in visual cortex has reached a stable state by age six years, even though brain structure and function are still immature.31,32
Our findings differ from some studies using ASL to simultaneously measure CBF and BOLD responses in developing brains.12–14 Two of the studies tested relationships of CBF and BOLD in the auditory cortex with tasks that likely engage higher level cognition, one during a narrative comprehension task
13
and the other during listening to instrumental music.
12
We used a simple sensory stimulus to minimize confounding effects of task performance and changing cognitive abilities with age. Furthermore, we did not assume any parameter values (e.g. Grubb’s constant,
There are some important limitations on the quantitative accuracy or the generalizability of our findings. Some parameters, such as brain-blood partition and blood longitudinal relaxation time, may vary with age,22,23 but cannot be measured in reasonable scan time and fixed values are often assumed in quantification of CBF from ASL data34. We attempted to mitigate these confounding effects with a simple and reasonable age/gender model 23 for arterial blood longitudinal relaxation time values. Age-related changes in CBF were smaller with adjusted T1 values than with a constant T1, but the age-related changes in CBF were still highly significant. Imaging parameters may also affect the CBF quantification. The TE we used in our ASL/BOLD measurement, though a good compromise for flow and BOLD sensitivity, but it may also result in the underestimate of BOLD magnitude and flow values. Despite compromised sensitivity, we still detected important developmental features in both CBF and BOLD data, and the fitted equations are still a valuable reference of the developmental trajectories.
Our study helps to clarify important issues related to BOLD fMRI studies in developing children. Based on an array of reported differences and similarities between children and adults in BOLD responses to various task conditions, some have argued that developmental difference in neurovascular coupling, if any, cannot account for the observed differences and that concerns about confounding effects of vascular changes in developmental fMRI studies are mitigated.4,35 On the other hand, others have argued for the need to assess whether the BOLD changes reflect differences in cognitive processing or neurovascular-coupling and energy use in developmental fMRI. 5 Our study confirmed significant age effects on baseline CBF and on BOLD signal changes in visual cortex. The developmental patterns of CBF responses and BOLD signal changes that we report demonstrate a stable quantitative relationship linking CBF to neural activity between ages 6 and 27 years. However, developmental changes in cerebral circulation do have a significant effect on the BOLD signal strength that may confound interpretation of fMRI results. The amplitude of the BOLD signal for a given activation-induced CBF change is lower in young children because their resting CBF is higher. Thus, apparent developmental differences in activation may reflect, at least in part, lower BOLD signal changes in younger children. The statistical models we report may be used to analyze age-related changes in CBF and BOLD signals for planning and interpretation of fMRI studies.
In conclusion, the baseline CBF in human primary visual cortex declines with an exponential trajectory from ages 6 to 27 years. The absolute increase of CBF during visual stimulation is constant over the age range, and therefore the fractional change of CBF increases because of the decline of baseline CBF with age. As the overall scaling of the non-linear relationship of BOLD signal to dynamic CBF fractional change is stable, the measured BOLD signal increases with age to simple visual stimulation. Thus, the neural hemodynamic coupling in the visual cortex may be stable after age six years, but age-related changes in BOLD signal continue through adolescence.
Supplemental Material
sj-pdf-1-jcb-10.1177_0271678X20925303 - Supplemental material for Developmental patterns of CBF and BOLD responses to visual stimulus
Supplemental material, sj-pdf-1-jcb-10.1177_0271678X20925303 for Developmental patterns of CBF and BOLD responses to visual stimulus by Ping Zou, Matthew A Scoggins, Yimei Li, Melissa Jones, Kathleen J Helton and Robert J Ogg in Journal of Cerebral Blood Flow & Metabolism
Footnotes
Funding
The author(s) disclosed receipt of the following financial support for the research, authorship, and/or publication of this article: This work was supported by NIH (HD049888, RR029005), ALSAC.
Declaration of conflicting interests
The author(s) declared no potential conflicts of interest with respect to the research, authorship, and/or publication of this article.
Authors’ contributions
PZ study design, data and image analysis, and manuscript writing; MAS image acquisition and manuscript editing; YL statistical model and analysis, MJ patient recruit and image acquisition; KJH, manuscript editing, RJO directing the project, study design, data and image analysis, and manuscript editing.
Supplemental material
Supplemental material for this article is available online.
References
Supplementary Material
Please find the following supplemental material available below.
For Open Access articles published under a Creative Commons License, all supplemental material carries the same license as the article it is associated with.
For non-Open Access articles published, all supplemental material carries a non-exclusive license, and permission requests for re-use of supplemental material or any part of supplemental material shall be sent directly to the copyright owner as specified in the copyright notice associated with the article.