
Abstract
Understanding the role of tumor necrosis factor (TNF) in the life-death balance of ischemically injured neurons demands insight into the cellular synthesis of TNF, especially in the acute phase after induction of ischemia. Here, using approximated stereological methods and quantitative reverse transcription (RT) real-time polymerase chain reaction (PCR) analysis, the cellular synthesis of TNF from 30 mins to 10 days after induction of focal cerebral ischemia in mice was investigated. Reverse transcription real-time PCR analysis showed that TNF mRNA increased 2- to 3-fold within 1 hour after induction of ischemia. A significant 8-fold increase was observed at 4 hours when faintly labelled TNF mRNA-expressing and TNF immunoreactive microglial-like cells were easily identifiable in the peri-infarct and infarct. By 6 hours, TNF synthesizing cells were identified as Mac-1 immunopositive, glial fibrillary acidic protein immunonegative microglia-macrophages. The level of TNF mRNA and the numbers of TNF mRNA-expressing microglia-macrophages peaked at 12 hours, and the number of TNF immunoreactive cells at 24 hours. Neuronal TNF mRNA and TNF protein levels remained at constant, very low, levels. The data suggest that the pathophysiologically important TNF, produced in the acute phase from mins to 6 hours after an ischemic attack in mice, is synthesized by microglia-macrophages.
Introduction
Despite being intensively investigated, the duality of function of tumor necrosis factor (TNF) in experimental stroke is still poorly understood (review by Hallenbeck, 2002). Although most studies point towards a neurotoxic function of TNF (Dawson et al, 1996; Barone et al, 1997; Nawashiro et al, 1997a; Yang et al, 1998), other studies accordingly point towards a neuroprotective function (Bruce et al, 1996; Nawashiro et al, 1997b; Gary et al, 1998). The development of mature infarcts within a few hours after induction of both transient and permanent focal cerebral ischemia (reviewed by Zivin, 1998) emphasizes the significance of clarifying the cellular TNF synthesis in the acute phase after induction of ischemia. Tumor necrosis factor is synthesized in low levels in the normal CNS (review by Saper and Breder, 1992; Taupin et al, 1993; Jensen et al, 2000; Gregersen et al, 2000; Lambertsen et al, 2001) and is strongly upregulated in experimental (Liu et al, 1994; Wang et al, 1994; Buttini et al, 1996; Gregersen et al, 2000; Jander et al, 2000; Berti et al, 2002; Kim et al, 2002) and in human stroke (Sairanen et al, 2001a; Dziewulska and Mossakowski, 2003). A major source of TNF in experimental stroke are microglia and macrophages (Buttini et al, 1996; Gregersen et al 2000, Lambertsen et al, 2001, 2002), but astrocytes and neurons have also been reported to produce TNF (Dziewulska and Mossakowski, 2003; Botchkina et al, 1997; Liu et al, 1994; Sairanen et al, 2001a, b ; Uno et al, 1997).
Tumor necrosis factor is secreted as a 17 kD polypeptide through enzymatic cleavage from 26 kD transmembrane TNF (Aggarwal et al, 2000). Tumor necrosis factor interacts with two distinct receptors, TNF-R1 and TNF-R2, which activate different intracellular signal transduction pathways, resulting in different biological effects. Tumor necrosis factor-R1 contains cytoplasmatic domains that in most cells either induce apoptosis through a death domain (Hsu et al, 1995) or downstream activation of nuclear factor kappa B (NF-κB) (Adam et al, 1995; Adam 1996). In experimental stroke, absence of TNF-R1 has been reported to exacerbate neurotoxicity (Bruce et al, 1996; Gary et al, 1998), while TNF-R1 in other disease models exacerbates neurotoxicity (Raivich et al, 2002; Sriram et al, 2002). Tumor necrosis factor-R2 transduces growth and cellular activation signals (Sipe et al, 1998; Tartaglia et al, 1993; Arnett et al, 2001), but also potentiates TNF-R1-mediated cell death and NF-κB induction (Medvedev et al, 1994; Lazdins et al, 1997). Similar to TNF, the TNF-R1 and -R2 are cleaved from the cellular membrane, giving rise to soluble TNF-R1 and -R2, which contribute in the regulation of TNF bioactivity (Kohno et al, 1990; Nophar et al, 1990).
Tumor necrosis factor is an important mediator of inflammation (Hallenbeck, 2002; Wang and Shuaib, 2002). Tumor necrosis factor activates the vascular endothelium (Warren, 1990), and stimulates chemokine and adhesion molecule expression (Tessier et al, 1997; Yang et al, 1998), which results in the recruitment of blood-borne leukocytes, primarily macrophages (Blond et al, 2002), into the inflamed neural parenchyma (Sedgwick et al, 2000). Tumor necrosis factor also activates microglia and macrophages in vitro (Philip and Epstein, 1986), as well as in vivo, where TNF signalling through TNF-R2 induces ischemic vascular pathology and inflammation (Akassaglou et al, 2003). In addition, TNF stimulates the production of other inflammatory mediators, including nitric oxide and cytokines like interleukin (IL)-1β, IL-6, and TNF itself (Dinarello et al, 1986; Philip and Epstein, 1986; Aloisi et al, 1992; Riches et al, 1998), which all play a role in ischemic neurotoxicity.
So far the information on the TNF synthesizing cell types in the acute phase during focal cerebral ischemia is limited to a few studies in rats and in mice (Buttini et al, 1996; Gregersen et al, 2000; Liu et al, 1994). We have previously shown that TNF is produced by microglia-macrophages located in the peri-infarct and infarct from 12 to 24 hours after permanent middle cerebral artery occlusion (pMCAO) in the mouse (Gregersen et al, 2000; Lambertsen et al, 2002). Here, we analyzed the cellular synthesis of TNF mRNA and TNF protein from 30 mins to 10 days after pMCAO using reverse transcription (RT) real-time polymerase chain reaction (rt-PCR), in situ hybridization, immunohistochemistry, and stereological counting principles. The main emphasis was given to the acute phase from 30 mins to 6 hours after induction of ischemia, during which period we also investigated the neuronal synthesis of TNF mRNA and TNF protein.
MATERIALS AND METHODS
Animals
Adult, male SJL mice (22.7 ± 2.0 g) were purchased from Bomholtgaard A/S (Ry, Denmark) and transferred to the Laboratory of Biomedicine at the University of Southern Denmark, Odense where they were kept as a colony. The present study consisted of a total of 208 SJL mice. Mice were housed in separate cages under diurnal lightning conditions and given free access to food and water. The animal procedures were approved by and conducted according to the Danish Animal Health Care Committee (J. no. 192000/561-272).
Induction of Focal Cerebral Ischemia
Focal cerebral ischemia was induced by permanently occluding the distal part of the left middle cerebral artery (MCA), as previously described (Møller et al, 1995; Gregersen et al, 2000). Mice were anesthesized by a subcutaneous injection of a mixture of Hypnorm (Fentanyl Citrate (0.315 mg/mL) and Fluanisone (10 mg/mL), Jansen-Cilag, Birkerod, Denmark), Stesolid (Diazepamum (5 mg/mL), Dumex, Copenhagen, Denmark), and distilled H2O (1:1:2). Paw and abdominal reflexes were checked and the surgical area was shaved free from hair. The mice were placed under an operation microscope (Zeiss, Göttingen, Germany) on a 37°C ± 0.5°C warm heating pad and the eyes were coated in ointment to protect them from drying. The skin between the lateral part of the orbit and the external auditory meatus was incised, and the superior pole of the parotid gland and the upper part of the temporal muscle were pushed aside after partial resection. The MCA was exposed by drilling a burr-hole in the skull directly over the distal part of the artery and removing the dura. The MCA was coagulated applying bipolar forceps coupled to an electrosurgical unit (ICC 50 from Erbe, Tübingen, Germany). The incisions were closed with a 4–0 nylon suture (Sherwood Davis & Geck, St Louis, MO, USA) and the mice were supplied with a subcutaneous injection of physiologic 0.9% saline. Mice were returned to their cages in a 28°C controlled environment, where they stayed until the time of cervical dislocation and decapitation. Mice with a postsurgical survival time of 2, 5, and 10 days were returned to the conventional animal facility after 24 hours. Postsurgical pain treatment consisted of supplying the mouse subcutaneously with 0.15 mL Temgesic diluted 1:30 (stock: 0.3 mg/mL Buprenorphinum, Reckitt & Colman, Hull, England) three times with an 8-hour interval starting immediately after surgery. One mouse with 2 hours survival, 1 mouse with 4 hours survival, 1 sham-operated mouse with 12 hours survival, 4 mice with 24 hours survival, and 3 mice with 5 days survival died during or immediately after surgery because of the anesthesia.
Brain Tissue Processing
Mice were decapitated after cervical dislocation. The brains used for histology were rapidly removed from the skull and frozen in CO2 snow. The brains were cut into 30 μm thick cryostat sections and stored in sealed boxes in a –80°C freezer until processing. The survival times were 30 mins (n = 7), 1 hour (n = 7), 2 hours (n = 6), 4 hours (n = 6), 6 hours (n = 7), 12 hours (n = 9), 24 hours (n = 9), 2 days (n = 7), 5 days (n = 13), and 10 days (n = 7). One sham-operated mouse with the coagulator applied to the brain parenchyma next to the MCA was included at each post-surgical time, except at 24 hours, where n = 4.
The brains used for RT rt-PCR were rapidly removed from the skull. The remaining meninges were removed, whereafter the brain stem was transected at the level of the superior colliculi, and the cerebrum and the remaining part of the brain stem were divided into ipsi- and contralateral halves. Each half was placed in 10 volumes of RNAlater RNA Stabilization Reagent (Qiagen, Hilden, Germany). Survival times were 30 mins (n = 3), 1 hour (n = 10), 2 hours (n = 8), 4 hours (n = 10), 6 hours (n = 8), 12 hours (n = 8), 24 hours (n = 8), 2 days (n = 5), 5 days (n = 6) and 10 days (n = 5). Survival times for sham-operated mice were 1 hour (n = 8), 2 hours (n = 6), 4 hours (n = 8), 6 hours (n = 3), 12 hours (n = 1), 24 hours (n = 1), and 5 days (n = 1). Furthermore, 10 unlesioned mice were included as controls.
Determination of Infarct Volume
From each animal with a survival time of 6, 12, and 24 hours, 2, 5, and 10 days, every 6th section was stained with toluidine blue for infarct volume estimation using the Computer Assisted Stereological Test (CAST) Grid System (Olympus, Albertslund, Denmark) and the Cavalieri principle for volume estimation as described in Møller et al (1995).
To validate the infarct volumetric measurements obtained in mice with 6 hours to 10 days survival, we also estimated the volume of the nonischemic ipsilateral cortex in animals with a survival time of 6, 12, and 24 hours, and 5 and 10 days. In practice, this was performed by estimating the volume of the ipsilateral noninfarcted cortex over a rostrocaudal distance of 3,600 μm starting 720 μm from the anterior pole of area frontalis in each animal using the CAST Grid System and the Cavalieri principle, as already described.
RNA Isolation
Total RNA was isolated by duplicate extractions using the RNeasy Protect Mini Kit from Qiagen according to the manufacturer's directions.
Preparation of cDNA
Two micrograms RNA of each extract was applied for duplicate RNA synthesis (i.e., four cDNA synthesis reactions per sample). Random hexamers ((dN)6, Roche, Basel, Germany) were used for priming, and 1 μL M-MLV RT (200 U, Invitrogen Life Technologies, Carlsbad, CA, USA) catalyzed each reaction at 37°C for 50 mins.
Real-Time Polymerase Chain Reaction
An iCycler (Bio-Rad, Herlev, Denmark) was used for PCR and real-time detection of the TaqMan probe generated flourescent signals. Real-time PCR was in a microtiter 96-well format, and each sample was tested in 4 wells for tumor necrosis factor (TNF) as well as in 4 wells for the internal control gene, hypoxanthine phosphoribosyltransferase 1 (HPRT1). Each well contained 25 μL 1 × iQ Supermix (Bio-Rad) including 5 μL diluted cDNA, 400 nmol/L of each of forward and reverse primers (TAG-Copenhagen A/S, Copenhagen, Denmark), and 100 nmol/L TaqMan probe (TAG-Copenhagen A/S). Sequence of the TNF TaqMan probe was TGGCCCA GACCCTCACACTCAGATCATC, it was labelled 5′ with FAM and 3′ with ‘BlackHoleQuencher'. Sequence of the forward TNF primer was TGGCCTCCCTCTCATCAGTTC, and of the reverse TNF primer was TTGGTGGTTTGCTAC GACGTG. Sequence of HPRT1 TaqMan probe was AGCTTGCTGGTGAAAAGGACCTCTCGAAGT, it was labelled 5′ with HEX and 3′ with ‘BlackHoleQuencher'. Sequence of the forward HPRT1 primer was GTTAAG CAGTACAGCCCCAAAATG, and of the reverse HPRT1 primer was AAATCCAACAAAGTCTGGCCTGTA. The two-step PCR protocol was 3 mins at 95°C to activate the inactivated Taq polymerase followed by 45 cycles of 95°C for 10 secs and 60°C for 1 minute. After real-time PCR, the TNF and HPRT1 real-time data were processed by the iCycler program. Subsequently, using MS Excel, the TNF data set were normalized using the HPRT1 data set to correct for variations relating to RNA purification and cDNA synthesis. Finally, relative mRNA expression data were calculated relative to a baseline sample composed of cDNA derived from a control mouse. This baseline sample was included and tested as a sample on all real-time PCR runs. For standard curve, a fivefold dilution of series of spleen-derived cDNA was applied.
In Situ Hybridization for TNF mRNA
Hybridization procedure: The alkaline phosphatase-(AP)-labelled oligo DNA probes were purchased from DNA Technology A/S (Aarhus, Denmark). The in situ hybridization procedure is described in detail by Lambertsen et al (2001). Sections were air-dried and fixed in 96% ethanol, at 4°C overnight. Using a cocktail of two 28′mer AP-labelled oligo DNA probes (4 pmol/mL of each probe) complementary to bases 305 to 332 (5′-CTTCTCAT CCCTTTGGGGACCGATCACC) and 570 to 597 (5′-GTAGT CGGGGCAGCCTTGTCCCTTGAA) of murine TNF cDNA (Pennica et al, 1985), in situ hybridization was performed in a hybridization buffer containing 50% formamide, 0.1 mol/L Tris-HCl (pH 7.5), 4 × saline/sodium citrate (SSC; 1 × SSC = 150 mmol/L NaCl and 15 mmol/L sodium citrate), 1 × Denhardt solution (0.04 g of polyvinylpyrrolidone (Sigma-Aldrich, Vallensbæk Strand, Denmark) and 0.04 g of bovine serum albumin (Sigma-Aldrich), 10% dextran sulphate (Pharmacia Biotech, Hørsholm, Denmark), and 500 μg/mL single-stranded salmon sperm DNA (Sigma-Aldrich) for 20 hours at 37°C. Next day, the sections were rinsed 3 × 30 mins in 1 × SSC (pH 8.5) at 55°C, 2 × 10 mins in Tris-HCl (0.01 mol/L Tris-HCl and 0.15 mol/L NaCl, pH 9.5) at room temperature (RT), and immersed in a freshly made AP-developer containing 4.5 μL nitro blue tetrazolium (NBT; Sigma-Aldrich) stock solution (70 mg/mL NBT in 70% N,N-dimethylformamide), 3.4 μL 5-bromo-4-chloro-3-indolyl phosphate (BCIP; Sigma-Aldrich) stock solution (50 mg/mL BCIP in 100% N,N-dimethylformamide) in 1 mL Tris-HCl-MgCl2 (0.1 mol/L Tris-HCl, 0.1 mol/L NaCl, and 0.05 mol/L MgCl2 · 6H2O, pH 9.5) for 3 days in the dark at RT. Development was arrested in distilled water and sections coverslipped in Aquatex.
Control reactions: The specificity of the probe sequences was tested by hybridizing parallel sections from 3 animals from each postsurgical time, except for 2, 5, and 10 days, with (i) TNF probe I, (ii) TNF probe II, or (iii) a mixture of TNF probe I and II. The specificity of the in situ hybridization reaction was tested by (i) hybridizing parallel sections with buffer alone, (ii) pretreatment of the sections with RNAse A (Pharmacia LKB Biotechnology, Uppsala, Sweden) in 10 mmol/L Tris-HCl, 0.5 mol/L NaCl, and 1 mmol/L ethylenediaminetetraacetate (pH 8.0) before hybridization, and (iii) hybridization with a 100-fold excess of a mixture of unlabelled TNF probe I and II. Finally, to certify the quality of the tissue and the in situ hybridization procedure in general, two sections from each animal were hybridized for glyceraldehyde-3-phosphate dehydrogenase (GAPDH) mRNA using a probe (5′-XCCTGCTTCACCACCTTCTTGATGATGTCA) (3 pmol/mL), complementary to bases 833 to 859 of murine GAPDH cDNA (Sabath et al, 1990).
Standardization of the In Situ Hybridization Procedure: To minimize intragroup variability, animals with the same survival time were hybridized in parallel. Further, to control intergroup variability, sections from one animal, with a survival time of 12 hours, were included in all consecutive in situ hybridizations, which were only deemed acceptable if the sections from the test animal showed a strong in situ hybridization signal.
Immunohistochemistry for Tumor Necrosis Factor
Cells synthesizing TNF protein were visualized using a two-step immunohistochemical protocol using an AP-conjugated secondary antibody as described in detail by Lambertsen et al (2001). In short, sections were air-dried and fixed in 4% paraformaldehyde (PFA) for 7 mins. Next, sections were rinsed in Tris-buffered saline (TBS; pH 7.4) for 15 mins, and TBS and 1% Triton (Sigma-Aldrich) (pH 7.4) for 15 mins, and incubated with 10% fetal calf serum (FCS; Gibco BRL, Glasgow, Scotland) in TBS for 30 mins, at RT. Thereafter, the sections were incubated with the polyclonal rabbit anti-murine TNF antibody (Endogen, Woburn, USA) (1:200) for 24 hours at 4°C. The following day, sections were rinsed 3 × 15 mins in TBS and 1% Triton and incubated with a secondary AP-conjugated antibody to rabbit Ig (Sigma-Aldrich) (1:50) for 1 hour at RT. The antigen-antibody complex was visualized using the AP-developer used for in situ hybridization containing 1 mol/L Levamisole (Sigma-Aldrich). Finally, the development was arrested in distilled water and the sections coverslipped in Aquatex.
Control reactions for antibody specificity were performed on parallel sections by (i) substitution of the primary antibody with rabbit serum, and (ii) omission of primary antibody in the protocol.
Further, as described for the in situ hybridization experiment, sections from the test animal were included in all consecutive immunohistochemical stainings for TNF, which only were used for quantification provided that the stainings of the test animal were successful.
Visualization of Neuronal TNF mRNA Expression and TNF Immunoreactivity from 30 mins to 6 Hours after Induction of Ischemia
To study possible ischemia-related changes in neuronal TNF mRNA expression and TNF synthesis in the acute phase after ischemia, an experiment was designed that included TNF mRNA in situ hybridization of 3 sections and TNF immunohistochemistry of 2 parallel sections from 3 different animals at each time point ranging from 30 mins to 6 hours after pMCAO. Additionally, sections from each animal were either (1) hybridized with the buffer alone, pretreated with RNAse A, hybridized with a 100-fold excess of unlabelled TNF probe I and II, and hybridized for GAPDH mRNA or (2) incubated with buffer alone or rabbit serum. These experiments were both performed twice. The in situ hybridization and immunohistochemical signals in the peri-infarct and in the neuron-rich layer II and III of the cingulate gyrus were compared at the different time points after induction of ischemia.
Combined In Situ Hybridization for Tumor Necrosis Factor mRNA and Immunohistochemistry for Glial Fibrillary Acidic Protein
In situ hybridization for TNF mRNA was combined with immunohistochemistry for glial fibrillary acidic protein (GFAP) on sections from mice with 6 and 12 hours survival as detailed by Lambertsen et al (2001), (2002), but using a concentration of 8 pmol/mL of each of the two TNF probes.
Double Immunohistochemistry for Tumor Necrosis factor and Microglial-Macrophage Mac-1 Antigen
Double immunohistochemistry was performed on sections from animals with 6 and 12 h survival according to the protocol described by Lambertsen et al (2001), (2002).
Immunohistochemistry for Microglial-Macrophage Mac-1 Antigen
Visualization of the Mac-1 antigen was performed with the streptavidin/horseradish peroxidase technique described by Lambertsen et al (2001).
Estimation of the Total Number of TNF mRNA and TNF Protein Synthesizing Cells
Using an approximated stereological counting technique unaffected by differences in ischemia-induced edema formation or shrinkage/tissue resorption (Lambertsen et al, 2002), we estimated the total number of TNF mRNA-expressing (mRNA +) and TNF immunoreactive (TNF +) cells within the infarct and in the peri-infarct 30 mins, 1, 2, 4, 6, 12, and 24 hours, and 2, 5, and 10 days after pMCAO. In short, cells with a clearly identifiable nucleus in conjunction with a detectable in situ hybridization or immunohistochemical signal were counted on approximately 15 sections separated by 360 μm from each animal, using a × 100 objective and a 5,020 μm2 frame area stepping 200 μm/200 μm in the XY-position using the CAST Grid System from Olympus. The total number (N) of TNF mRNA+ and TNF+ cells in each animal was estimated using the formula: Estimate of N = ΣQ ϗ (1/ssf) ϗ (1/asf) ϗ (1/tsf), where 1/tsf is the thickness sampling fraction (1/tsf=1), 1/ssf the sampling section fraction (1/ssf=12), and 1/asf the area sampling fraction (40,000/5,020) as described by West et al (1996).
Statistical Analysis
Data are presented as means±s.d. Comparisons of mean values were evaluated by the Kruskal-Wallis test (nonparametric ANOVA) with the appropriate follow-up test using the GraphPad Instat version 3.0a for Macintosh, GraphPad Software, San Diego, CA, USA, www.graphpad.com. Statistically significant differences for comparison of means were established at P<0.05.
RESULTS
General Histopathologic Changes
Permanent occlusion of the distal part of the left MCA (pMCAO) gave rise to exclusively neocortical infarcts, including areas of frontal and parietal cortices (Figure 1A). The infarcts first became well demarcated in the toluidine blue-stained sections 6 hours after pMCAO. Therefore, infarct volumetric data were only obtained from animals with 6, 12, and 24 hours, 2, 5, and 10 days survival. Infarct volumes were estimated to be 18.8±3.7 mm3 at 6 hours, 18.2±5.4 mm3 at 12 hours, 21.4±8.1 mm3 at 24 hours, and 9.6±5.6 mm3 at 2 days (Figure 1B). Mice with 5 days survival exhibited significantly smaller infarcts compared with 24 hours (P<0.05) and mice with 10 days survival exhibited significantly smaller infarcts compared with 6, 12, and 24 hours (P<0.001) because of the beginning of resorption of the infarcts. This was reflected in a reduction of the mean infarct volume to 8.8±3.1 mm3 at 5 days and 1.4±0.4 mm3 at 10 days (Figure 1B). The nonischemic, ipsilateral cortex volume was found to be constant at 6 hours (25.0±2.5 mm3), 12 hours (25.5±3.4 mm3), 24 hours (23.4±3.6 mm3), 5 days (25.6±0.8 mm3), and 10 days (25.9±2.5 mm3) (P>0.2) demonstrating that the reduced infarct volumes observed at 5 and 10 days were due to resorption of infarcted tissue.
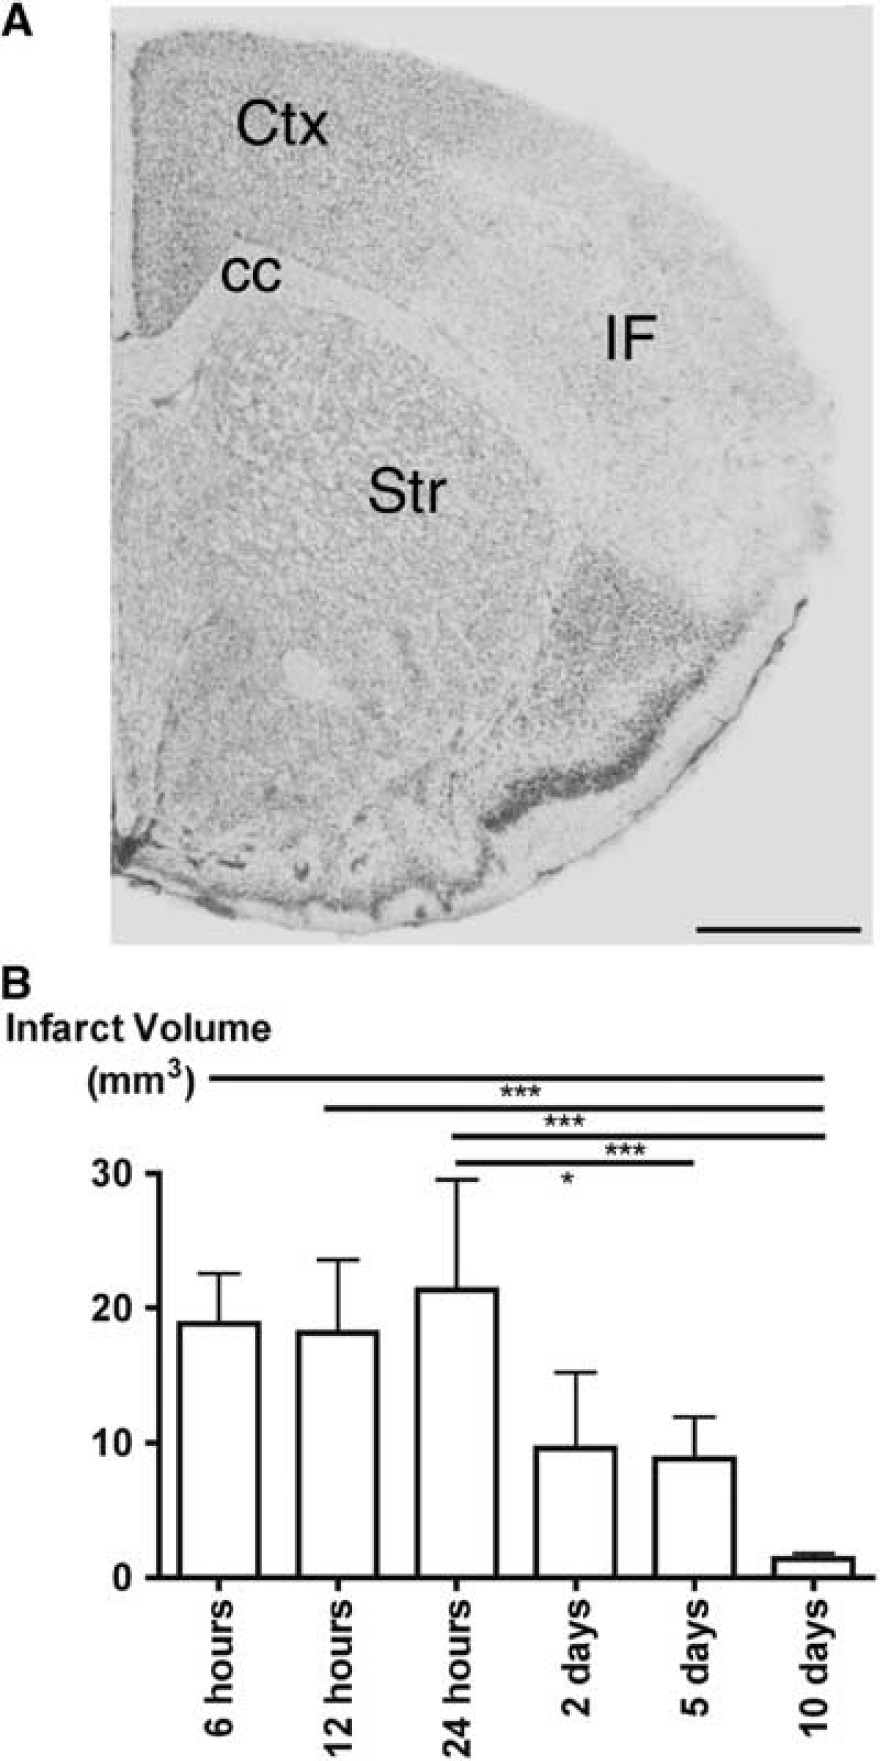
Analysis of the toluidine blue-stained sections made it possible to distinguish between mononuclear and polymorphonuclear leukocytes (PMNs). Mononuclear leukocytes were first consistently present in the peri-infarct and infarct from 6 hours. Polymorphonuclear leukocytes were transiently present at the edge of and within the infarct 24 hours and again at 10 days after MCA occlusion. Polymorphonuclear leukocytes were extremely rare at all other times of observation.
Time profile of Tumor Necrosis Factor mRNA Expression Using Reverse Transcription Real-Time Polymerase chain reaction
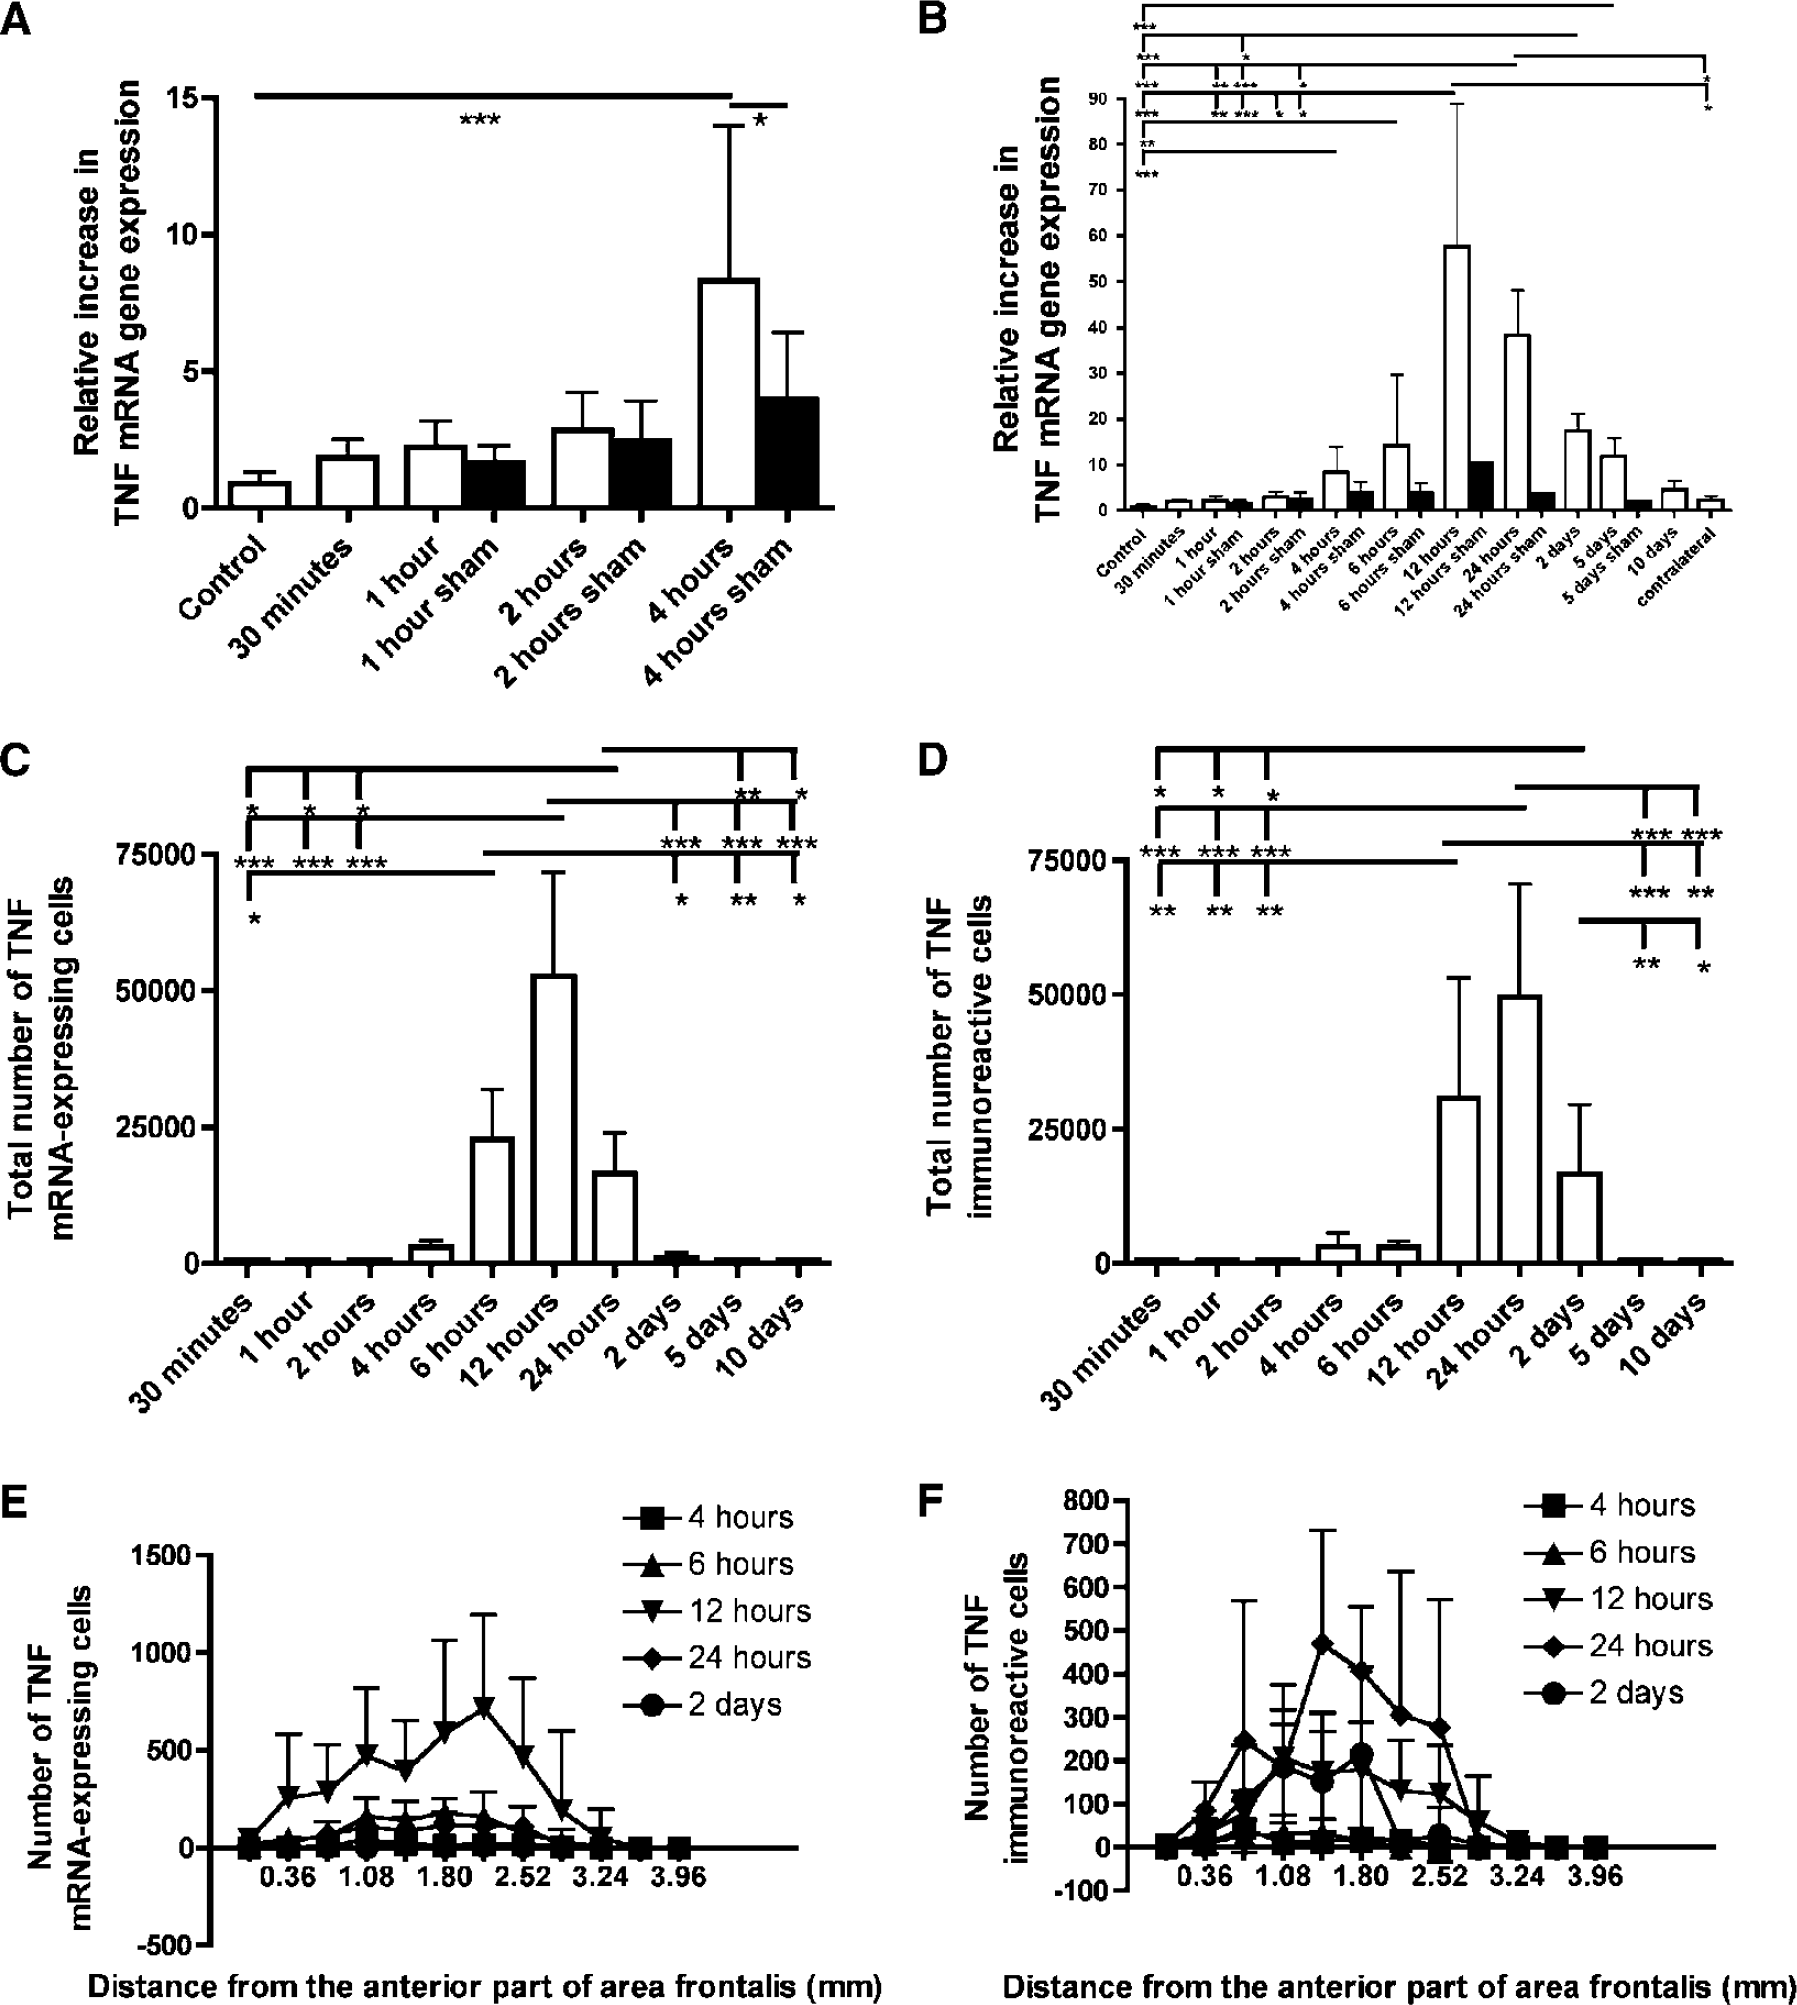
We used RT rt-PCR to evaluate the time course of expression of TNF mRNA after pMCAO. We first investigated the relative increase in TNF mRNA expression from 30 mins to 4 hours after pMCAO. Tumor necrosis factor mRNA increased 2- to 3-fold from 30 mins to 2 hours (Figure 2A) corresponding to the earliest time when TNF mRNA could be detected in in situ hybridized samples (see later). A significant increase in TNF mRNA levels was observed at 4 hours compared with sham-operated mice (P<0.05) and unoperated control mice (P<0.001) (Figure 2A). Sham-surgery with a 1-hour survival resulted in a 1.7-fold increase, whereas a 2-hour survival resulted in a 2.5-fold increase, and a 4-hour survival resulted in a 4.0-fold increase (Figure 2A).
Time profile of microglial-macrophage synthesis of tumor necrosis factor (TNF) mRNA and TNF protein after pMCAO. (
Next, we analyzed the TNF mRNA time profile from 30 mins to 10 days after induction of ischemia (Figure 2B). In addition to 4 hours, TNF mRNA was found to be significantly increased compared with control mice at 6 hours (P<0.01), 12 hours (P<0.001), 24 hours (P<0.001), 2 days (P<0.001), and 5 days (P<0.001). In line with previous histologic studies (Gregersen et al, 2000), TNF mRNA levels peaked at 12 hours when levels in operated mice showed a 57.7-fold upregulation (Figure 2B). Tumor necrosis factor mRNA demonstrated an average of a 2.3-fold increase in the pooled contralateral (nonischemic) hemispheres. Sham-surgery with a 12-hour survival resulted in a 10.5-fold increase in TNF mRNA compared with control. Sham-surgery with a 24-hour survival resulted in a 3.7 increase and sham-surgery with a 5-day survival resulted in a 1.9 increase.
Characteristics and Distribution of Tumor Necrosis Factor Synthesizing Cells
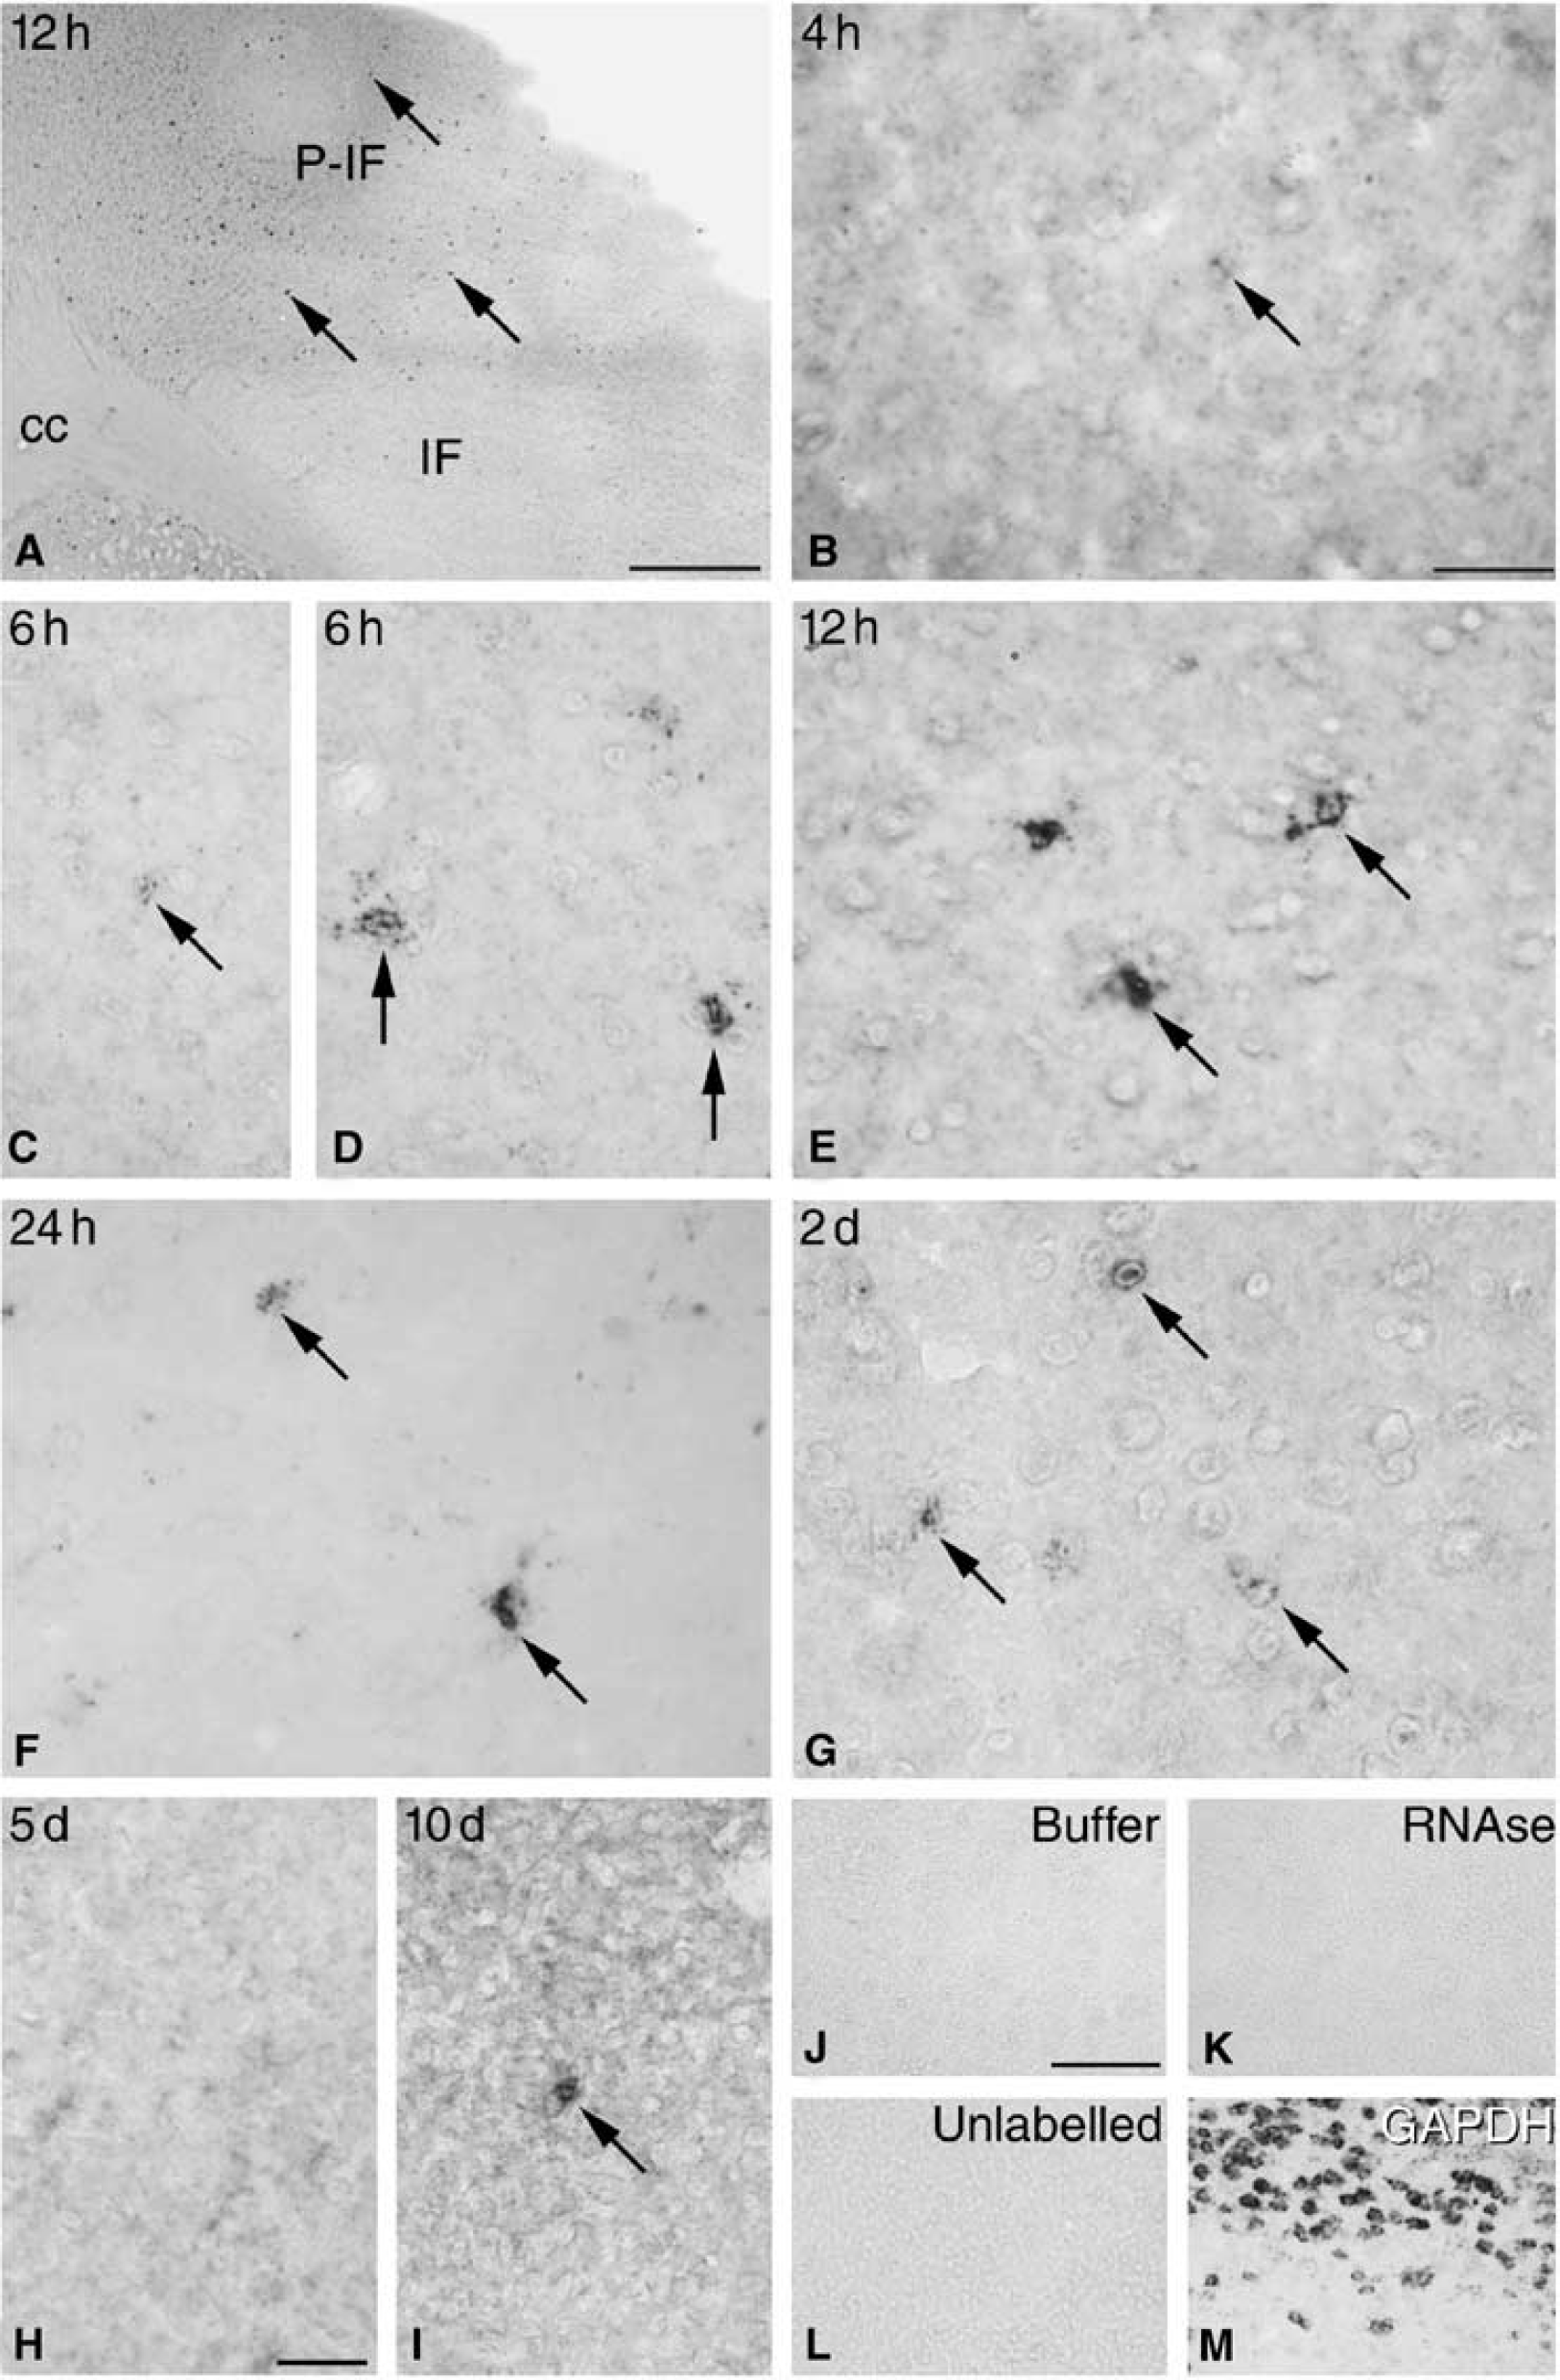
In line with our previous studies (Gregersen et al, 2000; Lambertsen et al, 2002), we also in the present study observed that the TNF mRNA-expressing (mRNA +) and TNF immunoreactive (TNF+) cells were particularly numerous from 12 to 24 hours, at which time points they were located in the peri-infarct and at the edge of the infarct (Figures 3 and 4). Analysis of mice with short postsurgical survival showed that TNF mRNA was expressed in very low levels in sporadic cells with a microglial nuclear morphology (small, elongated nuclei), which were encountered in the developing peri-infarct and within the infarct from 30 mins to 2 hours after pMCAO. However, TNF mRNA + microglial-like cells were first consistently identified in all animals 4 hours after MCA occlusion, at which time they displayed a clearly identifiable punctate bluish-black in situ hybridization signal (Figure 3B). By 6 hours, faintly labelled microglial-like cells were observed within the infarct (Figure 3C) and a mixture of microglial and more strongly labelled and somewhat larger cells with rounded nuclei, presumably macrophages, were found in the peri-infarct and in the corpus callosum (Figures 3D, shown for the peri-infarct only). By 12 hours, strongly labelled microglial-macrophages were located both at the edge of the infarct and in the peri-infarct (Figures 3A and 3E). Mice with a 24-hour survival were massively infiltrated by microglia-macrophages displaying a strong in situ hybridization signal, located primarily in the peri-infarct (Figure 3F). By 2 days, the number of microglia-macrophages infiltrating the peri-infarct was reduced (Figure 3G), and at 5 and 10 days after surgery, we only sporadically observed TNF mRNA + microglia-macrophages within the infarct (Figures 3H and 3I).
Microglial-macrophage synthesis of tumor necrosis factor (TNF) mRNA. (
Sections hybridized with a mixture of TNF probe I and II displayed a stronger in situ hybridization signal compared with sections hybridized with either TNF probe I or TNF probe II alone. Sections hybridized with buffer alone (Figure 3J), RNAse A (Figure 3K), or a 100-fold excess of a mixture of unlabelled TNF probe I and II (Figure 3L) were devoid of signal. Sections hybridized for GAPDH mRNA showed a distinctly different, largely neuronal in situ hybridization signal (Figure 3M).
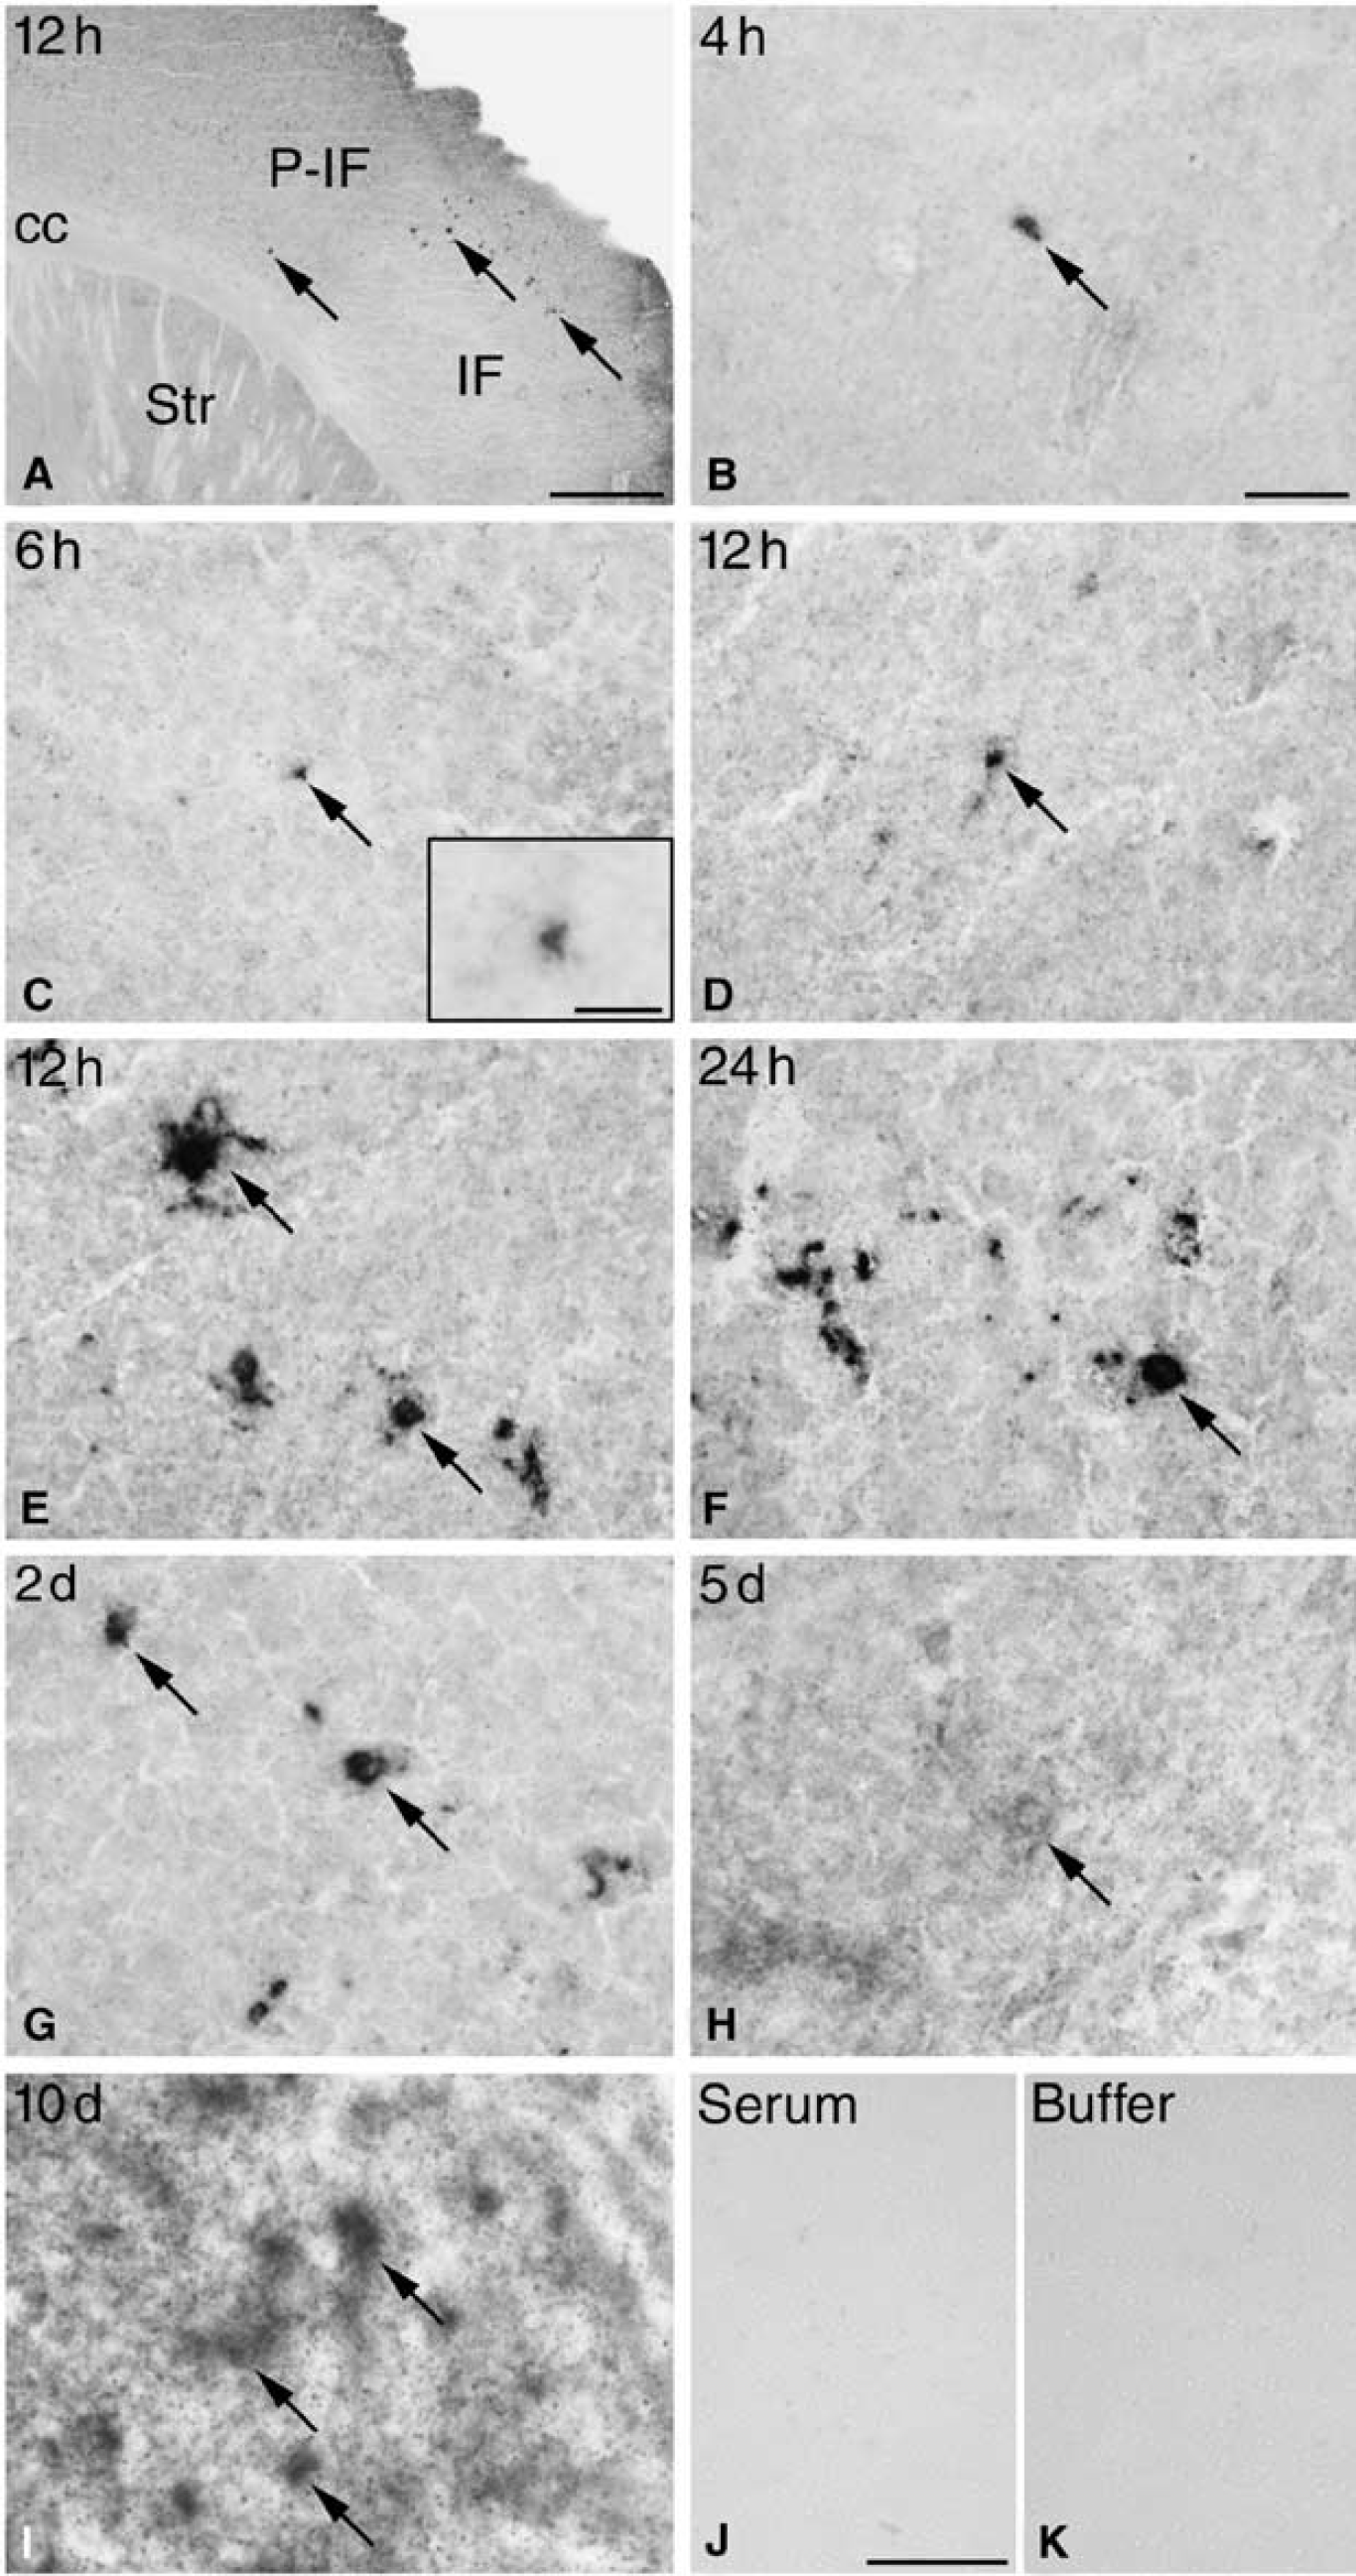
Similar to the in situ hybridized material, weakly stained TNF+ microglial-like cells were occasionally observed in the developing peri-infarct and infarct in mice with 30 mins, and 1 and 2 hours survival time. By 4 hours and more so at 6 hours, TNF immunoreactivity was confined to microglial-like cells and a few macrophage-like cells located in the peri-infarct and within the infarct (Figures 4B and 4C). By 12 hours (Figures 4A and 4D, 4E) and 24 hours (Figure 4F) TNF+ microglia-macrophages were located primarily in the peri-infarct and at the edge of the infarct. At these times, TNF was located to the perinuclear cytoplasm and the proximal processes (Figures 4D-4F). By 2 days, TNF+ microglia-macrophages were located primarily within the infarct, and to a lesser extent in the peri-infarct (Figure 4G, shown for the infarct only). Five and 10 days after induction of ischemia, a weak immunohistochemical signal was located to a few round macrophage-like cells within the infarct (Figures 4H, 4I). Control sections incubated with rabbit serum or buffer alone were blank (Figures 4J, 4K).
Microglial-macrophage synthesis of tumor necrosis factor (TNF) protein. (
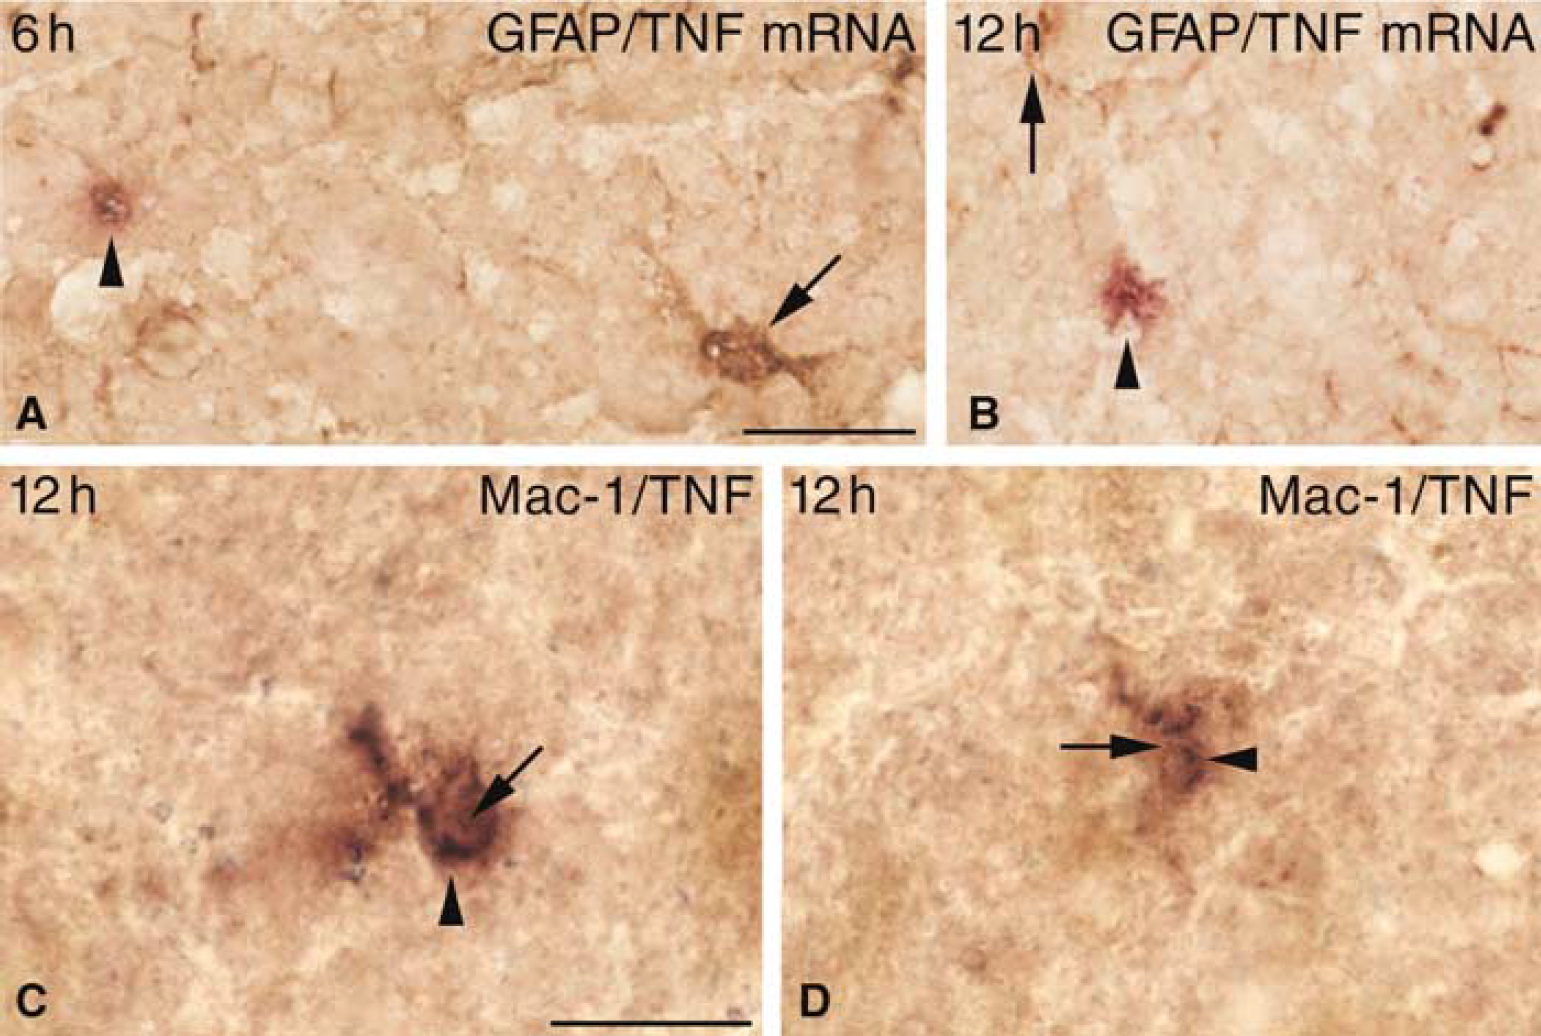
As an extension of our previous findings (Gregersen et al, 2000; Lambertsen et al, 2002), we found TNF mRNA to be expressed by GFAP immunonegative cells not only at 12 hours but also as early as 6 hours after induction of ischemia (Figures 5A and 5B). The non-astrocytic origin of TNF corresponded to colocalization of TNF to a subpopulation of Mac-1+ microglia-macrophages at both 6 hours and 12 hours (Figures 5C and 5D, shown for 12 hours only) after the induction of ischemia. Because of a low single-cell level of TNF mRNA and TNF protein, attempts to specify cellular TNF synthesis failed in mice with 4 hours survival.
Characterization of Neuronal TNF mRNA Expression and TNF Immunoreactivity
Neuronal TNF mRNA and TNF protein synthesis in the peri-infarct and the surrounding nonischemic neocortex was investigated in mice with 30 mins to 10 days survival (Figures 3 and 4, shown for 4 hours until 10 days only). As illustrated in Figure 3, we were unable to localize TNF mRNA in situ hybridization signal to neuronal-like cells in the peri-infarct and surrounding neocortex in MCA-operated mice as well as in normal mice (Figure 3). Similarly, neuronal TNF immunoreactivity remained at constant very low or background levels in the peri-infarct and surrounding neocortex (Figure 4). The only specifically labelled cells were, as previously described, cells with a microglial-macrophage nuclear morphology (Figures 3 and 4).
To additionally confirm these observations, we, in a separate experiment, reinvestigated neuronal TNF synthesis up to 6 hours after surgery. There was no evidence of neuronal TNF mRNA expression or an upregulation of the very low neuronal TNF immunoreactivity in the peri-infarct or in the surrounding neocortex. The latter is illustrated in Figure 6 showing layers I to III of the cingulate gyrus of mice with 30 mins to 6 hours survival. When present, the immunohistochemical signal was faint and diffuse, and thereby distinctly different from the bluish-black reaction product located to the TNF synthesizing microglia-macrophages in the peri-infarct or in the infarct of the same and other animals. Taken together, these findings suggest that there is no or undetectable induction of TNF mRNA and hence TNF synthesis in neurons, and at most very small changes in neuronal TNF immunoreactivity in the acute phase after induction of focal cerebral ischemia in SJL mice.
Cellular synthesis of tumor necrosis factor (TNF) mRNA and TNF protein after pMCAO. (
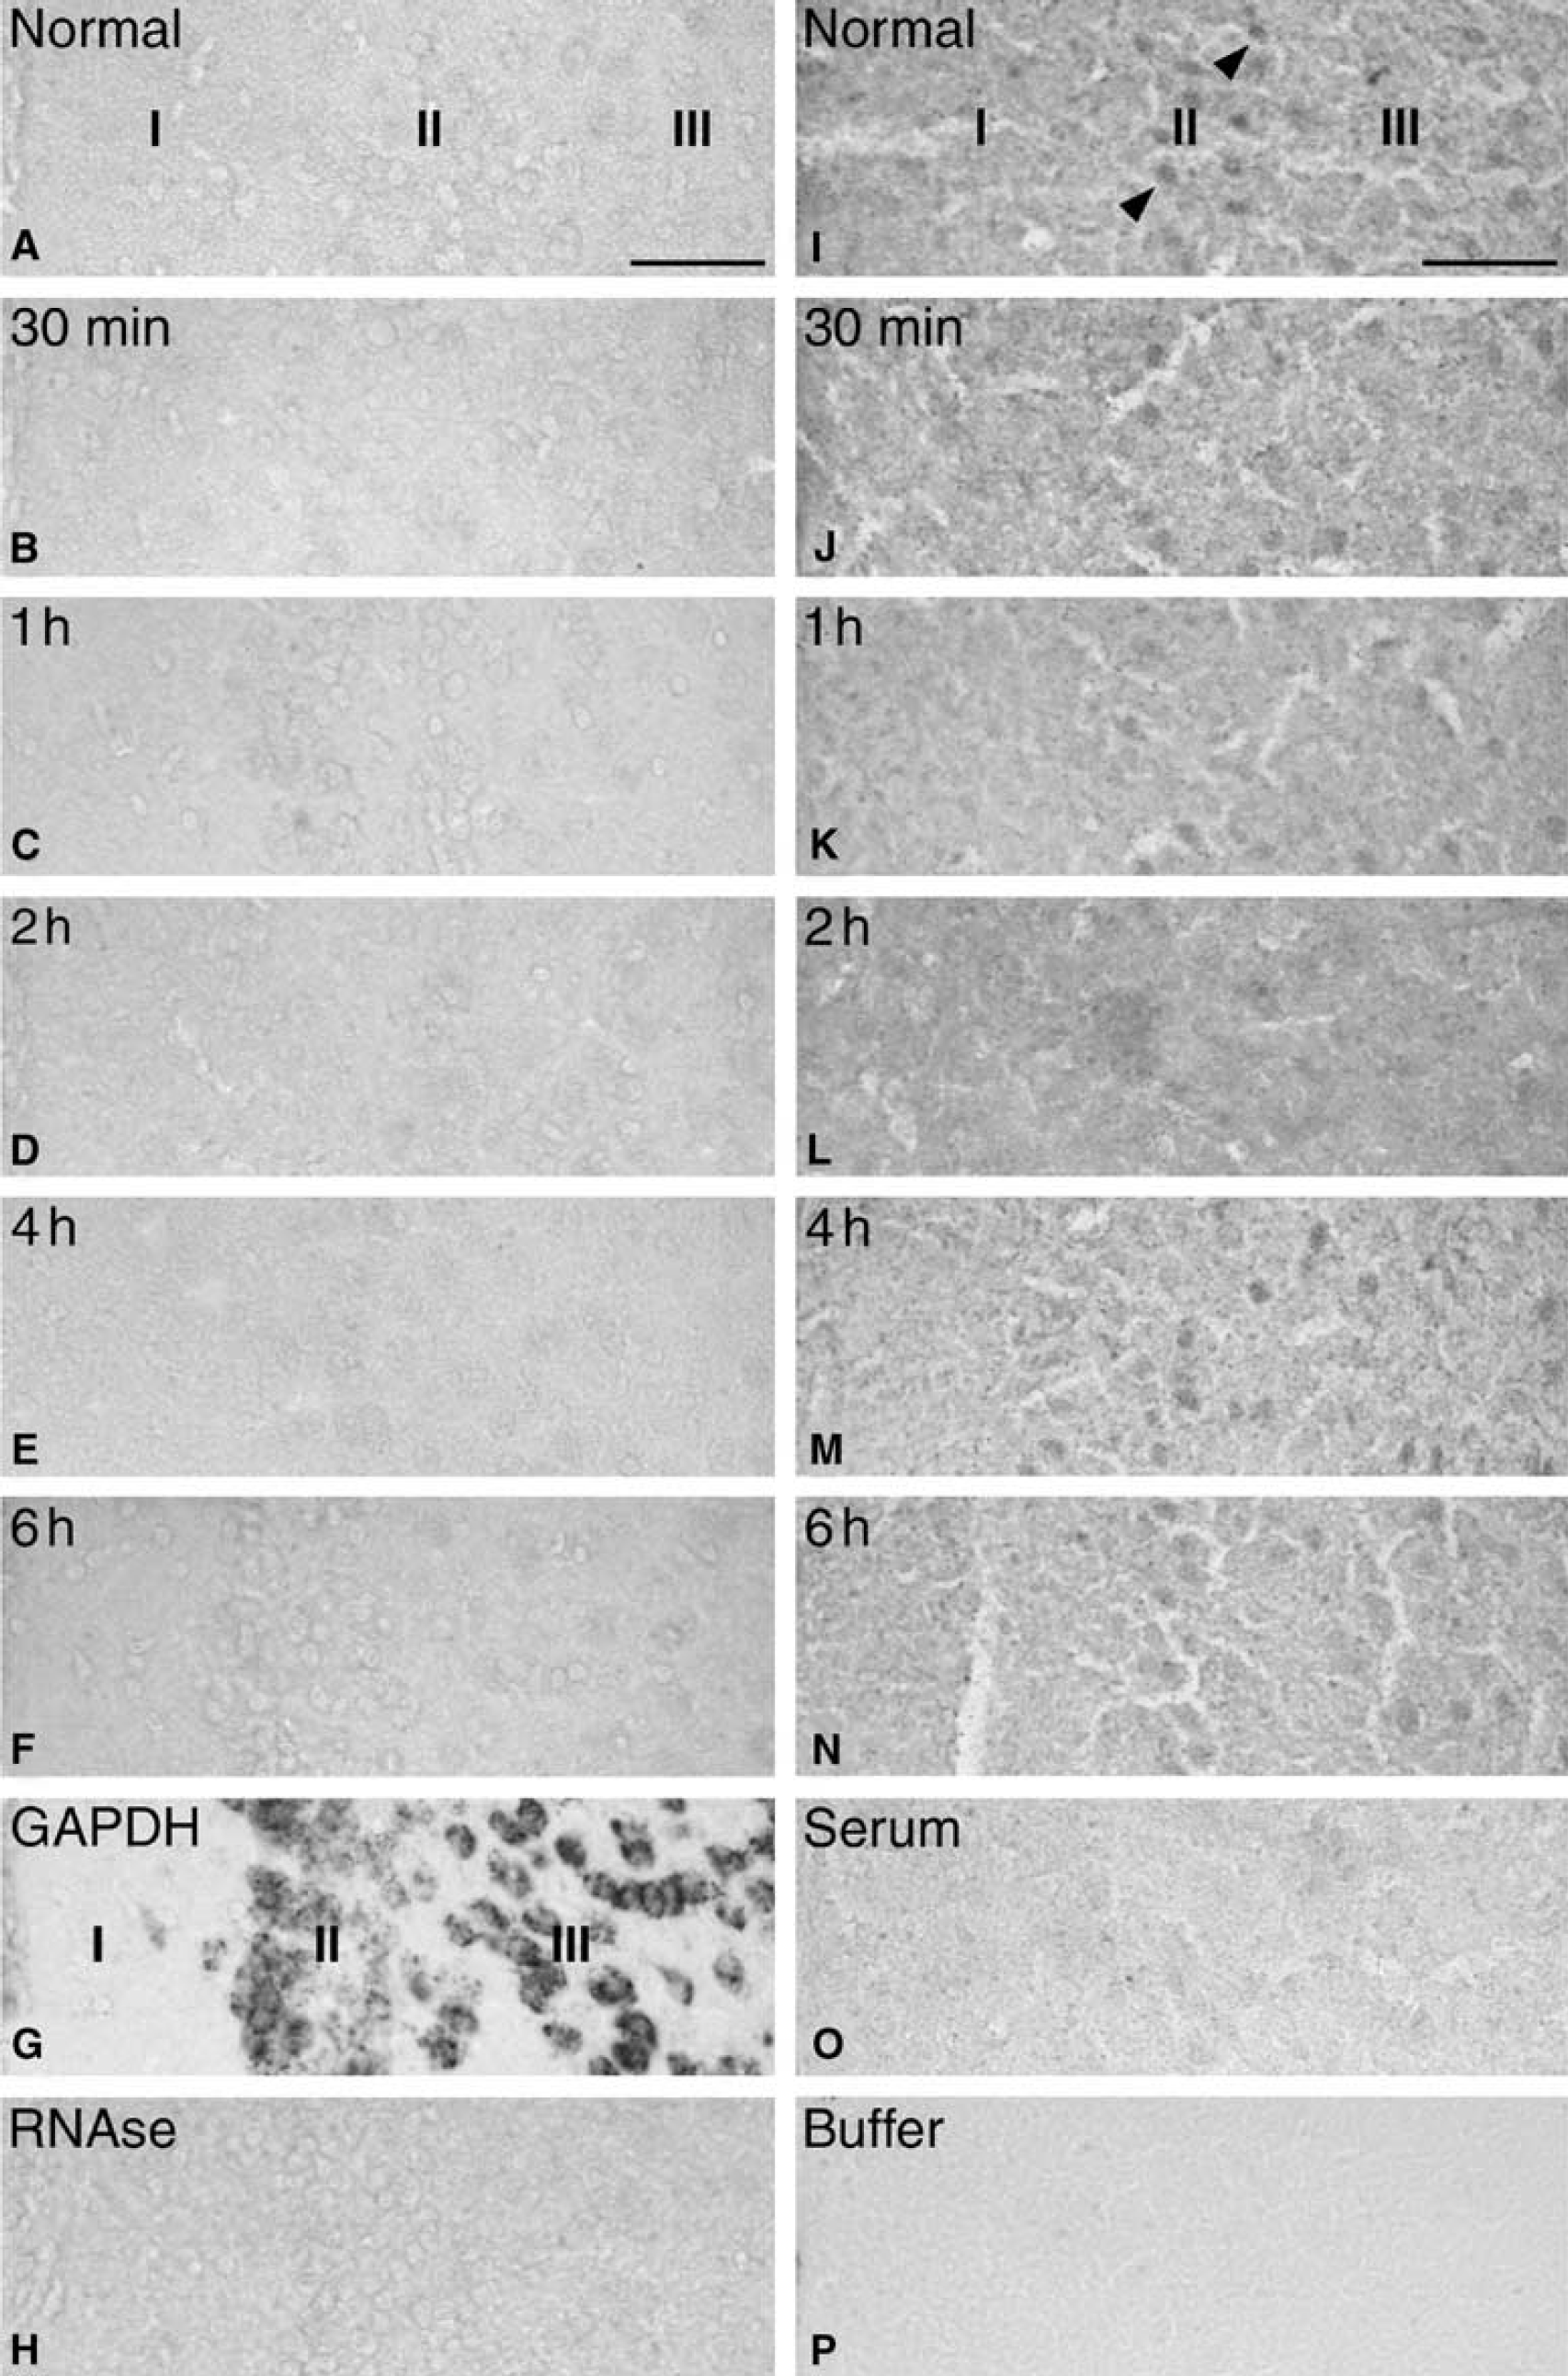
Neuronal synthesis of TNF mRNA and protein after pMCAO in SJL mice. (
Time Profile of Tumor Necrosis Factor Synthesizing Microglia-Macrophages
Using an approximated stereological counting technique (Lambertsen et al, 2002), we estimated the total number of TNF mRNA+ and TNF+ microglia-macrophages within the infarct and in the peri-infarct at 30 mins, 1, 2, 4, 6, 12, and 24 hours, and 2, 5, and 10 days after pMCAO. The total number of TNF mRNA+ and TNF+ microglia-macrophages in mice with 30 mins, 1 and 2 hours, 5 and 10 days survival was very low and was estimated to be <500 cells (Figures 2C and 2D). As indicated in the RT rt-PCR analysis, there was a substantial number of TNF mRNA+ cells at 4 hours, which had increased almost 10-fold at 6 hours to reach peak numbers 12 hours after surgery (Figure 2C). Such cells were present in reduced numbers at 2 days (Figure 2C) and only sporadically present at 5 and 10 days (Figure 2C). In comparison, the number of TNF+ cells reached maximal numbers at 24 hours (Figure 2D), had declined again by 2 days (Figure 2D) and had almost disappeared by 5 and 10 days (Figure 2D). Unoperated control mice were devoid of TNF mRNA+ and TNF+ cells. As expected, the TNF mRNA+ and TNF+ cells were located evenly along the rostroaudal axis of the infarcts (Figures 2E and 2F).
Time Profile of Microglial-Macrophage Reactions
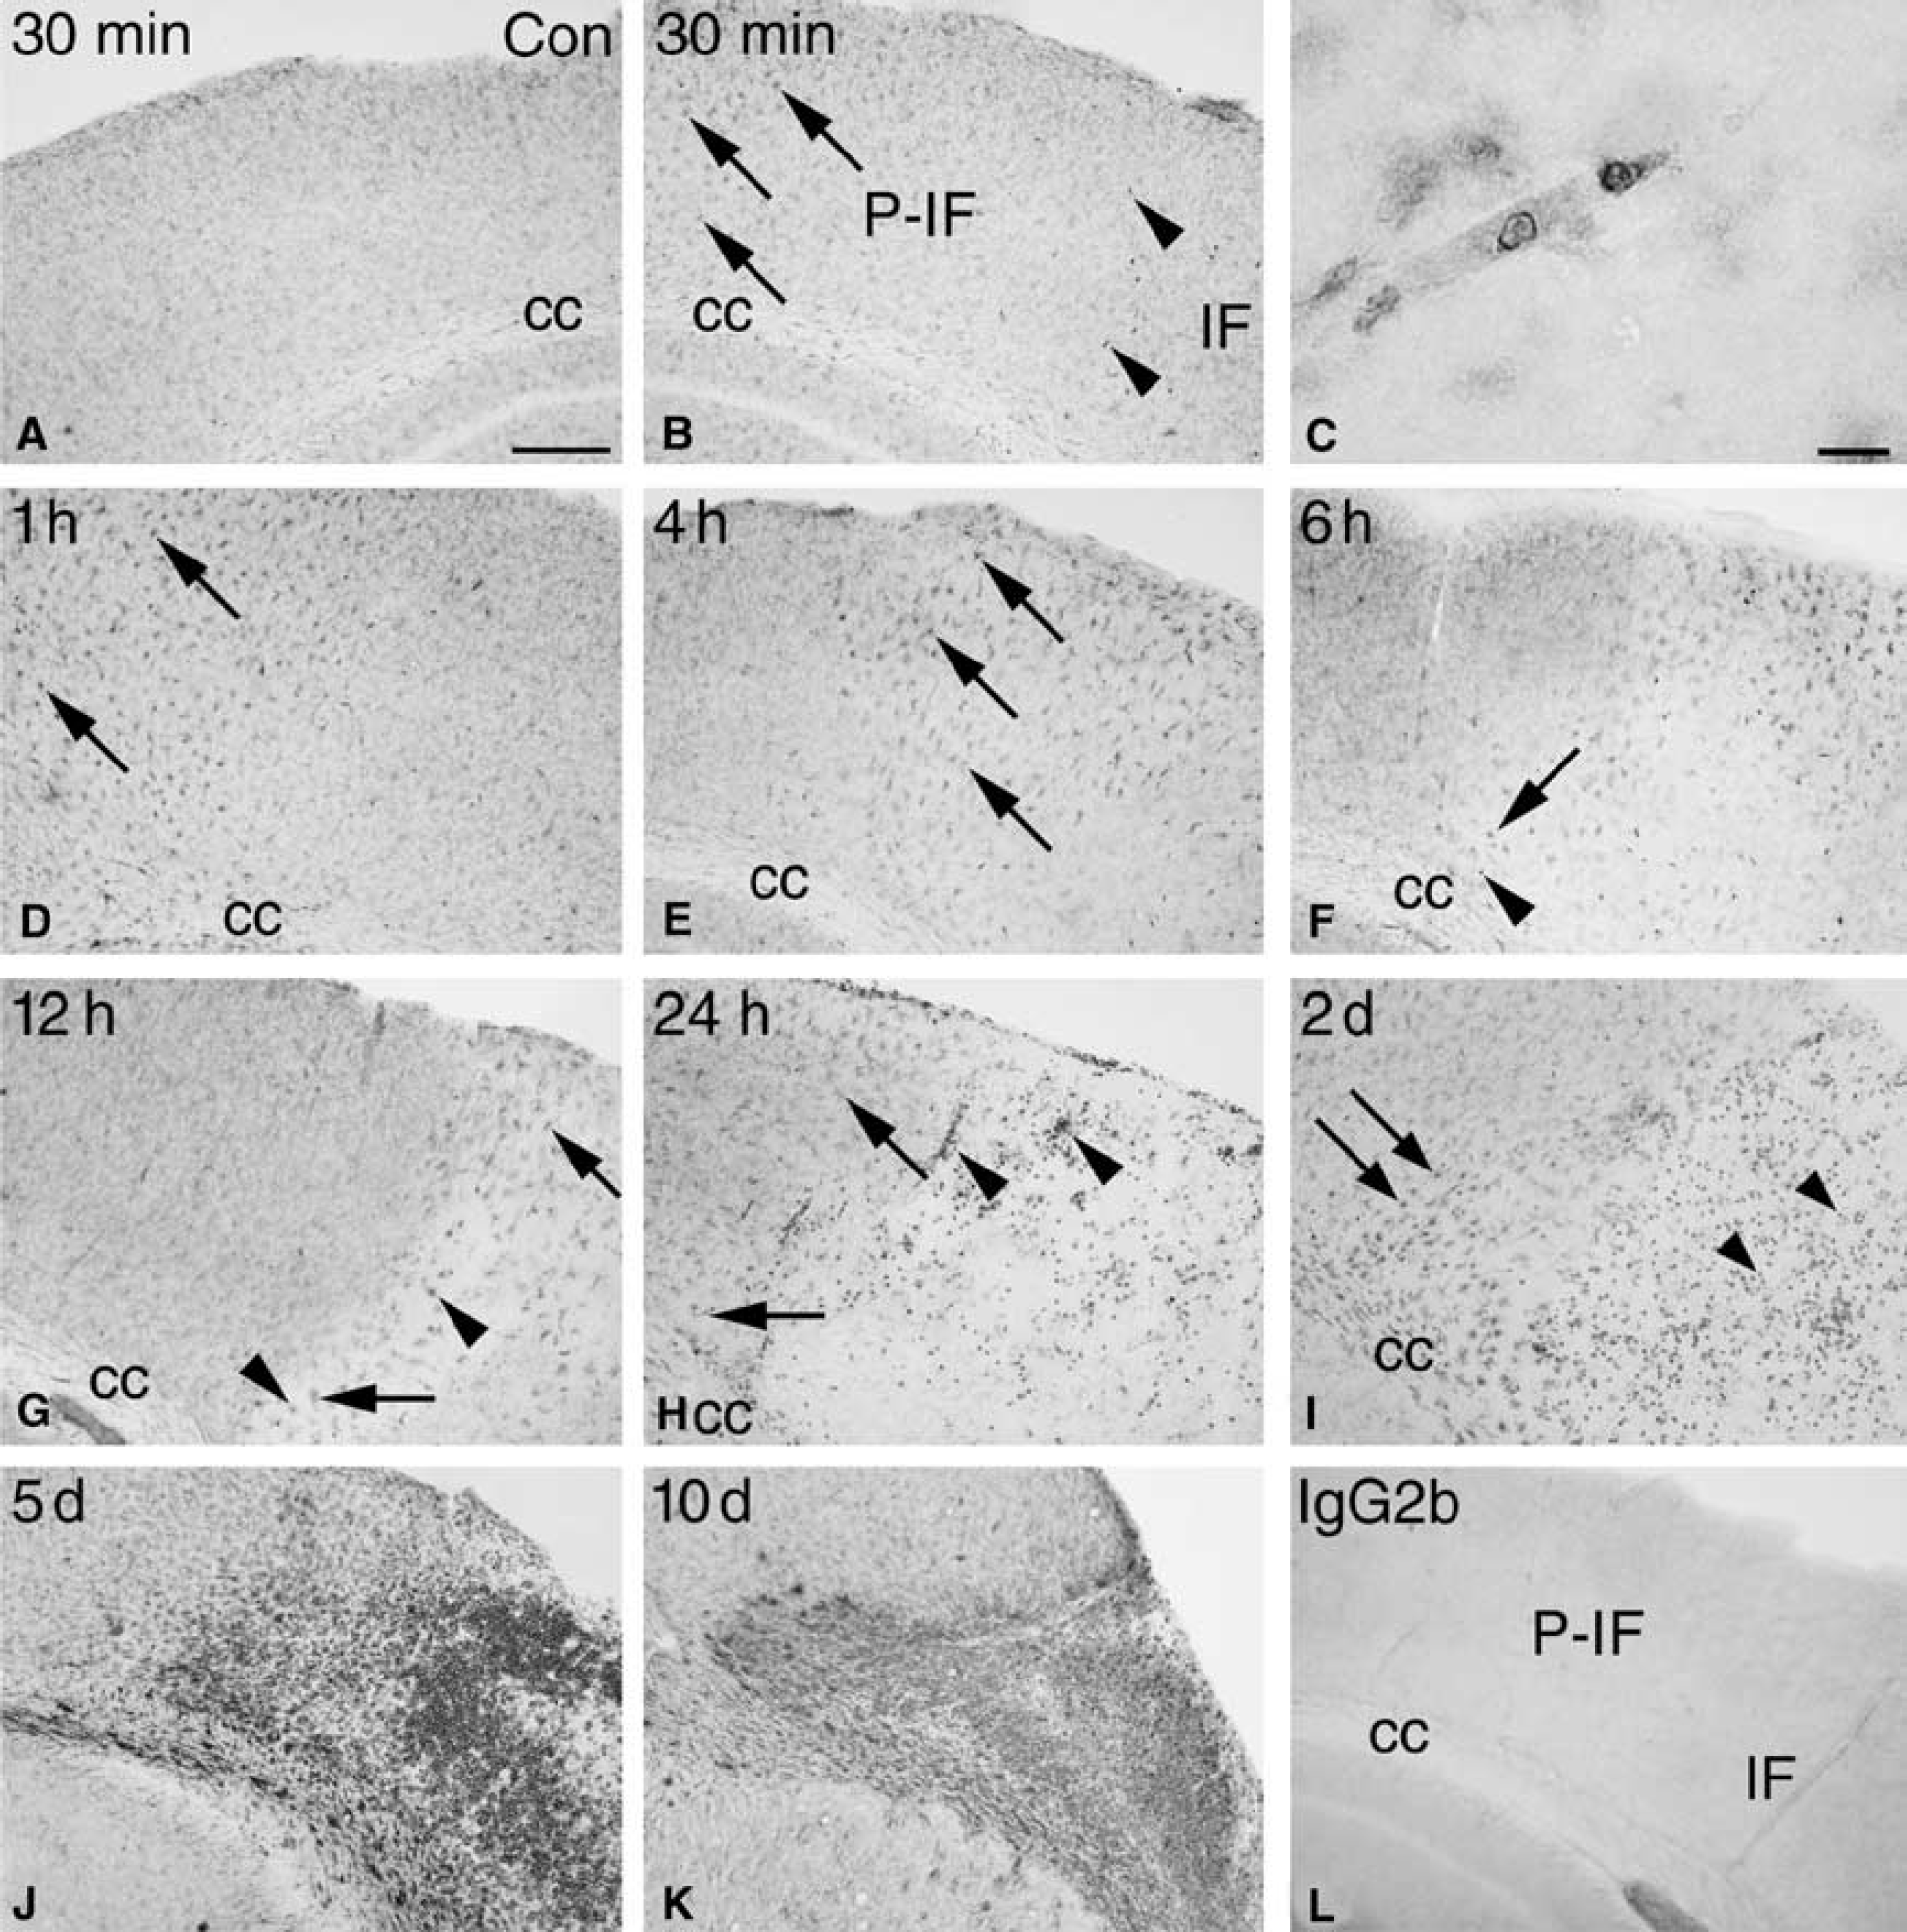
Having established that the major source of TNF in the peri-infarct and the infarct after pMCAO is microglia-macrophages, we reacted parallel sections for the microglial-macrophage marker Mac-1 and analyzed their activation pattern in the infarct, the peri-infarct and surrounding neocortex (Figure 7). Microglial activation was first evident in the noninfarcted ipsilateral cingulate and frontal cortices, where microglia showed upregulated Mac-1 immunoreactivity at 30 mins after pMCAO. This reaction was stronger at 1 hour, but had declined at 2 hours and disappeared at 4 hours (Figures 7B, 7D, 7E). Microglia in the contralateral hemisphere maintained the appearance of resting microglia at 30 mins (Figure 7A), but not at 1 hour when layer I and II in the cingulate and frontal cortices displayed a band of lightly activated microglia. As observed in the ipsilateral hemisphere, this microglial reaction subsided from 2 to 4 hours.
Time profile of microglial-macrophage reactions after pMCAO. (
In the peri-infarct there was a steady increase in microglial activation starting with the appearance of lightly activated microglia at 30 mins after the induction of ischemia (Figure 7B), which had additionally increased by 1 to 2 hours (Figure 7D, shown for 1 hour only), 4 hours (Figure 7E), and more so at 6 hours (Figure 7F), when at first very few, and later, increasing numbers of round, macrophage-like cells were detected. Microglia within the future infarct appeared unaffected at 30 mins and only slightly affected at 1 hour (Figures 7B and 7D). Thereafter the majority of the Mac-1+ microglia deteriorated, while some developed an activated appearance (Figures 7E-7K). From 30 mins onward, we also observed a number of round monocyte-like cells, which appeared to be trapped within the vasculature in the developing infarct (Figure 7C). From 12 hours, and more so at 24 hours and 2 days, there appeared to be a strong extravasation of large, round macrophages into the infarct from vessels located at the transition of the infarct and peri-infarct (Figures 7H and 7I) and a strongly increased Mac-1 staining intensity of microglia located in the peri-infarct and in the corpus callosum (Figures 7H and 7I). Five and 10 days after induction of ischemia, the infarct was massively infiltrated with brain macrophages while the peri-infarct contained a mixture of macrophages and strongly activated microglia (Figures 7J and 7K). The isotype control (Figure 7L) and the buffer control were both blank.
DISCUSSION
The present data suggest that microglia-macrophages, and especially activated microglia, are the predominant source of TNF during the first 6 hours after induction of pMCAO. Thereafter blood-borne macrophages, infiltrating the peri-infarct and the infarct, gradually appear to become the major sources of TNF. This conclusion is based on the fact that we (1) were able to consistently visualize and quantify TNF mRNA+ and TNF+ microglial-like cells, at 4 hours after induction of ischemia, and (2) succeeded to extend our previous demonstrations of a nonastroglial, microglial-macrophage origin of TNF at 12 and 24 hours (Gregersen et al, 2000; Lambertsen et al, 2002), to show that TNF is also produced by Mac-1+ GFAP− cells at 6 hours. The conclusion is further supported by (3) the almost complete absence of Mac-1+ macrophage-like cells in the developing infarct and peri-infarct until 4 to 6 hours after MCA occlusion, and (4) the absence of an ischemia-induced upregulation of the very low (if any) neuronal TNF mRNA and TNF protein levels from 30 mins and up to at least 6 hours after induction of ischemia. These histologic observations were in accordance with the RT rt-PCR demonstration of a 2 to 3-fold increase in brain TNF mRNA levels from 30 mins to 2 hours after induction of ischemia, and a statistically significant increase from 4 to 6 hours after induction of ischemia, corresponding to the time of a beginning increase in the number of TNF mRNA+ microglia-macrophages in peri-infarct and infarct.
Based on our observations, we suggest that microglia are the major source of TNF in the acute phase after pMCAO in the mouse. This is supported by results obtained by Buttini et al (1996), who studied the cellular synthesis of TNF in spontaneously hypertensive rats subjected to permanent occlusion of the proximal MCA. Like us, these investigators observed sporadic TNF mRNA+ and TNF+ cells with microglial morphology from 30 mins to 3 hours after arterial occlusion, whereafter they observed a shift in the morphology of the TNF synthesizing cell population, which at 8 hours preferentially consisted of round macrophage-like cells (Buttini et al, 1996). The observations by Buttini et al (1996) and by us are also consistent with results obtained in bonemarrow chimeric mice subjected to permanent or transient MCA occlusion (Priller et al, 2001; Tanaka et al, 2003). In these studies donor bonemarrow-derived monocytes-macrophages were first observed in the infarct and at the edge of the infarct from 12 hours and in considerably larger numbers at 24 hours after surgery (Priller et al, 2001; Tanaka et al, 2003). Besides microglia-macrophages, PMNs are able to synthesize TNF (Määttä et al, 1998). However, in line with studies of pMCAO in rats (Barone et al, 1991) and previous studies in C57 × 129 hybrid mice (Gregersen et al, 2000), the analysis of the toluidine blue-stained sections showed no evidence of PMNs until 12 to 24 hours after occlusion. The time profile of their appearance thereby excludes these cells from contributing to the TNF production in the acute phase after pMCAO in SJL mice.
Even though immunohistochemical studies have suggested that neurons synthesize TNF after focal and global cerebral ischemia both in the rat and in the human (Liu et al, 1994; Botchkina et al, 1997; Dziewulska and Mossakowski, 2003; Sairanen et al, 2001a, b ), the presently obtained data argue against that neurons should be major sources of TNF in pMCAO in mice. Since we at no time found evidence of a distinctly neuronal TNF mRNA in situ hybridization signal, the diffuse and faint immunohistochemical staining of the layer II to III neurons in the cingulate gyrus in the unmanipulated CNS and in the CNS of some, but not all, mice subjected to pMCAO, is likely to reflect binding of soluble TNF to neuronal TNF receptors, and possibly internalization of TNF (Schütze et al, 1999). The observation of the very low constitutive levels of TNF mRNA and TNF protein in normal CNS (Taupin et al, 1993; Jensen et al, 2000; Lambertsen et al, 2001), and the present demonstration of undetectable or very low levels of TNF mRNA and TNF protein in the tissue sections from unmanipulated CNS, raise questions about the cellular sources of TNF in normal CNS. It is possible that a broader spectrum of neural cells, including neurons, synthesize such low levels of TNF mRNA and TNF protein, that this remains below the detection level of the histologic techniques. What remains indisputable in the present study is that microglia-macrophages in the peri-infarct and the infarct respond to pMCAO by increasing their synthesis of TNF, and that this increase in the case of TNF mRNA may account for the very acute 2- to 3-fold as well as the subsequent 8- to 11-fold increase in TNF mRNA levels observed from 30 mins to 6 hours after induction of focal cerebral ischemia.
The present demonstration of a 2- to 3-fold increase in brain TNF mRNA levels from 30 mins to 1 to 2 hours, a significantly elevated 8-fold increase at 4 hours, and our demonstration of peak levels as well as peak numbers of TNF mRNA+ microglia-macrophages at 12 hours after arterial occlusion adds to and is in line with previous reports on TNF mRNA expression in both transient and permanent models of MCAO in mice (Gregersen et al, 2000; Wang et al, 2001). In studies of transient MCAO in rats, TNF mRNA levels have been observed to peak at 3 hours (Wang et al, 1994) or 6 hours (Berti et al, 2002), whereas in pMCAO TNF mRNA levels were observed to peak either at 3 hours (Buttini et al, 1996), 6 hours (Kim et al, 2002), or 12 hours (Liu et al, 1994). Regarding the size of the ischemia-induced increase in TNF mRNA expression, we in the present study observed a 58-fold increase in the level of TNF mRNA in mice with 12 hours postsurgical survival relative to unoperated control mice. This increase is larger than the 28-fold increase observed in rats at 12 hours after induction of pMCAO (Wang et al, 2001), and the 20-fold increase observed in rats 6 hours after a 2-hour episode of transient MCAO (Berti et al, 2002). The data on TNF protein is more sparse, the most thorough study being by Buttini et al (1996), who used Western blot and immunohistochemistry to demonstrate TNF from 8 hours to 1 day after induction of pMCAO in the rat. Like us, Buttini et al (1996) observed that peak TNF protein levels are achieved a few hours later than peak mRNA levels. There are so far no detailed quantitative studies on ischemia-induced changes in the level of TNF protein, and no information on the levels of transmembrane versus soluble TNF in the acute phase after pMCAO in the mouse.
The relevance of dissecting the cellular sources of TNF in the acute phase after pMCAO is emphasized by the findings of both neuroprotective (Bruce et al, 1996; Nawashiro et al, 1997; Gary et al, 1998) and neurotoxic (Dawson et al, 1996; Barone et al, 1997; Nawashiro et al, 1997a; Yang et al, 1998) effects of TNF in experimental stroke. The neuroprotective effects of recombinant soluble TNF-R1 receptor (TNF-binding protein) and anti-TNF antibody have been observed after intravenous, intraperitoneal as well as after topical application (Dawson et al, 1996; Barone et al, 1997; Nawashiro et al, 1997a; Yang et al, 1998). In all studies, anti-TNF-therapy was administered either before or at the time of ischemia, which ideally, provided that the therapy gets access to the neural parenchyma in the peri-infarct and in case of transient MCAO also the infarct, would allow neutralization of constitutive as well as de novo-produced TNF irrespective of the cellular sources. There is no single explanation to the observed duality in TNF's neuroprotective and neurotoxic functions, but factors such as differences in the cellular synthesis and shedding of transmembrane TNF, the densities of surface TNF-R1 and -R2 receptors, their intracellular signalling cascades and the concentrations of soluble TNF receptors in the acute phase after induction of ischemia are believed to be of importance (Barone et al, 1997; Hallenbeck, 2002). Both the TNF-R1 and -R2 receptor have been reported to be upregulated on neurons and glia from 6 to 24 hours after an ischemic attack in rats (Botchkina et al, 1997) and from days to weeks after a stroke in humans (Dziewulska and Mossakowski, 2003). The view that even small changes in the level of bioactive TNF may have a significant effect on neurons gains support from the recent demonstration that endogenous TNF increases the strength of excitatory synaptic transmission (Beattie et al, 2002). In this context, it is interesting that studies in favor of a neuroprotective function are based primarily on studies in TNF-R knockout mice (Bruce et al, 1996; Gary et al, 1998), whereas studies in favor of a neurotoxic effect are based primarily on studies blocking the effect of TNF using TNF neutralizing antibody or TNF-binding protein (Dawson et al, 1996; Nawashiro et al, 1997a, Barone et al, 1997; Yang et al, 1998).
In conclusion, the present data provide evidence that microglia-macrophages, and especially microglia, are the predominant source of the pathophysiologically important TNF, which is produced in the acute phase from 1 to 6 hours after induction of cerebral ischemia in the mouse. The apparent preservation of the microglial-macrophage TNF response across different experimental models, species (mouse and rat) and strains raises the possibility that microglia-macrophages in the human brain may respond in a very similar way to a stroke.
Footnotes
Acknowledgements
The authors acknowledge the excellent technical and photographic assistance supported by Sussanne Petersen, Inger Margrethe Rasmussen, Lene Jørgensen, Albert Meier, AnneMette Durand, Camilla Rasmussen, and the Laboratory of Biomedicine, University of Southern Denmark, Odense, Denmark.