
Abstract
Although certain metabolic characteristics such as interictal glucose hypometabolism are well established for temporal lobe epilepsy (TLE), its pathogenesis still remains unclear. Here, we performed a comprehensive study of brain metabolism in a mouse model of TLE, induced by pilocarpine-status epilepticus (SE). To investigate glucose metabolism, we injected mice 3.5-4 weeks after SE with [1,2- 13 C]glucose before microwave fixation of the head. Using 1 H and 13 C nuclear magnetic resonance spectroscopy, gas chromatography—mass spectrometry and high-pressure liquid chromatography, we quantified metabolites and 13 C labeling in extracts of cortex and hippocampal formation (HF). Hippocampal levels of glutamate, glutathione and alanine were decreased in pilocarpine-SE mice compared with controls. Moreover, the contents of N-acetyl aspartate, succinate and reduced nicotinamide adenine dinucleotide (phosphate) NAD(P)H were decreased in HF indicating impairment of mitochondrial function. In addition, the reduction in 13 C enrichment of hippocampal citrate and malate suggests decreased tricarboxylic acid (TCA) cycle turnover in this region. In cortex, we found reduced 13 C labeling of glutamate, glutamine and aspartate via the pyruvate carboxylation and pyruvate dehydrogenation pathways, suggesting slower turnover of these amino acids and/or the TCA cycle. In conclusion, mitochondrial metabolic dysfunction and altered amino-acid metabolism is found in both cortex and HF in this epilepsy model.
INTRODUCTION
Temporal lobe epilepsy (TLE) is one of the most common forms of human epilepsy and is associated with a high level of drug resistance among patients. The mechanisms underlying the pathogenesis of TLE still remain unclear, although increasing evidence points to a disturbance in amino-acid neurotransmitter homeostasis and energy metabolism, as well as neuronal injury. Metabolic characteristics of human TLE include interictal glucose hypometabolism and a decrease in the levels of the neuronal marker N-acetyl aspartate (NAA) in the epileptogenic region.1,2 Increased levels of extracellular glutamate in epileptogenic hippocampi have been reported before and during seizures 3 and interictally. 4 Moreover, it has been suggested that the uptake of glutamate from the extracellular space by astrocytes is slower in the epileptic brain as the expression of glutamine synthetase, the glial enzyme that converts glutamate to glutamine, was decreased in the epileptogenic hippocampi from patients with TLE.5,6
Changes in brain metabolism in rat models of TLE resemble those reported in human TLE such as interictal glucose hypometabolism demonstrated in lithium-pilocarpine rats, 7 as well as alterations in NAA and glutamate reported in post-status epilepticus (SE) models induced by kainic acid and lithium-pilocarpine.8-10
There are, however, few comprehensive studies on brain metabolism in mouse models of TLE, although this should be of interest owing to advantages of using mice in epilepsy research such as a wider range of opportunities for genetic manipulation and potentially shorter experiment duration with reduced expenses.
In the present study, we aimed to investigate glucose, amino-acid, and energy metabolism in a well-established mouse model of TLE, specifically 3.5-4 weeks after SE was induced by pilocarpine. Injection of the muscarinic agonist pilocarpine leads to SE with the subsequent appearance of spontaneous recurrent seizures, which have been characterized in many laboratories by electroencephalography11-13 and behaviorally in most mouse strains.14,15 Histopathological alterations in this model include neuronal loss, mossy fiber sprouting, and hippocampal sclerosis, thus reproducing characteristics of human TLE.14,15 We utilized 1 H nuclear magnetic resonance (NMR) spectroscopy and high-pressure liquid chromatography (HPLC) to obtain detailed maps of the metabolite content in cerebral cortex and hippocampal formation (HF) in pilocarpine-SE mice. To be able to determine glucose metabolism, we injected animals with [1,2- 13 C]glucose 15 minutes before microwave fixation of the head, and evaluated brain extracts using 13 C NMR spectroscopy and gas chromatography-mass spectrometry (GC-MS).
MATERIALS AND METHODS
Animals
For experiments, 7-8-week-old male CD1 mice (Animal Resources Center, Canningvale, Western Australia, Australia) were used. All mice were housed in individual cages under a 12-hour light-dark cycle. The animals were adapted to these conditions for at least 1 week before being used in the experiments. Food (SF11-027 standard diet, Specialty Feeds, Glen Forrest, Western Australia, Australia) and water were available ad libitum. All experiments were approved by the University of Queensland's Animal Ethics Committee and followed the guidelines of the Queensland Animal Care and Protection Act 2001. All efforts were made to minimize the suffering and the number of animals. This work is written according to the ARRIVE guidelines (http://www.nc3rs.org/ARRIVE).
Pilocarpine-SE Model
To minimize peripheral side effects, 35 CD1 mice, weighing 25–40g, were injected with methylscopalamine (2 mg/kg intraperitoneally in 0.9% NaCl; Sigma Aldrich, St Louis, MO, USA) 15-30 minutes before pilocarpine (Sigma Aldrich) injections. A single dose of pilocarpine was administered (330345 mg/kg subcutaneously in 0.9% saline). Twenty-three pilocarpine-injected mice (66%) experienced behavioral SE as defined by continuous seizure activity consisting mainly of whole-body continuous clonic seizures, while nine mice died and three showed no SE. Ninety minutes after pilocarpine administration all mice were injected with pentobarbital (22.5 mg/kg intraperitoneally in 0.9% NaCl; Provet, Northgate, Queensland, Australia) followed by 1 mL 4% dextrose in 0.18% saline (subcutaneous). After SE, mice were monitored twice daily. Weight and appearance were recorded, along with any observed spontaneous or handling-induced seizures. All mice were hand-fed moistened cookies and injected with 5% dextrose in lactate Ringer's solution twice a day for about 3 days and thereafter when needed. No systematic observations were done to detect spontaneous seizures in mice, but 21 mice with SE were observed to have handling induced seizures and altered behavior, including lack of nest building and all mice had lost 10–20% of weight after SE. Two pilocarpine-SE mice died suddenly overnight in their home cages at 10 and 21 days, respectively. Autopsies did not reveal causes of death and therefore sudden unexplained death in epilepsy or severe seizures are likely. Ten of these mice were randomly selected for this study. When video-electroencephalography monitored, all male CD1 mice subjected to our pilocarpine–SE model developed spontaneous recurrent seizures and/or interictal spikes in another laboratory at our university, 13 similar to a previous report in the same mouse strain. 12 Eleven control mice received methylscopalamine and pentobarbital only and 0.9% saline instead of pilocarpine.
[1,2- 13 C]glucose Injections and Tissue Extraction
At 3.5–4 weeks after SE, 10 pilocarpine–SE mice and 11 control mice were injected in random order with [1,2- 13 C]glucose (0.3 mol/L intraperitoneal 543 mg/kg; 99% 13 C; Cambridge Isotope Laboratories, Woburn, MA, USA). At 15 minutes after glucose injection, the mice were subjected to microwave fixation of their heads at 5 kW for 0.80–0.86 seconds, instantaneously inactivating brain metabolic reactions (Model MMW-05, Muromachi, Tokyo, Japan). The time interval of 15minutes between microwave fixation and 13 C glucose injection ensures substantial 13 C label incorporation in brain metabolites without washout (pilot experiments, results not shown). After microwave fixation, mice were decapitated, trunk blood was collected, and cerebral cortices and HF were dissected and stored at - 80 °C till extraction. The HF included the dentate gyrus, hippocampus proper, subiculum, but not entorhinal cortex. The blood samples were centrifuged at 1,000 g for 5 minutes and the serum was later analyzed for total amounts of glucose using the glucose oxidase method (Sigma Aldrich), which revealed similar concentrations of blood glucose in the two groups (n = 9 pilocarpine–SE mice 14.80 ± 0.58 mmol/L; 8 control mice 16.88 ± 0.97 mmol/L; P = 0.11).
The tissue samples were masked and subjected to a water/methanol–chloroform extraction method as previously described. 16 L-2-aminobutyric acid (α-ABA) (Sigma Aldrich) was added as an internal standard for HPLC analysis and samples were then homogenized in 200 mL of methanol using a Vibra Cell sonicator (Model VCX 750, Sonics and Materials, Newtown, CT, USA). After extraction, samples were lyophilized and all subsequent analyses were performed by investigators masked to the treatment.
Metabolite Quantification
We quantified amounts of metabolites in cerebral cortex and HF using HPLC and 1 H NMR spectroscopy, amounts of 13 C in cortical metabolites using 13 C NMR spectroscopy and percentage 13 C enrichment in HF with GC–MS, owing to the small amount of hippocampal tissue. The percentage enrichment with 13 C in glucose, alanine, and lactate in both brain regions was determined using 1 H NMR spectroscopy.
1 H and 13 C NMR Spectroscopy
Lyophilized samples were dissolved in 120 μL of D2O (99.9%; Cambridge Isotope Laboratories) containing 0.10% ethylene glycol (Merck, Darmstadt, Germany) and 0.29 g/L 2,2,3.3-d(4)-3-(trimethylsilyl)propionic acid sodium salt (98%; Alfa Aesar, Karlsruhe, Germany) as internal standards for quantification. Samples were transferred to SampleJet tubes (3.0 × 103.5 mm 2 ) for insertion into the SampleJet autosampler (Bruker BioSpin GmbH, Rheinstetten, Germany). All samples were analyzed using a QCI CryoProbe 600 MHz ultrashielded Plus magnet (Bruker BioSpin GmbH). ‘H and 13 C spectra were recorded at 20 °C. 1 H NMR spectra were acquired with the following parameters: pulse angle of 90°, acquisition time of 2.66 seconds, and relaxation delay of 10 seconds. The number of scans was 256. Proton-decoupled 13 C NMR spectra were acquired with the following parameters: pulse angle of 30°, acquisition time of 1.65 seconds, and a relaxation delay of 0.5 seconds, 30 kHz spectral width with 98 K data points. The number of scans needed to obtain appropriate signal to noise ratios were between 20,000–40,000 (adjusted for sample weight).
Relevant peaks in the spectra were identified and then integrated using TopSpin 3.0 software (Bruker BioSpin GmbH). The total amounts and 13 C labeling of metabolites were calculated from the integrals of the peak areas using internal standards ethylene glycol in 13 C spectra, and 2,2,3.3-d(4)-3-(trimethylsilyl)propionic acid sodium salt in 1 H spectra. Integrals from 1 H spectra were corrected for number of protons constituting the peak. Integrals from 13 C spectra were corrected for nuclear Overhauser enhancement and relaxation effects relative to the internal standard, and were corrected for the 1.1% natural abundance of 13 C using the data obtained from 1 H NMR spectroscopy or HPLC. When the metabolite was double-labeled, 13 C natural abundance was calculated as 1.1% x 1.1% of total metabolite amount. All concentrations were corrected for possible tissue loss during the extraction procedure using a factor derived from the known amount of α-ABA added to the tissue and the actual amount of the final sample quantified by HPLC.
HPLC
To determine the total amounts of amino acids, the samples were analyzed using a Hewlett Packard 1100 System (Agilent Technologies, Santa Clara, CA, USA) with fluorescence detection, after derivatization with o-phthaldialdehyde. The components were separated with a ZORBAX SB-C18 (4.6 × 150 mm 2 , 3.5 μm) column from Agilent using 50 mM sodium phosphate buffer (pH 5.9) with 2.5% tetrahydrofurane and methanol (98.75%) with tetrahydrofurane (1.25%) as eluents. Compounds were quantified by comparison with a standard curve derived from a standard solution of metabolites run repeatedly with 15 sample intervals, and were corrected for possible tissue loss during the extraction procedure using α-ABA as an internal standard.
GC-MS
Aliquots of the samples were dissolved in 0.05 mol/L HCl, followed by lyophilization. Organic acids and amino acids were extracted into an organic phase of ethanol and benzene, dried under air, and reconstituted in N,N-dimethylformamide (Sigma Aldrich) before derivatization with N-Methyl-N-(t-butyldimethylsilyl)trifluoroacetamide in 1% t-butyldimethyl-chlorosilane (both Regis Technologies, Morton Grove, IL, USA). Compounds were analyzed with an Agilent 6890 N gas chromatograph linked to an Agilent 5975B mass spectrometer with an electron ionization source. Results for metabolites were corrected for natural abundance of 13 C using standard solutions that were acquired concurrently with the samples.
Percentage 13 C Enrichment
We calculated the percentage 13 C enrichment of lactate with [2,3- 13 C]lactate and alanine with [2,3- 13 C]alanine according to the following equation:

Notice that the percentage enrichment value actually represents percentage ‘excess enrichment', as natural abundance is corrected for. However, in this paper, we refer to the value as percentage enrichment in accordance with the previous literature. This also applies to the GC-MS results.
13 C enrichment with [1,2- 13 C]glucose was calculated using a different formula, as we were unable to quantify 13 C labeling of glucose in 1 H spectra. Glucose in water is present in two forms α-glucose and β-glucose. The protons bound to the α-C-1 carbon atom of glucose give rise to a multiplet at 5.22 p.p.m. when bound to 12 C and two multiplets when bound to 13 C with a splitting of ~170 Hz centered around 5.22 p.p.m. in 1 H NMR spectra. These peaks are termed here 1 H- 12 C α-glucose and 1 H- 13 C α-glucose. We calculated percentage 13 C enrichment of [1,2- 13 C]glucose using the peaks of 1 H- 12 C α-glucose and 1 H- 13 C α-glucose according to the following equation:
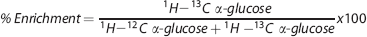
Notice that the formula does not include correction for natural abundance. Natural abundance of glucose cannot be reliably calculated as the level of brain glucose before administration of [1,2- 13 C]glucose to the animals is unknown. Calculating natural abundance based on measured total glucose amount (1.1% x 1.1% x (amount of 12 C glucose + 13 C glucose)) will overestimate natural abundance, whereas calculating natural abundance based on 12 C glucose concentration (1.1% x 1.1% x amount of 12 C glucose) will underestimate 13 C natural abundance. Therefore, we have refrained from correcting percentage enrichment of [1,2- 13 C]glucose with natural abundance in this paper.
Interpretation of 13 C-labeling Patterns from Metabolism of [1,2-C]glucose
A typical 13 C NMR spectrum of a tissue extract from the cerebral cortex of a pilocarpine–SE mouse, injected with [1,2- 13 C]glucose 3.5-4 weeks after SE, is shown in Figure 1. Singlets denote monolabeled metabolites whereas doublets denote double-labeled metabolites. It should be noted that the peaks of creatine, taurine, and NAA represent natural abundance of 13 C.
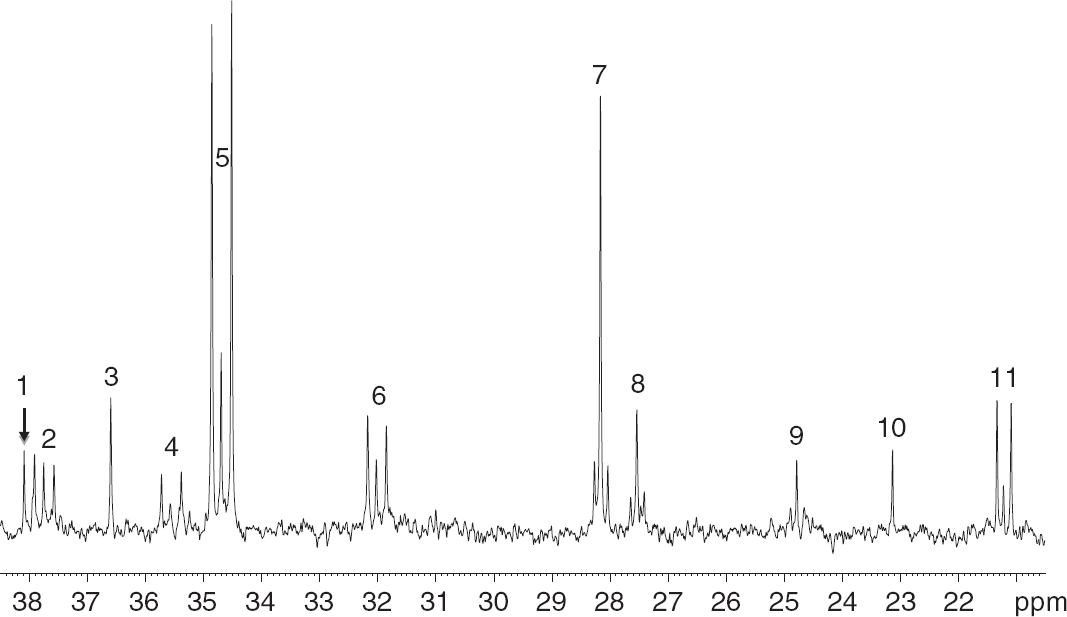
Typical 13 C nuclear magnetic resonance spectrum of a cerebral cortex extract from a mouse subjected to pilocarpine-status epilepticus (SE) and injected with [1,2- 13 C]glucose 3.5–4 weeks later. Monolabeled metabolites give rise to singlets whereas double-labeled metabolites give rise to two peaks on either side of the singlet. It should be noted that the peaks of creatine, taurine, and N-acetyl aspartate represent natural abundance of 13 C. Peak assignment: 1: [2- 13 C]creatine; 2: [3- 13 C]aspartate and [3,4- 13 C]aspartate; 3: [2- 13 C]taurine; 4: [2- 13 C]GABA and [1,2- 13 C]GABA; 5: [4- 13 C]glutamate and [4,5- 13 C]glutamate; 6: [4- 13 C]glutamine and [4,5- 13 C]glutamine; 7: [3- 13 C]glutamate and [2,3- 13 C]glutamate; 8: [3- 13 C]glutamine and [2,3-C]glutamine; 9: [3- 13 C]GABA and [3,4- 13 C]GABA; 10: [6- 13 C]N-acetyl aspartate; 11: [3- 13 C]lactate, and [2,3- 13 C]lactate.
To interpret the 13 C incorporation results, it is necessary to analyze the metabolism of [1,2- 13 C]glucose (Figure 2). Via glycolysis, [1,2- 13 C]glucose is metabolized to [2,3- 13 C]pyruvate, which can be converted to [2,3- 13 C]ala-nine, [2,3- 13 C]lactate, or enter the tricarboxylic acid (TCA) cycle via pyruvate dehydrogenase (PDH) as [1,2- 13 C]acetyl-CoA. Metabolism of [1,2- 13 C]acetyl-CoA in the TCA cycle gives rise to [4,5- 13 C]α-ketoglutarate, which is a precursor for [4,5- 13 C]glutamate. Thereafter, [4,5- 13 C]glutamate may be converted to [4,5- 13 C]glutamine by the exclusively glial enzyme glutamine synthetase 17 or to [1,2- 13 C]GABA in γ-aminobutyric acid (GABA)ergic neurons. In astrocytes, [2,3- 13 C]pyruvate can also be converted to [2,3- 13 C]oxaloacetate via pyruvate carboxylase (PC), 18 which can lead to the formation of [2,3- 13 C]α-ketoglutarate and eventually [2,3- 13 C]glutamate, [2,3- 13 C]glutamine, and [3,4- 13 C]GABA. If [2,3- 13 C]α-ketoglutarate and [4,5- 13 C]α-ketoglutarate is further metabolized in the TCA cycle, labeled oxaloacetate will be formed, which can be transaminated to [1,2- 13 C]aspartate or [3,4- 13 C]aspartate. Further cycling of labeled metabolites gives rise to different labeling patterns in amino acids, which are not discussed in this paper.
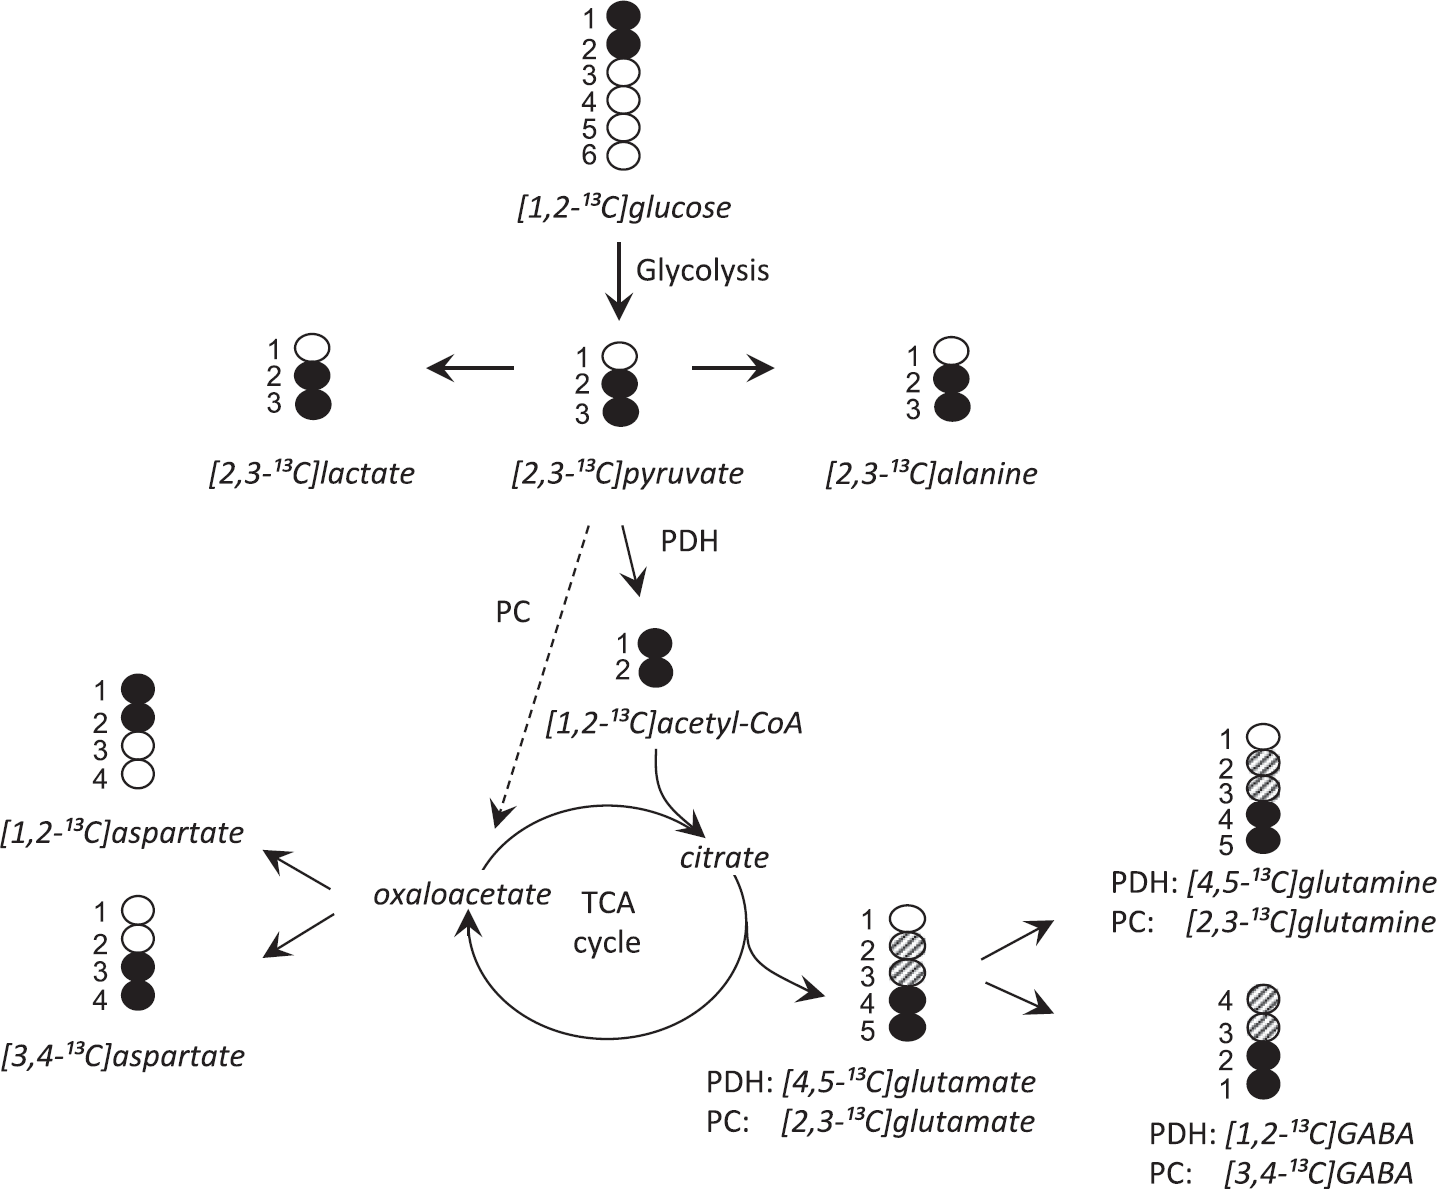
Schematic representation of isotopomers derived from [1,2- 13 C]glucose. Only the first turn of the tricarboxylic acid (TCA) cycle is illustrated. Black circles indicate 13 C labeling. 13 C labeling from pyruvate carboxylase (PC) is indicated by hatched circles. [1,2- 13 C]aspartate and [3,4- 13 C]aspartate is labeled from pyruvate dehydrogenase (PDH) and PC.
Data Analysis
Statistics were performed using the two-tailed unpaired Student's t-test with P<0.05 regarded as significant. Data are represented as mean ± s.e.m. We chose to use 10 and 11 animals in each group based on previous experience on variations of metabolite levels in epilepsy models. Owing to experimental errors, the number of samples for each group varied between analytical methods.
RESULTS
To assess the effects of SE induced by pilocarpine on brain energy metabolism and amino-acid neurotransmitter homeostasis in mice, concentrations of metabolites and incorporation of 13 C label into metabolites were analyzed in extracts of cortex and HF using 1 H and 13 C NMR spectroscopy, HPLC, and GC-MS.
Metabolism of [1,2- 13 C]glucose
In this study, we injected mice with [1,2- 13 C]glucose to obtain information about the pentose phosphate pathway (PPP) and distinguish metabolism of 13 C-labeled pyruvate via PC from that of PDH activity. Injection of [1,2- 13 C]glucose led to labeling of many metabolites as shown in a typical 13 C-NMR spectrum from the cerebral cortex of a pilocarpine-SE mouse (Figure 1). The labeling patterns of metabolites labeled from [1,2- 13 C]glucose via [2,3- 13 C]pyruvate are depicted in Figure 2 (see Materials and Methods for details).
Table 1 shows the total amounts and percentage 13 C enrichment with [1,2- 13 C]glucose, [2,3- 13 C]lactate, and [2,3- 13 C]alanine, which were quantified using 1 H-NMR spectroscopy, except for the amount of alanine, which was measured using HPLC. Pilocarpine-SE mice received less [1,2- 13 C]glucose, as their body weight was significantly lower compared with controls, 33.92 ± 1.42 g vs. 38.60 ± 1.25 g (P = 0.024, n = 10 pilocarpine–SE, n = 11 control mice), respectively. This could lead to decreased enrichment of blood glucose with [1,2- 13 C]glucose in the pilocarpine–SE mice. However, the fact that 13 C enrichment of glucose, lactate, and alanine was similar in both brain regions indicates that 13 C enrichment of glucose was similar between the two groups in the blood. The only significant difference in metabolite data between the two groups was in alanine in the HF, which was decreased in pilocarpine-SE mice by 30% (P = 0.001). Pentose phosphate pathway activity was below our detection limit in any metabolite in the brain regions analyzed.
Glucose metabolism in brain extracts of hippocampal formation and cortex from control and pilocarpine-SE mice
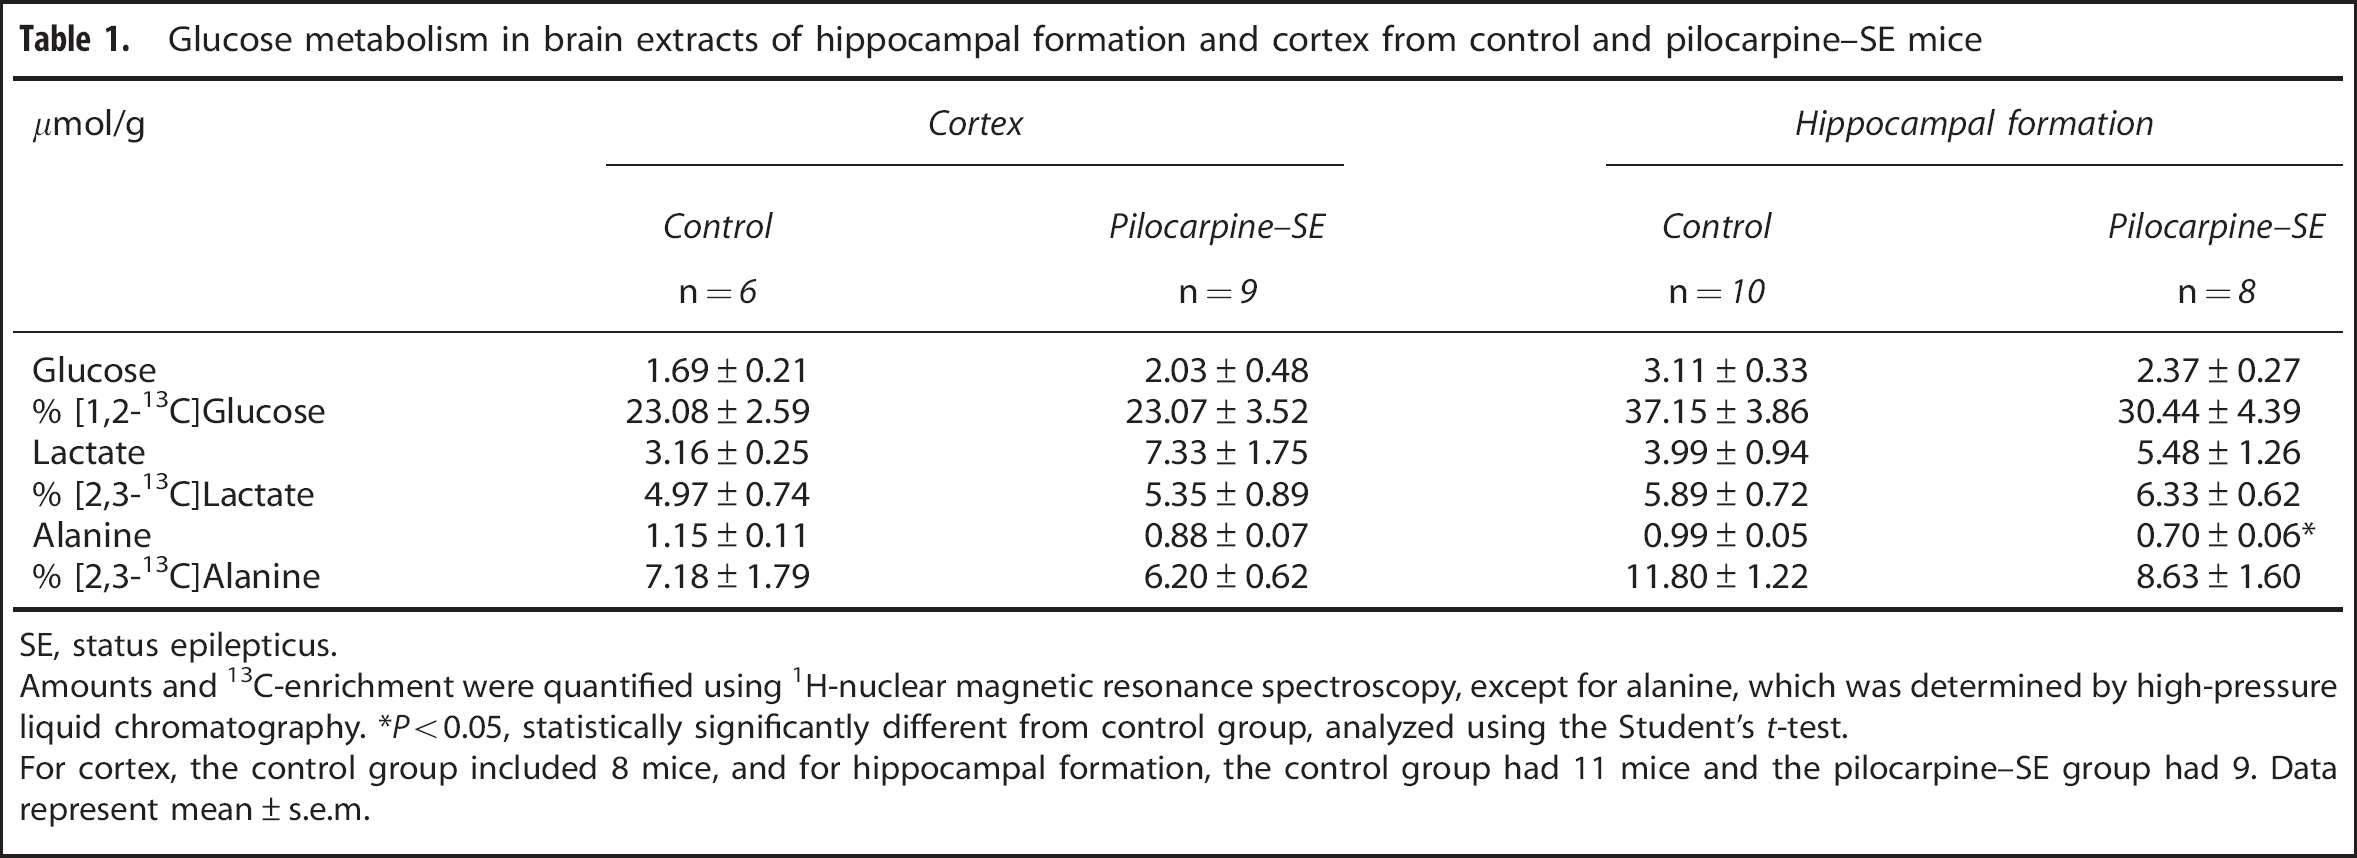
SE, status epilepticus.
Amounts and 13C-enrichment were quantified using 1H-nuclear magnetic resonance spectroscopy, except for alanine, which was determined by high-pressure liquid chromatography. *P<0.05, statistically significantly different from control group, analyzed using the Student's t-test.
For cortex, the control group included 8 mice, and for hippocampal formation, the control group had 11 mice and the pilocarpine–SE group had 9. Data represent mean ± s.e.m.
Content and 13 C Labeling of Glutamate, Glutamine, GABA, and Aspartate
We measured total amounts of glutamate, glutamine, GABA, and aspartate in extracts of cortex and HF using HPLC (Figure 3). Hippocampal glutamate was decreased by 26% in pilocarpine–SE mice (P = 0.009), whereas other metabolite amounts were not significantly altered.
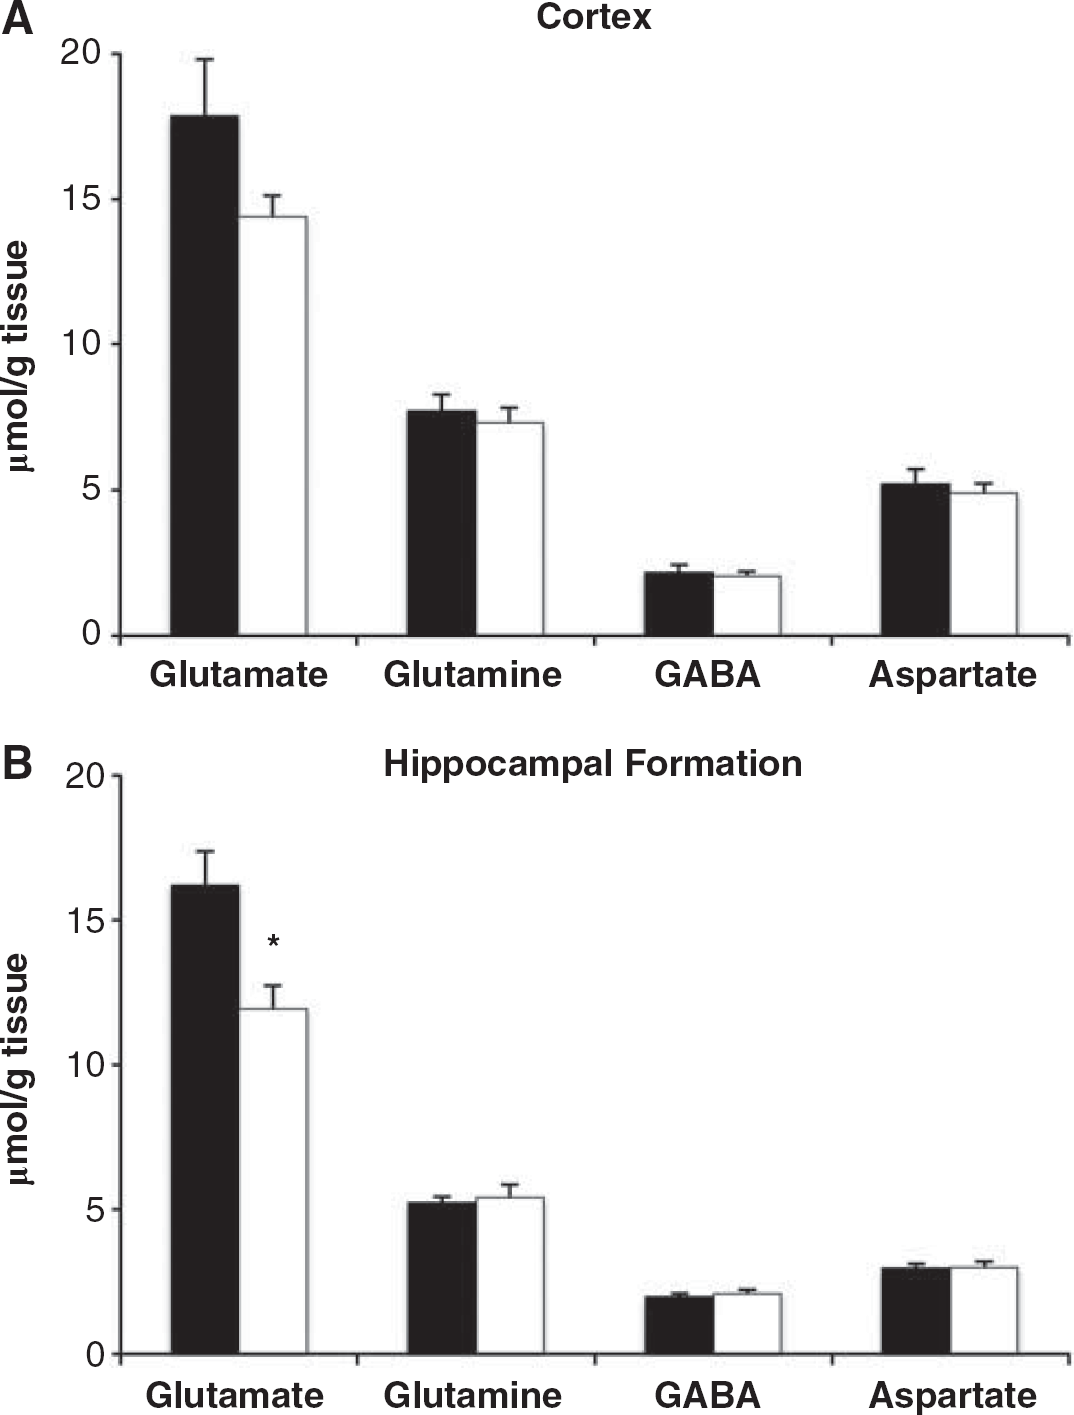
Amounts of amino acids glutamate, glutamine, γ- aminobutyric acid (GABA), and aspartate in brain extracts of (
Next, we determined 13 C labeling of amino acids in cortex using 13 C NMR spectroscopy (Figure 4), which revealed that the content of [4,5- 13 C]glutamate and [4,5- 13 C]glutamine, both labeled via PDH, was decreased by 38% (P = 0.010) and 48% (P = 0.008), respectively, in pilocarpine–SE mice compared with control. The same was found for [2,3- 13 C]glutamate and [2,3- 13 C]glutamine, labeling derived from PC, which was decreased by 50% (P= 0.036) and 45% (P= 0.004), respectively. However, labeling of [1,2- 13 C]GABA, derived from PDH activity, was not significantly altered, whereas that of [3,4- 13 C]GABA, labeled via PC, was not measurable. Finally, the sum of [1,2- 13 C]aspartate and [3,4- 13 C]aspartate labeled both from PC and PDH was significantly decreased in pilocarpine–SE mice by 43% (P = 0.013).
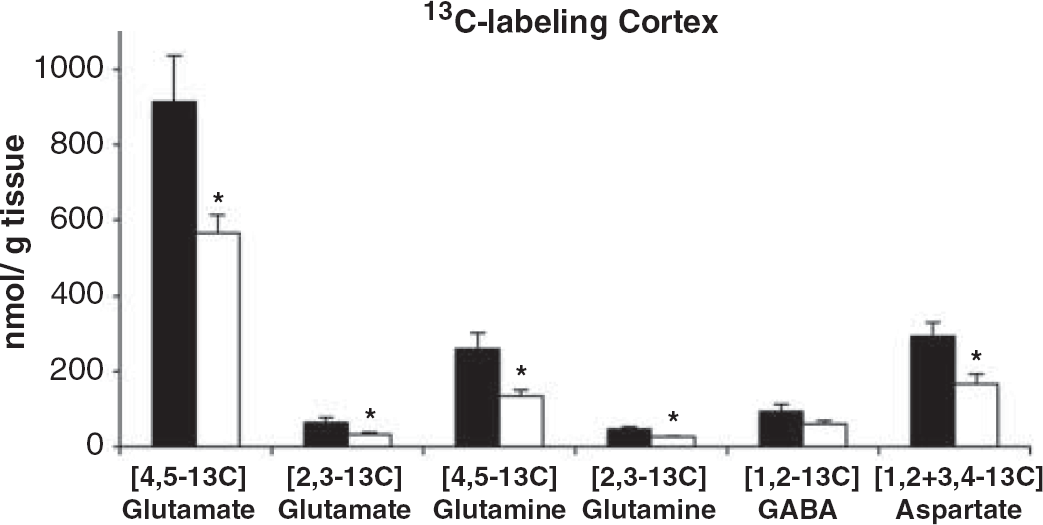
13 C labeling of amino acids derived from [1,2- 13 C]glucose in brain extract of cortex from control (black bars) and pilocarpine-status epilepticus (SE) mice (white bars). Mice were injected with [1,2- 13 C]glucose 15 minutes before microwave fixation of the head. [1,2 + 3.4- 13 C]aspartate, sum of [1,2- 13 C]aspartate and [3,4- 13 C]aspartate labeled from both pyruvate carboxylase and pyruvate dehydrogenase. The control group included 4-6 mice and the pilocarpine-SE group 5-9 mice. Data quantified using 13 C nuclear magnetic resonance spectroscopy. *P<0.05, statistically significantly different from control group. GABA, γ-aminobutyric acid.
Owing to the small size of the HF in mice, the distribution of 13 C-labeled mass isotopomers was assessed using GC–MS instead of 13 C NMR spectroscopy (Figure 5). We found that the percentage enrichment with M + 2 of the TCA cycle intermediate citrate was decreased by 28% (P = 0.015) in pilocarpine–SE mice. In another TCA cycle intermediate, malate, the percentage enrichment was decreased both in M + 1 and M + 2 by 40% (P = 0.008) and 26% (P= 0.020), respectively. Moreover, percentage enrichment with M + 1 and M + 2 in GABA was decreased by 36% (P = 0.007) and 30% (P = 0.003), respectively, and percentage enrichment with M + 1 and M + 2 aspartate was decreased by 32% (P = 0.029) and 22% (P = 0.049), respectively, in pilocarpine–SE mice. Percentage enrichment of mass isotopomers of glutamate and glutamine was not significantly affected in HF.
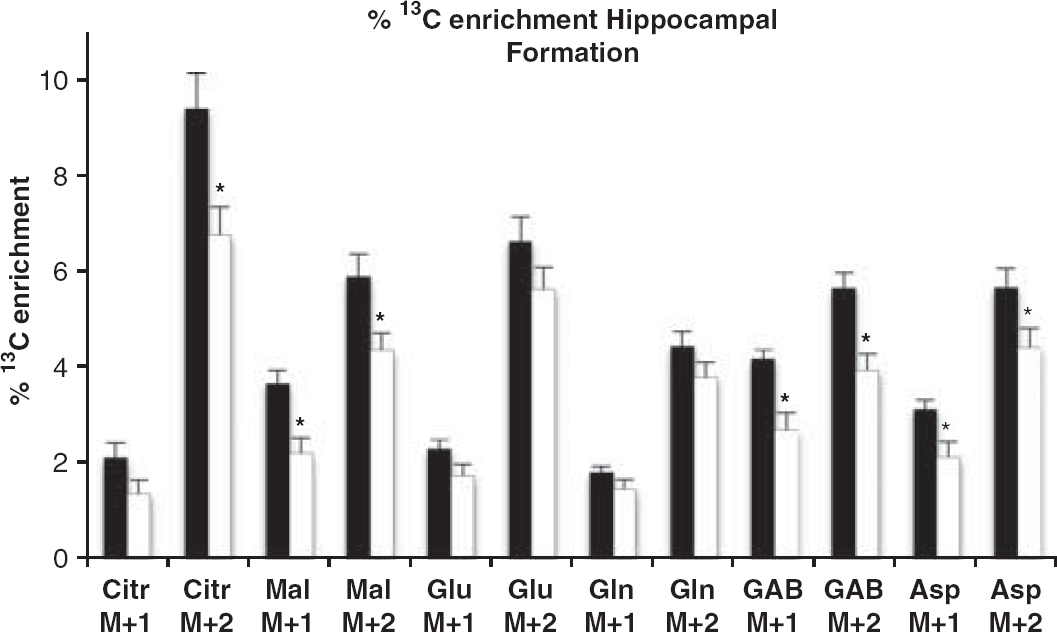
The percentage of the total concentration of metabolites labeled with 1 C in one (M + 1) or two (M + 2) carbon atoms of the molecule in extracts of hippocampal formation from control (black bars) and pilocarpine-status epilepticus (SE) mice (white bars) detected by gas chromatography-mass spectrometry. Mice were injected with [1,2- 13 C]glucose 15 minutes before microwave fixation of the head. Abbreviations are standard for amino acids and Citr, citrate; Mal, malate; GAB, γ-aminobutyric acid. Data represent mean ± s.e.m. of 7 control and 10 pilocarpine–SE mice. *P<0.05, statistically significantly different from control group.
Measurements of Various Metabolites
Using HPLC and 1 H NMR spectroscopy, we obtained the concentrations of various metabolites in cortex and HF (Table 2). In cortex, the content of the osmolyte myo-inositol was increased by 39% (P = 0.030) in pilocarpine–SE mice compared with control, but was not significantly altered in the HF. The concentration of the essential amino-acid threonine was increased by 24% (P = 0.028) in cortex and 20% (P = 0.030) in HF. In the HF, the level of glutathione was significantly decreased by 18% (P = 0.003), but was not significantly altered in cortex. Moreover, we found that the concentrations of NAA, reduced nicotinamide adenine dinucleotide (phosphate) (NAD(P)H), and succinate were decreased by 27% (P = 0.001), 19% (P = 0.050), and 18% (P= 0.049), respectively, in the HF in pilocarpine–SE mice compared with control, but were not significantly altered in cortex. We could not detect any statistically significant difference in amounts of the energy state-related parameters AMP, ADP, ATP, creatine, phosphocreatine, and the ratio of phosphocreatine to ATP (phosphocreatine/ATP) in either brain region. This was also the case for metabolites glycine, NAD(P)+, and taurine.
Amounts (μmol/g tissue) of metabolites in brain extracts of hippocampal formation and cortex from control and pilocarpine–SE mice
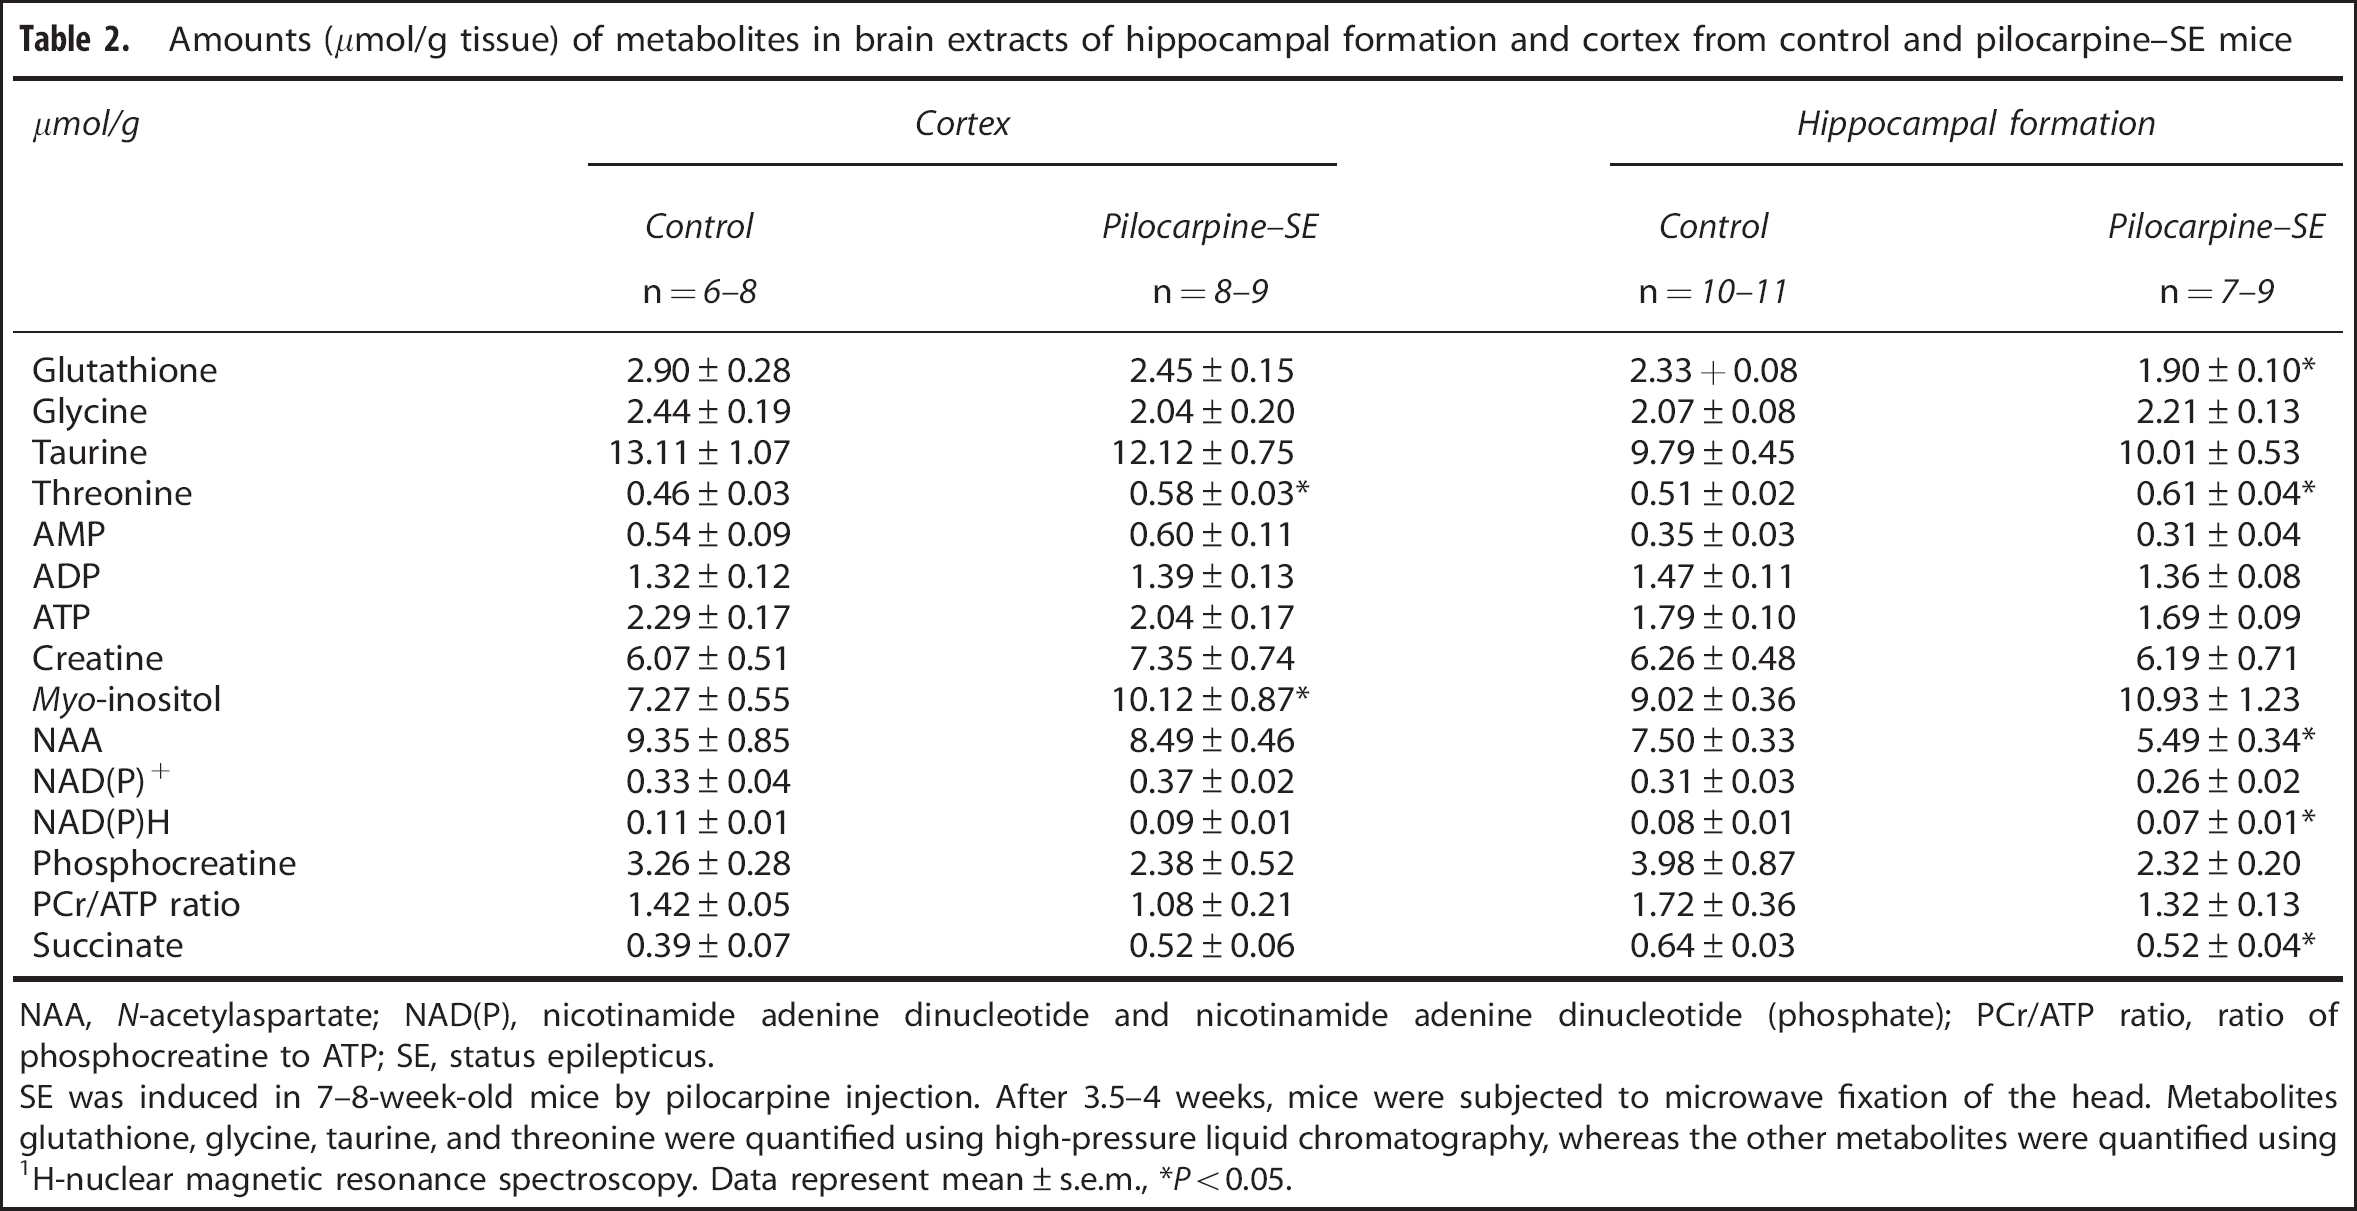
NAA, N-acetylaspartate; NAD(P), nicotinamide adenine dinucleotide and nicotinamide adenine dinucleotide (phosphate); PCr/ATP ratio, ratio of phosphocreatine to ATP; SE, status epilepticus.
SE was induced in 7-8-week-old mice by pilocarpine injection. After 3.5-4 weeks, mice were subjected to microwave fixation of the head. Metabolites glutathione, glycine, taurine, and threonine were quantified using high-pressure liquid chromatography, whereas the other metabolites were quantified using 1 H-nuclear magnetic resonance spectroscopy. Data represent mean ± s.e.m., *P<0.05.
DISCUSSION
The metabolic profile of pilocarpine–SE mice is discussed here, and compared with findings from rat models of chronic TLE and human TLE. The video electroencephalography data from Kharatishvili and colleagues 13 using the CD1 mouse pilocarpine model developed in the Borges laboratory provide clear evidence that CD1 mice after 1.5 hours of pilocarpine-induced SE develop epilepsy. While our techniques do not allow localization of the metabolic changes to subregions or different cell types, we confirmed that mitochondrial metabolic dysfunction especially in the HF is a common hallmark of epilepsy as was previously shown in human tissue and rat models.19,20
Glucose Metabolism
The major substrate for energy and amino-acid production in the adult mammalian brain is glucose. Changes in glucose content in the brain can be used to evaluate metabolism, where increased glucose levels imply hypometabolism. 21 In the present study, however, no difference was detected in glucose content or 13 C enrichment, although glucose hypometabolism was demonstrated in the continuous phase of lithium-pilocarpine rats7,9 and mice subjected to pentylenetetrazole kindling 30 minutes after final pentylenetetrazole injection. 22 Similarly, the majority of TLE patients display reduced uptake of [ 18 F]fluorodeoxyglucose in the epileptogenic region using positron emission tomography, an indicator of reduced glucose metabolism.1,23 Interestingly, neuronal loss does not appear to correlate with the decrease in glucose consumption,7,23 suggesting that interictal hypometabolism is affected more by dysfunctional mitochondrial oxidative and/or glycolytic energy metabolism than cell loss in epileptic tissue.
After phosphorylation, glucose can be metabolized to glycogen in astrocytes, and to pyruvate in both astrocytes and neurons via glycolysis and a smaller extent the PPP. Using [1,2- 13 C]glucose, it is possible to distinguish between pyruvate production from glycolysis, reflected by [2,3- 13 C]pyruvate levels, and the PPP, revealed by levels of [3- 13 C]pyruvate and [1,3- 13 C]pyruvate. Pyruvate can be converted to lactate, alanine, oxaloacetate, or acetyl-CoA. In cortex, 13 C enrichment and total amounts of lactate and alanine were unaltered in the continuous phase of epilepsy pointing to normal glycolysis, whereas in the HF total levels of lactate and 13 C enrichment of lactate and alanine were not significantly different, indicating that there are no major changes in glycolysis and lactate formation. 13 C enrichment of lactate and alanine via the PPP was negligible in both brain areas. However, in the HF total amounts of alanine and glutamate were decreased, which suggests reduced levels of either pyruvate and/or α-ketoglutarate and/or reduced activity of transaminases, such as glutamic pyruvic transaminase. The changes in glutamate levels are discussed in the next paragraph.
Amino-acid and Neurotransmitter Metabolism
The carbon skeleton of pyruvate may enter the TCA cycle via PC or after decarboxylation via PDH. The important neurotransmitter amino acids glutamate and aspartate are formed from TCA cycle intermediates α-ketoglutarate and oxaloacetate, respectively, and GABA is synthesized from glutamate, linking neurotransmitter metabolism with glucose metabolism in the brain. We found no differences in the contents of these amino acids in either brain region of chronic epileptic mice, except for a reduction of glutamate in the HF. Thus, pilocarpine–SE mice displayed the same profile for these amino acids as mice kindled with pentylenetetrazole, 22 whereas in the forebrain of another mouse strain 5 weeks after pilocarpine–SE, there was a decreased GABA content. 24 Similarly, studies on rat models of chronic epilepsy have shown reductions in the content of aspartate as well as glutamate.8,9 The reduction of glutamate content in the HF might reflect neuronal loss in this region, a histopathological hallmark of human TLE. 25 Also, loss of hippocampal pyramidal cells has been demonstrated for this pilocarpine mouse model in most mice at several time points from 3 to 31 days after SE. 15 However, a decrease in glutamate content did not correlate with neuronal loss in the hippocampus of patients with TLE. 26 Reduction in glutamate levels is affected more by impaired cell metabolism, such as altered substrate transport, decreased activity of the TCA cycle, and/or various mitochondrial enzymes, than cell loss. 27 A considerable number of studies have shown that the cycling of glutamate to glutamine between neurons and astrocytes may be slower in hippocampal tissue of TLE patients and animal models of epilepsy. Most brain glutamate is located within cells, but increased extracellular glutamate is reported in connection with seizures3,4,10,28 and the expression of glutamine synthetase is decreased in the epileptogenic HF of human TLE.5,6 We could not detect any difference in the total glutamine content in the HF despite the reduction in glutamate, in line with previous reports on kainate and lithium-pilocarpine rat models of TLE and the pentylenetetrazole-kindling model in mice.8,9,22 Similarly, a recent study of pilocarpine–SE rats revealed no quantitative changes in the number and volume of astrocytes expressing GS but there was a redistribution of the enzyme from distal to proximal astrocyte processes within the hippocampus. 29 Analyzing metabolites using GC-MS revealed a decrease in 13 C enrichment of the TCA cycle intermediates citrate and malate in the HF suggesting decreased TCA cycle turnover in this region, which also can explain the reduction in total levels of succinate and glutamate. Furthermore, this study revealed a decrease in the 13 C enrichment of GABA and aspartate, which was not the case for glutamate and glutamine.
In cortex, the level of 13 C labeling in glutamate and glutamine from both PC and PDH pathways was equally decreased in pilocarpine–SE mice compared with control. Furthermore, the sum of [1,2- 13 C]aspartate + [3,4- 13 C]aspartate, labeled both from PC and PDH, was decreased too. These results imply reduced metabolism in astrocytes as PC is an astrocytic-specific enzyme 30 and brain glutamine is formed in astrocytes only. 17 However, neurons appear to metabolize B70% of acetyl-CoA from glucose in the brain31,32 and most glutamate is present in neurons. 33 Therefore, altered neuronal metabolism of glutamate, glutamine, and aspartate in the cortex of pilocarpine–SE mice cannot be ruled out. While reduced 13 C labeling reflects reduced use of glucose for the synthesis of these amino acids, the total amounts of glutamate, glutamine, and aspartate were not decreased to the same degree. Thus, it follows that there is either decreased uptake and/or reduced degradation of these amino acids (or their precursors). In conclusion, the findings indicate reduced turnover of cortical glutamate, glutamine, and aspartate as well as reduced TCA cycling in the continuous phase of pilocarpine-SE mice, which was not evident for the GABAergic compartment.
Other Metabolites
Similar to glutamate content, that of NAA was decreased in the HF. N-acetyl aspartate is primarily synthesized in neuronal mitochondria 34 and the content of this metabolite is commonly found to be decreased in the epileptic region of humans with TLE and rat models of chronic epilepsy.8,9,35 Several studies have failed to show any significant relationship between content of NAA and cell death in patients with TLE suggesting that NAA loss reflects metabolic dysfunction rather than neuronal loss.19,26,36,37 Therefore, decreases in NAA content further support our findings of reduced neuronal metabolism. Moreover, alterations of NAD(P)H transients during neuronal activation, a measure of dysfunctional oxidative and/or glycolytic energy metabolism, was revealed by fluorescence recording of hippocampal slices of human tissue from TLE patients. 20 In line with this, we found decreased hippocampal contents of the reducing nucleotides NAD(P)H and the TCA cycle intermediate succinate in pilocarpine–SE mice indicating impairment of mitochondrial function. No significant differences in high-energy metabolites such as phosphocreatine and ATP and the ratio of phosphocreatine/ATP were found, similar to various other animal studies,9,22 although reduction of these metabolite levels have been reported in human TLE. 38
The content of glutathione was decreased in the HF of pilocarpine–SE mice, similar to results from the lithium-pilocarpine rat model, 9 which may suggest decreased capacity for cytosolic oxidative reduction in this region. As glutathione is a tripeptide composed of glutamate, cysteine, and glycine, the reduction in hippocampal glutamate content may be a direct cause for the decrease of glutathione, although the availability of cysteine is usually rate limiting. Moreover, a reduction in astrocytic glutamate might impair the uptake of cystine into astrocytes as import of cystine is obligatory linked to the release of glutamate via the cystine/glutamate antiporter. However, it was recently shown that the role of this transport system was not critical for the synthesis of glutathione in the mouse hippocampus in vivo. 39 The increase of cortical myo-inositol in pilocarpine–SE mice was similar to that found in pentylenetetrazole-kindled mice. 22 It suggests astroglial expansion, as myo-inositol is primarily localized in astrocytes 40 and GFAP immunostaining is also stronger in these mice. 15
CONCLUSION
We characterized the metabolic profile of mice in the continuous phase of epilepsy, 3.5–4 weeks after SE was induced by pilocarpine. Altogether the metabolic alterations partly resemble those reported for human TLE and rat models of chronic epilepsy, such as glutamate content reduction and mitochondrial metabolic dysfunction in the HF. Moreover, the application of 13 C NMR spectroscopy, HPLC, and GC–MS revealed decreased turnover of important metabolites within and derived from TCA cycle intermediates, specifically glutamate, glutamine, and aspartate in the cerebral cortex, and citrate, succinate, malate, GABA, and aspartate in the HF. These findings are consistent with impaired function of the TCA cycle in both the cerebral cortex and the HF in mice with spontaneous recurrent seizures. Targeting these impaired mitochondrial functions appears to be promising for the treatment of drug-resistant epilepsy.
DISCLOSURE/CONFLICT OF INTEREST
The authors declare no conflict of interest.
Footnotes
ACKNOWLEDGEMENTS
The authors thank Nicola K Thomas for help with the animals and Nina Berggaard and TesfayeTefera for their help with the GC–MS analyses. Karin Borges is grateful for funding by the Australian National Health and Research Council (Grants 63145 and 1044407).