
Abstract
Glucose metabolism has been associated with magnitude of blood oxygen level-dependent (BOLD) signal and connectivity across subjects within the default mode and dorsal attention networks. Similar correlations within subjects across the entire brain remain unexplored. [18F]-fluorodeoxyglucose positron emission tomography ([18F]-FDG PET), [11C]-flumazenil PET, and resting-state functional magnetic resonance imaging (fMRI) scans were acquired in eight healthy individuals and nine with temporal lobe epilepsy (TLE). Regional metabolic rate of glucose (rMRGlu) was correlated with amplitude of low frequency fluctuations (ALFFs) in the fMRI signal, global fMRI connectivity (GC), regional homogeneity (ReHo), and gamma-aminobutyric acid A—binding potential (GABAA BPND) across the brain. Partial correlations for ALFFs, GC, and ReHo with GABAA BPND were calculated, controlling for rMRGlu. In healthy subjects, significant positive correlations were observed across the brain between rMRGlu and ALFF, ReHo and GABAA BPND, and between ALFFs and GABAA BPND, controlling for rMRGlu. Brain-wide correlations between rMRGlu and ALFFs were significantly lower in TLE patients, and correlations between rMRGlu and GC were significantly greater in TLE than healthy subjects. These results indicate that the glutamatergic and GABAergic systems are coupled across the healthy human brain, and that ALFF is related to glutamate use throughout the healthy human brain. TLE may be a disorder of altered long-range connectivity in association with glutamate function.
Introduction
Temporal lobe epilepsy (TLE) is a chronic neurologic disorder characterized by abnormal synchronization of populations of neurons that lead to clinical seizures arising from mesial or neocortical structures. When uncontrolled, TLE has serious adverse medical, social, and psychological consequences.1, 2, 3, 4 It is estimated that even with pharmacologic therapy, seizures will remain uncontrolled in up to one-third of all TLE patients, underscoring the urgent need for more effective treatments for TLE. 5 The etiology of TLE is poorly understood, although a large body of literature implicates both gamma-aminobutyric acid (GABA), the primary inhibitory neurotransmitter, and glutamate, the primary excitatory neurotransmitter. Although most studies support a role for GABA in the inhibition of epileptiform discharges, evidence also suggests that GABA may support spontaneous network synchronization. 6 Glutamatergic system changes also appear to be involved. In the healthy brain, presynaptic metabotropic glutamate receptors regulate glutamate release via a negative feedback mechanism that results in neuronal inhibition; this inhibitory control mechanism—and thus the balance between excitation and inhibition—appears to be lost in TLE. 7
Positron emission tomography (PET) has been used extensively to examine the physiology of seizure foci. PET studies using the ligand [11C]-flumazenil, a GABAA receptor antagonist, have consistently found decreased binding in hippocampus ipsilateral to seizure foci,8, 9, 10, 11 particularly in patients exhibiting atrophy or mesial temporal sclerosis. 8 Interpreting these findings, however, is complicated. Some evidence suggests that greater binding of flumazenil is associated with higher concentrations of extracellular GABA; higher GABA levels initiate a conformational shift in the GABAA receptor, increasing its affinity for flumazenil. 12 In contrast, an overabundance of GABA may downregulate GABAA receptor—binding sites, thus reducing binding potential. 13 In addition, reduced [11C]-flumazenil affinity for GABAA receptors has been observed in seizure foci in TLE. 14 Regional metabolic rate of glucose (rMRGlu), measured by [18F]-fluorodeoxyglucose (FDG) PET—which is dominated by glial uptake of glucose in response to neuronal glutamate release 15 —is also abnormal in TLE. In addition to remote areas of hypometabolism, there appears to be marked hypometabolism in the ipsilateral temporal cortex. 16 Thus, in the interictal period, net activity in excitatory glutamatergic pathways may be decreased. Concomitant abnormalities in the GABAergic system are complex, and the nature of the alterations in GABA levels is not entirely understood.
In addition to studies of neurotransmitter abnormalities in TLE, a growing body of evidence suggests that TLE may be a disorder of connectivity. The default-mode network (DMN), a collection of regions activated in the absence of any imposed task or stimulus, appears to show reduced activity as well as reduced connectivity in TLE (reviewed by Cataldi
The glutamatergic and GABAergic systems appear to be intimately involved in the pathophysiology of TLE, and there also appear to be widespread alterations in connectivity that may themselves be driven by altered glutamatergic function. Based on these data, we sought to examine the relationship between glutamate use (as reflected by [18F]-FDG PET), GABAergic function (as measured with [11C]-flumzenil PET), connectivity, and resting-state brain activity (as measured with resting-state fMRI (rsfMRI)). To our knowledge, this study—which investigates whether fundamental alterations in these relationships may potentially underlie neurologic diseases such as TLE—is the first to examine the relationships between these systems across the entire brain in healthy subjects.
Materials and methods
Subjects
Seventeen healthy subjects and 14 subjects with TLE were recruited into the study. Written informed consent was obtained from all subjects, and the study was approved by the Combined Neuroscience Institutional Review Board and the Radiation Safety Committee at the National Institutes of Health, in compliance with the federal policy for the protection of human subjects (‘Common Rule’, Department of Health and Human Services regulation 45 Code of Federal Regulations 46). Of the subjects who participated in imaging procedures, eight healthy subjects and nine subjects with TLE had complete datasets and met all inclusion/exclusion criteria. Most withdrawals were because of either failure to obtain blood samples for quantification of PET data, identification of additional seizure foci in TLE subjects, or not meeting all inclusion/exclusion criteria.
Healthy subjects were free of personal or first-degree family history of psychiatric disorders as assessed by the structured clinical interview for Diagnostic and Statistical Manual of Mental Disorders IV, text revision (SCID 21 ) and the family interview for genetic studies (FIGS 22 ). TLE subjects’ seizure foci were localized by clinical neuroimaging and ictal video electroencephalography (EEG). Three had right mesial TLE and three had left mesial TLE confirmed by successful surgery. Two had left anterior temporal ictal onset, and one right anterior temporal ictal onset on video EEG. All subjects with TLE were also assessed using the SCID; only subjects not currently meeting criteria for a major depressive episode were enrolled. All subjects were administered the Hamilton Depression Rating Scale (HAM-D) at screening, and at the time of the scanning sessions, to assess depressive symptoms. Mean HAM-D score across all time points was used in subsequent analyses. Subjects with TLE were maintained on antiepileptic drugs (AEDs) throughout the study, although all exhibited seizures were not adequately controlled by adequate doses of medication. In addition, only subjects taking AEDs that had no primary effects on the GABAergic system were recruited; no subject's medication was changed for the purpose of inclusion in the study. Psychotropic medications other than AEDs were not allowed.
All healthy subjects were free of major medical or neurologic illnesses, as assessed by medical history and physical examination, blood tests, echocardiogram, and urinalysis. Subjects with TLE were free of major medical or neurologic illnesses besides epilepsy. Additional exclusion criteria for all subjects included pregnancy, breastfeeding, past drug or alcohol dependence, drug or alcohol abuse within 1 year, and contraindications to MRI or PET.
Positron Emission Tomography Acquisition and Preprocessing
All subjects underwent PET scanning using both [18F]FDG and [11C]-flumazenil. In some cases, both scans were performed the same day, however, in most cases scans were acquired in separate sessions, as close as logistically possible given scheduling constraints. All brain PET scans were acquired on a CPS Innovations ECAT high-resolution research tomograph (Knoxville, TN, USA). Scans had a resolution of ∼2.5 mm full width at half maximum. Before each scanning session, subjects received two intravenous catheters for radiotracer administration and blood sampling. In the [11C]-flumazenil session, subjects received an injection of 0.25-mCi/kg [11C]-flumazenil, with a maximum dosage of 20 mCi for all subjects. PET scans were then acquired for up to 60 minutes. During the [18F]FDG session, subjects received 10-mCi [18F]FDG. A 35-minute cardiac emission scan was then performed on a GE Advance PET scanner (Fairfield, CT, USA). Venous blood samples were taken in 5-minute increments to acquire a cardiac input function for subsequent modeling of rMRGlu. After the cardiac scan, subjects were moved to the high-resolution research tomograph scanner and images were acquired over 40 to 60 minutes. Frames from emission scans were corrected for subject motion, and all emission scans were corrected using transmission scans. rMRGlu images were calculated using the cardiac input function as previously validated. 23 In brief, a left ventricular time activity curve was calculated using the cardiac emission scan, and this curve was extrapolated in time using the venous blood sample data. This was then used as the input function to calculate the rMRGlu images using a simplified three-compartment model. 24 Frames from the [11C]-flumazenil PET images were corrected for subject motion, and a two-step simplified reference region method was then used to calculate GABAA-binding potential images as BPND (according to consensus nomenclature 25 ). The pons, which has little to no specific binding to flumazenil, was used as a reference region to derive the input function. All PET scans were coregistered to the anatomic MRI scans, and then transformed to Talairach 26 space. To facilitate comparison between subjects, all scans were reflected left-right for subjects with a left-lateralized seizure focus so that all TLE subjects had their seizure focus in the right hemisphere.
To compare images across modalities within a single subject, a suitable mask had to be created for each subject. First, a mask was created from the spatially normalized rMRGlu images that included only voxels with a magnitude >0.8 times the mean within a simple binary brain mask derived from the Talairach 26 template. This had the effect of primarily restricting the analysis to the gray matter, and is identical to the ‘threshold masking’ option implemented in statistical parametric mapping (Functional Imaging Laboratory, UCL, London, UK) widely used in PET analysis. This mask was combined with the mask created during fMRI preprocessing (described below). In addition, voxels with a value of zero in the GABAA BPND image (i.e., voxels where GABAA BPND was not calculated because of low signal in the raw [11C]-flumazenil image) were excluded to create the final mask. We adopted this procedure in lieu of using masks derived from the MRI images to avoid problems with misclassification of voxels, and to optimize exclusion of voxels where one of our primary measures (rMRGlu) was very low and likely reflected noise rather than true uptake.
MRI Acquisition and Preprocessing
All MRI scans were acquired on a GE 3T system (Fairfield, CT, USA). Anatomic scans were acquired for coregistration using a fast spoiled gradient—echo sequence. For the resting-state scans, subjects were instructed to close their eyes, relax, and try to stay awake. Scans lasted 8 minutes, and were acquired using a gradient-echo planar imaging (EPI) sequence (repetition time (TR)=2 seconds, echo time (TE)=30 ms, resolution=64 × 64 and 34 4-mm thick sagittal slices). A respiratory belt and pulse oximeter were used during scanning to record physiologic signals. Resting-state scans were preprocessed using AFNI (Analysis of Functional NeuroImages, SSCC/NIMH/NIH, Bethesda, MD, USA). The 3dDespike routine was used to eliminate any temporal spikes, and cardiac and respiratory signals were removed using a slightly modified version of RETROICOR, as implemented in AFNI, which models heart rate, respiration, and respiration volume per time. 27 This correction was performed on a slice-by-slice basis to account for changes in physiologic state during the interslice time intervals. Next, image slice timing was corrected, and EPI images were realigned to the first image. The anatomic images were warped to stereotaxic (Talairach 26 ) space, and the EPI images were aligned to the fast spoiled gradient—echo anatomic images and then again transformed to Talairach space. Images were smoothed to a full width at half maximum of 10 mm, masked, and regression was performed to remove baseline effects, motion effects, and any remaining physiologic effects. All further analyses and indices were performed for the residuals from this regression analysis.
The FATCAT toolbox within AFNI was used to calculate maps of the amplitude of low frequency fluctuations (ALFFs) in the bandpass 0.01 to 0.1 Hz, as well as regional homogeneity (ReHo, a measure of local connectivity).
28
The method for deriving ALFFs is described in detail by Zang
To determine if TLE measures differed significantly between the hippocampus contralateral and ipsilateral to the seizure focus, we used MedX (Medical Numerics, Germantown, MD, USA) to register individual MRI structural images to a template on which we had previously placed regions of interest (ROIs).32, 33 The ROI was an ellipsoid that fit well within the anterior hippocampus and spanned five 2-mm axial slices. For each subject, the ROI in each slice was repositioned such that only hippocampus was included within the ROI. Slices of the ROI were removed if they did not fit adequately inside the hippocampus, so that values in subjects with mesial temporal lobe sclerosis were not artefactually decreased.
Statistical Analysis
Five masked maps were obtained for each subject: rMRGlu, GABAA BPND, ALFFs, GC, and ReHo. Mean values within the subject masks were compared between subject groups by independent samples
To ensure that our TLE subjects were representative of TLE subjects in the general population, we report the mean values for rMRGlu and GABAA BPND in the ipsilateral and contralateral hippocampi, corrected for partial volume effects. We assessed differences between hemispheres and between healthy subjects and those with TLE using paired
Voxel-Wise Between-Subject Analysis
To show regional variation in correlations between PET and rsfMRI measures, and potential differences between groups, we used AFNI's 3dttest++ routine to construct a two-group linear model with rMRGlu as the outcome measure, diagnostic group as a factor, and ALFF as a covariate. The rMRGlu images were smoothed with a 10-mm Gaussian smoothing kernel for these analyses. Separate models were used to compare rMRGlu and GC, rMRGlu and ReHo, and rMRGlu and GABA BPND. From these models, we examined the relationship between rMRGlu and the other variables across all subjects within each diagnostic group, as well as any differences between groups. All images were masked using the intersection of the individual subject masks, dilated by one voxel in all directions. We initially set a voxel threshold of
Results
Subjects
The healthy (
Mean values for each parameter of interest
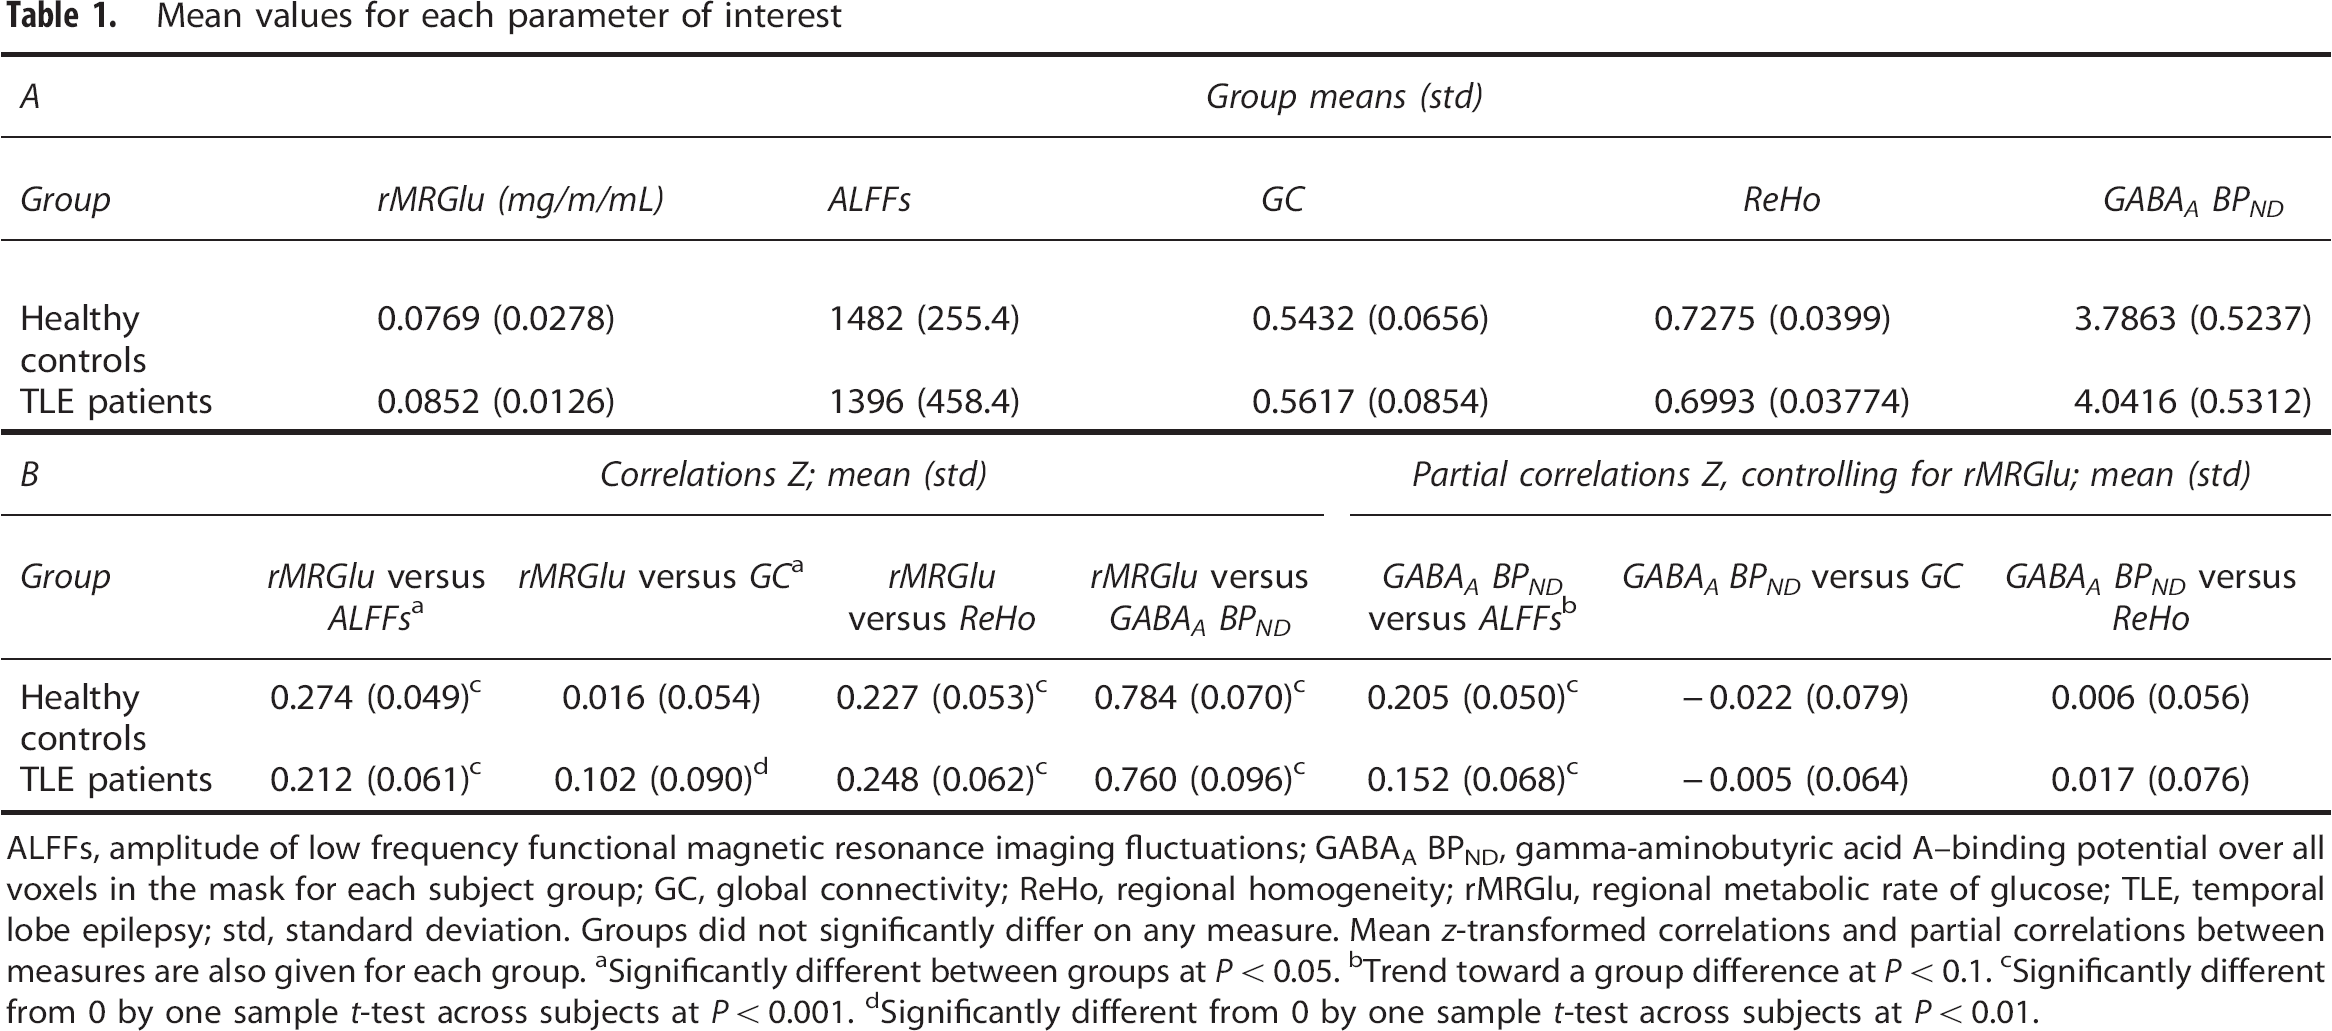
ALFFs, amplitude of low frequency functional magnetic resonance imaging fluctuations; GABAA BPND, gamma-aminobutyric acid A—binding potential over all voxels in the mask for each subject group; GC, global connectivity; ReHo, regional homogeneity; rMRGlu, regional metabolic rate of glucose; TLE, temporal lobe epilepsy; std, standard deviation. Groups did not significantly differ on any measure. Mean
Significantly different between groups at
Trend toward a group difference at
Significantly different from 0 by one sample
Significantly different from 0 by one sample
Mean values for rMRGlu and GABAA BPND in hippocampus ipsilateral and contralateral to the seizure focus, and correlations between measures
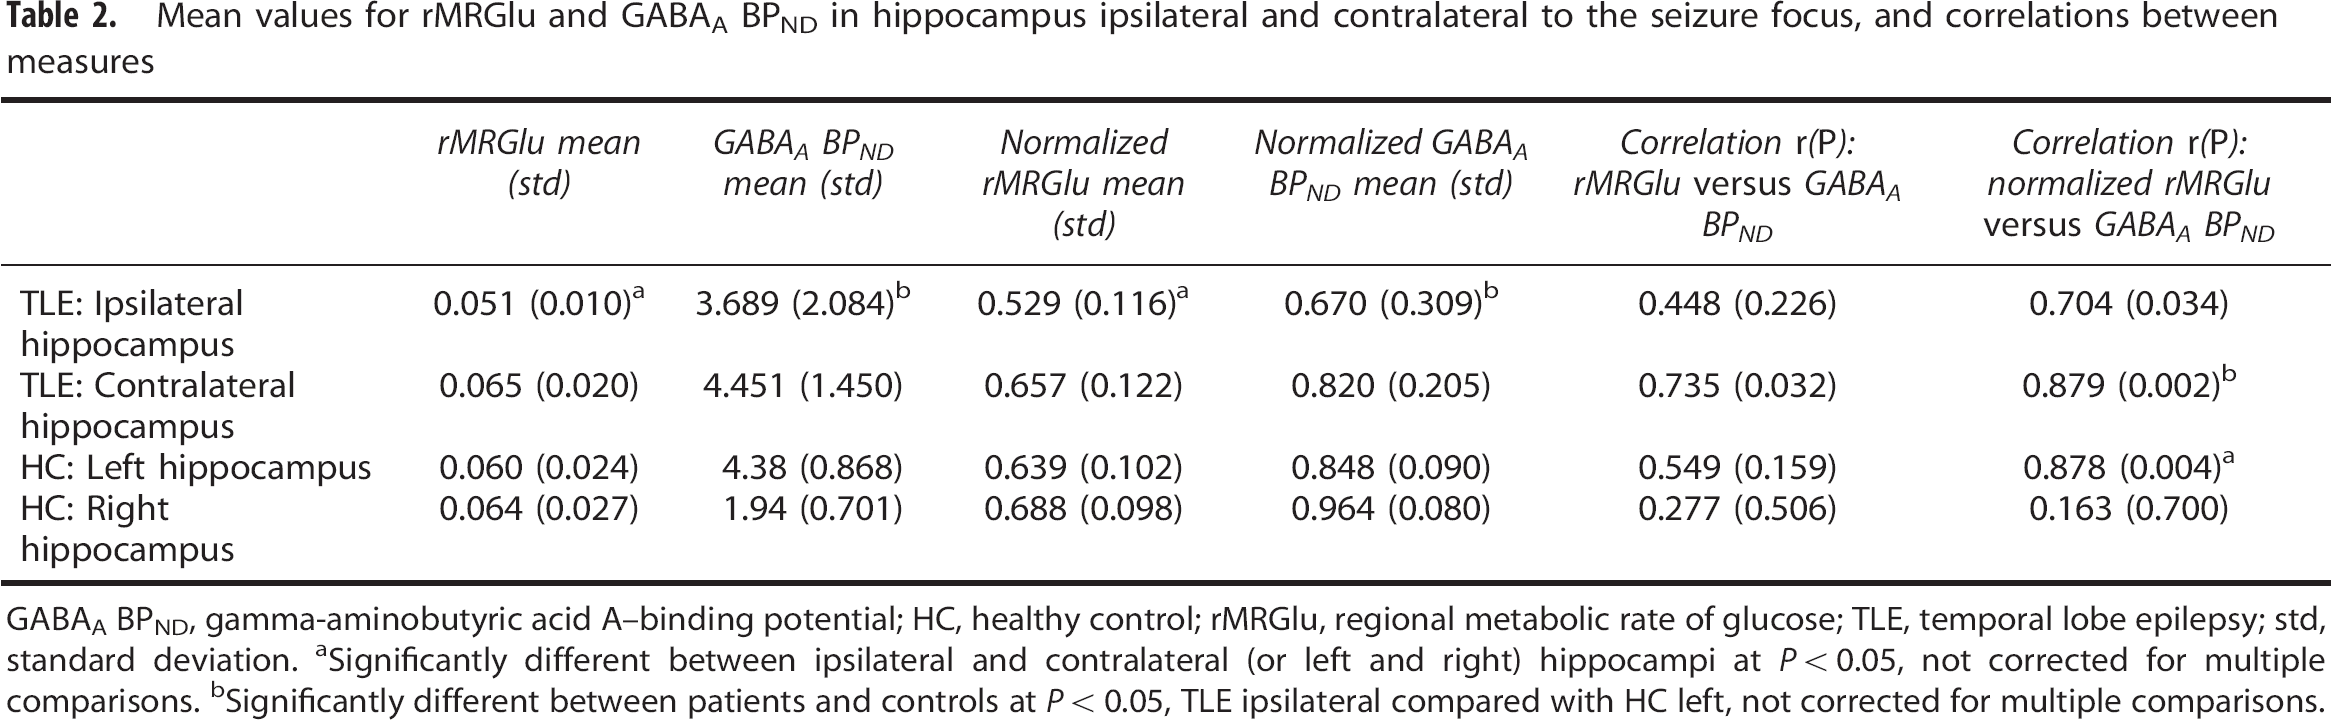
GABAA BPND, gamma-aminobutyric acid A—binding potential; HC, healthy control; rMRGlu, regional metabolic rate of glucose; TLE, temporal lobe epilepsy; std, standard deviation.
Significantly different between ipsilateral and contralateral (or left and right) hippocampi at
Significantly different between patients and controls at
Correlation Results
Mean correlation coefficients, transformed to
(
Only those correlations that differed significantly from zero, or showed a trend toward significance in at least one group, were assessed between groups. Correlations between rMRGlu and ALFFs, and between rMRGlu and GC differed significantly between groups (
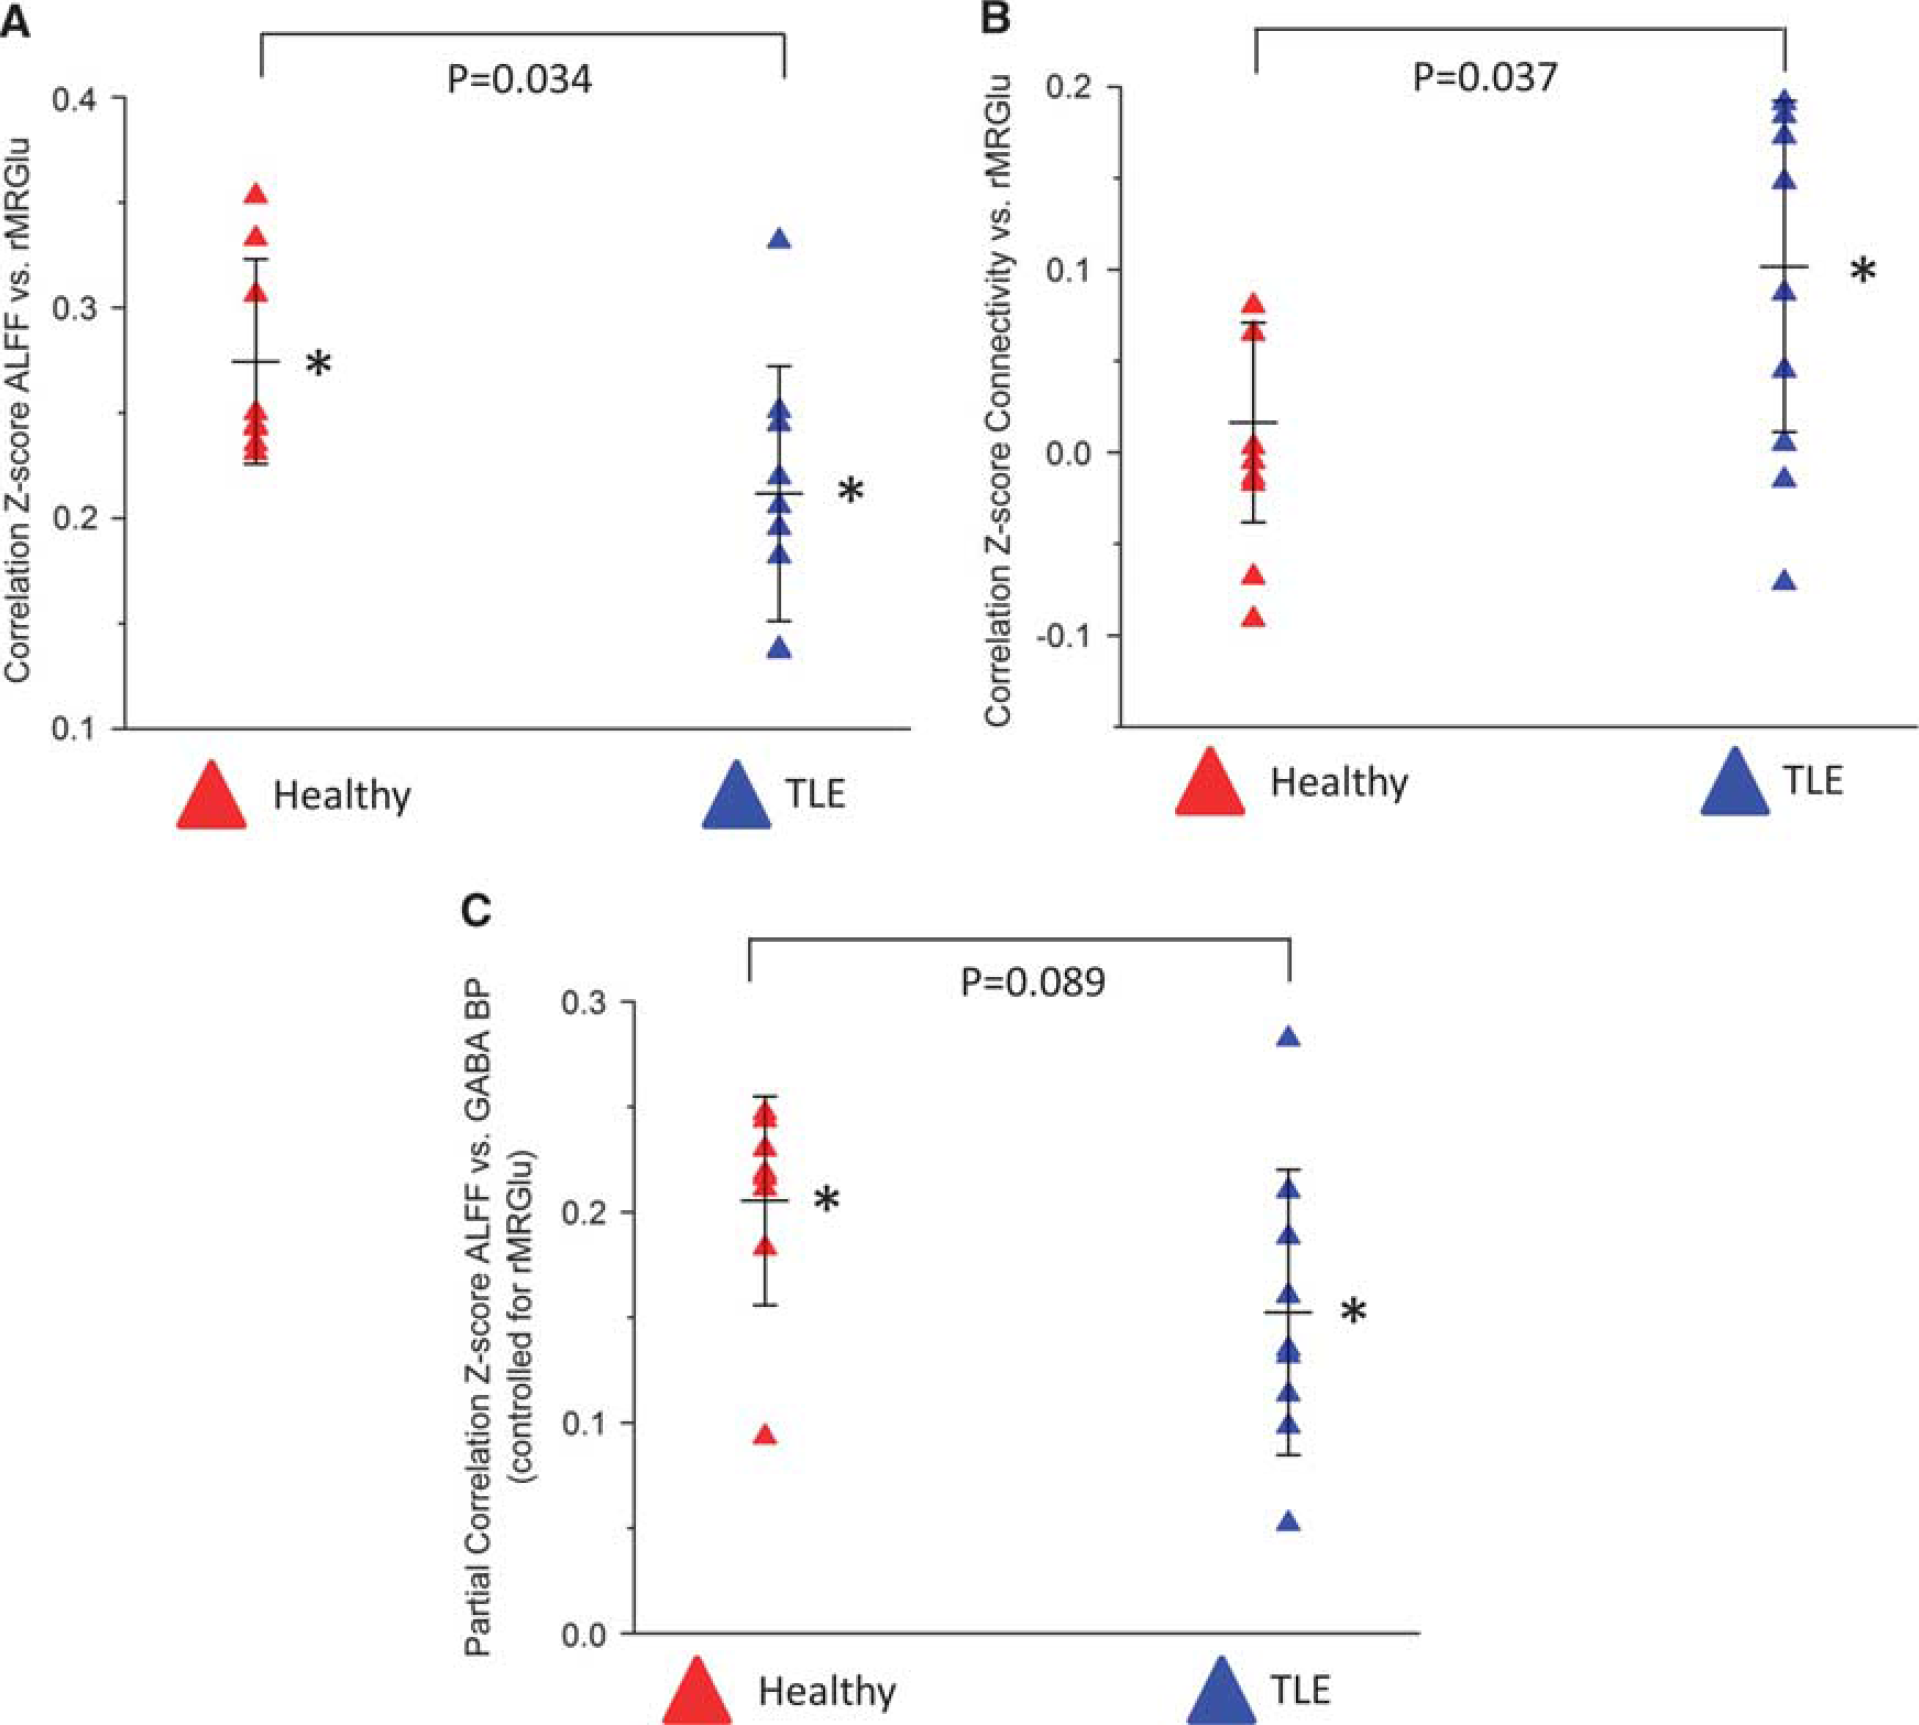
Scatterplots illustrating group differences in the
Finally, we compared the correlation between rMRGlu and GABAA BPND in the hippocampi ipsilateral and contralateral to the epileptic focus. Although correlations were nominally higher in the contralateral hippocampi, this difference was not statistically significant (Table 2). As a final post-hoc analysis, we correlated mean rMRGlu, GABAA BPND, ALFFs, GC, and ReHo across the entire brain with HAM-D scores and found no significant correlations; it should be noted, however, that our study was underpowered to detect such effects. In addition, no correlation was noted between contra- and ipsilateral rMRGlu and GABAA BPND and HAM-D score.
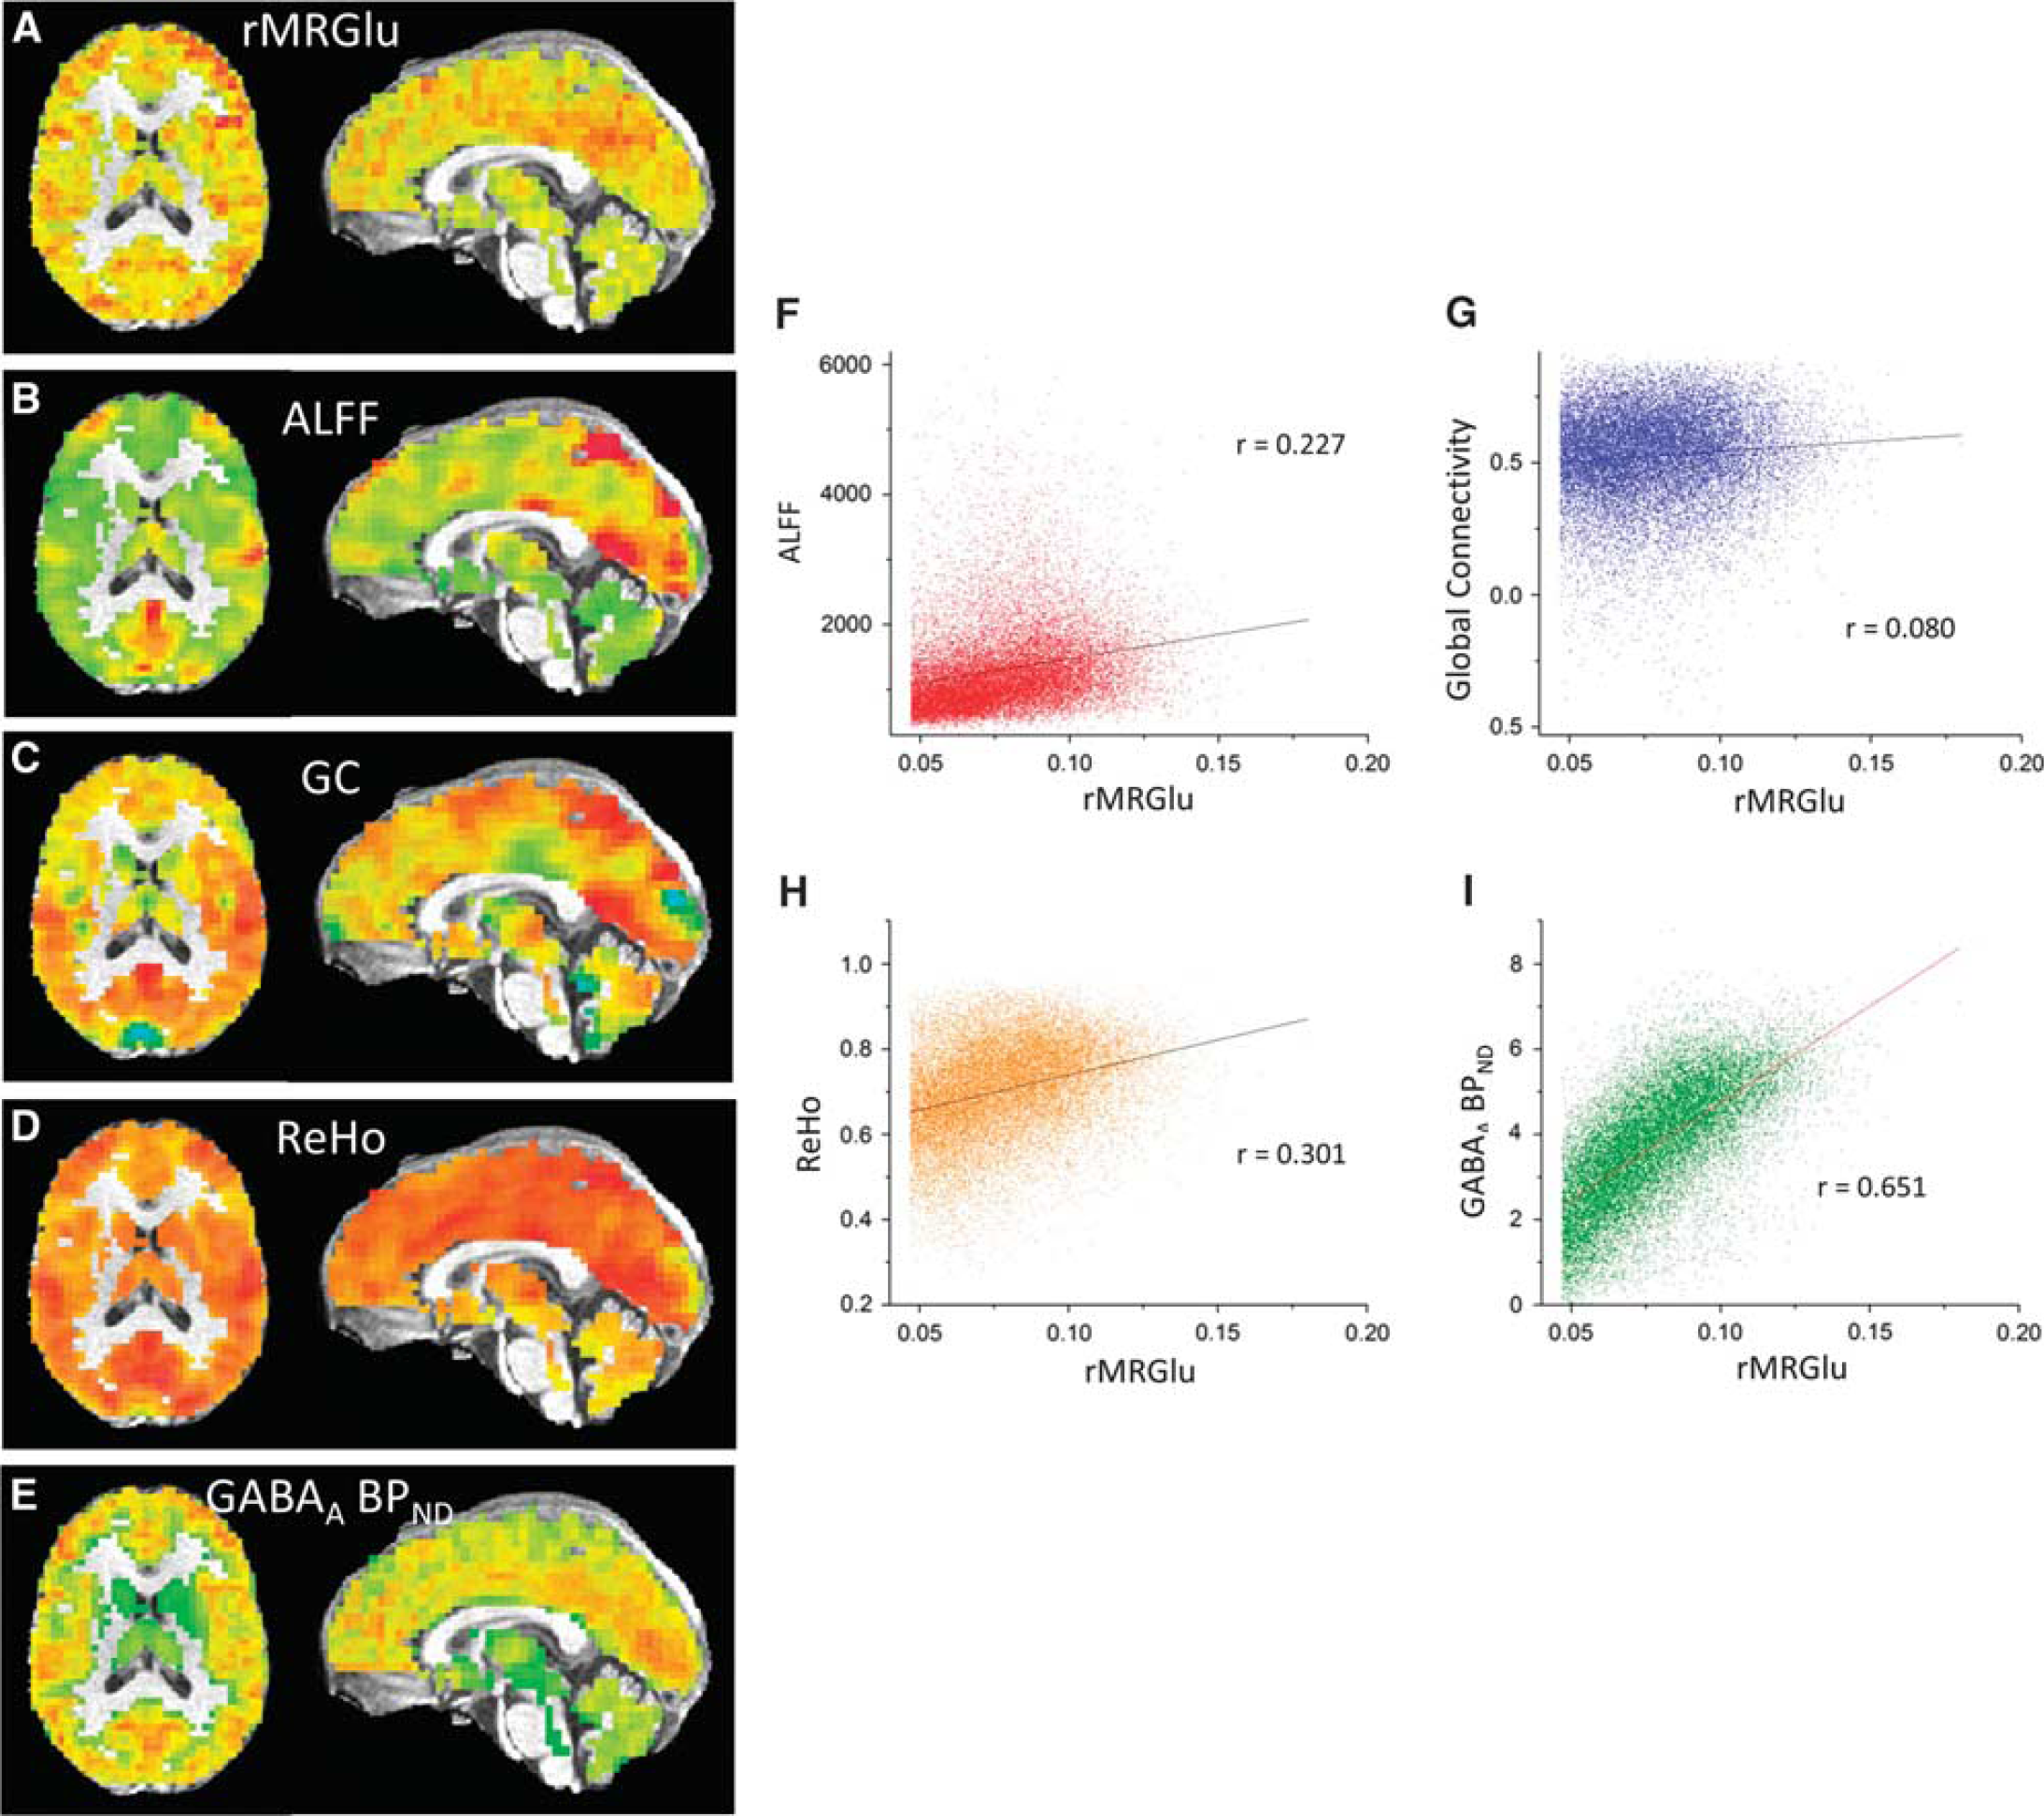
Voxel-Wise Between-Subject Analyses
Across subjects, no significant correlations between rMRGlu and ALFFs, rMRGlu and GC, or rMRGlu and ReHo were observed within either group. However, in both healthy and TLE subjects, a relationship between rMRGlu and GABAA BPND was observed in widespread regions. To display only the most closely related regions, the voxel-wise threshold was reduced to
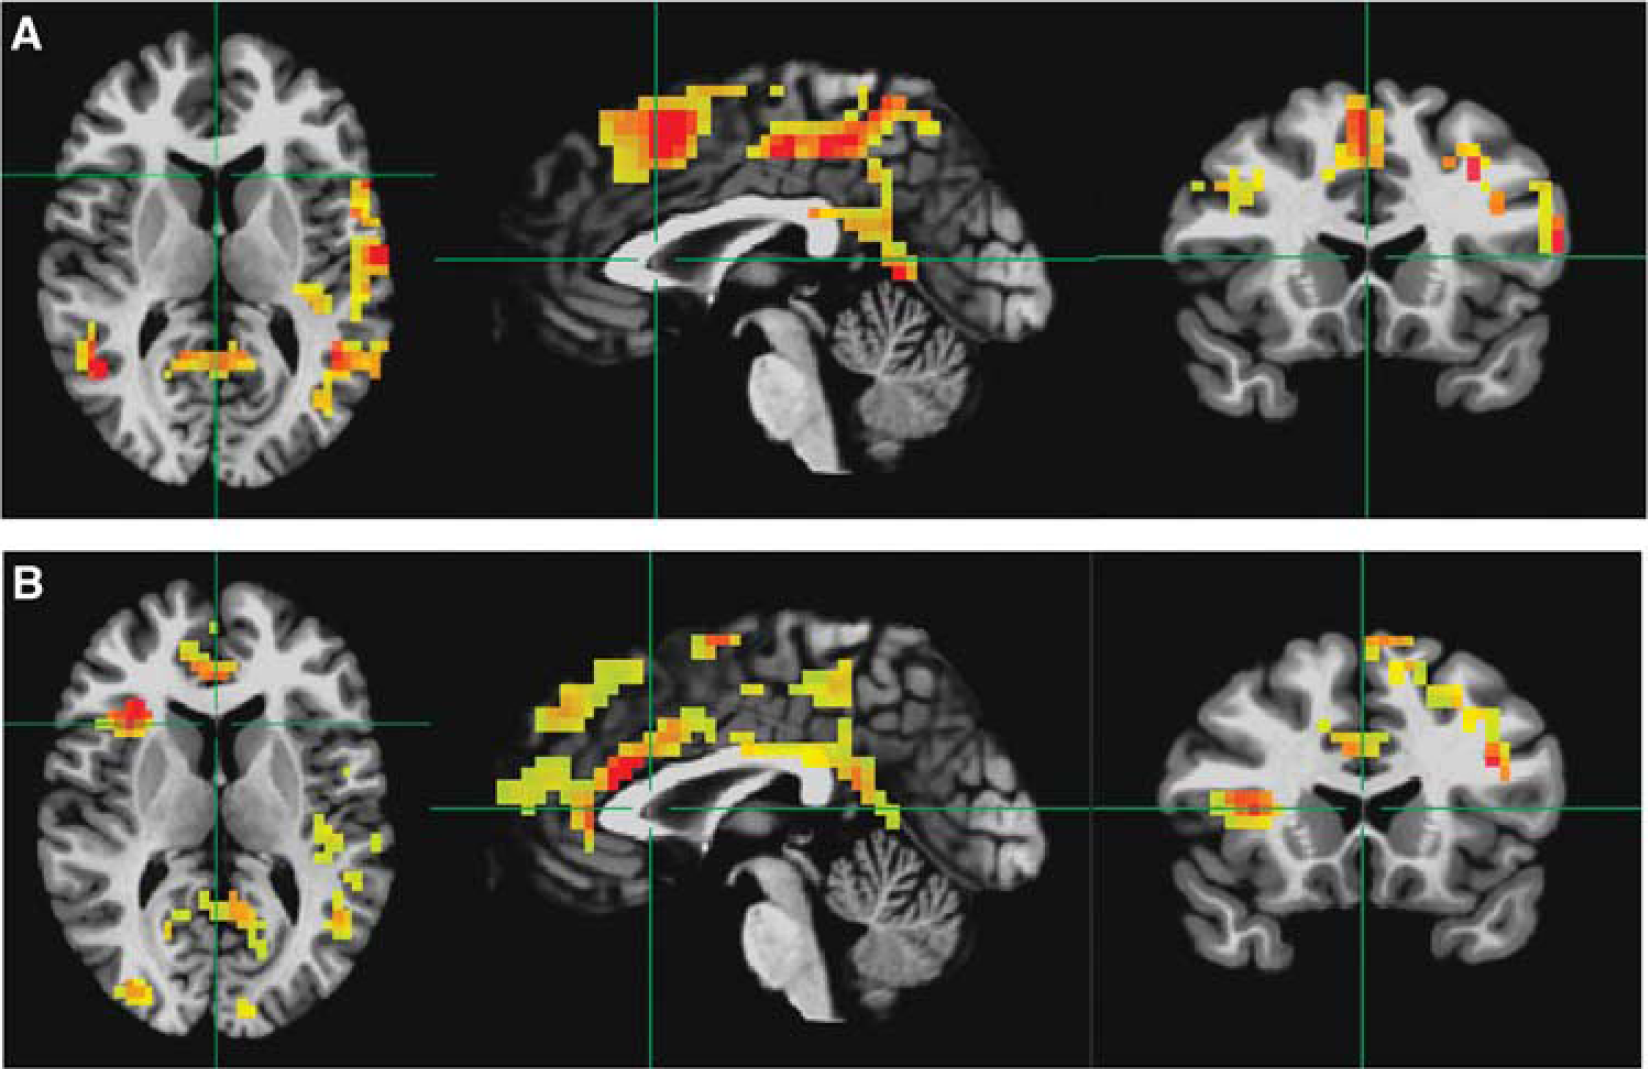
Voxelwise
Regions where GABAA BPND and rMRGlu were significantly correlated across subjects within each group a
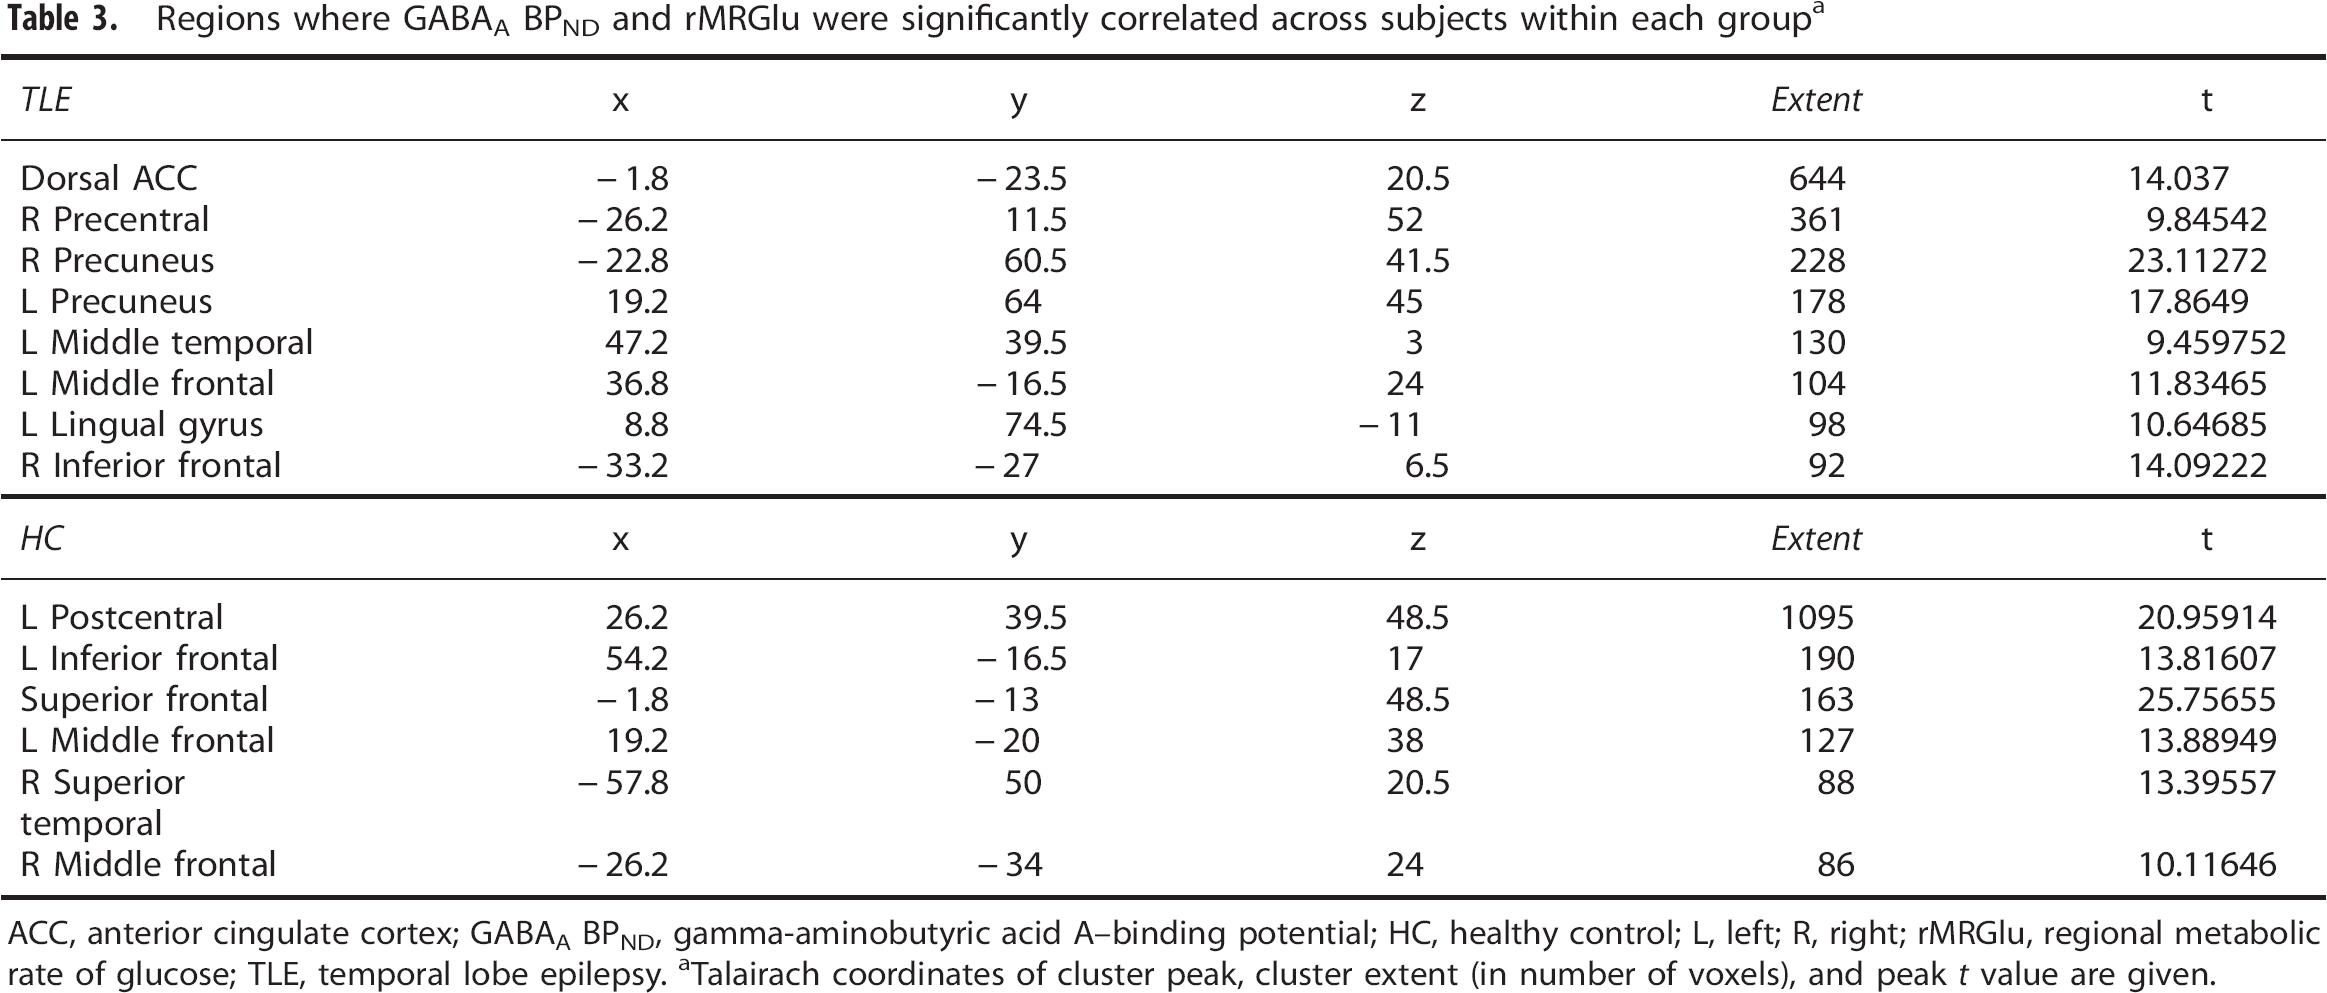
ACC, anterior cingulate cortex; GABAA BPND, gamma-aminobutyric acid A—binding potential; HC, healthy control; L, left; R, right; rMRGlu, regional metabolic rate of glucose; TLE, temporal lobe epilepsy.
Talairach coordinates of cluster peak, cluster extent (in number of voxels), and peak
Discussion
This preliminary study is the first to show significant group differences in the relationship between rsfMRI measures of functional connectivity and rMRGlu between healthy subjects and those with TLE. In contrast to our expectations, no differences were observed between groups in the correlation between rMRGlu and GABAA BPND.
Subjects with TLE consistently showed weak but significant positive correlations between GC and rMRGlu, while healthy controls showed no such significant correlation. The finding in healthy controls would seem to contradict prior research regarding correlations between glutamatergic function and functional connectivity. For example, a magnetic resonance spectroscopy and rsfMRI study showed correlations between glutamate concentration in a medial prefrontal area and both functional and structural connectivity to subcortical structures.
34
Similarly, another magnetic resonance spectroscopy and rsfMRI study showed correlations between glutamate in a posterior medial cortex ROI and connectivity within the DMN. Perhaps most convincingly, Tomasi
In contrast to the healthy control subjects, subjects with TLE showed significant correlations between GC and rMRGlu. Even in the absence of clinical seizures, subjects with TLE exhibit abnormal electrophysiologic activity known as interictal discharges, which depend on both glutamatergic and GABAergic activity that may induce hypersynchronization. 35 Although patients with epilepsy exhibit hypometabolism in the extended epileptogenic zone, evidence suggests that even interictal discharges cause transient focal increases in both blood flow and metabolism.36, 37, 38 Although purely speculative, it is conceivable that increases in metabolism after these abnormal discharges may pathologically stimulate long-range connectivity, enabling abnormal interictal discharges to propagate across the brain, resulting in seizures. Although the partial correlations we observed between GC and GABAA BPND controlling for rMRGlu did not differ significantly between groups, this parameter only reflects correlations above and beyond those because of correlations between GC and rMRGlu or GABAA BPND and rMRGlu. It is also worth noting that TLE subjects exhibit metabolic abnormalities beyond the seizure focus, in regions throughout the ipsilateral hemisphere,39, 40 consistent with the idea that long-range connectivity may be related to pathologic glucose metabolism in epileptic subjects.
We also found that healthy subjects and those with TLE differed in the coupling between ALFFs and rMRGlu. A correlation between rMRGlu and ALFFs is generally interpreted as reflecting the metabolic demands of synaptic currents and action potentials, which are reflected in the magnitude of the blood oxygen level-dependent signal. 19 Thus, the absence of such a relationship across the brains of subjects with TLE is notable. The reason for this, however, is unclear. If we assume a relatively intact neurovascular coupling, we can infer that the blood oxygen level-dependent activity measured by ALFFs accurately reflects underlying neural activity, and that the mechanisms underlying the glutamate-glutamine cycle in neurons and astrocytes are disturbed. Some evidence from animal models suggests that impaired glutamate cycling is widespread throughout the cortex, particularly implicating neuronal mitochondrial dysfunction,41, 42 though inadequate evidence is available in humans to firmly support this hypothesis. An alternate explanation for our finding is that neurovascular coupling is impaired in TLE. In this case, neuronal activity may not properly stimulate blood flow, resulting in decoupling from the measured blood oxygen level-dependent signal and underlying neuronal function. It appears, however, that in general neurovascular coupling is intact, although there may be a variable period of time after ictal or interictal spike events where cerebral blood flow is inadequate to meet metabolic demands (reviewed by Schwartz 43 ).
A pattern in the regions of abnormality does emerge from the literature on resting-state activity and connectivity in TLE. One study that directly examined ALFFs in TLE subjects found increased ALFFs in limbic structures, particularly ipsilateral to the seizure focus, but decreased ALFFs in regions overlapping the DMN,
44
areas that typically show the greatest rMRGlu. In addition, resting-state connectivity within the DMN, dorsal attention network, and executive control networks appears to be impaired, and regions involved in the DMN are smaller (reviewed by Cataldi
The fact that no significant differences were observed between rMRGlu and GABAA BPND correlations runs counter to our original hypothesis. It may be that the GABA and glutamate balance in the human brain represents a tight window of homeostasis, deviation from which is incompatible with normal human cognition. Other studies have investigated the balance between glutamate and GABA using single-voxel magnetic resonance spectroscopy in healthy humans, and found correlations of similar magnitude; to our knowledge, however, no studies have examined this coupling across the entire brain. 45 The positive correlation suggests that both extracellular GABA and glutamate turnover are coupled in lock step. Although it is possible that altered glutamate/GABA balance may be involved in epileptogenesis, the normal relationship appears to be largely preserved, at least during the interictal period; any potential differences are subtle in nature.
The primary limitation of this preliminary study was the small sample size. As a result, the study was underpowered to detect focal regions showing correlations across subjects or altered correlations between groups. We were therefore limited to correlative measures calculated within subjects, and our between-group comparisons did not survive correction for multiple comparisons. Notably, however, our between-group differences did show large effect sizes (
Despite the limitations, our study provides at least preliminary evidence suggesting that metabolic-functional correlations are disrupted in TLE. We also found evidence that glutamatergic function was abnormally coupled to long-range connectivity, potentially indicating a mechanism by which discharges in the seizure focus could result in abnormal discharges in widespread regions of the brain. Further elucidation of this process could potentially lead to new targets for the treatment of TLE and other epileptic disorders.
Footnotes
ACKNOWLEDGMENTS
The authors thank Irene Dustin and the members of the NINDS Clinical Epilepsy Section. Ioline Henter, MA (NIMH) provided invaluable editorial assistance.
Funding for this work was received by the Intramural Research Programs at the National Institute of Mental Health and National Institute of Neurological Disorders and Stroke, National Institutes of Health (IRP-NIMH-NIH, IRP-NINDS-NIH; grant number 09-N-0182, NCT00931619), and by a National Alliance for Research on Schizophrenia and Depression Award to CAZ. A patent application for the use of ketamine in depression has been submitted listing CAZ among the inventors; he has assigned his rights on the patent to the US government, but will share a percentage of any royalties that may be received by the government. All other authors have no conflicts of interest to disclose, financial or otherwise.