
Abstract
Interpretation of regional blood oxygenation level-dependent (BOLD) responses in functional magnetic resonance imaging (fMRI) is contingent on whether local field potential (LFP) and multi-unit activity (MUA) is either dissociated or associated. To examine whether neural-hemodynamic associated and dissociated areas have different metabolic demands, we recorded sensory-evoked responses of BOLD signal, blood flow (CBF), and blood volume (CBV), which with calibrated fMRI provided oxidative metabolism (CMRO2) from rat’s ventral posterolateral thalamic nucleus (VPL) and somatosensory forelimb cortex (S1FL) and compared these neuroimaging signals to neurophysiological recordings. MUA faithfully recorded evoked latency differences between VPL and S1FL because evoked MUA in these regions were similar in magnitude. Since evoked LFP was significantly attenuated in VPL, we extracted the time courses of the weaker thalamic LFP to compare with the stronger cortical LFP using wavelet transform. BOLD and CBV responses were greater in S1FL than in VPL, similar to LFP regional differences. CBF and CMRO2 responses were both comparably larger in S1FL and VPL. Despite different levels of CBF-CMRO2 and LFP-MUA couplings in VPL and S1FL, the CMRO2 was well matched with MUA in both regions. These results suggest that neural-hemodynamic associated and dissociated areas in VPL and S1FL can have similar metabolic demands.
Introduction
The extracellular signal measured from the cerebral cortex can be separated into high- and low-frequency bands to represent multi-unit activity (MUA) and local field potential (LFP), respectively, where the MUA reflects spiking activity of neurons in the neighborhood of the microelectrode tip and LFP represents the peri-synaptic (i.e. both pre- and post-synaptic) activities within the region. In search of specific type of neuronal activity that is reflected in the functional magnetic resonance imaging (fMRI) blood oxygenation level-dependent (BOLD) signal, Logothetis et al. 1 found that the sensory-evoked BOLD response in primate cerebral cortex is better correlated to LFP than MUA. While this result is used to argue that the cortical BOLD signal primarily reflects LFP, another important implication is that MUA is dissociated to some degree from LFP.
This type of neural-hemodynamic dissociation has been reported under a variety of other situations. Lauritzen and colleagues 2 found dissociation between synaptic and spiking activities in the rat cerebellum. They compared LFP and MUA measurements with cerebral blood flow (CBF), as reflected by laser Doppler flowmetry (LDF), to show activity-dependent differences. Stimulation of the mono-synaptic climbing fiber system evoked LFP and MUA in Purkinje cells with concomitant increases in CBF, indicating that both synaptic and spiking activities contributed to CBF rise. But stimulation of di-synaptic parallel fiber system inhibited MUA in Purkinje cells, while LFP and CBF increased together. Thus, observations of regional dissociation of MUA from LFP, and hence BOLD or CBF, has been rationalized on the basis of both vascular- and circuitry-based differences.3–5
To approximate the BOLD signal as a correlate of CBF alone is an extreme simplification because cerebral blood volume (CBV) and cerebral metabolic rate of oxygen consumption (CMRO2) changes contribute significantly to the fMRI contrast. 6 In fact, calibrated fMRI uses multi-modal measurements of BOLD signal, CBV, and CBF to calculate CMRO2 changes with sensory-evoked perturbations.7,8 Because comparing these neurophysiological and neuroimaging signals can gave insights into circuitry-based and flow-metabolism coupling differences, we used the rat’s ventral posterolateral thalamic nucleus (VPL) and somatosensory forelimb cortex (S1FL) as two model regions to examine the functional energy demand of brain regions where LFP and MUA is associated vs. disassociated from the respective BOLD responses. The VPL is composed of star-shaped thalamic cells, which possess closed-field geometry such that synaptic field waveforms may cancel out. 9 However, S1FL consists of large populations of pyramidal cells, which are oriented in parallel along the cortex such that synaptic currents integrate and summate. 9 The capillary density in the thalamus is similar to most cortical structures. 10
In this multi-modal and multi-regional study, we sought to examine whether neural-hemodynamic associated and dissociated areas have different metabolic demands. While we found that LFP was disassociated from MUA in VPL, the LFP was well associated with MUA in S1FL. Similar to these neural associated vs. disassociated responses, BOLD and CBV responses were far greater in S1FL than in VPL. But both CBF and CMRO2 responses were much greater in S1FL and VPL. In addition, and to our surprise, we found that despite different levels of CBF-CMRO2 and LFP-MUA couplings in VPL and S1FL, which to a large extent explains the regional differences in BOLD responses, the CMRO2 and MUA responses in both regions were quite well matched. Hence, the neurometabolic coupling as reflected by CMRO2 and MUA was intact and similar in S1FL and VPL. These results highlight that calibrated fMRI may be used to distinguish between BOLD-LFP-MUA associated and dissociated areas in the brain.
Materials and methods
Animal preparation
All procedures were performed in accordance with protocols approved by the Yale University School of Medicine Institutional Animal Care and Use Committee and in agreement with the National Institutes of Health Guide for the Care and Use of Laboratory Animals. Procedures complied with the regulations of the Animals (scientific procedures) Act 1986 and reporting follows the ARRIVE (animal research: reporting of in vivo experiments) guidelines. All experiments were conducted on artificially ventilated (2–2.5% isoflurane during surgery, plus 70% N2O/30% O2) adult male rats (n = 17; Sprague-Dawley; 200–300 g; Charles River, Wilmington, MA). Six rats were used for simultaneous electrophysiology (MUA, LFP) and LDF (CBF) experiments, and 11 rats were used for multi-modal fMRI studies (BOLD, CBV). A femoral artery was cannulated for monitoring physiologic parameters (pCO2, pO2, pH, blood pressure) and a femoral vein was cannulated for infusion of MRI contrast agent for measuring changes in CBV. Physiological variables (pCO2, pO2, pH, blood pressure) were measured and kept within normal limits (34 ± 3 mmHg, 112 ± 18 mmHg, 7.35 ± 0.04 mmHg, 112 ± 16 mmHg, respectively). An intraperitoneal catheter was used for administration of α-chloralose (∼40 mg/kg/h) and D-tubocurarine chloride (∼0.3 mg/kg/h). After all the surgical procedures, isoflurane was discontinued and anesthesia was maintained with α-chloralose. Ventilation parameters were adjusted to maintain normal physiology. The animal core temperature was measured by rectal probe and controlled by a heated water blanket at maintained at ∼37℃.
Multi-modal fMRI experiments
All fMRI data (n = 11) were obtained on an 11.7T system with Varian (Agilent Technologies, Santa Clara, CA) spectrometer using a 1H surface coil radio-frequency probe (1.4 cm diameter). During fMRI recordings, the rat was positioned prone in a specially designed plastic holder in such a manner that a surface coil would be placed at the top of the rat’s head. Five contiguous coronal slices were selected to cover somatosensory forepaw and thalamic regions (which were located in different coronal slices). Localized shimming was used to yield typical water spectrum line-width of less than 20 Hz across the slices optimized the magnetic field homogeneity. Details of fMRI measurements (BOLD and CBV) are discussed elsewhere. 11 Briefly, BOLD signal was acquired with echo-planar imaging (EPI) using gradient-echo contrast with repetition and echo times of 1000 and 15 ms, respectively. The field-of-view was 2.56 × 2.56 cm with in-plane matrix resolution of 64 × 64 and slice thickness of 2 mm resulting voxel size of 0.4 × 0.4 × 2 = 0.32 mm3. Sixteen dummy scans were carried out before fMRI data acquisition began. The anatomical images were obtained in the same field-of-view using gradient-echo (GEMS) or fast spin-echo (fSEMS) contrast sequences in 128 × 128 matrix. Using different echo times, GEMS and fSEMS were used to obtain maps of transverse relaxation rates with gradient-echo (R2*) and spin-echo (R2), respectively, to obtain the R2′ which is given by R2* − R2.11,12 In the same subjects after completion of the BOLD experiments, CBV signal was measured by the same EPI parameters but in the presence of an intravenous injection of iron oxide nanocolloid particles (Combidex, 15 mg/kg, AMAG, Cambridge, MA), which has a very long half-life in blood circulation of rodents. The paramagnetic effect of the injected blood-borne MRI contrast agent induces a drop of MRI signal intensity when the blood volume increases. Therefore, all CBV-weighted fMRI data were multiplied by −1 to reflect positive changes in CBV during functional hyperemia.
Neurophysiology experiments
Rats (n = 6) were mounted on a stereotaxic frame (David Kopf Instruments, Tujunga, CA) placed on a vibration-free table inside a Faraday cage. The scalp and the galea aponeurotica were removed and small burr holes were drilled for insertion of a dual-sensor device consisting of adjacent electrical and optical probes to simultaneously measure neural and CBF signals, respectively. 13 Electrical signals were measured with a high impedance tungsten microelectrode (2–4 MΩ; FHC, Bowdoin, ME) and CBF was measured by an LDF probe (Oxyflow 4000, Oxford Optronix, Oxford, UK). Evoked changes in LDF signal were measured with respect to the pre-stimulus baseline, where the intensity of the LDF signal change was calibrated to CBF change collected with arterial spin tagging (ASL) MRI. 13 Since the CBF sensitivity of ASL was low in subcortical regions, we used the calibration to derive quantitative change in CBF from the measured LDF signals in these two regions.
The tip of the microelectrode was placed approximately 300 µm below the LDF probe to ensure overlapping sampling volumes from both measurements. 14 With reference to bregma and the sagittal midline plane, electrodes were placed in the following coordinates: S1FL cortex (1 mm anterior, 4.4 mm lateral, 1 mm dorsoventral); VPL nucleus of the thalamus (3 mm lateral and 3 mm posterior to bregma, 5 mm dorsoventral). Neural activity in the form of MUA and LFP were simultaneously recorded with Spike2 software (CED, Cambridge, UK). Electrophysiological signals obtained were digitized at 20 kHz and actively filtered to LFP and MUA signals (Krohn-Hite Corp., Brockton, MA) by splitting the electrical signals into low (<150 Hz) and high frequency (0.4–10 kHz) bands, respectively, using Butterworth filters (24 dB/oct attenuation).
Stimulus presentation
Two subcutaneously placed copper needles were inserted into the contralateral forepaw (between the second and fourth digits) and all snout whiskers were shaved to avoid contaminating somatosensory signals. All stimulus presentation was controlled by a µ1401 analog-to-digital converter unit (CED, Cambridge, UK) running a custom-written script for providing block design (off-on-off) electrical stimuli of 30 s in duration to provide 0.3 ms duration monophasic square wave pulses with 2 mA amplitude by an isolation unit (WPI, Sarasota, FL). We chose a fixed frequency of 3 Hz where we obtain robust fMRI responses under α-chloralose anesthesia. 13
Data analysis
fMRI
All fMRI data were subjected to a translational movement criterion using a center-of-mass analysis. If any center-of-mass value in a series deviated by more than 25% of a pixel, the entire dataset was discarded from further analysis. Single run data were used to create activation maps and time courses. Activation foci for fractional change in BOLD and CBV maps were obtained by applying Student’s t-test comparison of resting and stimulated data, where statistically significant t values were generated using a paired t test between 30 s baseline and 30 s stimulation periods. Results displayed as t maps of BOLD activations were superimposed on corresponding anatomical images, with approximate coordinates relative to bregma. 15 Individual time courses of activated voxels were averaged across many subjects and mean ± standard deviation (SD) was used to provide the BOLD and CBV responses.
Calibrated fMRI
CMRO2 responses were calculated from with calibrated fMRI using averaged BOLD, CBV, and CBF signals,7,16

Neurophysiology
Electrical recordings from S1FL and VPL were obtained simultaneously. Data sections of 2-min length (i.e. a block design paradigm of 30 s rest, 30 s stimulation, and 60 s rest) were selected for analysis. After completion of the electrical measurements, the rats were intracardially perfused with physiological NaCl solution and 4% cold paraformaldehyde (PFA) in 0.01 M phosphate-buffered saline (PBS) at pH of 7.4. After a week of fixation in 4% PFA, brains were then immersed in 30% sucrose for at least 2 days until they sank in sucrose solution. All brains were sliced to 60-µm thick slices, transferred on gelatin-coated glass slides and stained with cresyl violet and images were taken to ensure correct position of recording probes in the brain. Locations of the microelectrode/laser Doppler probe assembly were marked based on tissue damage seen on Cresyl violet-stained histology sections and recorded sites were mapped on coronal brain section schematics from a standard atlas. 15 All non-confirmed experiments were discarded from the analysis. Latencies (time difference between the stimulation and the neuronal response defined by either the elevation of the evoked LFP or the first identified spike in the MUA) were determined on the high-resolution traces obtained from the S1FL and VPL areas. Spike activity was extracted from MUA time series with wavelet spike sorting and superparamagnetic clustering algorithms. 17 Sorted spikes were used to calculate peristimulus time histograms (PSTHs) in 1 ms resolution, both 10 ms before and 40 ms after each individual stimulus. The PSTHs were created as the cumulative number of identified spikes from the stimulation period of MUA time series in 1 ms bins (i.e. from stimulus to stimulus in 333 ms intervals). Spiking rate through the block design recording was calculated in 1 s bins, and subsequently averaged in the selected time series. The MUA and LFP activities were compressed to the same resolution using root-mean-square (RMS) calculation with 1 Hz 13 : raw data were squared, averaged over 1 s bins, and then the square root was calculated. As a result, our high-resolution neural signals are presented at the same time resolution as the fMRI data. Since the thalamic LFP response magnitude was weak, LFP responses were extracted using third-order Gaussian wavelet with continuous wavelet transform from the raw signal (LFPMWL). The RMS of calculated wavelet coefficients at every frequency were normalized to the pre-stimulus section, then the frequency range where the response was significant, was averaged along the time axis.
Statistics
All statistical analyses were performed with MATLAB (r2014b, Natick, MA). All data were expressed as means ± SDs. We applied paired Student’s t hypothesis tests where p < 0.05 was considered significant for group level comparisons for cortical and thalamic responses of hemodynamic and neural signals. For the identification of functional responses in imaging parameters (BOLD, CBV), we applied Student’s t-test comparison within each trial, where we compared 30 s rest and 30 s stimulation data for every voxel of the recorded slices to obtain the t-map of the responses. We obtained averaged time courses of BOLD/CBV responses from S1FL layer 4 and VPL identified regions.
Results
Neural responses from cortex and thalamus
Neural activity measurements of S1FL (layer 4) and VPL regions were achieved by placing independent microelectrodes for simultaneous extracellular recordings, whose locations were verified by histology. Simultaneously measured MUA and LFP from S1FL and VPL are shown in Figure 1. Each stimulus (shown as gray vertical lines in Figure 1(a) and (b)) evoked a neural response detected by MUA and LFP traces. In S1FL, the evoked changes in both MUA and LFP were easily discernible in relation to the spontaneous (i.e. baseline) variation in neural activity (Figure 1(a), i). But in VPL only the MUA changes were detectable, but the magnitude of evoked LFPs in VPL were smaller compared with evoked LFPs from S1FL (Figure 1(a), ii). LFP responses were extracted using a specific form of Gaussian wavelet analysis on the raw signal (see below).
Sensory-induced dynamics of neural activity from the contralateral somatosensory cortex and thalamus during forepaw stimulation (i.e. vertical black lines, 2 mA, 0.3 ms, 3 Hz), where the neural responses from the middle layers of S1FL (red) and VPL (blue) were simultaneously recorded. (a) Simultaneous cortical and subcortical recordings of (i) multi-unit activity (MUA) and (ii) local field potential (LFP) are shown on top and bottom for the first 8 stimuli and 1 stimulus, respectively. (b) The bottom traces show that the VPL response latency (3.8 ms) is earlier than the S1FL response latency (8.5 ms) following the stimulus, although the VPL vs. S1FL latency difference is far more easily discernible in the MUA data because the LFP in VPL is significantly attenuated compared with the LFP in S1FL. (c) To better estimate the latency in VPL and S1FL responses, we used raster plots and peristimulus time histogram (PSTH) analysis of the MUA data. Shown are 747 trials of spiking activity simultaneously recorded from S1FL (i) and VPL (ii) (from a single rat) in terms of raster plots and PSTH analysis, where the histograms were created as the cumulative number of identified spikes from the stimulation period of MUA time series in 1 ms bins (i.e. from stimulus to stimulus in 333 ms intervals). The large peak at 0 s represents the stimulus artifact (or onset).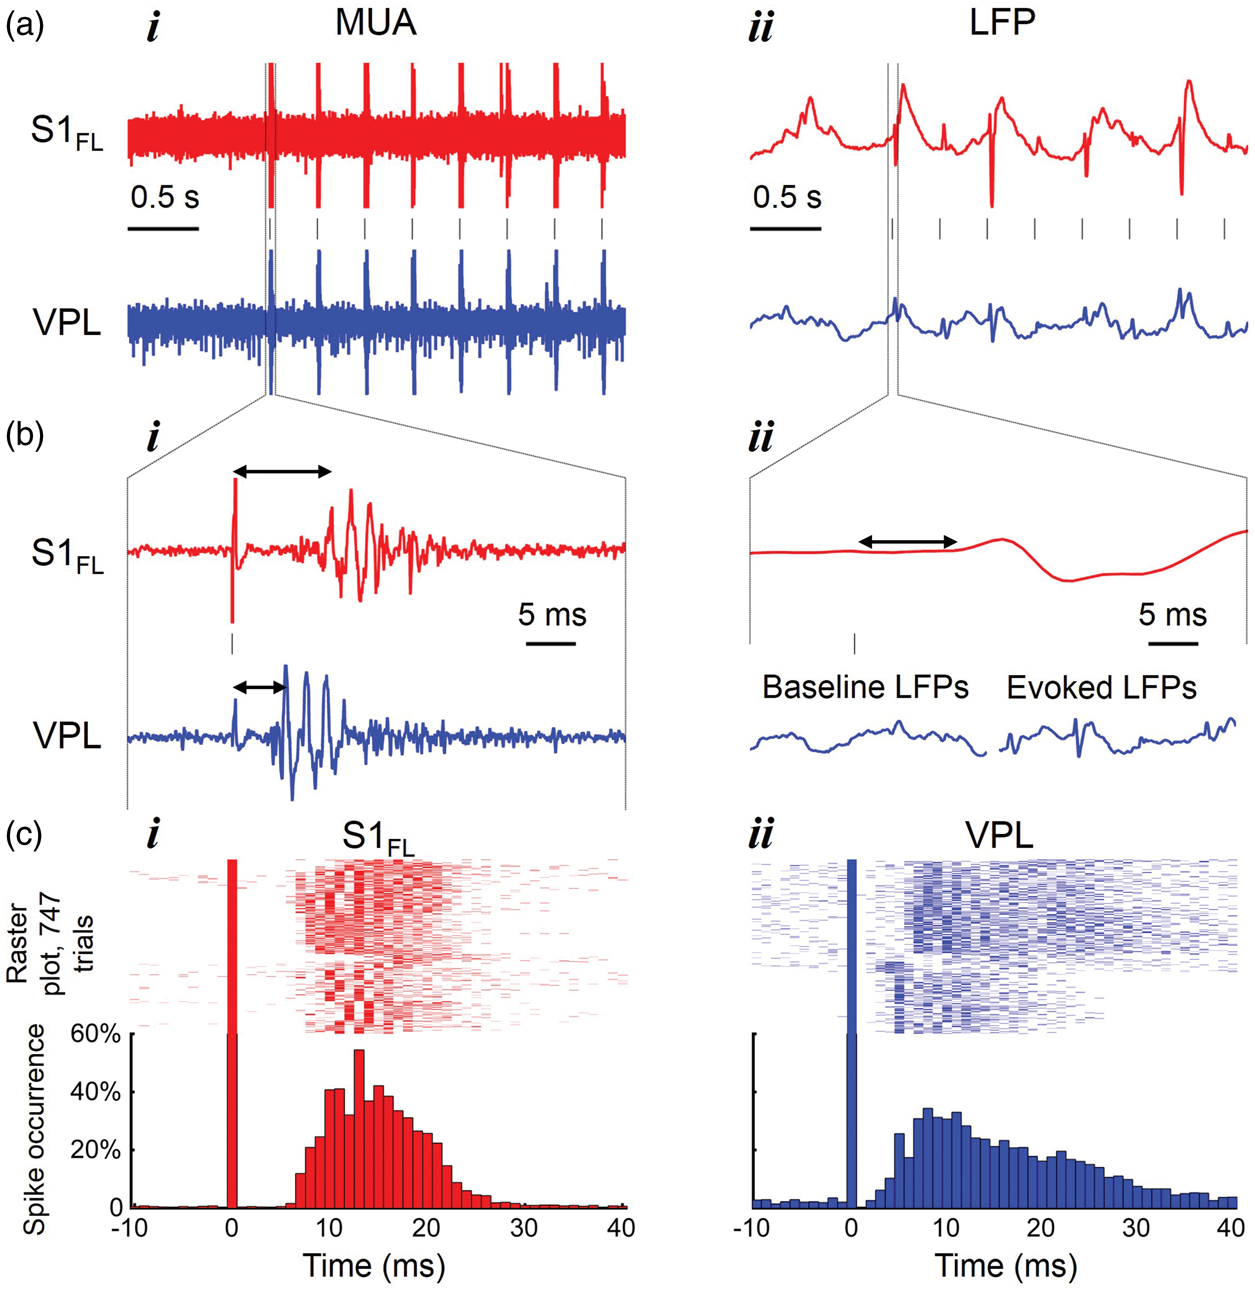
We observed latency differences between S1FL and VPL regions. The latency was calculated from the stimulus onset to the rise of observed signal (horizontal double arrow in Figure 1(b)) or to the first identified spike (Figure 1(c)). Evoked VPL responses were observed first at ∼4 ms after the stimulus onset and ∼4 ms later, the S1FL responses were observed. The LFP and MUA data in S1FL showed similar latencies (Figure 1(b), i), but only MUA could be used to calculate latency in VPL region as the LFP from VPL showed minimal difference between baseline and evoked LFPs (Figure 1(b), ii). For detailed description of latencies between cortical and thalamic activations, we used the spiking activity data using all trials from S1FL (Figure 1(c), i) and VPL (Figure 1(c), ii) in terms of raster plots (top) and their PSTHs (bottom). The raster plot and PSTH analysis shows a clear significant difference in latency between S1FL and VPL (3.8 ± 2.9 ms). The average response latency of six rats for VPL and S1FL were 3.8 ± 0.6 ms and 8.0 ± 1.6 ms, respectively. The observed latencies in MUA responses for these two regions are consistent with the previous studies. 18
BOLD responses from cortex and thalamus
Sensory-evoked localized activations in rat’s contralateral somatosensory cortex and thalamus during forepaw stimulation (2 mA, 0.3 ms, 3 Hz) revealed by fMRI at 11.7T are shown in Figure 2. The BOLD data in Figure 2(a) and (b) are examples from a single rat (single trial) for S1FL and thalamic activations, where broader region of the thalamic area was activated including ventral posterolateral (VPL), ventral posteromedial (VPM), and posterior (PO). The activated BOLD voxels at S1FL and thalamic regions are consistent with previous studies in the literature.19,20 The spatial extent and magnitude of BOLD response was significantly larger at S1FL as compared with thalamic regions. We further analyzed time courses of BOLD response from many experimental trials of single block design paradigm in 7 rats of the total 11 rats imaged, because four of the rats did not show reproducible thalamic activations and those data were not included for further analysis. The averaged BOLD responses across different cortical lamina from the S1FL and different thalamic regions (VPL, VPM, PO) during 30 s of forepaw stimulation are shown in Figure 2(c). We observed layer-specific BOLD responses across cortical lamina and the results were consistent with previous studies.
11
The responses from the top layer (6.4 ± 2.2%; Figure 2(c), i) were larger than evoked changes in the bottom (3.7 ± 2.0%%; Figure 2(c), ii) middle (5.2 ± 2.2%%; Figure 2(c), iii) layers. In thalamus, the evoked BOLD responses were quite uniform across all nuclei (VPL = 1.6 ± 1.3%; VPM = 1.4 ± 1.3%; PO = 1.4 ± 1.2%%; Figure 2(c), i-iii). But evoked BOLD responses from thalamic regions were much lower in magnitude compared with the evoked BOLD response from S1FL. For comparison of evoked dynamic responses with other measurements, we used the BOLD responses from middle layers of S1FL and VPL.
Sensory-induced activation of rat cerebral cortex and thalamus revealed by high-field (11.7T) fMRI. BOLD activation maps of (a) the primary somatosensory cortex area of forelimb (S1FL) and (b) the thalamus separated into ventral posterolateral thalamic nucleus (VPL), ventral posteromedial nucleus (VPM), and posterior thalamic nuclear complex (PO) obtained during right forepaw stimulation (2 mA, 0.3 ms, 3 Hz). BOLD activation maps, displayed as colored statistical maps (t values were generated using a paired t test in which pairs consisted of 30 s baseline and 30 s stimulation periods) overlaid on gray anatomy with atlas-based outlines, are shown for coronal slices positioned (a) ∼1 mm anterior to bregma for S1FL and (b) ∼3 mm posterior to bregma for thalamic regions. (c) Contralateral cortical (red) and thalamic (blue) time courses of BOLD responses during forepaw stimulation (i.e. 30 s black horizontal lines). Three regions (upper (i), middle (ii), and lower (iii) layers) of the activated S1FL and three nuclei (VPL, VPM, and PO) of activated thalamus are shown.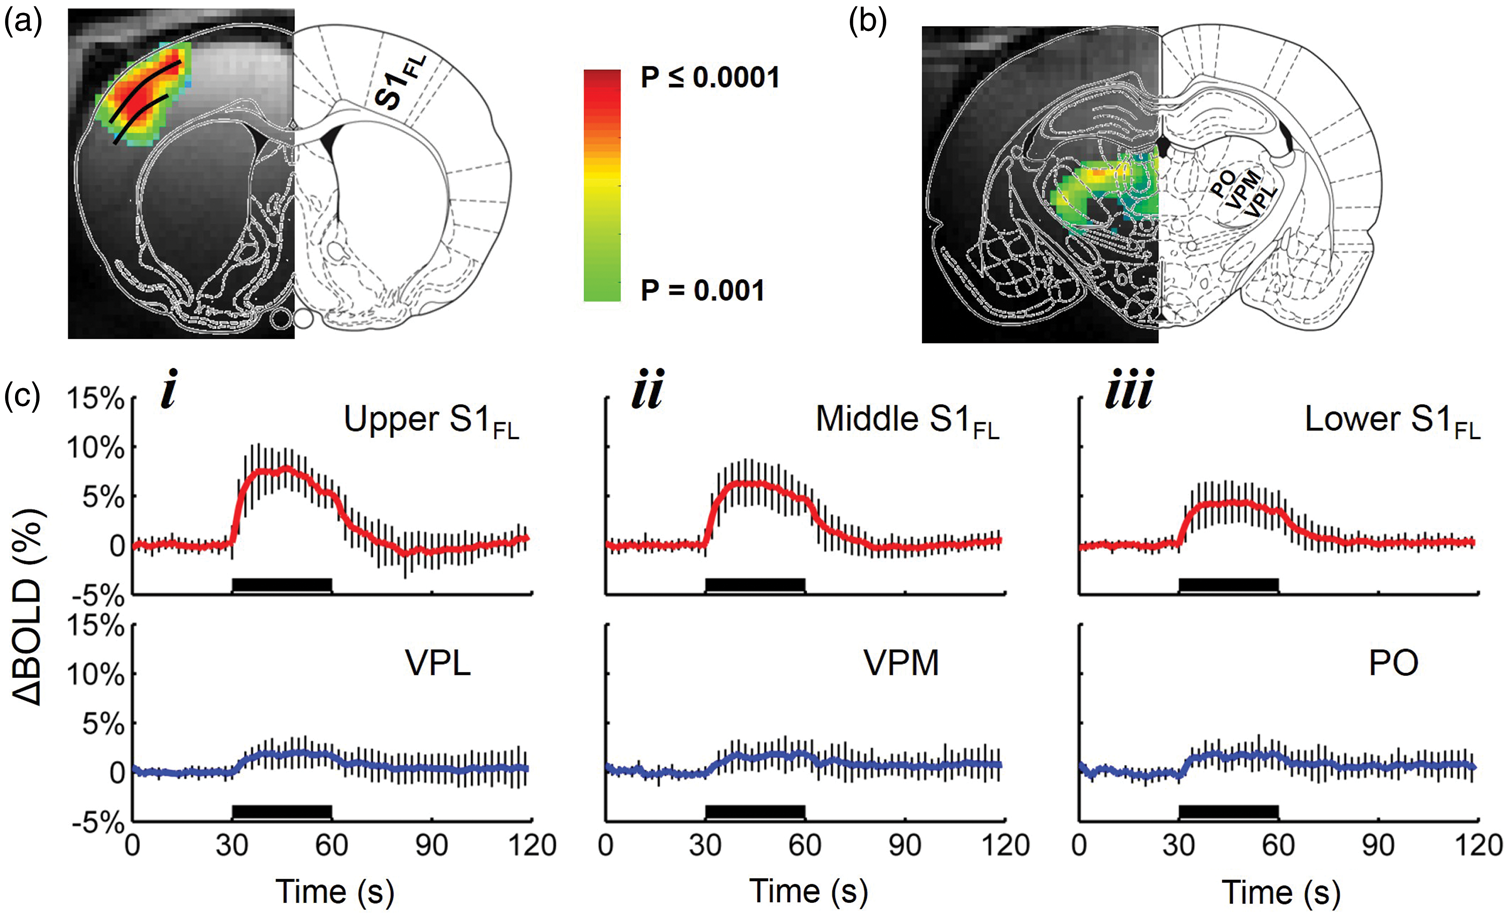
Dynamic multi-modal responses from S1FL and VPL
Figure 3 compares the sensory-evoked neural (MUA, LFP), hemodynamic (BOLD, CBV, CBF), and metabolic (CMRO2) signals from middle layers of S1FL and VPL.
Summary of multi-modal sensory-induced responses. (a) Sensory-induced dynamics of spike rate and relative MUA changes in S1FL (red) and VPL (blue) during forepaw stimulation (i.e. 30 s black horizontal lines). The data represent mean ± SD of many trials from 6 rats (each trial: 30 s rest, 30 s stimulation, 30 s rest). The spike rate change is shown from the basal firing in each region. The MUA data are shown as 1 Hz root mean square (RMS) time courses, with a binned RMS approach.
13
The MUA responses (both spike rate change and MUARMS) were not significantly different between S1FL and VPL. The mean wavelet response of LFPs (LFPMWL) were calculated. LFPMWL responses between S1FL and VPL are significantly different. The evoked LFP at VPL are significantly smaller than S1FL. The LFP data are shown as maximum wavelet coefficient responses (see Methods). (b) Sensory-induced dynamics of hemodynamic (ΔBOLD, ΔCBV, and ΔCBF) and metabolic (ΔCMRO2) responses from the contralateral S1FL (red) and VPL (blue) during forepaw stimulation (i.e. 30 s black horizontal lines). All signals were represented as the fractional change from the pre-stimulus baseline. The data represent the mean ± SD of many trials in each case across different subjects. The measured time courses of BOLD, CBV, and CBF were localized to the middle layers of S1FL and VPL, and they were used to calculate the respective CMRO2 responses by calibrated fMRI. The stimulus presentation is indicated by horizontal black bar.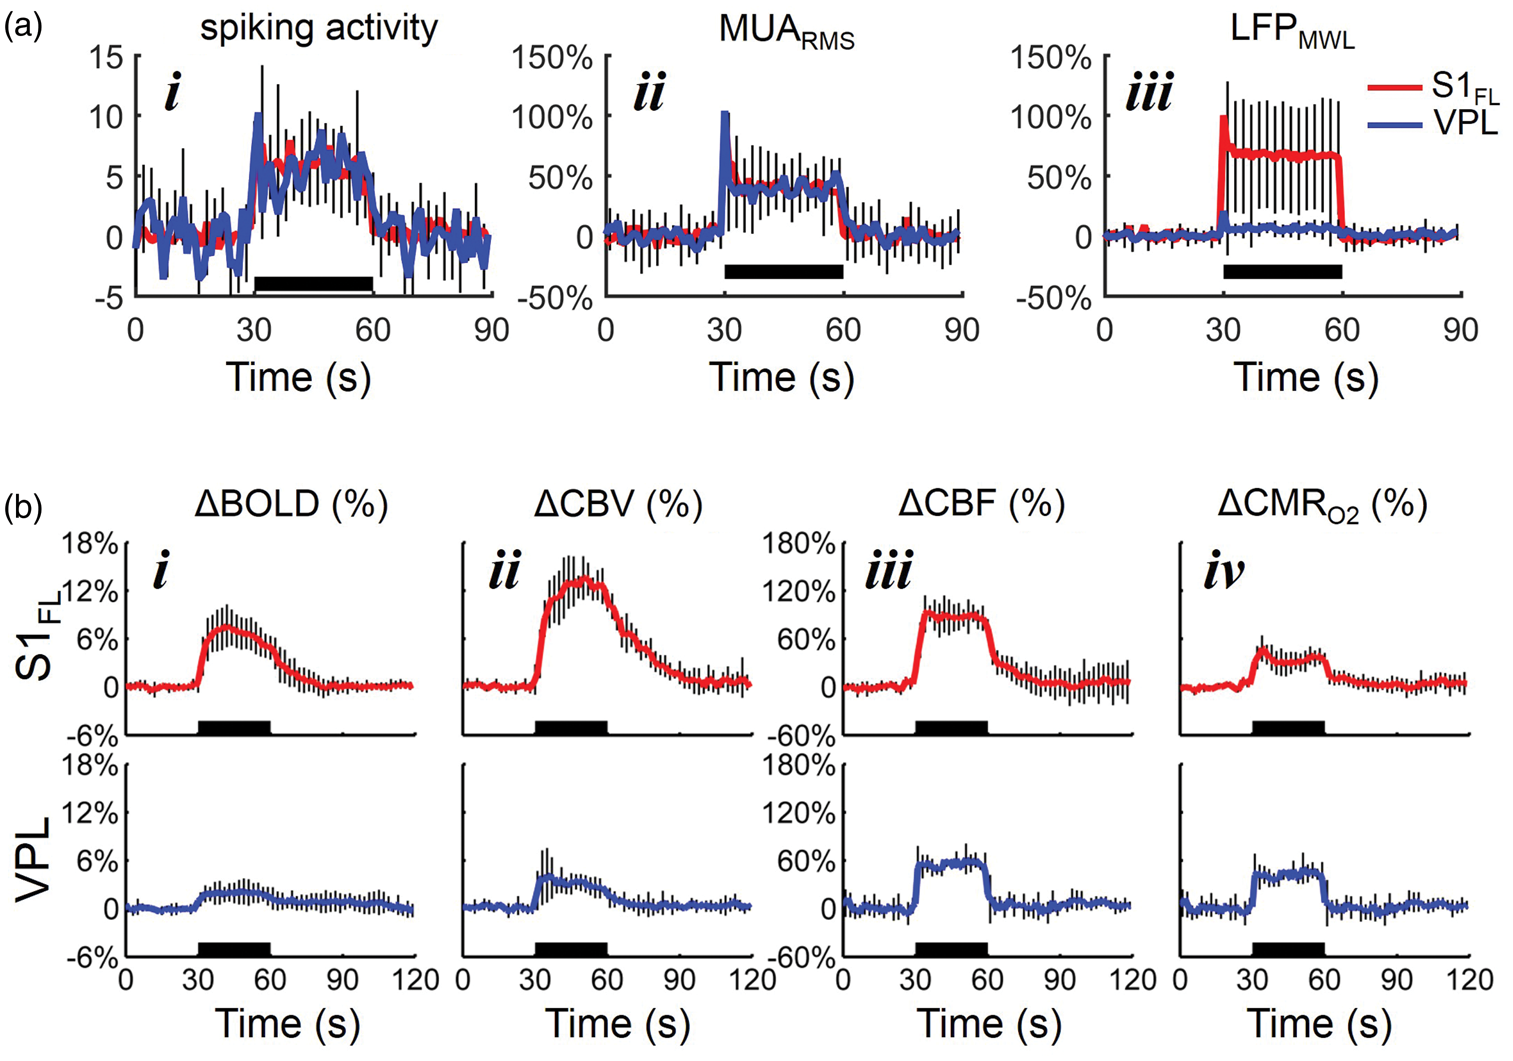
The dynamics of spike rate, relative MUA and LFP changes in S1FL (red) and VPL (blue) during forepaw stimulation (i.e. 30 s black horizontal lines) are shown in Figure 3(a). The relative spike rate change in each region was remarkably similar (S1FL 5.8 ± 4.1 Hz vs. VPL: 5.6 ± 1.5 Hz; Figure 3(a), i). The MUA responses (by RMS) were not significantly different either between S1FL and VPL (S1FL = 43.2 ± 27.2% vs. VPL = 41.3 ± 20.2%, p = 0.16; Figure 3(a), ii). Because the nature of raw LFPs at VPL were such that amplitudes of baseline and evoked LFPs were quite similar (Figure 1(b), ii), LFPs from both regions were extracted using a third-order Gaussian wavelet with continuous wavelet transform (LFPMWL). This analysis showed a significant difference in the magnitude of LFPMWL between S1FL and VPL (i.e. p < 0.001; Figure 3(a), iii).
In addition to the BOLD data (Figure 2), we also performed CBV experiments in the same rats. CBV-weighted fMRI, using long half-life and plasma-borne intravascular contrast agents, has become an attractive alternative to BOLD-weighted fMRI in animal models. 21 In both S1FL and VPL, the BOLD signal increase during forepaw stimulation period peaked 5–6 s after the stimulus onset and returned toward the baseline 8–10 s after the stimulus cessation (Figure 3(b), i). The magnitude of BOLD response in S1FL and VPL were 6.1 ± 2.1% and 1.9 ± 1.3%, respectively. Generally, the CBV responses were larger that the BOLD responses (Figure 3(b), ii) and BOLD and CBV magnitudes were significantly larger in S1FL compared with VPL (p < 0.001). We also found a similar pattern in CBV time courses with higher CBV amplitude in S1FL (12 ± 2.3%) than in VPL (5.3 ± 1.4%). CBV signals had similar rise time to BOLD signals, except that return to baseline had a much longer delay, as previously reported. 21 The characteristics of CBF responses, measured by LDF, were slightly different from the BOLD and CBV data (Figure 3(b), iii). Although there was a small difference in the magnitudes of CBF responses from S1FL (82.4 ± 16.8%) and VPL (53.3 ± 10.3%), it did not reach significance (p = 0.63). The time to peak of CBF responses in both S1FL and VPL were similar (3–3.5 s) and the return to baseline after the stimulus onset was much faster than BOLD or CBV time courses. The changes in CMRO2 in S1FL and VPL were estimated using the multimodal hemodynamic BOLD, CBF, and CBV data (Figure 3(b), iv). CMRO2 reached peak values within 4–5 s after the stimulation onset in both S1FL and VPL. Our observation of dynamic CMRO2 behavior during stimulation is similar to that observed with the CBF data, thereby demonstrating a tight CBF-CMRO2 dynamic coupling both at S1FL and VPL. The measured ΔCMRO2 values in S1FL and VPL were 34.1 ± 13.1% and 40.8 ± 11.7%, respectively, and were not significantly different from each other (p = 0.84). The ΔCMRO2 in S1FL during stimulation under α-chloralose anesthesia are consistent with our previous studies. 22
Neurovascular and neurometabolic couplings in S1FL and VPL
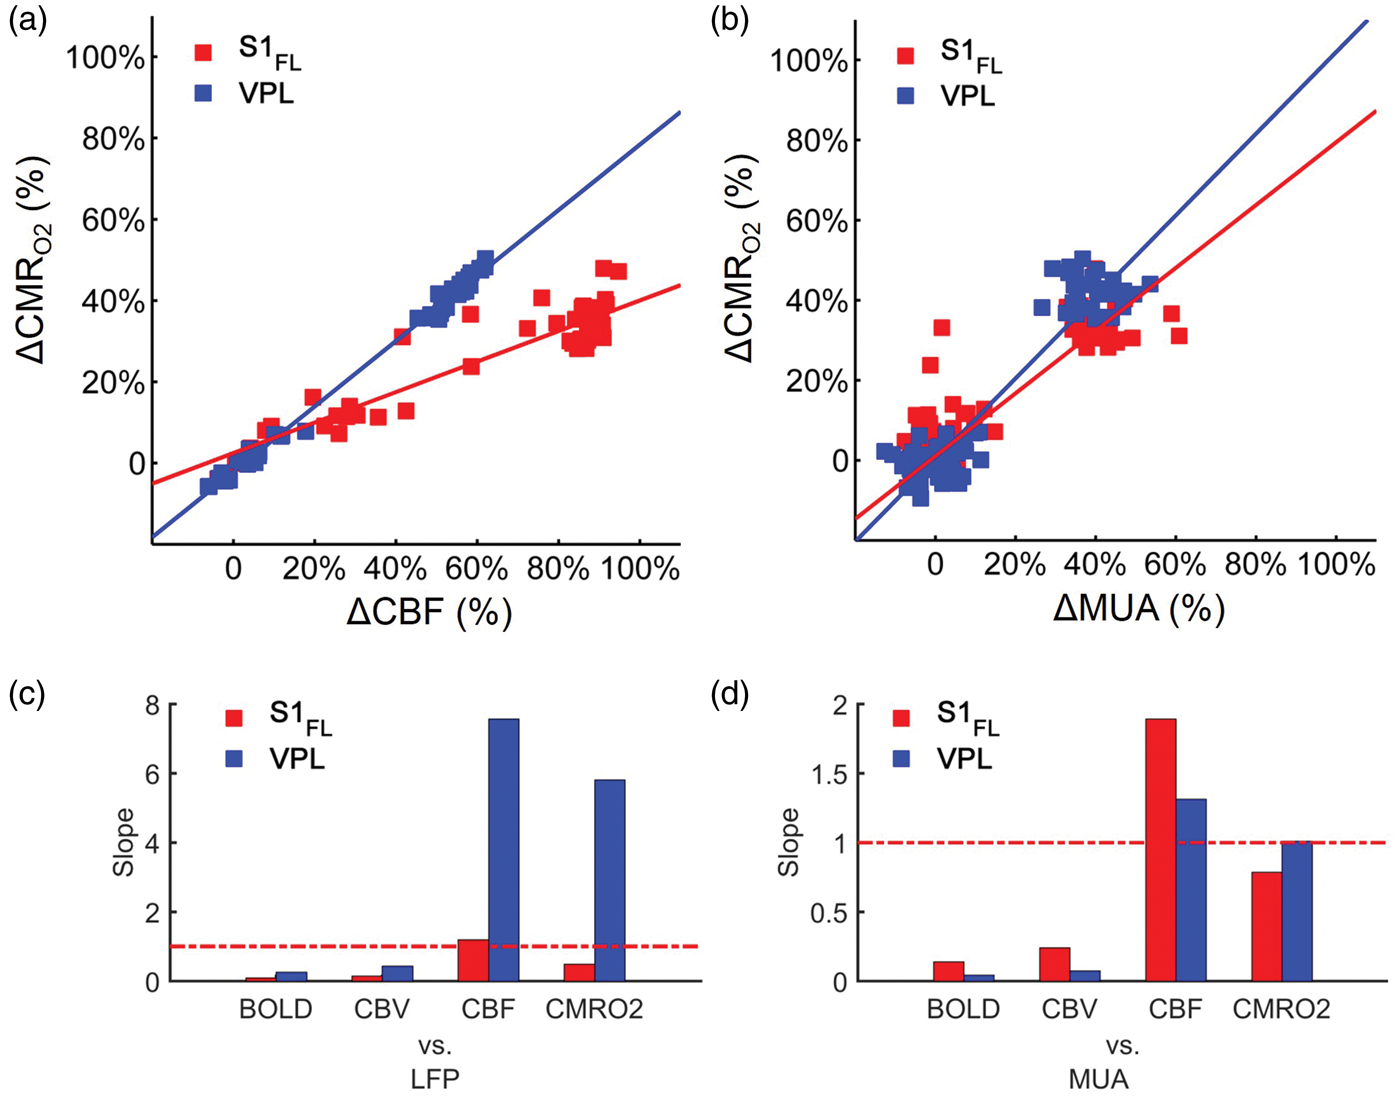
Figure 4 shows the relationships between the dynamic responses in S1FL and VPL with multi-modal recordings. The BOLD, CBV, and LFP responses were shifted away from the line of identity between these two regions due to a large difference in response magnitudes (Figure 4(a)). Although the CBF responses in S1FL were slightly larger than CBF responses in VPL (Figure 4(b)), the changes in MUA and CMRO2 between S1FL and VPL were quite comparable (Figure 4(b)). These suggest that MUA and CMRO2 were not only proportional both in S1FL and VPL, but the time courses were quite similar (Figure 3(a) and (b)). Overall, these results suggest that magnitudes of MUA, CBF, and CMRO2 across regions were quite comparable, whereas magnitudes of LFP, BOLD, and CBV across regions were significantly different. The correlation between CBF and CMRO2 data (Figure 5(a)) showed very tight flow-metabolism coupling in both regions (S1FL: r2 = 0.86, VPL: r2 = 0.99). But their degree of couplings were different, CMRO2 changes followed more closely CBF change in VPL (slope: 0.80) than in S1FL (slope: 0.37). Because LFP responses from VPL were significantly attenuated (compared with LFP responses from S1FL), we did not compare regional differences for LFP (Figure 3(a), iii). The correlation between MUA and CMRO2 data (Figure 5(b)) showed very tight and similar degree of neurometabolic coupling in both S1FL and VPL (S1FL: slope: 0.78, r2 = 0.79, VPL: slope: 1.02, r2 = 0.89). Since the slopes of hemodynamic (BOLD, CBV, CBF) signals vs. LFP and MUA (Figure 5(c) and (d)) were significantly deviated from the line of identity (slope = 1) both in S1FL and VPL, we conclude that change of MUA in cortex and thalamus follow the CMRO2 dynamics. Specifically, the CBF, BOLD, and CBV signals underestimated the neural activity in the thalamus relative to the cortex by 30 to 70%.
Responses from S1FL and VPL regions for (a) BOLD, CBV, and LFPMWL data as well as for (b) CBF, CMRO2, and MUA data, where the red lines indicate the line of identity. The data points in (a) and (b) were taken from 30 s stimulation period (Figure 3(a) and (b)). The BOLD and CBV responses from S1FL were about 5 times larger than the BOLD and CBV responses from VPL, while LFP response ratio was about 11. The CBF, CMRO2, and MUA responses from S1FL and VPL were quite comparable. Neurovascular and neurometabolic couplings in cortex and subcortex. The data points were taken from Figures 2 and 4(b) during 30 s stimulation period. Relationships between (a) CBF vs. CMRO2 and (b) MUA vs. CMRO2 in S1FL (red) and VPL (blue) regions. (a) Slopes of CBF vs. CMRO2 in S1FL and VPL were 0.37 (R2 = 0.86) and 0.80 (R2 = 0.99), respectively. (b) Slopes of MUA vs. CMRO2 in S1FL and VPL were 0.78 (R2 = 0.79) and 1.02 (R2 = 0.89), respectively. Correlations between neural activity (c: LFPMWL, d:MUA) vs. hemodynamic (BOLD, CBV, CBF), and metabolic (CMRO2) responses from S1FL (red) and VPL (blue) regions are shown with respect to the slope of the plot between neural activity vs. the other signal, indicating that the agreements between cortical LFP and CBF and MUA and CMRO2 are best (the red horizontal dotted line represents the line of identity or perfect correlation). The R2 of these plots were better than 0.6.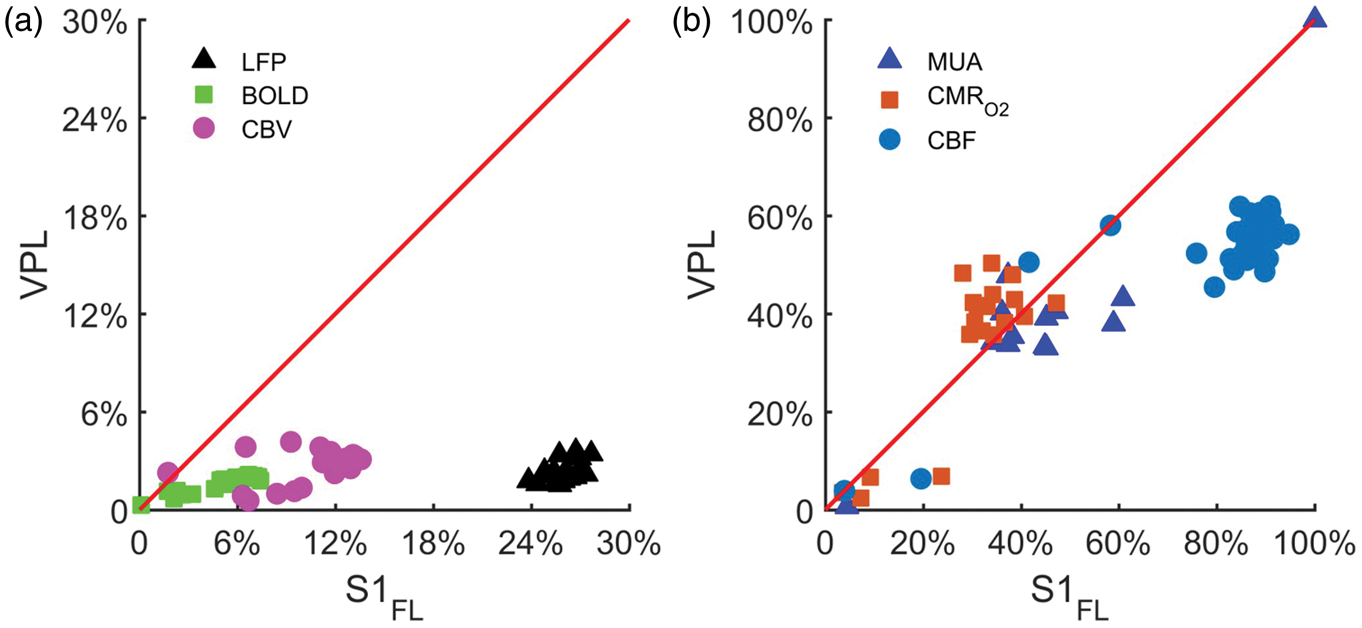
Discussion
Combined fMRI and electrophysiology studies in the last decade have revealed neural-BOLD associated and dissociated areas, and to a large extent, these observations have been rationalized on the basis of both vascular- and circuitry-based differences.3–5 Given the complex nature of the BOLD response, we sought to examine whether neural-hemodynamic associated and dissociated areas have different metabolic demands. Based on the neuroanatomy of the thalamic nuclei and thalamocortical projections, we focused on the VPL which corresponds to S1FL so that multi-modal evoked responses could be compared with the same sensory stimuli. 23 Briefly, we found that BOLD and CBV responses were markedly greater in S1FL than in VPL. While CBF, CMRO2, and MUA responses were comparable between regions (i.e. S1FL ≈ VPL), BOLD, CBV, and LFP responses behaved similarly across regions (i.e. S1FL ≫ VPL). These complex multi-modal and multi-regional results illustrate and highlight that calibrated fMRI in conjunction with electrophysiology may help to distinguish between BOLD-LFP-MUA associated and dissociated areas in the brain.
Regional differences of neurophysiological responses
We observed marked regional differences in neural responses between VPL and S1 FL to the same sensory stimuli. We observed a ∼4 ms delay in neural responses between VPL and S1FL, which is consistent with previous findings that show latencies differ across different sensory modalities 18 (Figure 1). By comparing regional heterogeneity between LFP and MUA recordings, we found that MUA displayed the same relationship to the stimuli for both regions, whereas LFP responses in VPL exhibited marked differences from LFP responses in S1FL. In relation to the laminar origination of cortical pyramidal neurons, 24 the non-laminar morphology of thalamic neurons are expected to generate different type of neural activity patterns. 25
LFPs have been extensively studied in the cerebral cortex, where pyramidal cells having long apical dendrites running perpendicular to the cortical surface generate relatively strong field potentials. 9 LFPs reflect a whole population of excitatory or inhibitory postsynaptic potentials as well as a number of integrative processes, including somatic and dendritic potentials with their ensuing after potentials and voltage-dependent membrane oscillations. Spiking activity occurs when the membrane potential reaches threshold by depolarization, which is in turn determined by the incoming postsynaptic potentials, whether excitatory or inhibitory. LFPs in the thalamic nuclei have not been widely reported because the morphology of thalamic neurons and their non-laminar organization generate relatively closed field or small field potentials. 26 Hence, evoked neural responses from thalamic nuclei are generally reported with MUA recordings.
Earlier electrophysiological studies suggest the potential for spatial uncoupling between LFP and MUA.11,27 Using electrode arrays oriented in either vertical or horizontal directions of the cerebral cortex, the results suggest that LFP spreads much farther than the MUA because of “volume-conducted” field potentials across far distances, 27 thus making LFP sensitive to global activity whereas MUA based signal seems more localized. Laminar microelectrode measurements of LFP and MUA in the somatosensory areas showed a dissociation between LFP and MUA across cortical layers. LFP and MUA were mismatched in the superficial layers, 11 presumably to the presence of different neuronal cell types and density across cortical layers. Similarly, the regional LFP vs. MUA differences found in this study were attributed to dissimilarities in synaptic current summation of thalamic vs. pyramidal cells.
MUA and LFP result from the dynamic interaction of various synaptic and cellular mechanisms, the former reflecting primarily the output of neurons within a few hundred microns from the microelectrode tip and the latter mostly a weighted average of synchronized dendrosomatic components of the input signals to neurons within 0.5–1.5 mm from the electrode tip. 28 Thus, MUA and LFP contributions to the BOLD signal could be the result of differences in spatial summation of these neural signals.
Regional differences of neuroimaging responses
We found a substantial difference in the magnitudes of the BOLD and CBV responses between S1FL and VPL (Figure 3), where even the smallest BOLD response from the lower cortical layers were significantly larger than BOLD responses from different thalamic nuclei (Figure 2). These regional differences in BOLD and CBV results are consistent with previous studies.19,20 To investigate whether the larger BOLD and CBV responses in cortex as compared with thalamus indicate greater change in metabolism, we examined the metabolic change with calibrated fMRI (Figure 3). Interestingly, CBF responses, while they were slightly greater in S1FL than in VPL, did not show the same extent of regional differences as BOLD/CBV signals. Previous studies using 131I-iodoantipyrine autoradiography observed similar CBF changes in thalamus as compared with whisker barrel cortex.
29
In other words, the CBF-CBV relationship, given by Grubb’s equation below, is significantly different in S1FL and VPL,

Using multi-modal BOLD, CBF, and CBV recordings from in S1FL and VPL, we were able to calculate CMRO2 responses using equation (1) (Figure 3). The CMRO2 responses, while they were slightly greater in VPL than in S1FL, did not show the same extent of regional differences as BOLD/CBV signals. Regional variation of CMRO2 across areas depends on the different neuronal populations and their local glucose demands.30,31 Recent 13C magnetic resonance spectroscopy studies in urethane-anesthetized and awake rodents showed that the contribution of GABA to neurotransmission were similar in cortical and thalamic regions, but the glutamatergic neurotransmission was just slightly higher in the cerebral cortex relative to the thalamus. Our observation of comparable CMRO2 changes in VPL and S1FL (Figure 3) are consistent with previous studies that have reported significant glucose metabolic (CMRglc) changes in both cortical and thalamic regions in the anesthetized rat.29,30
Relation between neurophysiological and neuroimaging responses
The translational potential of fMRI is the motivation behind investigating the underlying neurophysiological signals, where both LFP and MUA are used1,14,20,32 to establish correlations between BOLD and neural activity. We found that the MUA responses were almost identical in S1FL and VPL (Figure 3(a), i–ii), but the LFP responses were much weaker in VPL (Figure 3(a), iii). Considering that BOLD responses were significantly different in S1FL and VPL (Figure 2(c), i–iii), the same transfer function cannot be convolved on both MUA signals to get the different BOLD responses. The regional trends of LFP and BOLD responses (i.e. larger in cortex and smaller in thalamus) are closer to each other and potentially the cortical LFP signal may be used to estimate the BOLD transfer function. However, the fact that the LFP in VPL is much weaker (compared with the cortical LFP) should raise serious concerns about use of the LFP-derived BOLD transfer function. Similar analogies between regional neural responses and CBV can be made.
Considering that the LFP spreads larger distances than the MUA because of volume-conduction principles, 27 the LFP may follow the MUA, but it may also include activities from distal regions. Therefore, the point-spread functions in the rat somatosensory cortex for LFP and BOLD are more comparable than point-spread functions for MUA and BOLD, 11 which agrees with observations in the primate visual cortex that the correlation is slightly better for BOLD vs. LFP (r2 ∼ 0.52) than BOLD vs. MUA (r2 ∼ 0.45). 1 This potential spatial uncoupling between LFP and MUA is more prominent in VPL, where the very local evoked LFPs are not easily distinguishable over the global background LFP activity (Figure 1(b), ii), while the local MUA changes in VPL are similar that of S1FL.
Previous studies also found that not all brain structures obeyed the linear neurovascular coupling relationships.2,3,5 Devonshire et al. studies found MUA could always be predicted from BOLD signals in a positive linear fashion, whereas LFP was only positively linearly related to BOLD signals in the cortex. 3 Similarly, Mathiesen et al. studies stimulated the parallel fibers of cerebellum while recording purkinje cell activity and observed stronger dissociation between spiking activity and the hemodynamic responses. They observed LFPs and CBF may increase at the same time that spiking activity ceases.2,33 Similar LFP-MUA dissociation was also reported in the cortex of rats and cats in studies directly measuring neural activity and tissue oxygenation at a high spatiotemporal resolution.5,11 Recent calibrated fMRI and electrophysiology measurements, similar to this study, showed that both LFP and CBF were uniform across cortical lamina, whereas MUA and CMRO2 were smaller mainly in the superficial lamina. 11 Similarly, in this study, we found regional coupling between MUA and CMRO2 in cortical and subcortical regions. Therefore, dissociation between LFP and MUA usually speaks to the relative contribution of these signals to the BOLD signal, and which in turn is related varying neurovascular (i.e. LFP vs CBF) and neurometabolic (i.e. MUA vs CMRO2) couplings across regions. The strong recurrent excitatory and inhibitory loops of the typical cortical/subcortical microcircuit predict correlations between these signals, each of which may then be also correlated with the local BOLD signal levels.
Previous fMRI and electrophysiological studies investigated neurovascular and neurometabolic couplings in cortical areas11,13,34,35 as well as non-cortical structures such as thalamus, hippocampus, basal ganglia, and brainstem.3,14,36,37 A review by Ekstrom has been suggested that certain brain regions may vary in nature, not lend themselves to producing robust BOLD response. 36 This can be due to their poor blood supply or their vasculature being relatively unreactive, either of which would result in the demand for nutrients exceeding the supply and a resultant BOLD response that is either weak, absent or negative. 36 Although neural and vascular densities co-vary in the brain, 38 there are metabolic and neural density differences between different brain regions that could impact the regulation of blood flow. With respect to our present findings of lower BOLD and CBV responses in the thalamus as compared with cortex, also reported by others,3,39 we support that thalamus has indeed different neurovascular regulations that of the cortex; however, capillary densities in the thalamus are similar or slightly higher to cortical structures,9,10 which can be the reason of higher basal thalamic blood flow. Note however that higher baseline flow usually means lower functional responses. 22 Earlier CBF responses recorded using iodoantipyrene autoradiography showed similar increase in CBF to sensory stimulation at both thalamus and whisker barrel cortex. 29 Even in humans similar CBF responses in cortical and thalamic areas are observed. 40 Similar studies performed earlier in relation to neurovascular couplings in rat whisker barrel cortex and VPM. 3 Although these past studies shed light on further understanding neurovascular relationships in cortical and thalamic regions, they lacked metabolic information. In our study, we measured all of the neuroimaging signals (BOLD, CBV, CBF) and neurophysiological (LFP, MUA) signals to understand neurovascular and neurometabolic features of differences in BOLD responses typically reported for cortical and thalamic areas.
Limitations of the current study design
A limitation of this study is that neurophysiological and neuroimaging experiments were conducted in separate groups of rats. Because the evoked responses are quite reproducible across subjects for this sensory paradigm, the grouped results could be compared as shown previously. 11 While simultaneous fMRI and low impedance microelectrode recordings (of LFP) have been achieved before, 37 significant MRI artifacts at high magnetic fields induced precisely at the location of the high impedance microelectrodes (needed for MUA and LFP) prevented simultaneous fMRI and neural recordings. Since the goal of this study was to study the energetic demands of areas with dissociation/association between MUA and LFP, we opted not to conduct simultaneous fMRI and electrophysiology measurements with low impedance microelectrodes.
A large body of literature reported fMRI and neurophysiological results with the same anesthesia (i.e. α-chloralose) conditions to investigate the coupling between BOLD and neural responses20,22 and evoked neural latencies between cortical and thalamic regions. 18 The neural recordings from the cortex were mainly confined to the middle layer of S1FL so that cortical inputs from VPL could be specifically compared with the same stimuli. Future studies could be conducted to relate other thalamic nuclei to different cortical layers/regions using microelectrode arrays.
Conclusions
Regional differences in neurovascular and neurometabolic coupling mechanism have received less attention to date, but have far reaching implications for the interpretation of fMRI data. We have shown that the relationship between neural and fMRI response is not constant between cortex and subcortex, suggesting that fMRI response cannot be taken as even a relative measure of the underlying neural activity when comparing different anatomical regions, unless calibrated fMRI measurements of Δ CMRO2 are obtained. Results from these current studies further enhance our understanding of neurological clinical conditions where the neurovascular and neurometabolic couplings are known to be disturbed and can be probed with calibrated fMRI.
Footnotes
Funding
The author(s) disclosed receipt of the following financial support for the research, authorship, and/or publication of this article: This work was supported by National Institutes of Health Grants R21 NS083783 (to HB), R01 NS-066974 (to HB), R01 NS-087568 (to DLR), R01 MH-067528 (to FH), and P30 NS-052519 (to FH).
Acknowledgements
The authors specially thank colleagues at MRRC (mrrc.yale.edu), Core Center for QNMR (qnmr.yale.edu), and Bei Wang for surgical and for technical assistance. BGS acknowledges Krish Sanganahalli for motivation.
Declaration of conflicting interests
The author(s) declared no potential conflicts of interest with respect to the research, authorship, and/or publication of this article.
Authors' contributions
All authors have made substantial contributions to the manuscript. BGS, PH, and FH conceived, designed, and performed research. BGS, PH, and FH analyzed and interpreted the data, performed statistical analysis, and drafted the manuscript. BGS, PH, DLR, HB, and FH wrote the article.