
Abstract
Neurofibrillary tangles (NFTs), composed of aggregated tau protein, in the brain is a neuropathological hallmark and feature of Alzheimer’s disease (AD) and other tauopathies. One promising approach to prevent tau aggregates is to inhibit O-GlcNAcase (OGA), an enzyme that regulates tau O-GlcNAcylation. [11C]BIO-1819578 has emerged as a promising candidate to determine target occupancy of such OGA inhibitor drugs. The aim of this study was to further evaluate the pharmacokinetic properties of [11C]BIO-1819578 in non-human primates (NHPs) and to estimate its effective dose. Kinetic compartment analyses of [11C]BIO-1819578 binding to OGA in the brain were performed on positron emission tomography (PET) measurements conducted in three cynomolgus NHPs. Whole-body PET measurements were carried out in two NHPs to estimate the effective radiation dose. Both the 1-tissue-compartment (1TCM) and 2-tissue-compartment model (2TCM) could describe the regional time activity curves of [11C]BIO-1819578. The 2TCM was the statistically preferred model. The effective radiation dose was estimated to be 0.0033 mSv/MBq. The results showed that [11C]BIO-1819578 has suitable characteristics for reliable quantification of OGA using full kinetic modelling. The effective dose was on par with other 11C radioligands and is unlikely to pose an issue for human use.
Introduction
The presence of neurofibrillary tangles (NFTs) in the brain is one of the neuropathological hallmarks of Alzheimer’s disease (AD). These intraneuronal tangles contain fibrillary structures that are formed by the aggregation of hyperphosphorylated microtubular-associated tau protein. 1 An increase in intracellular tau aggregates is highly linked to more severe disease states of AD and other tauopathies. 2 These observations have encouraged efforts to develop treatment approaches that can slow down or prevent the formation of pathological tau.3,4 Diverse therapeutic strategies have been proposed to reduce tau expression or inhibit the formation of tau aggregates. 5
In relevant tau transgenic mouse models, inhibition of O-GlcNAcase (OGA) to increase O-GlcNAcylation in the brain has been shown to protect against pathological tau6 –8 and several selective OGA inhibitor drugs have entered clinical trials.9 –11 A handful of positron emission tomography (PET) radioligands have been developed for OGA,12 –15 such tools are not only useful to quantify OGA levels in the living brain but are also instrumental for the direct measurement of OGA level of engagement by drug candidates entering clinical development to establish the relationship between blood concentration and target occupancy. 16 Understanding the extent to which OGA inhibitors bind to their target is pivotal in selecting a dose and a dose regiment that maximize efficacy and minimize potential side effects, ultimately guiding clinical development decision-making and patient care. 17
Among these PET radioligands, BIO-1819578 emerged as a promising high affinity OGA inhibitor candidate (Kd = 2.3 nM). 15 As previously reported BIO-1819578, was radiolabelled with 11C either using [11C]CH3I at the methyl position 15 and using [11C]CO at the amide group 18 in our laboratory. Considering the higher radiochemical yield and promising pilot results showing favourable brain kinetics and specificity, the [11C]CO labelling synthon was selected for further investigations of [11C]BIO-1819578 18 in the NHP reported in this paper.
To date, no kinetic compartment analysis of [11C]BIO-1819578 has been performed using a radiometabolite corrected arterial plasma input function. As OGA is expressed in blood cells, full quantification using a metabolite corrected input function is required for valid quantification. The primary objective of the present analysis was to describe and interpret [11C]BIO-1819578 kinetics in the NHP brain under baseline condition and post administration Thiamet-G at a dose known to significantly engage OGA. 13 The secondary objective was to determine the effective radiation dose of [11C]BIO-1819578 in NHPs, thereby paving the way for safe human use. The results from this study are intended to provide the foundation for further evaluation in human studies. The future aims are to assess the quantification and test-retest reproducibility in humans to support further use in assessing novel disease modifying therapies directed towards OGA activity.
Materials & method
The study was approved by the Animal Ethics Committee of the Swedish Animal Welfare Agency (Dnr 10367-2019) and was performed according to “Guidelines for planning, conducting and documenting experimental research” (Dnr 4820/06-600) of Karolinska Institutet. The NHPs were housed in the Astrid Fagraeus Laboratory (AFL), Comparative Medicine, Karolinska Institutet, Solna, Sweden. AFL is accredited by the organisation AAALAC International for its high quality in animal welfare. The research conducted and the reporting which follows is compliant with ARRIVE guidelines.
The present compartment analysis of regional [11C]BIO-1819578 binding in NHPs was partly based on data obtained in a previously published PET study. 18 The following is a short description of the sample and imaging procedure in the present and previous study.
Radioligand synthesis
[11C]BIO-1819578 was synthesized and formulated as reported previously. 18 The synthesis of [11C]-carbonmonoxide ([11C]CO) was performed using a modified method from previous literature. 19 No carrier-added [11C]CO2 was produced by bombarding a mixture of nitrogen and 0.5% oxygen gas with 16.5 MeV protons via the 14 N(p,α)11C nuclear reaction. [11C]BIO-1819578 was synthesized by trapping [11C]CO at room temperature in a reaction vessel containing the amine precursor (BIO-1952489, 2 mg), methyl palladium(II) chloride complex (8.0 mg), and XantPhos (12 mg) in 400 µL of THF, followed by heating at 110 °C for 400 seconds. After synthesis, 500 µL of DMSO was added, and THF was evaporated using a helium flow. The resulting residue was diluted with 2 mL of sterile water before injected into an HPLC for purification, using a semi-preparative reverse phase ACE column. The desired product [11C]BIO-1819578 was eluted with a retention time of 10–11 minutes, diluted with 50 mL sterile water, and passed through a preconditioned SepPak tC18 plus cartridge for isolation. Finally, the product was eluted with ethanol into a sterile vial, sterile filtered, and the radiochemical purity and stability were assessed using analytical HPLC, confirming the identity of the radiolabeled compound through co-injection with an authentic reference standard.
The molar activity of the produced radioligand was 17 ± 6 GBq/μmol (range, 9–29 GBq/µmol) at the time of injection to NHP. The radiochemical purity was >99% at the end of the synthesis. The final product [11C]BIO-1819578 formulated in sterile saline was found to be stable with a radiochemical purity of more than 99% for up to 60 min.
Subjects
For regional brain quantification of [11C]BIO-1819578 data obtained from three adult NHPs, two males and one female cynomolgus monkey, were used (average weight 7.5 kg, range: 7.2–8.2 kg).
For the dosimetry study two NHPs, one male (also included in the brain studies) and one female, were used (average weight 5.9 kg, range: 5.3–6.5 kg).
Drug administration
For the baseline-pretreatment study in one of the three NHPs Thiamet-G was administered intravenously for a duration of 5 minutes, 45 minutes prior to PET start, with a dose of 10 mg/kg and a volume of 1.0 ml/kg. Pharmacokinetic samples, for venous plasma drug concentration, were acquired at -1-, 1-, 15- and 45-minutes relative the Thiamet-G administration.
Acquisitions
PET imaging was performed on the High Resolution Research Tomograph (HRRT, CTI/Siemens Medical Solutions). List-mode data was reconstructed with 3 D-OSEM with point spread function correction using 10 iterations and 16 subsets, with isotropic voxels of 1.22 mm using a matrix size of 256 ×256 × 207.
Brain PET measurement
Anaesthesia was induced in the NHPs via intramuscular injection of ketamine (10 mg/kg) and maintained through the administration of a mixture of sevoflurane, oxygen, and medical air with endotracheal intubation. Throughout the PET measurements, the animals’ body temperature, ECG, heart rate, respiratory rate, oxygen saturation, and blood pressure were continuously monitored.
For brain PET experiments the NHP head was immobilized during the entire PET measurement using a specifically designed head fixation device. Prior to PET acquisition, a 6-minute 137Cs transmission scan was performed for attenuation and scatter correction purposes. Following an intravenous 10 s bolus-injection of [11C]BIO-1819578 (83 ± 5 MBq, 2.0 ± 1.0 µg), list-mode data was then acquired dynamically over a total of 93 minutes and reconstructed into 38 frames (10 s × 9, 15 s × 2, 20 s × 3, 30 s × 4, 1 min × 4, 3 min × 4, 6 min × 12).
A total of six PET scans were conducted, with five at baseline condition and one in a pretreatment setting. Four baseline PET scans were performed in two NHPs and served as a test-retest evaluation of [11C]BIO-1819578.
Dosimetry - Whole body PET measurements
Anaesthesia preparations and 137Cs transmission scans were performed in the same manner as for the Brain PET measurements. For each NHP, two PET scans were performed on the same day, each with separate radioligand injections. One scan covered the head to the abdomen (PET scan 1), while the other covered the abdomen to the groin (PET scan 2), to estimate the biodistribution throughout the entire body of the NHP. List-mode data of [11C]BIO-1819578 was acquired dynamically over a total of 123 minutes and the 4 D PET data images were reconstructed in 26 frames (1 min × 3, 3 min × 6, 6 min × 17).
The mean injected radioactivity of [11C]BIO-1819578 was 80 MBq (PET scan 1: 79 MBq, PET scan 2: 81 MBq) and 81 MBq (PET scan 1: 81 MBq, PET scan 2: 81 MBq) for the two NHPs, respectively. The mean molar activity was 19.6 GBq/μmol (PET scan 1: 14.7 GBq/µmol, PET scan 2:24.5 GBq/μmol) and 13.4 GBq/μmol (PET scan 1: 13.1 GBq/µmol, PET scan 2: 13.6 GBq/μmol), respectively, and the mean injected mass was 1.6 μg (PET scan 1: 1.2 µg, PET scan 2: 2.0 μg) and 2.2 μg (PET scan 1: 2.2 µg, PET scan 2: 2.2 μg), respectively.
MRI measurements
T1-weighted MR imaging was performed on a 1.5-T GE Signa system (General Electric, Milwaukee, WI, USA) using a 3 D spoiled gradient echo protocol with the following settings: repetition time 21 ms, flip angle 35°; FOV 12.8 cm; matrix 256 × 256 × 128; 1.0 mm slice thickness; 2 number of excitations.
Arterial blood sampling
Arterial blood was sampled and measured for radioactivity continuously at a speed of 3 ml/min for the first 3 minutes of scanning using an Allogg AB automatic blood sampling machine. Discrete samples were acquired for metabolite and radioactivity measurements at 1, 1.5, 2, 2.5, 3, 5, 15, 30, 60, 75 and 90 minutes post radiotracer administration.
Analyses
Radiometabolite analysis
A reverse-phase high-performance liquid chromatography (HPLC) coupled with ultraviolet (254 nm) and radioactivity detection was used for determination of the percentages of radioactivity corresponding to [11C]BIO-1819578 and its radioactive metabolites during the course of PET measurement, as reported previously.18,20 Arterial plasma samples, obtained at 2, 5, 15, 30, 60, and 75 minutes post-injection, were extracted with acetonitrile to precipitate proteins. Following dilution with water, the extract was injected onto an ACE 5 μm C18 HL column (250 × 10 mm). Analytes were separated by gradient elution at a flow rate of 5.0 mL/min, using acetonitrile (A) and 0.1 M ammonium formate (B) as the mobile phases. The gradient program was as follows: 0 − 4.0 min, (A/B) 40:60 → 90:10 v/v; 4.0 − 6.0 min, (A/B) 90:10 v/v. The fraction of total radioactivity corresponding to the parent radioligand, [11C]BIO-1819578, was determined by integrating the area under its chromatographic peak and expressing it as a percentage of the total integrated area of all detected radioactive species.
Radiometabolite-corrected arterial plasma radioactivity curve
As complete data were not available in all cases due to low signal-to-noise ratio in the radiometabolite analysis, the individual parent fraction estimates were calculated using the Richards function 21 and a Bayesian population-aided approach. The individual plasma samples and parent fraction estimates were combined to create the radiometabolite-corrected arterial plasma radioactivity curve.
Protein binding
Using an ultrafiltration method, 20 the free fraction (fp) of [11C]BIO-1819578 in plasma was determined for the regional brain quantification study.
Brain image analysis
The image data were analysed using MatLab 2014 b (Natick, Massachusetts: The MathWorks Inc.) and an in-house imaging analysis pipeline that performed the kinetic and graphical analysis. The volumes of interest were manually drawn on the T1w MR images for each NHP for whole brain and the regional regions: Putamen, Caudate, Frontal Cortex, Occipital Cortex, Hippocampus, Cerebellum, Thalamus. The coregistration of PET data to MR images was performed using SPM12 (http://fil.ion.ucl.ac.uk/spm/). The coregistered volumes were applied to the PET data outside of SPM12 to generate time-activity curves of brain regions for each dynamic PET dataset.
Kinetic compartment analysis
The analysis included the 1-tissue compartment model (1TCM) and the 2-tissue compartment model (2TCM). 22 The radiometabolite-corrected arterial plasma radioactivity curve was used as input function. The cerebral blood volume (CBV) was fitted using the 2TCM and then applied across all brain regions. As the primary outcome measure, the total distribution volume (VT) was calculated. For the 1TCM, VT was defined as K1/k2, while for the 2TCM, it was calculated as K1/k2 × (1 + k3/k4). The goodness of fit was determined using the second-order corrected Akaike information criteria (AICc). 23 Time stability of VT was estimated using 2TCM; It was estimated across brain regions during baseline experiments by iteratively calculating VT from progressively shortened time series data.
Graphical analysis
The Ichise Multilinear Analysis MA1 24 was also used, as it has been proposed as a reliable graphical modelling approach with improved stability in noisy data compared to other graphical approaches such as Logan graphical analysis, to estimate VT with t* set to 30 minutes, chosen since it provided good fit for all included regions. The coefficient of determination was calculated between VT values from 2TCM and MA1.
Test-retest variability
The test-retest variability for each region was calculated as:
Parametric imaging
Wavelet-aided parametric imaging (WAPI) 26 was used to generate parametric images of [11C]BIO-1819578 VT estimates. WAPI employs wavelet filtering to reduce noise and improve the signal-to-noise ratio before applying the Logan’s graphical approach.
Occupancy estimation after pretreatment with Thiamet-G
Using the revisited Lassen plot, 27 occupancy was estimated after pretreatment with Thiamet-G.
Image analysis of the Whole-Body PET
The whole-body PET image data were analysed using PMOD, version 4.2 (PMOD Technologies LLC). Volumes of interest were drawn on high-uptake organs such as the brain, lung, heart, salivary gland, thyroid, kidney, spleen, liver, gallbladder (only in one NHP), urinary bladder, small intestine, bone (lumbar vertebrae) with the help of the CT images for anatomic landmarks. The absorbed radiation dose in humans was predicted with OLINDA/EXM 1.1 software, using the sex average adult reference model. 28
Results
Brain PET data
All together five baseline PET-measurements were performed in the three NHPs. The time-activity curves for the whole brain peaked at approximately 4.4 SUV on average around 15 minutes post radioligand injection and then decreased to around 3.3 SUV at 90 minutes under baseline conditions. Average regional uptake curves at baseline (n = 5) are presented in Supplemental Figure 1; Regional brain uptake generally peaked at 5–15 minutes post-injection. Figure 1 shows regional time-activity curves in the baseline and pretreatment conditions for NHP 3. Parametric VT images from NHP 3 are shown in Figure 2, demonstrating that pretreatment with Thiamet-G reduced the distribution volume in all brain regions.
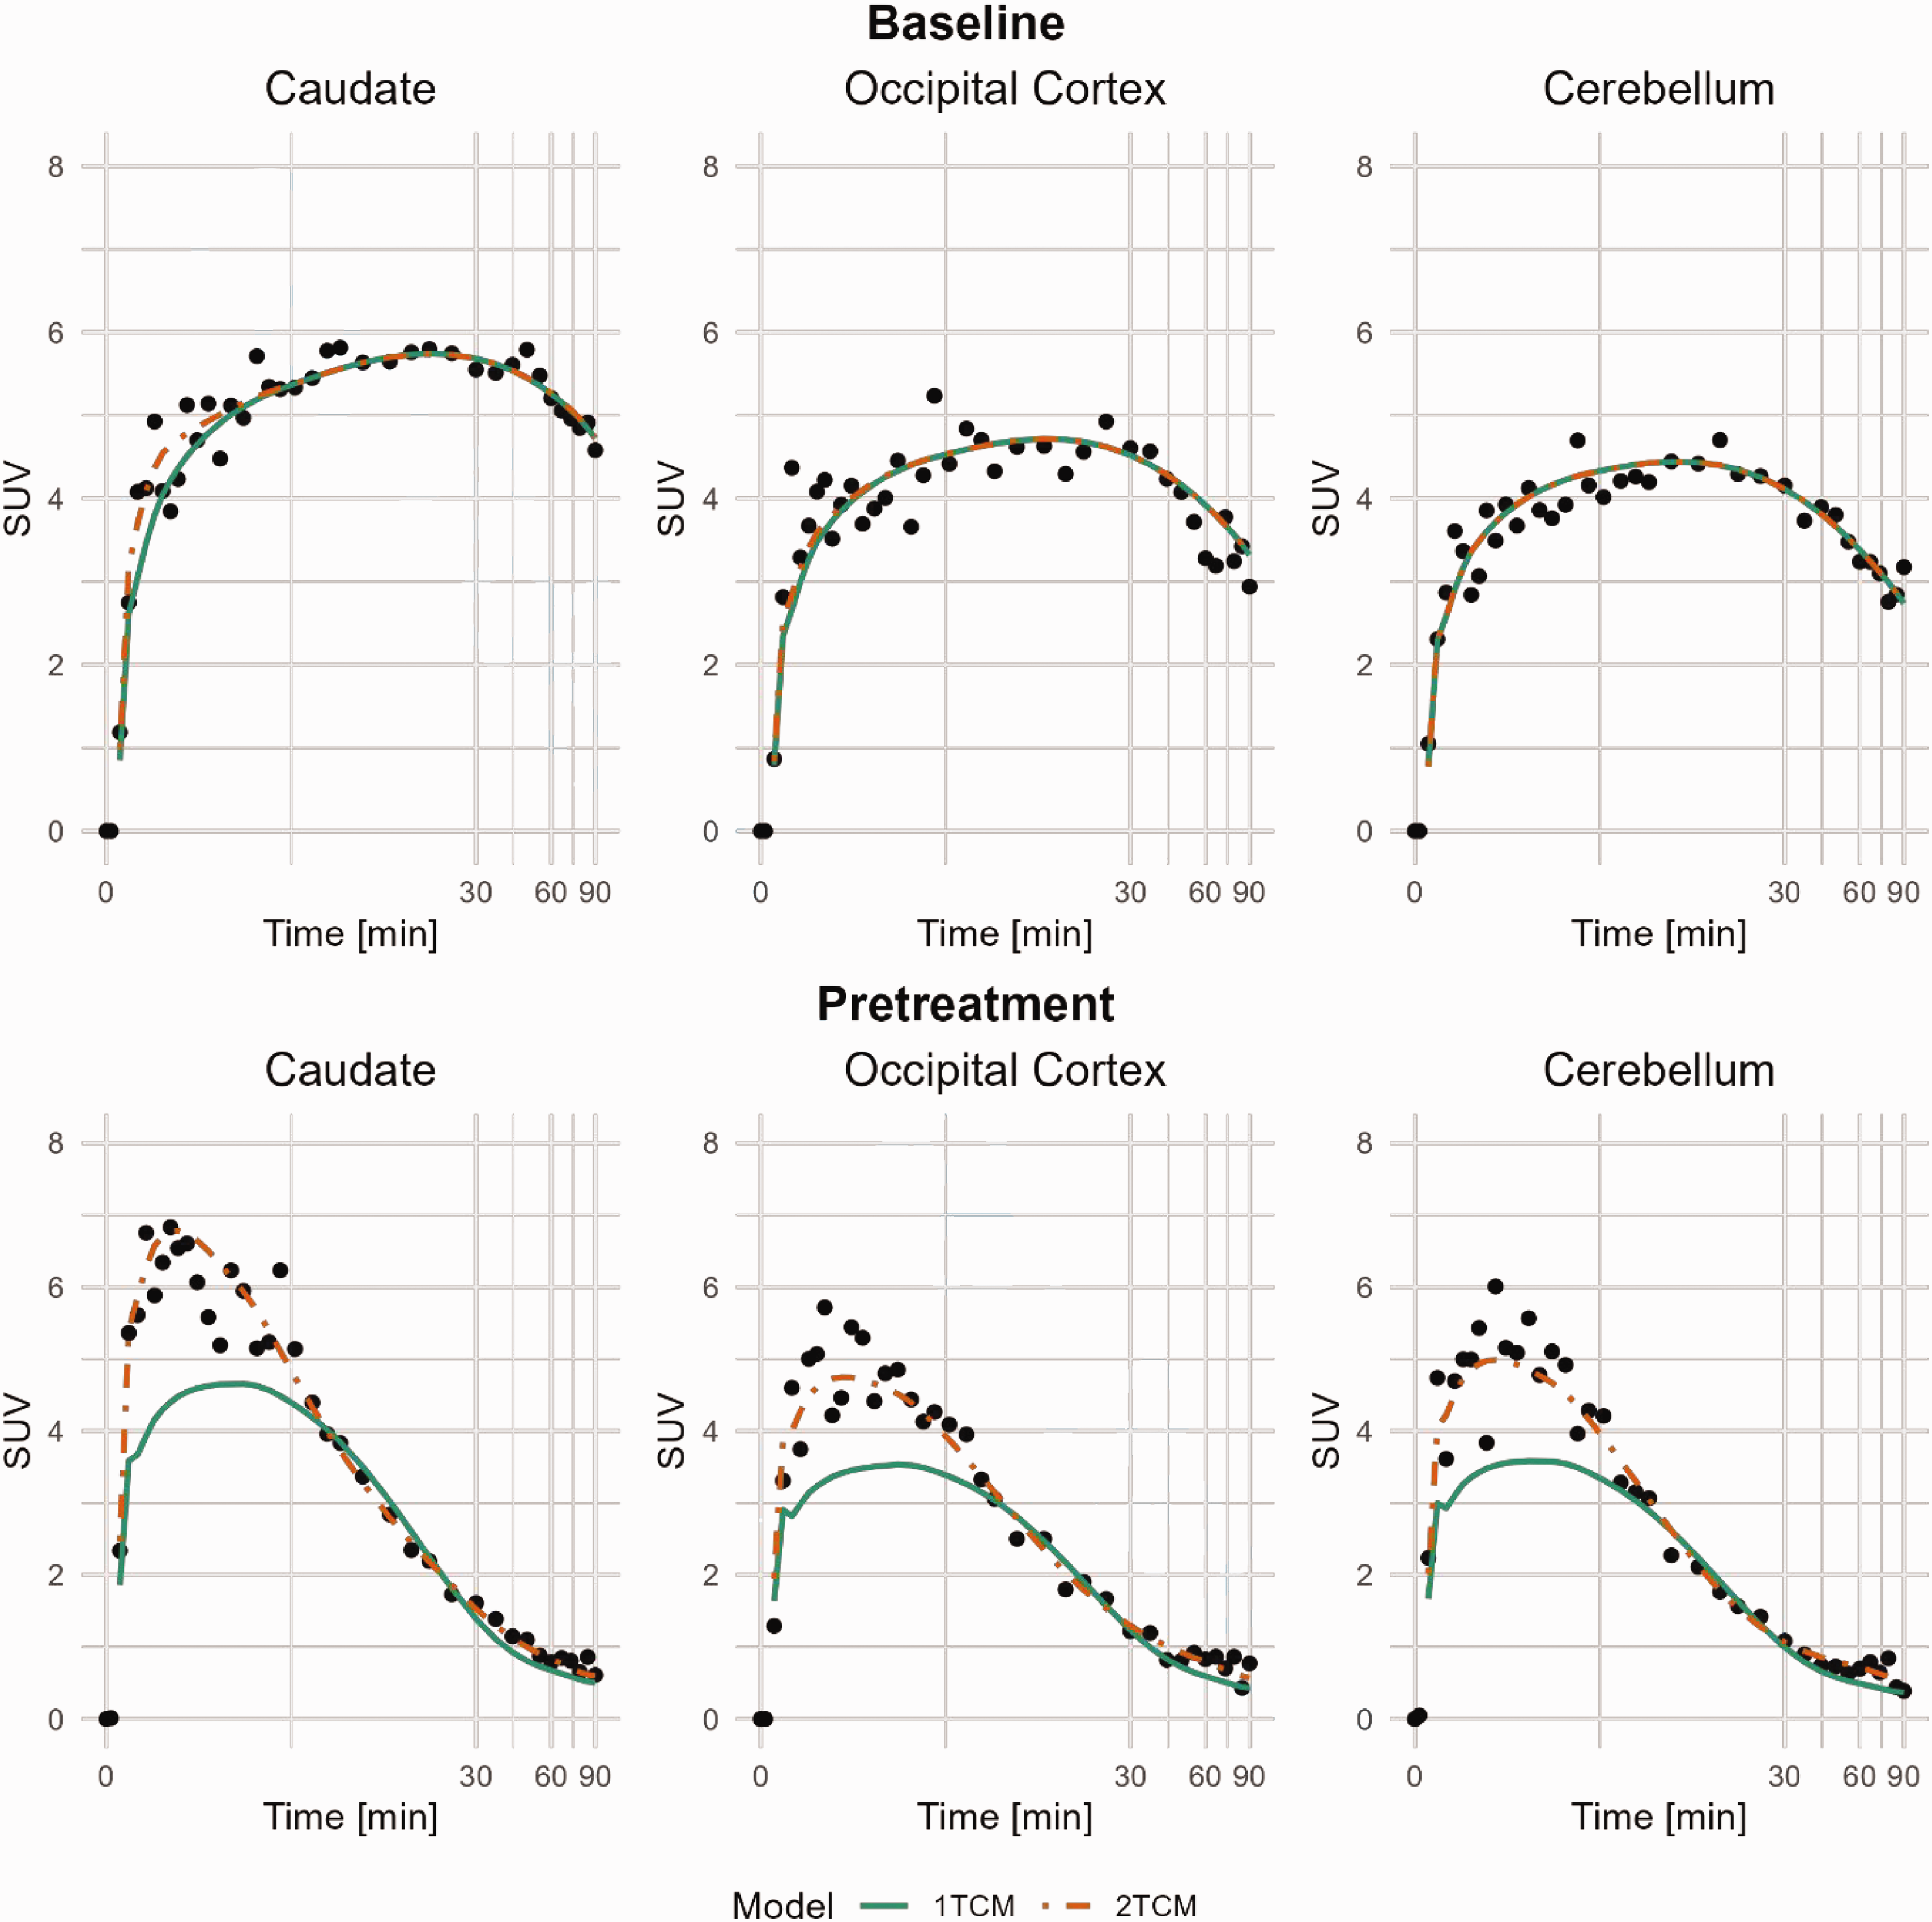
Compartmental-model curve fitting of [11C]BIO-1819578 for Caudate, Occipital Cortex and Cerebellum. Data are from baseline and pretreatment PET of NHP3. A logarithmic time scale was chosen to visualise the early peak difference between the models. 1TCM: 1-tissue compartment model; 2TCM: 2-tissue compartment model.
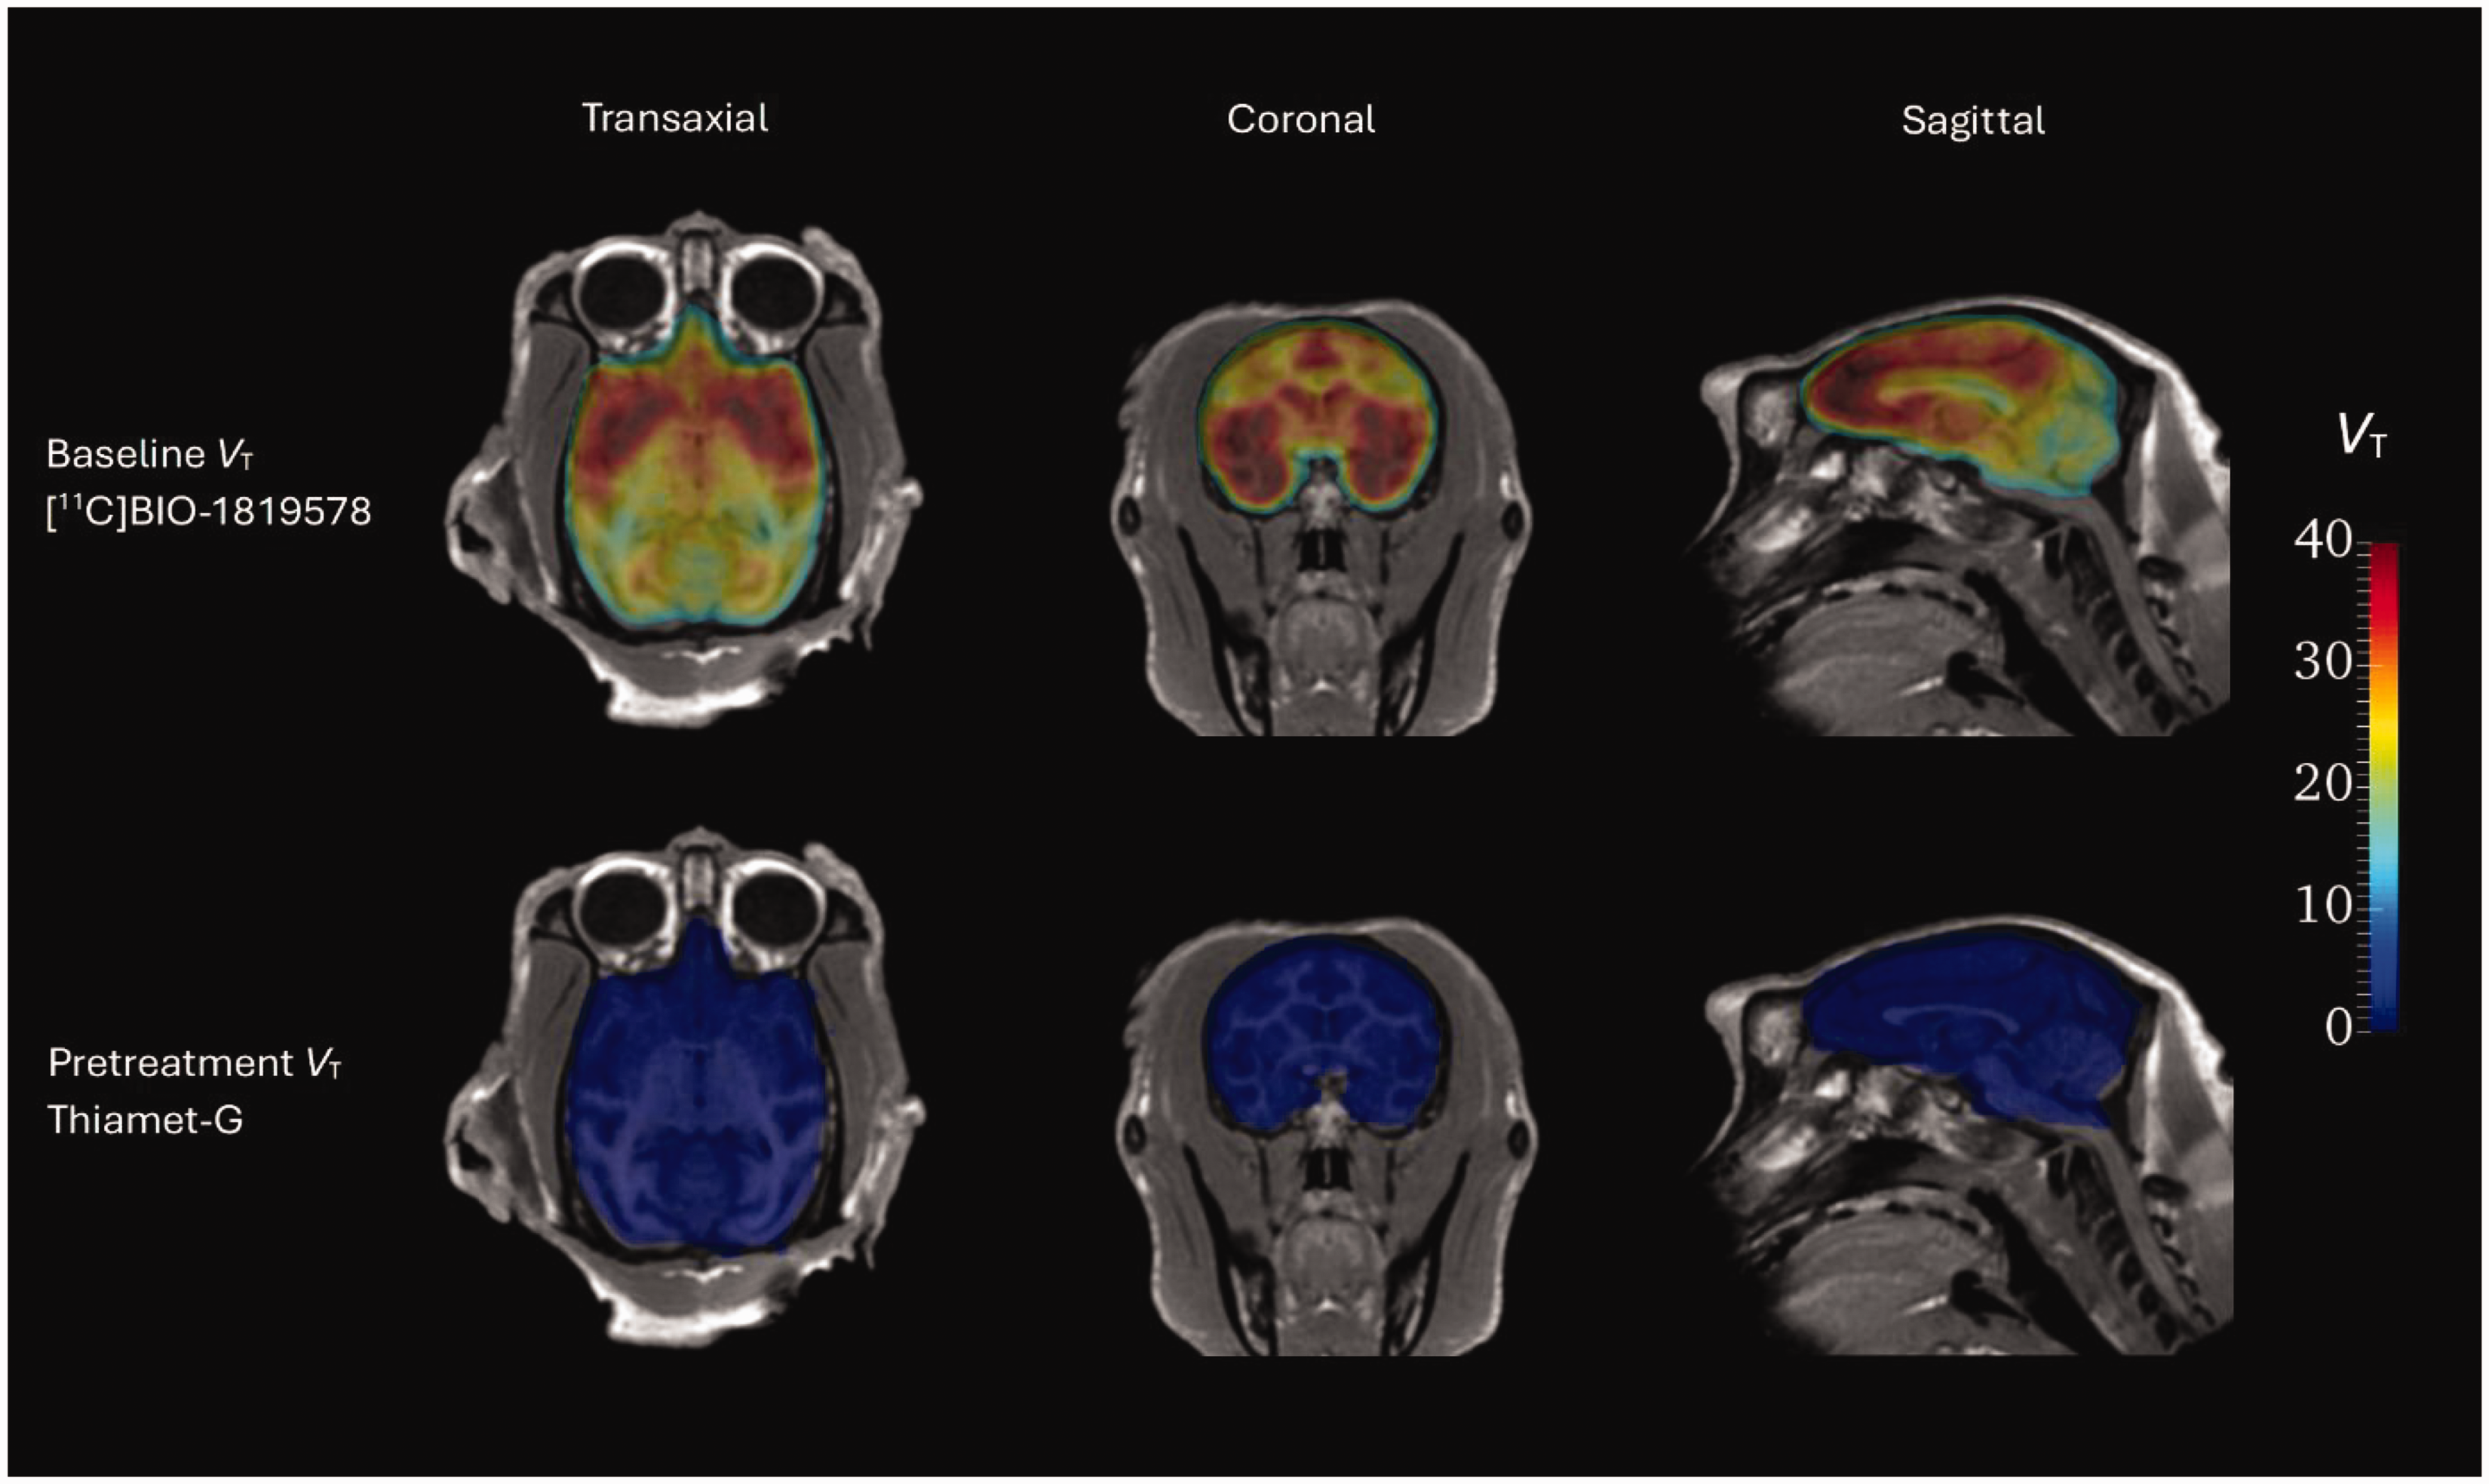
Parametric VT images of [11C]BIO-1819578 at baseline and under pretreatment with Thiamet-G. Both sets of data are overlayed on corresponding MR image in NHP3.
Metabolite corrected arterial input function
The time curve for total radioactivity in arterial plasma was generated using the continuous whole blood and discrete blood and plasma samples. Blood to plasma ratio was best estimated using an exponential fitting method. Extrapolation of the parent fraction estimation, using a Bayesian population-aided approach, was carried out, as low signal to noise was observed in the chromatogram analysis after 60–75 minutes post injection. On average, the model estimated that 27% of [11C]BIO-1819578 remained unmetabolized in NHP plasma at 60 minutes post-injection (Supplemental Figure 2). The time curve for parent fraction and the blood to plasma ratio was used to correct the total radioactivity in arterial blood to obtain the metabolite corrected arterial input function used in the compartment analysis.
The free fraction was determined to 26%, on average (range 22–30%), for the baseline experiments and the single estimate after pretreatment with Thiamet-G was also 26%. The metabolite corrected arterial input function was not corrected for fp.
Kinetic analysis
At baseline, both the 1-tissue compartment model (1TCM) and the 2-tissue compartment model (2TCM) were able to describe the time-activity curves in most brain regions (Figure 1), and the Akaike information criterion (AICc) could not separate out a preferable model across regions and subjects (Supplemental Table 1).
After pretreatment, the 2TCM was the single method that could describe the time-activity curves. Figure 1 presents the model estimates for the Caudate, Occipital Cortex, and Cerebellum in NHP3 at baseline and after pretreatment. Combining the baseline data from the three NHPs, 18 out of 35 regions were better estimated using the 2TCM compared to the 1TCM, based on the AICc score. The diagonal panels in Figure 3 shows the distribution of individual VT estimates using different modelling methods. The distributions are the narrowest for Cerebellum and Occipital Cortex and the widest for Frontal Cortex and Hippocampus, indicating the level of accuracy for the different models.
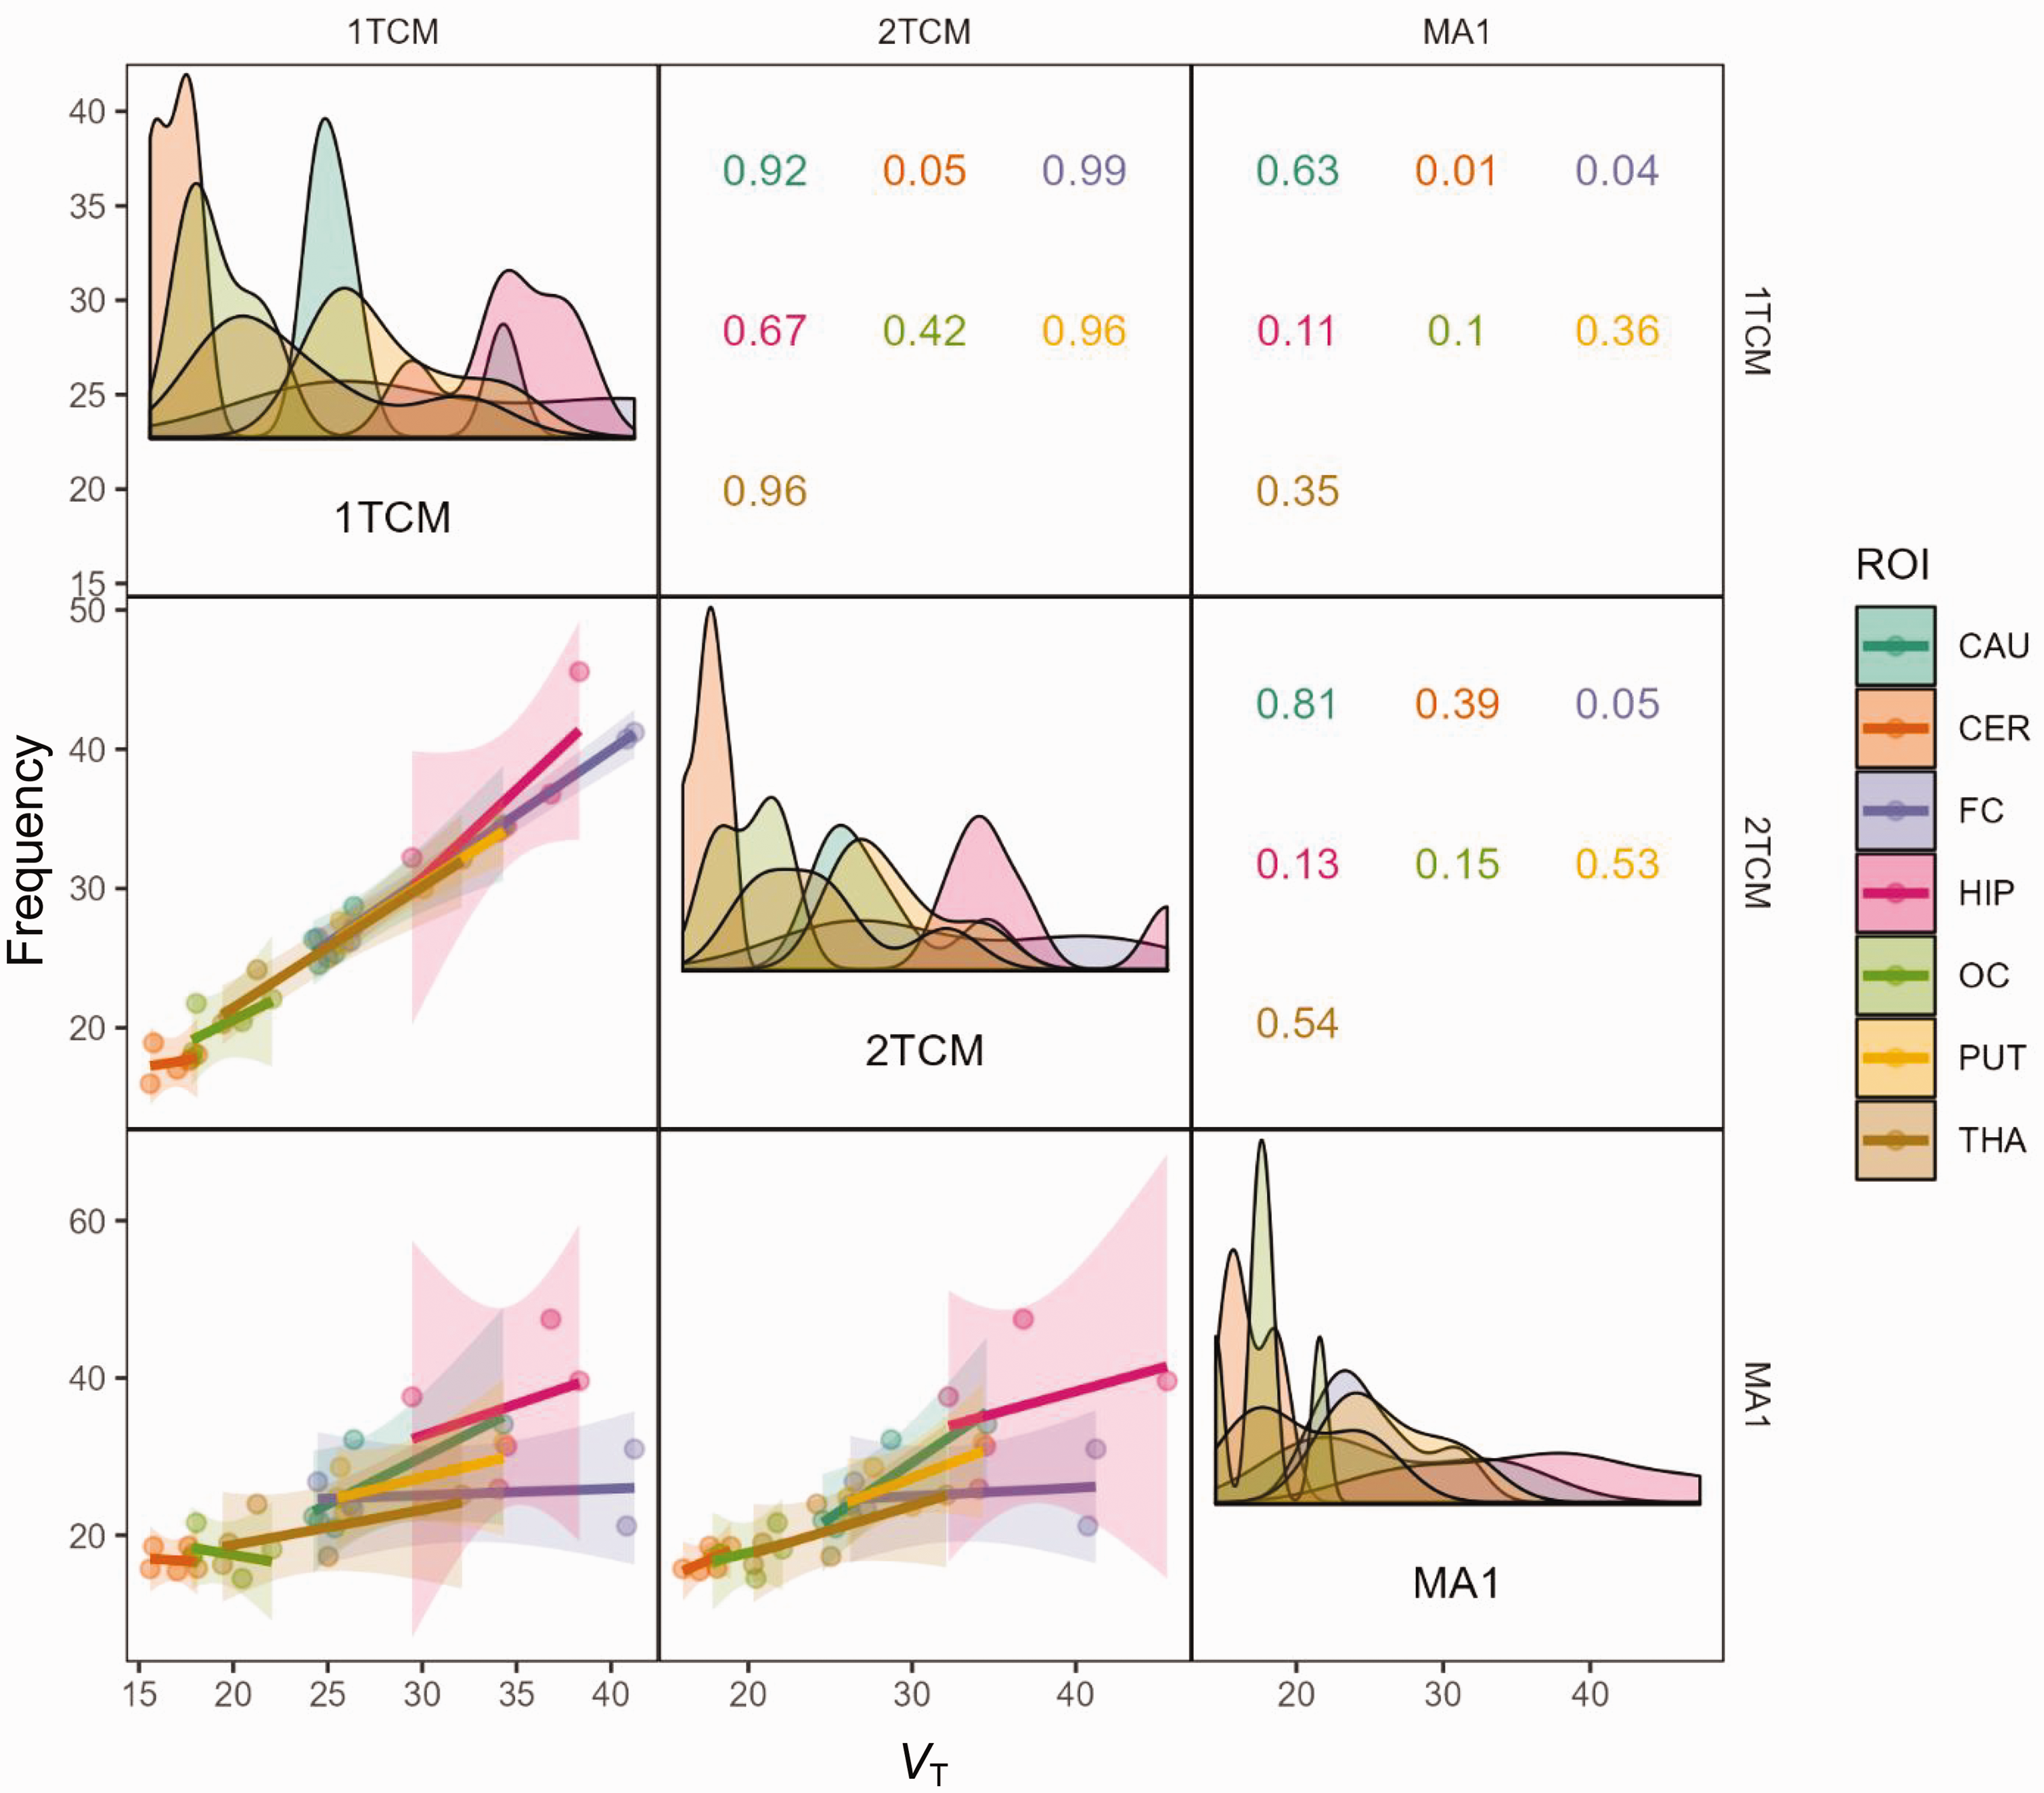
Correlation plot of VT values of the compartmental and graphical models. The diagonal panels show the density plots of individual VT estimates. Panels in the lower left show linear regression data between models. 1TCM: 1-tissue compartment model; 2TCM: 2-tissue compartment model; MA1: Ichise Multilinear Analysis 1; Panels in the upper right show R2 values between models for the different regions. CAU: caudate; CER: cerebellum; FC: frontal cortex; HIP: hippocampus; OC: occipital cortex; PUT: putamen; THA: thalamus.
In the analysis of baseline scans, the 2TCM demonstrated that VT values across different brain regions converged to within 10% of their final values after 66 minutes of image acquisition (Supplemental Figure 3).
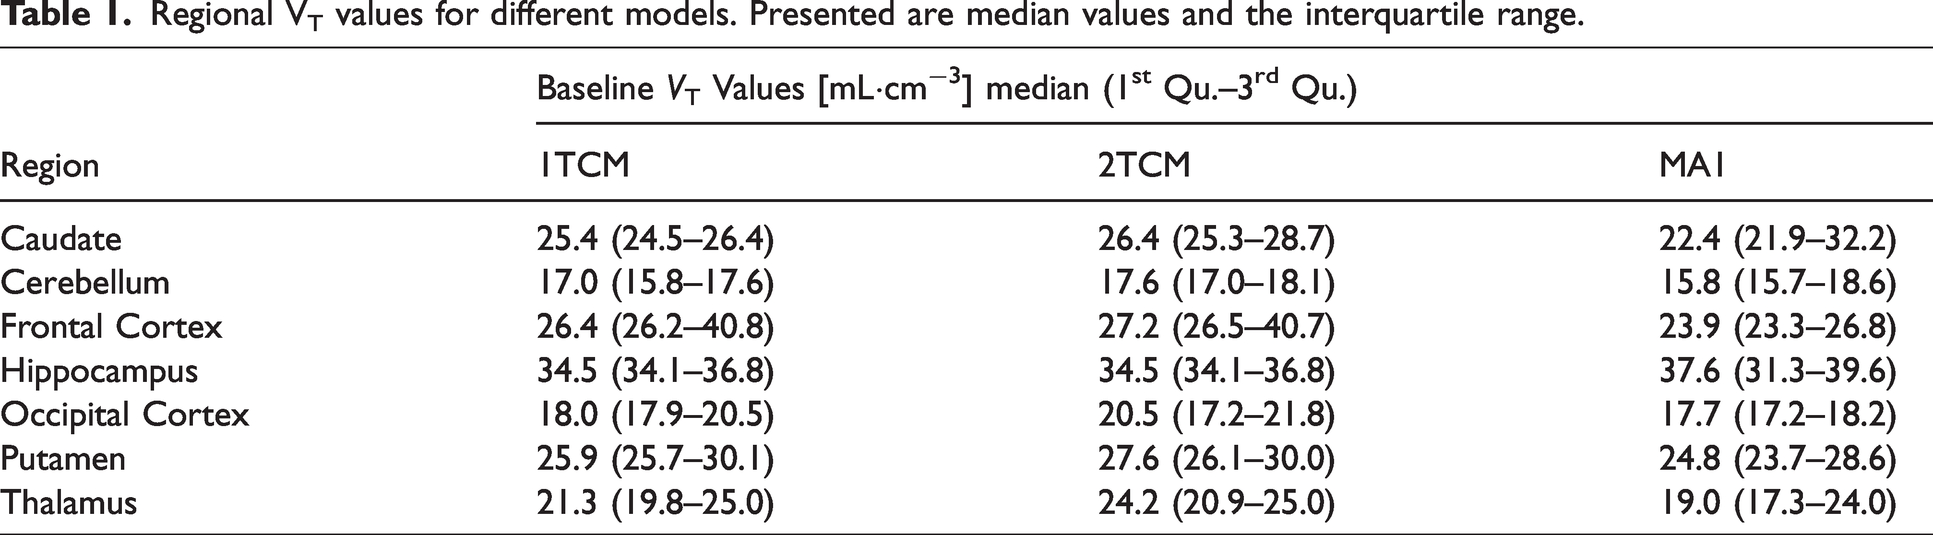
The VT values correlated well between the two models, with an overall R2 of 0.96 and individual region R2 ranging from 0.05 to 0. 99 (Figure 3). For the pretreatment data, all regions were preferably modelled using the 2TCM according to the AICc score, and the R2 between the two compartmental approaches was 0.93. After pretreatment with Thiamet-G, an occupancy of 97.6% (calculated using the 2TCM) was observed, with an estimated VND of 2.9 mL·cm−3 (Supplemental Figure 4). The individual VT values estimated from the 2TCM are presented in Table 1.
Regional VT values for different models. Presented are median values and the interquartile range.
Graphical analysis
MA1 estimates examples are shown in Figure 4 and individual VT from MA1 are shown in Table 1. The correlation between MA1 and the compartmental models are shown in Figure 3. At baseline, the overall R2 was determined to 0.64 between MA1 and 2TCM, ranging from 0.05 to 0.81 for individual regions. MA1 estimated VT values were negatively biased by approximately 7% compared to those estimated with 2TCM.
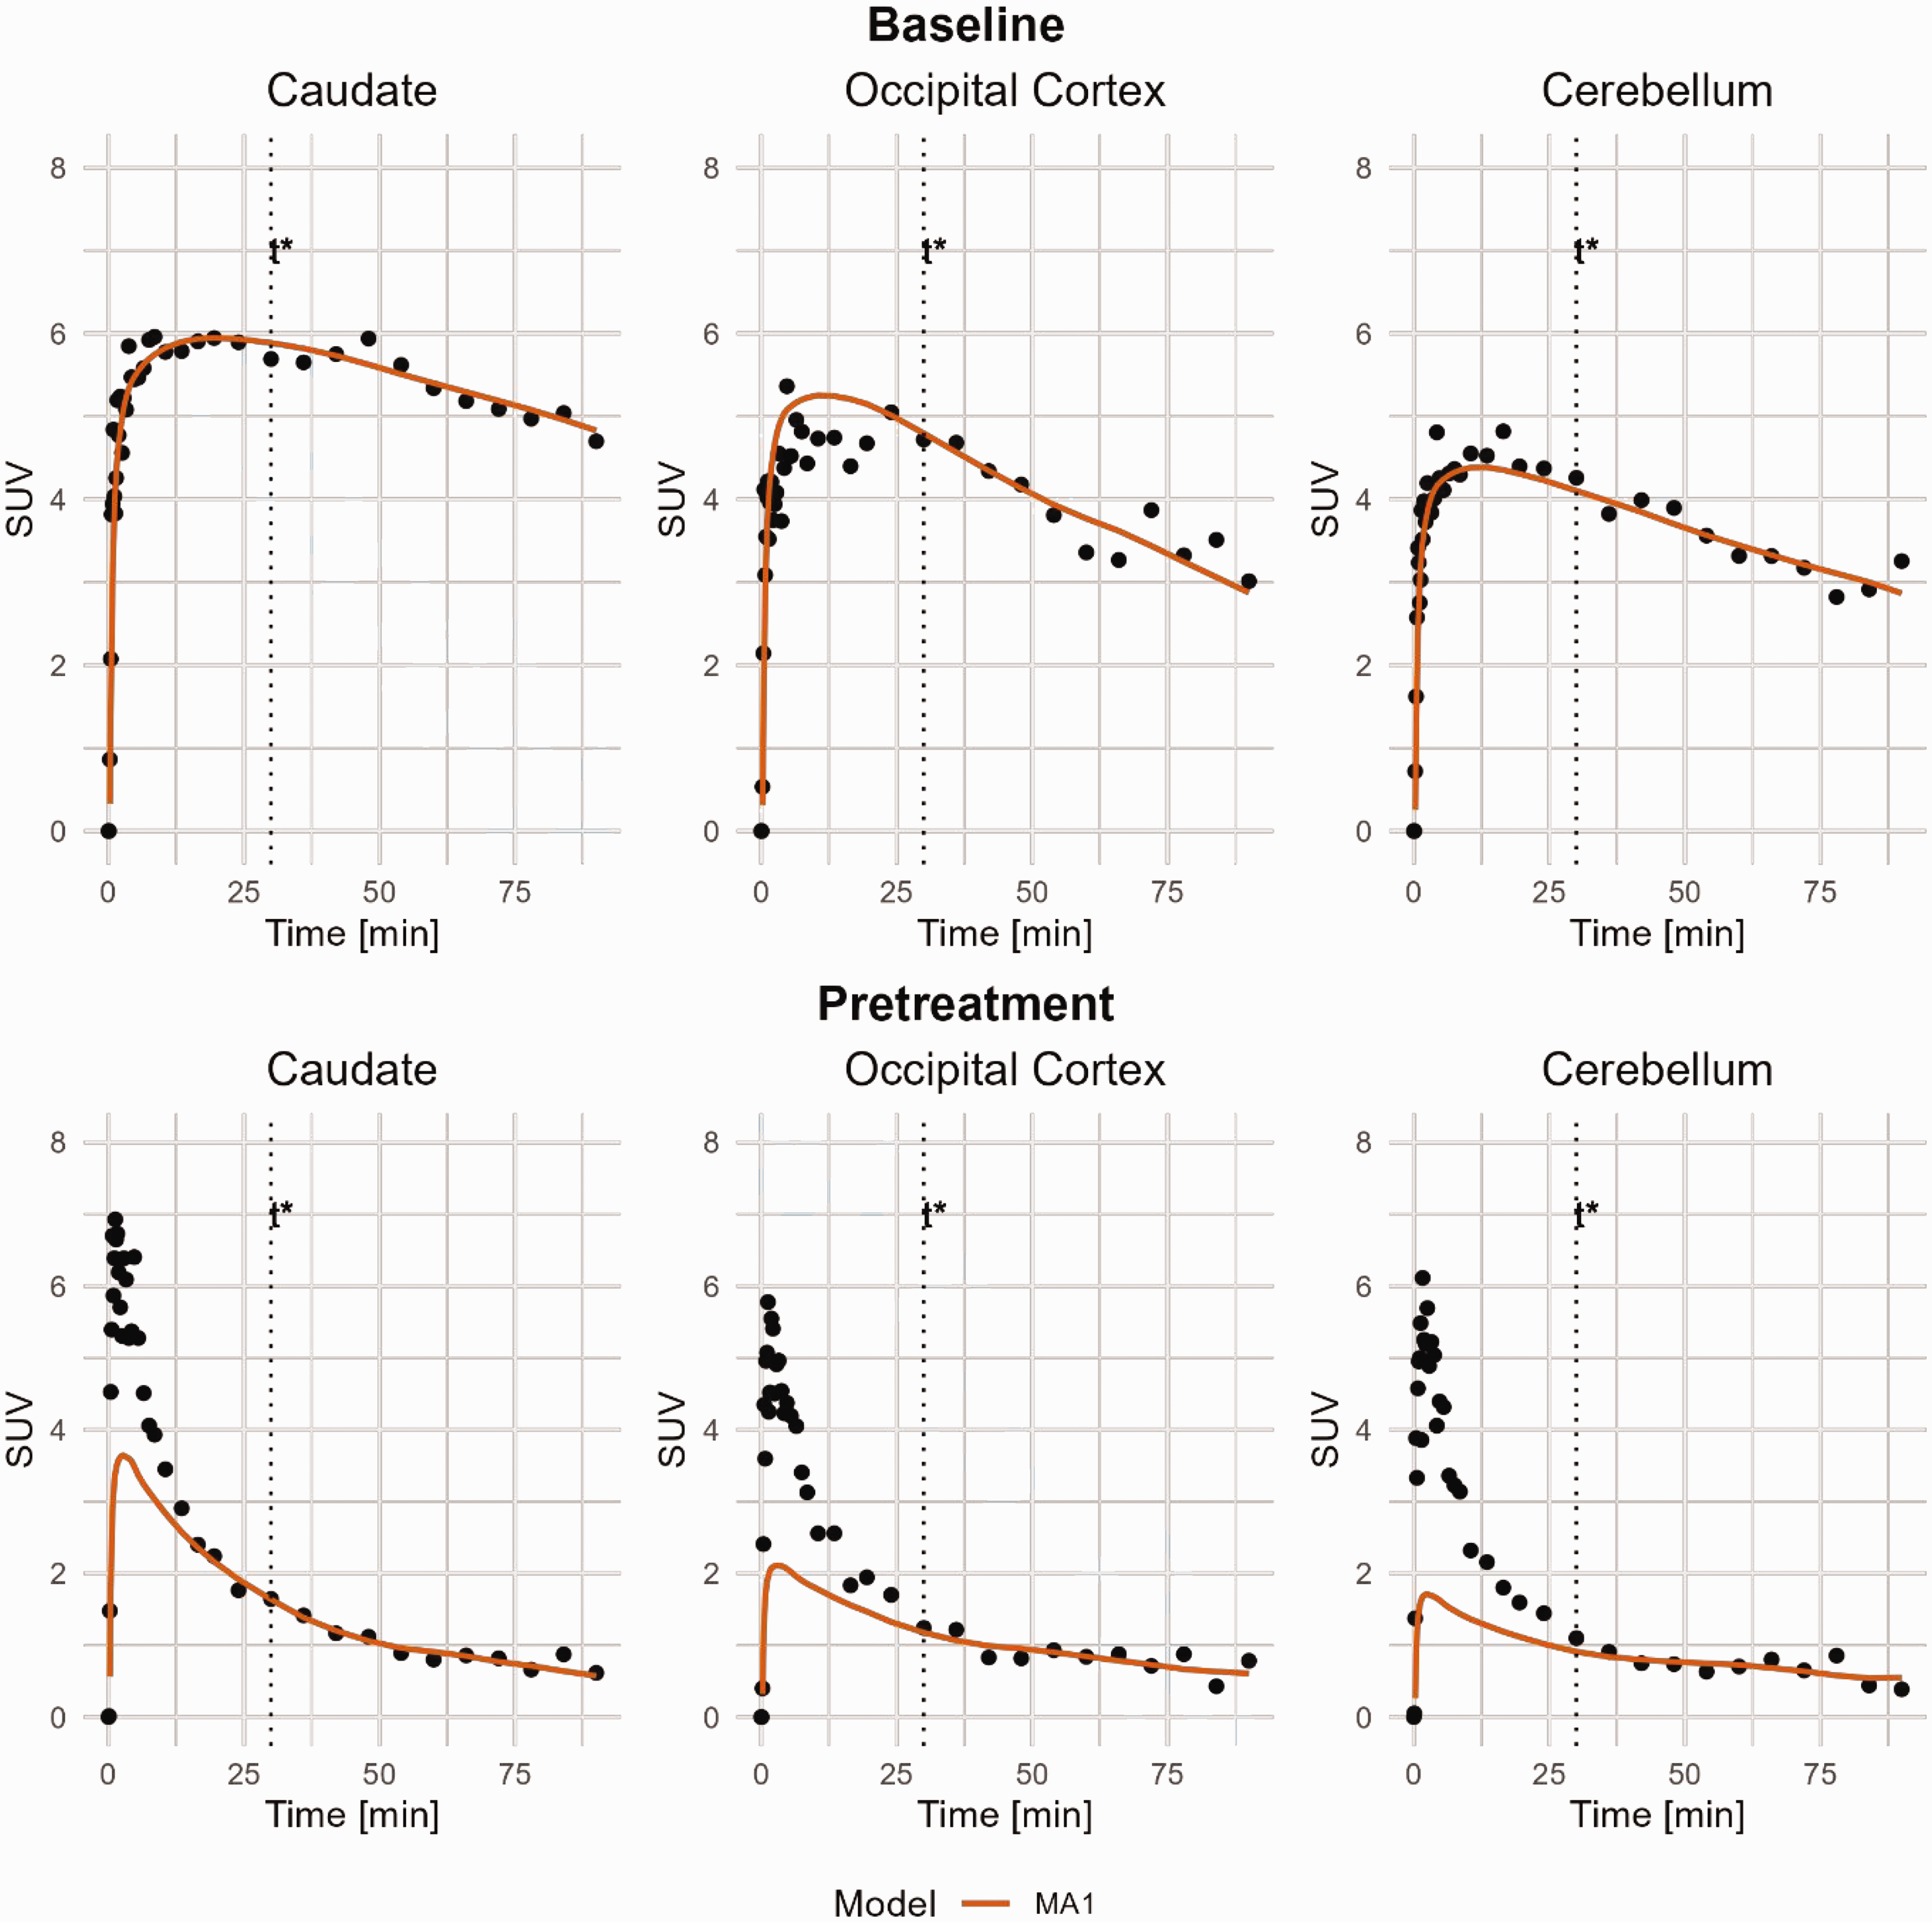
MA1 curve fitting of [11C]BIO-1819578 for Caudate, Occipital Cortex and Cerebellum. Data are from baseline and pretreatment PET of NHP3. t* was set to 30 minutes. MA1: Ichise Multilinear Analysis 1.
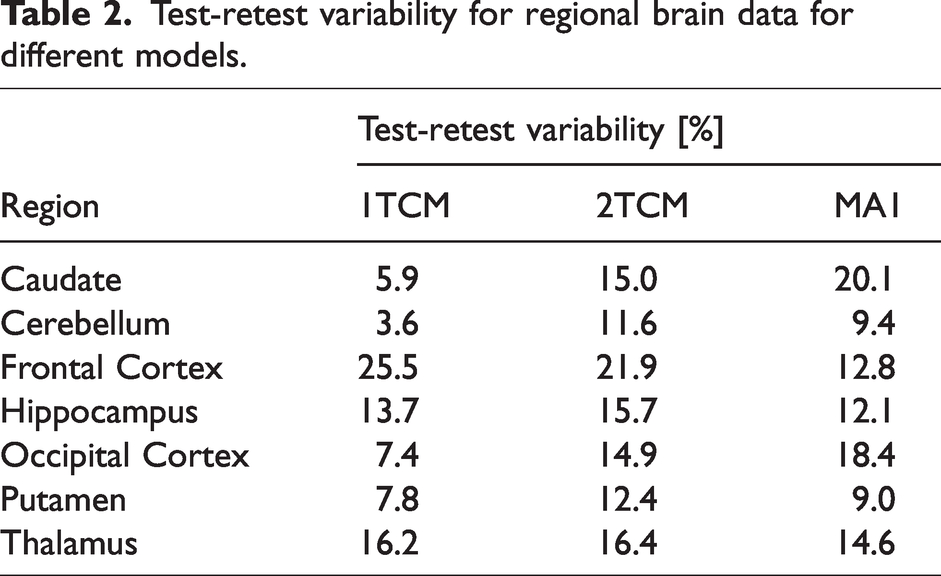
Test-retest variability
The regional test-retest variability (N = 2) results are presented in Table 2. Analysis of the data indicate that the 1TCM demonstrated the lowest overall test-retest variability among the models examined.
Test-retest variability for regional brain data for different models.
Whole-Body PET and dosimetry
The magnitude of the [11C]BIO-1819578 uptake was broadly similar between the two NHPs, with the greatest uptake observed in the liver, small intestine, brain, kidneys, heart, and bone, all of which peaked at over 1% of the injected radioactivity. The radioligand was primarily excreted via the bile-gastrointestinal tract, and a low bladder accumulation indicated that the urinary tract was only partly the route of excretion during the scanning window (Figure 5). Residence times for organs are presented in Supplemental Table 2. The largest absorbed dose was in the kidneys (0.014 mGy/MBq) (Supplemental Table 3). The calculated human whole-body effective dose was approximately 0.0033 mSv/MBq (Supplemental Table 3).
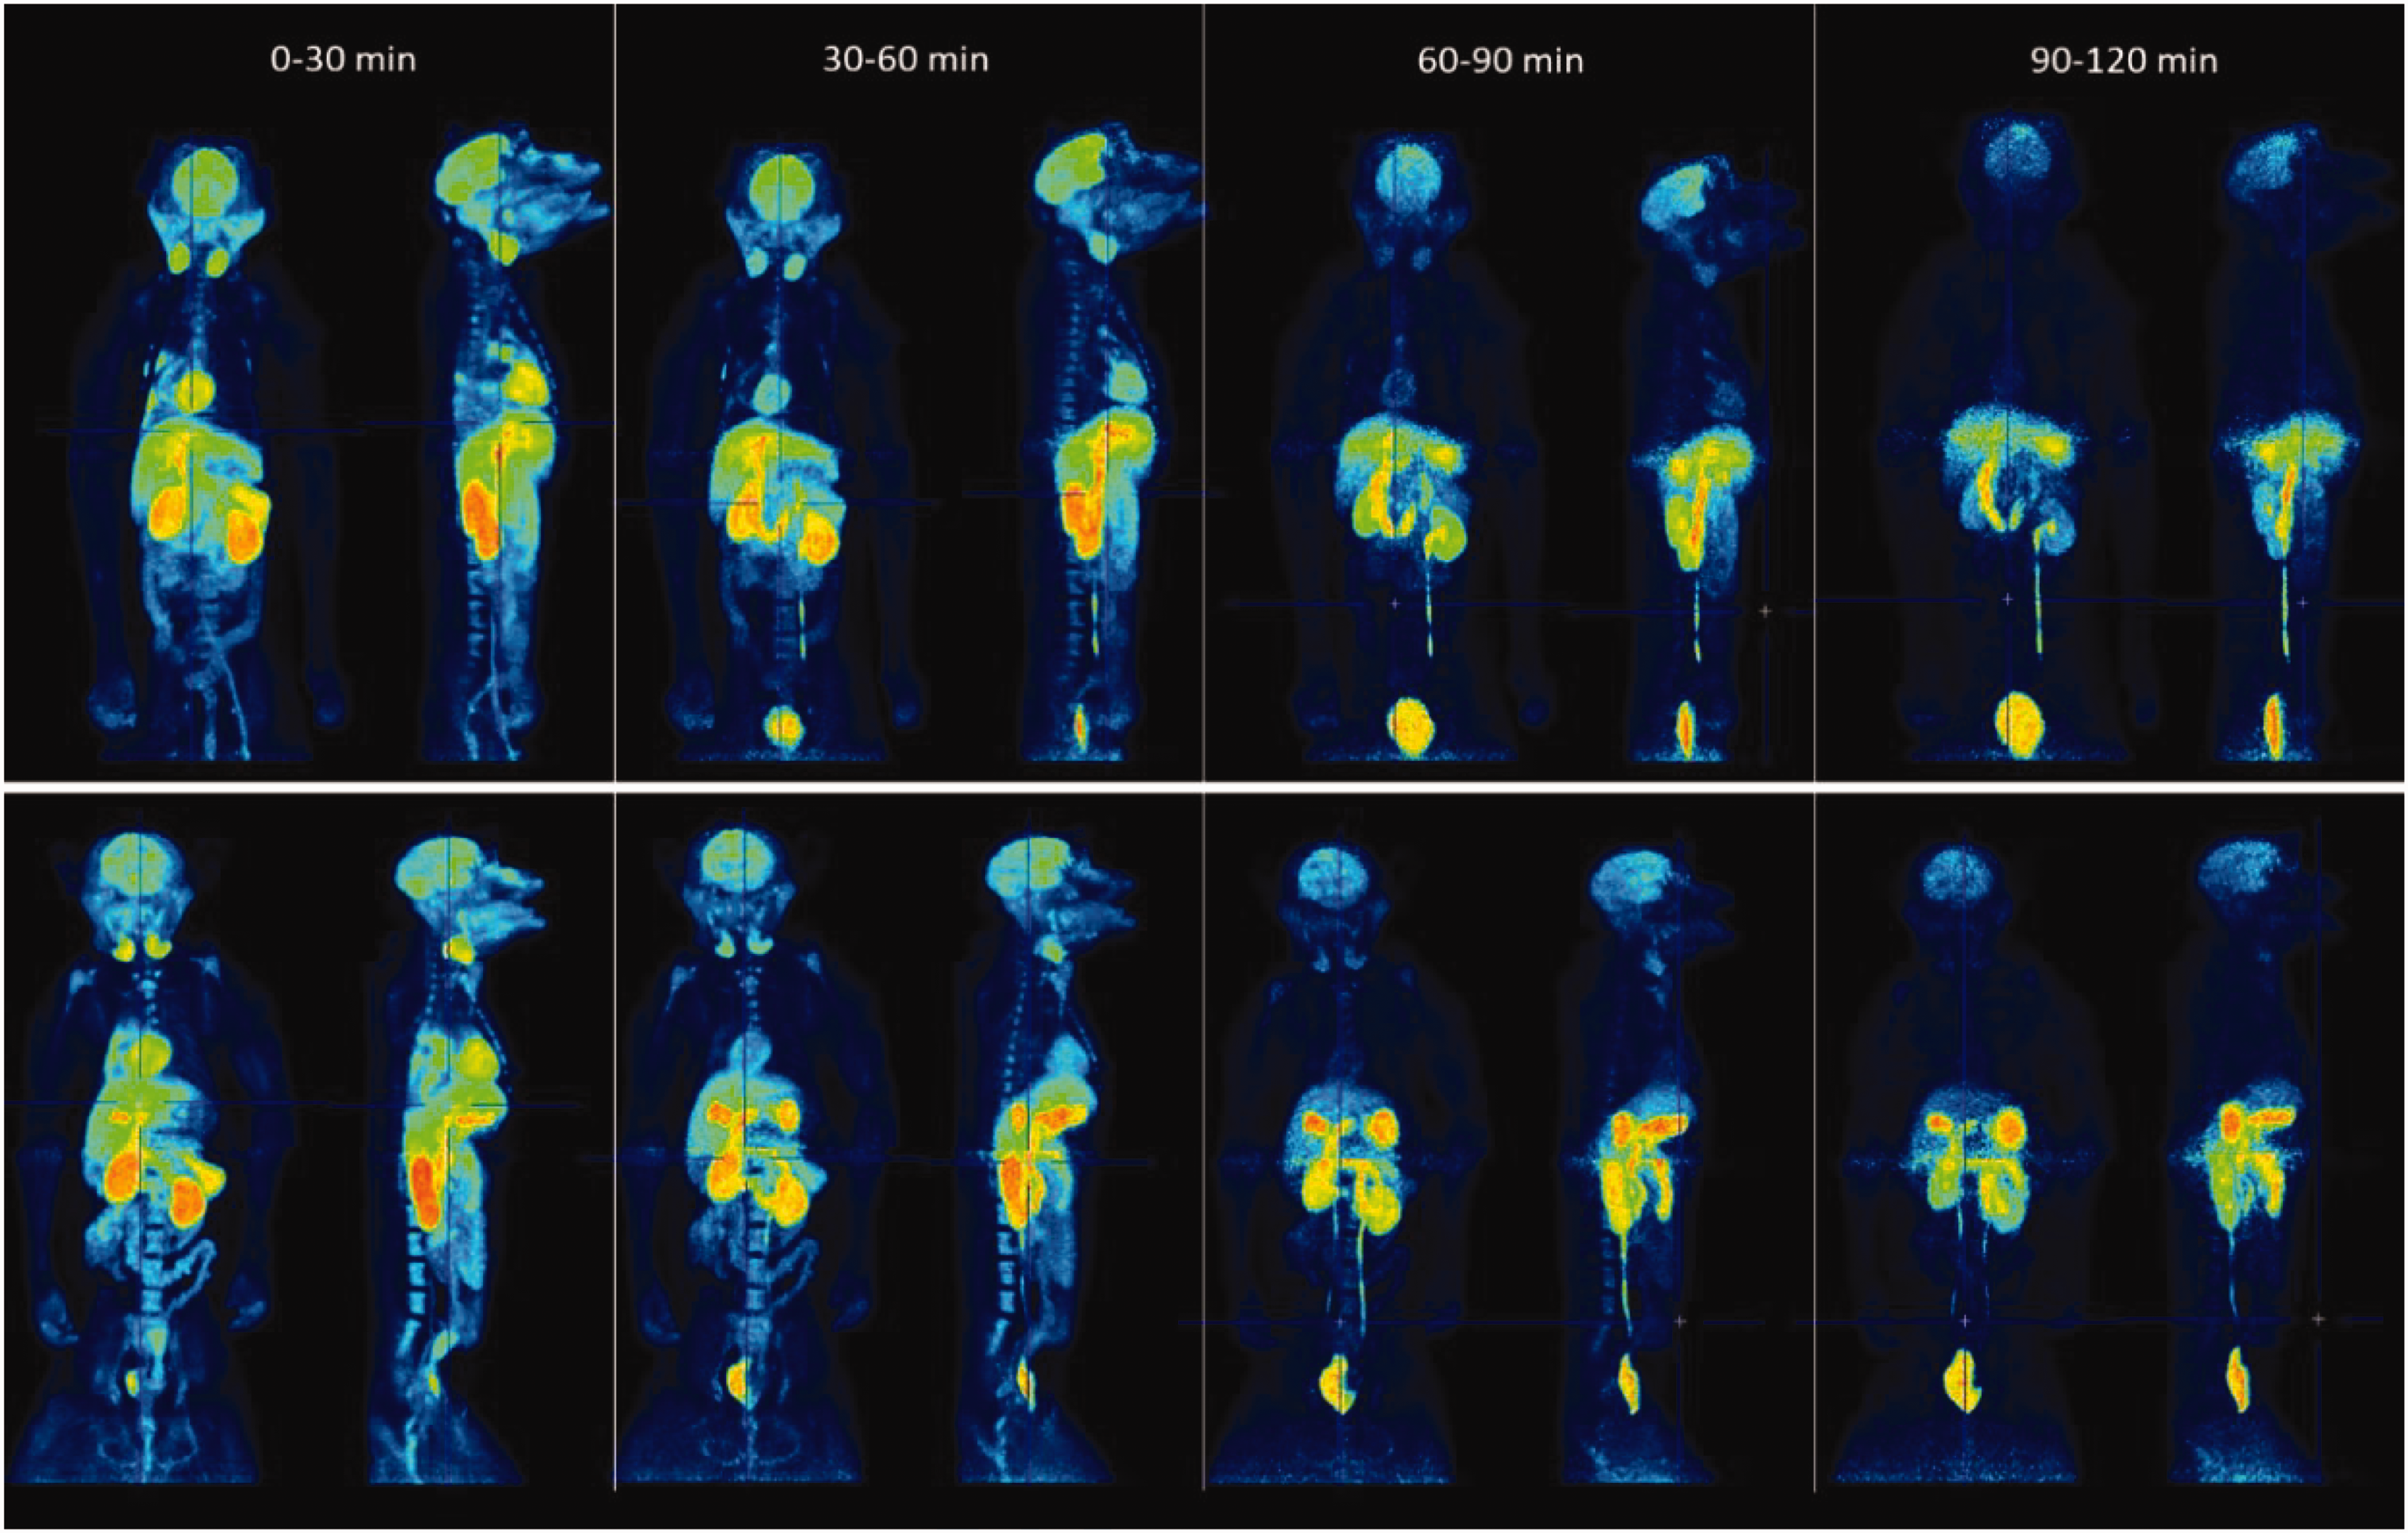
Whole-body PET images of [11C]BIO-1819578 in NHP3 and NHP4. Images are decay corrected to time of injection and presented as maximum intensity projection.
Discussion
The study aimed to quantitatively assess the regional brain distribution of the novel radioligand [11C]BIO-1819578 in non-human primates under baseline conditions and after pretreatment with the O-GlcNAcase (OGA) inhibitor Thiamet-G. The PET imaging data showed that the calculated regional VT values reflect previous published binding patterns of OGA, with highest binding in hippocampus, striatal regions and the frontal cortex.13,15 The 90-minute PET acquisition of [11C]BIO-1819578 in NHPs demonstrated predominantly reversible binding across most brain regions (Supplemental Figure 1). However, in select experiments, high-binding areas such as the frontal cortex and hippocampus exhibit slower radioligand clearance (data not shown). The reversibility is a desirable trait for kinetic modelling, distinguishing [11C]BIO-1819578 from previously published 11C-labeled OGA binding tracers.13,15 Although, most time-activity curves showed reversibility, they also exhibited a fast equilibrium between the two tissue compartments and slow wash-out, leading to the collapse of the 2TCM model into 1TCM for almost all brain regions under baseline conditions. The slow kinetics, particularly in the frontal cortex and hippocampus, lead to challenges in the modelling process, which is reflected in the wide distribution of VT estimates shown in Figure 3. Analysis of the data reveals that the 1TCM exhibits lower overall test-retest variability compared to other models (Table 2). Additionally, the MA1 model shows promise in reducing variability for the frontal cortex, as evidenced in Table 2. However, the efficacy of this approach in modelling hippocampal binding remains uncertain. The 2TCM performed better based on the AICc score after pretreatment with Thiamet-G, and the most reliable and valid modelling approach will be further evaluated in future human test-retest studies and applied studies focusing on target occupancy with OGA inhibitors.
In this study, VT estimated using 2TCM exhibited regional differences with the cerebellum having the lowest values, consistent with saturation studies conducted by Cook et al. in 2023. 15 No reference region was identified as no region appeared to be devoid of specific binding for OGA. The estimated VT decreased in all regions, including the cerebellum, after pretreatment with Thiamet-G, further supporting that no evident reference region could be identified. The high occupancy after pretreatment can be explained by the fact that the blood concentration of Thiamet-G was roughly 1500 times higher than the reported Ki value of 20 nM 29 during the pretreatment scan. The estimated VND was approximately 3 mL·cm−3, while the VT ranged from 17–41 mL·cm−3, indicating that around 84–93% of VT represents specific binding.
As reported in by Nag et al., 18 the HPLC chromatography analysis of plasma samples did not detect any recirculating lipophilic radiometabolites. Although radiometabolites in the brain cannot be formely excluded, regional brain analysis doesn’t support the presence of radiometabolites confounding quantification. At baseline the PET data could be adequately described using both the one-tissue (1TCM) and two-tissue (2TCM) compartment models, with metabolite-corrected plasma input function. In contrast to [18F]-LSN3316612 time-stability estimates in NHPs, 12 the analysis for [11C]BIO-1819578 showed stable estimates of VT down to 40–60 minutes, which will be further evaluated in forthcoming human studies. The findings suggest that the formation of blood-brain barrier permeable radiometabolites, which could impact the quantitative analysis, is unlikely but could not be excluded.
Modelling of the parent fraction using a population-based approach allowed for extrapolation of the data up to the full length of the PET examination. However, this approach may introduce some uncertainty in the fitting of the washout phase and the determination of rate constants k3 and k4, particularly for the three cases where only data up to 60 minutes was available. Nevertheless, the fit as shown in Figure 1 shows good fit also at later time points suggesting that the impact of missing data points is likely low. It is still advised that in later studies sample blood for metabolite analyses every fifteen minutes to ensure as many data points as possible, still using a population-based fit for best results.
The whole-body radiation dosimetry study showed the highest absorbed organ dose was to the kidneys, followed by the gallbladder, heart, and liver. The estimated effective dose (ED) was 0.0033 mSv/MBq of injected radioactivity, which is a relatively low value even for a carbon-11 labelled tracer. 30 This low ED can likely be attributed to the limited bladder uptake (Supplemental Table 2), which reduces the absorbed dose to nearby radiosensitive organs. It should be noted that the male NHP was castrated and the ED calculation in testis, a region with high OGA expression, did not include any self-dose contribution. Hence, human dosimetry studies are needed for a more accurate testes dose estimation. In future human studies in male subjects the injected activity should be kept low to decrease high ED, as an additional precaution.
Conclusion
The results in this study supported previous preliminary findings ensuring that [11C]BIO-1819578 has promising characteristics as a PET radioligand for imaging OGA. The radioligand demonstrated high uptake in the brain and clear blocking effects when co-administered with the OGA inhibitor Thiamet-G. The baseline data as well as data from blocking studies could reliably be quantified using both gold standard 2TCM as well as the graphical approach MA1. These findings suggest [11C]BIO-1819578 shows high potential to be a suitable PET radioligand for quantifying OGA levels in the human brain. The evaluation of effective dose is also an important step prior to first-in-man studies and the levels are such that human administrated is possible. Further testing of this radioligand in human studies is warranted to assess its potential as a tool for studying OGA-related neurological processes and disorders as well as evaluating novel OGA targeting drugs.
Supplemental Material
sj-pdf-1-jcb-10.1177_0271678X251332487 - Supplemental material for In vivo quantification of [11C]BIO-1819578 in non-human primates, a novel radioligand for O-GlcNAcase
Supplemental material, sj-pdf-1-jcb-10.1177_0271678X251332487 for In vivo quantification of [11C]BIO-1819578 in non-human primates, a novel radioligand for O-GlcNAcase by Martin Bolin, Sangram Nag, Ryosuke Arakawa, Andrea Varrone, Lars Farde, Laurent Martarello, Maciej A Kaliszczak, Christer Halldin and Anton Forsberg Morén in Journal of Cerebral Blood Flow & Metabolism
Footnotes
Funding
The author(s) received no financial support for the research, authorship, and/or publication of this article.
Acknowledgements
The authors would like to thank BIOGEN MA Inc. for providing the precursor and reference standard. We are grateful to all members of the PET group at the Karolinska Institutet.
Declaration of conflicting interests
The author(s) declared the following potential conflicts of interest with respect to the research, authorship, and/or publication of this article: Martin Bolin, Sangram Nag, Ryosuke Arakawa, Andrea Varrone, Lars Farde, Christer Halldin and Anton Forsberg Morén has nothing to disclose.
Laurent Martarello was a full-time employee of Biogen and received financial compensation at the time of the study.
Maciej A. Kaliszczak was a full-time employee of Biogen and received financial compensation.
Authors’ contributions
MB analysed the PET data and prepared the manuscript; AFM reviewed and developed PET data analysis protocols; SN developed radiochemical synthesis procedure; RA and AV conceptualized and lead the in vivo study; CH and LF reviewed and developed PET imaging and metabolite analysis protocols; MK and LM contributed to the study design and data analysis.
All authors have read and agreed to the published version of the manuscript.
Supplementary material
Supplemental material for this article is available online.
References
Supplementary Material
Please find the following supplemental material available below.
For Open Access articles published under a Creative Commons License, all supplemental material carries the same license as the article it is associated with.
For non-Open Access articles published, all supplemental material carries a non-exclusive license, and permission requests for re-use of supplemental material or any part of supplemental material shall be sent directly to the copyright owner as specified in the copyright notice associated with the article.