
Abstract
The blood-brain barrier (BBB) is the cellular interface between the circulating blood and neural environment, and is created by apposed endothelial cells and their intercellular tight junctions. Many aspects of how the BBB functions at the molecular level remain unresolved; therefore, we report for the first time a comprehensive gene expression profile of rat brain microvessels using serial analysis of gene expression (SAGE). We assembled a full and quantitative SAGE catalog containing 101,364 tags, of which 33% of the tags matched known genes, 51% matched expressed sequence tags (ESTs) in the Unigene database, and 16% of the tags were unassigned. The transcriptome catalog contains many new and novel transcripts among known BBB genes. A large compliment of junctional proteins and an extensive assortment of facilitated carrier and ATP-dependent transporters are included. To identify microvessel-enriched transcripts, we compared the microvessel SAGE catalog to cortex and hippocampus SAGE catalogs. This resulted in identification of 864 genes, including several known for their abundant expression at the BBB, such as the transferrin receptor (TrnR). Sorting enriched genes based on function revealed groups that encode transporters (11%), receptors (5%), proteins involved in vesicle trafficking (4%), structural proteins (10%), and components of signal transduction pathways (17%). This genomic repertoire emphasizes the unique cellular phenotype existing within the brain and further implicates the BBB as a mediator between the brain and periphery. These results may provide a useful resource and reference point from which to determine the effects of different physiological, developmental, and disease processes on BBB gene expression.
Keywords
Introduction
The cells within the central nervous system are located in an environment protected from the influence of circulating blood constituents and peripheral tissues by the unique microvasculature of the brain. The impeditive nature of the brain's microvasculature shields the brain from variations in plasma levels of metabolites, neuroactive amino acids and peptides, xenobiotics, as well as blood-borne pathogens and toxins that might be present in the circulation. This physiological partition between the blood and brain is created by endothelial cells and their intercellular tight junctions that form a cellular interface between the circulating blood and neural environment, and is referred to as the blood-brain barrier (BBB).
While the physiological, anatomical, and biochemical properties of the BBB have been studied for years and form the basis for our current understanding of BBB function, many aspects of how the BBB functions remain unresolved at the molecular level. Reports of global gene expression analysis in brain endothelial cells are few and not comprehensive. As gene expression is a function of development, aging, disease, and genetic makeup, a systematic determination of the brain microvessel transcriptome would greatly advance our understanding of how the BBB is affected by these events and processes.
The identification of genes expressed by the microvasculature is particularly valuable for a number of reasons. Physiologically, it is known that the brain endothelial cells mediate transport of nutrients, vitamins, and metabolic precursors to the brain (Drewes, 2001). Endothelial cells are also endowed with carrier systems for inward movement of ions associated with osmoregulation and cerebral spinal fluid formation (Jones et al, 1992; Strange, 1992). The microvasculature possesses carrier systems (Golden and Pardridge, 2000) and catabolic or conjugating enzymes (Ghersi-Egea et al, 1995; Minn et al, 1991) that prevent drugs, toxins, and xenobiotics from entering the brain or facilitate efflux of metabolic byproducts. The brain endothelium also possesses specific receptors and signaling molecules that might be essential for communication between peripheral peptides or hormones and cells of the central nervous system (CNS) (Banks, 2001; Pardridge, 1986; Pardridge et al, 1981). These receptors might also be important for viral and pathogen entry to the brain. Identification of new proteins associated with the aforementioned physiological functions will greatly advance our understanding of cerebral vascular biology.
The endothelial cells of the BBB also play an important role during the initiation and progression of inflammatory responses, a prominent feature in CNS disease pathogenesis. It is well known that specific interaction between adhesion molecules on cerebral endothelial cells and their ligands on circulating immune cells plays an important role in regulating adhesion and transendothelial migration. However, at present, the mechanisms by which immune cells cross the BBB and gain access to the CNS have not been fully defined (Brown, 2001; Weller et al, 1996).
In diseased brain, the BBB represents a formidable obstacle for delivery of therapeutic modalities to the brain parenchyma; therefore, knowledge of new BBB-specific targets may aid in rational drug design. Additionally, BBB-specific ligands might be conjugated to pharmacologically active agents for brain-specific drug delivery (Li and Qian, 2002; Pardridge, 2001).
Recent advances in gene expression analysis make it possible to monitor the expression of thousands of genes simultaneously using high-throughput assays such as microarray hybridization and EST sequencing (Colantuoni et al, 2000). The complementary deoxyribonucleic acids (cDNAs) or oligonucleotides on most microarrays are derived from clones of known transcripts or cDNAs derived from ESTs. However, because endothelial cells represent one one-thousandth of the total brain volume, a unique endothelial cell-specific gene expressed at a moderate or low level might not be fully represented in gene or EST databases. Owing to this issue, the suppression subtractive hybridization method was recently used to generate a cDNA library containing clones for unique genes expressed in both human and rat brain microvasculatures (Li et al, 2001, 2002; Shusta et al, 2002). In this approach, messenger ribonucleic acid (mRNA) derived from liver and kidney was subtracted from brain microvessel mRNA and clones were sequenced and identified as being enriched in brain endothelium compared with liver and kidney tissue. This work represents the first step in brain endothelial cell gene discovery.
Another approach to rapid gene discovery and high-throughput transcriptome analysis is the SAGE method (Velculescu et al, 1995). The SAGE procedure involves deriving short 14 base tags from the 3′ end of cellular transcripts and randomly ligating these tags to form concatamers of 20-50 tags. Cloning and sequencing a few thousand of these concatamers yields a SAGE tag catalog that is comprehensive because it does not require a priori knowledge of any gene sequence and is quantitative because the tag frequency is proportional to transcript abundance. Identification of the tags is achieved by a comparison to computationally derived tags from known genes and ESTs in NCBI databases (SAGEmap) (Lash et al, 2000). Serial analysis of gene expression has been shown to be reliably quantitative, with relative tag counts correlating well to Northern blot analysis (Blackshaw et al, 2001). It is reproducible and relatively comprehensive (Trendelenburg et al, 2002). Serial analysis of gene expression libraries can be easily compared with other catalogs to define tissue-specific genes, or genes regulated under different physiological conditions, disease, or development. The usefulness of this method has been shown in studies of tumors (Argani et al, 2001; Porter et al, 2001; Untergasser et al, 2002; Zhang et al, 1997), hypoxia/ischemia (Trendelenburg et al, 2002), and seizures (Hendriksen et al, 2001). Serial analysis of gene expression has also been used to study gene expression changes during development (Gunnersen et al, 2002) and to identify tissue-specific genes or markers in specialized tissues such as endothelium (St Croix et al, 2000) and epithelium (Sharon et al, 2002).
In the work described here, we have used SAGE to identify a catalog of mRNAs expressed in rat brain microvessels. Furthermore, we determined genes enriched in microvessels by comparing our catalog to cortex and hippocampus SAGE catalogs. This work will serve as a useful reference to compare different physiological, developmental, and disease processes, and may aid target discovery for drug delivery to the brain.
Materials and methods
Isolation of Rat Brain Microvessels
All procedures using animals followed a protocol approved by the University of Minnesota Animal Care Committee. In all, 50 adult male Long-Evans rats (30 days old) were maintained on a defined, control diet consisting of 77% carbohydrates, 13% fat, and 10% protein (per calorie) (#TC00606, Harlan Teklad, Madison, WI, USA). Rat brain microvessels were isolated as described previously (Gerhart et al, 1988). Rat brain tissue was collected after rapid exsanguinations of rats under halothane anesthesia. The pia mater and associated vessels were removed with forceps, and the cortical gray matter was excised and placed in cold M199 medium (Sigma, St Louis, MO, USA). The tissue was minced by stirring with a scalpel and homogenized in a Potter-Elvehjem tissue grinder. (Approximately 1 g of minced brain was removed at this point and frozen at −70°C for ribonucleic acid (RNA) extraction.) The homogenate was passed once through a 350-μm mesh polypropylene net, twice through 110-μm mesh nylon nets, and centrifuged (1000g, 10 mins). The pellets were resuspended in 20% dextran in M199 and centrifuged (2500g, 15 mins) in a swinging bucket rotor. The pellets were then combined and resuspended in cold medium, and the microvessels were collected on a 20-μm mesh nylon net. The microvessels were pooled in PBS and frozen at −70°C before RNA extraction.
Serial Analysis of Gene Expression
Total RNA was prepared from the pooled microvessels and from the minced brain sample using RNAwiz (Ambion, Austin, TX, USA). The quantity and quality of the RNA was assessed by UV absorption spectrophotometry and by use of a RNA chip assay (RNA 6000 nanochip with Bioanalyzer, Agilent, Palo Alto, CA, USA). Serial analysis of gene expression libraries were generated from the RNA using the I-SAGE kit (Invitrogen, Carlsbad, CA, USA) following the manufacturer's protocol; this is a slight modification of the protocol available from Velculescu and colleagues (www.sagenet.org). Restriction enzymes NlaIII and BsmFI were used for tag generation. Optimization of the polymerase chain reaction (PCR) amplification of the ditags resulted in a template dilution of 1/80, and PCR was performed for 27 cycles with 400 50-μL reactions in parallel. Cloned concatamers were sequenced using the BigDye Terminator sequencing kit (PE/Applied Biosystems Foster City, CA, USA) in combination with an ABI377 DNA sequencer. Raw sequence trace files were analyzed using the Pfred algorithm (Ewing and Green, 1998; Ewing et al, 1998) and sequences with a low score were excluded. Tags were extracted from sequences using SAGE2000 software (www.sagenet.org). The catalogs generated by tag-to-gene mapping and contained in this report are publicly accessible in a searchable format at http://fammed2/genomics/Transcriptome.htm. A publicly available hippocampus SAGE catalog derived from young adult male Wistar rat brain (Datson et al, 2001) and containing approximately 30,000 different identified transcripts was used for comparison with our microvessel and cortex catalogs.
Real-Time Reverse Transcriptase (RT)-PCR
Primer pairs for real-time PCR were designed for selected cDNAs using Oligo 6.4 software (Molecular Biology Insights, Cascade, CO, USA) and are indicated in Supplementary Table 1. Complementary deoxyribonucleic acid was transcribed from total RNA using an Omniscript™ kit following the manufacturer's protocol (Qiagen, Valencia, CA, USA). Polymerase chain reaction reactions were performed on a LightCycler™ instrument using the LightCycler™ DNA Master SYBR® Green I kit following the manufacturer's protocol (Roche, Indianapolis, IN, USA). Before quantitative measurements of cDNA were performed, PCR reaction conditions for each primer set were optimized and melting curve analysis was used to confirm that each primer pair produced a single product. Standard curves for candidate cDNAs were prepared from a series of five 10-fold serial dilutions of target cDNA. The quantity of DNA in each sample was normalized to 18S ribosomal RNA (rRNA). The normalized average (n = 3) value from the microvessel samples was compared with the normalized average (n = 3) cortex value.
Summary of SAGE library content
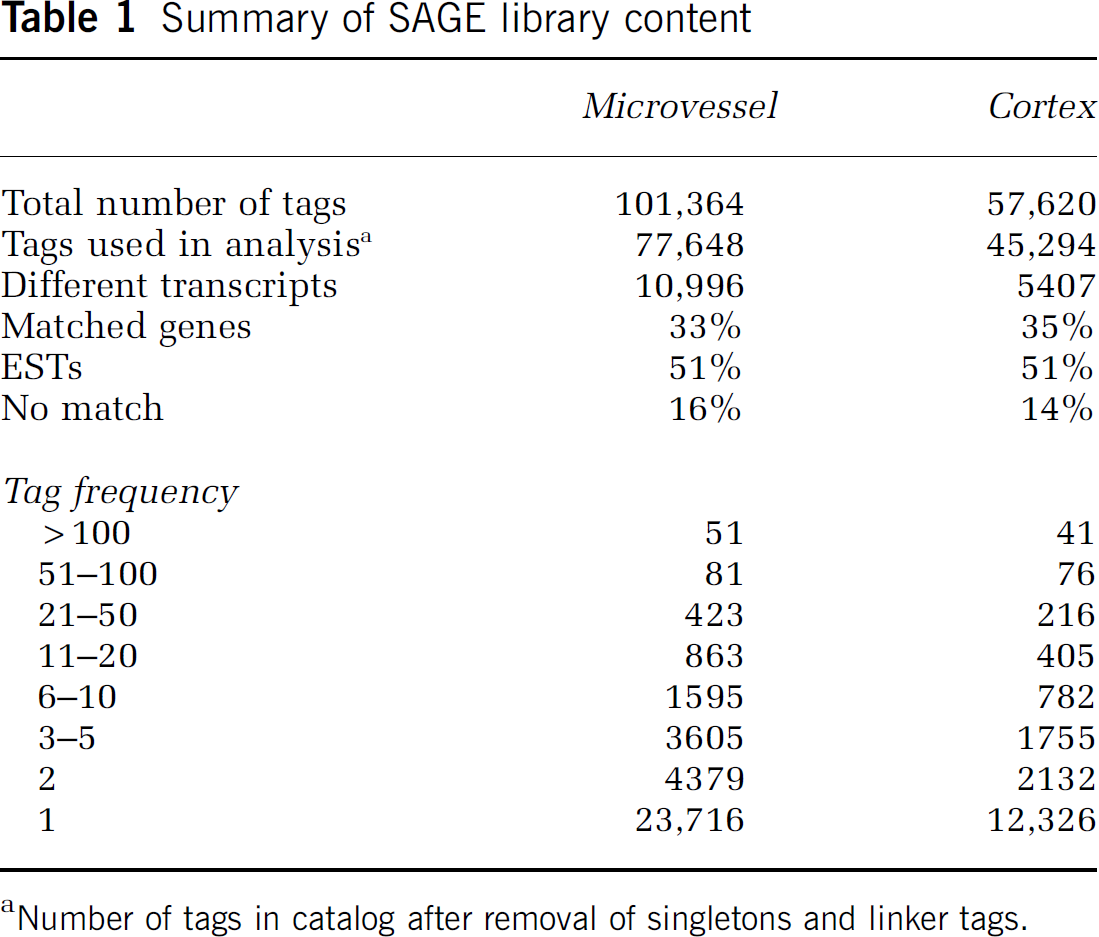
Number of tags in catalog after removal of singletons and linker tags.
Virtual Rot Analysis
The virtual Rot analysis was constructed as described previously (Blackshaw et al, 2001; Velculescu et al, 1997). EXCEL (Microsoft, Redmond, WA, USA) was used to plot different tag abundance levels against the cumulative fraction of total tags represented by that particular abundance level.
Results
Microvessel Isolation
Serial analysis of gene expression was performed on mRNA derived from microvessels to obtain a quantitative gene expression profile of the rat BBB. Serial analysis of gene expression was also performed on mRNA from rat cerebral cortex for use, in combination with other rat SAGE libraries, to identify genes enriched in the BBB.
The rat brain microvessel preparation is pure, as shown by lack of contaminating cells or tissues (Figure 1A). The microvessel preparation contains a mixture of cells, including endothelial cells and pericytes, that are together surrounded by a basement membrane. Astrocytic end feet attached to the basement membrane are also present in the preparation. Glucose transporter 1 (GLUT1), which is highly expressed in brain endothelium, was used as a marker to show the enrichment of the preparation (Pardridge et al, 1990). The low expression of S100beta, an astrocytic marker, in the microvessel fraction compared with the whole cortex fraction further establishes the overall purity of the microvessel preparation (Figure 1B) (Mrak et al, 1996). The levels of S100beta mRNA present in the sample indicate that transcripts derived from astrocytic end feet are present in our preparation, but represent a minor contribution to the SAGE library.
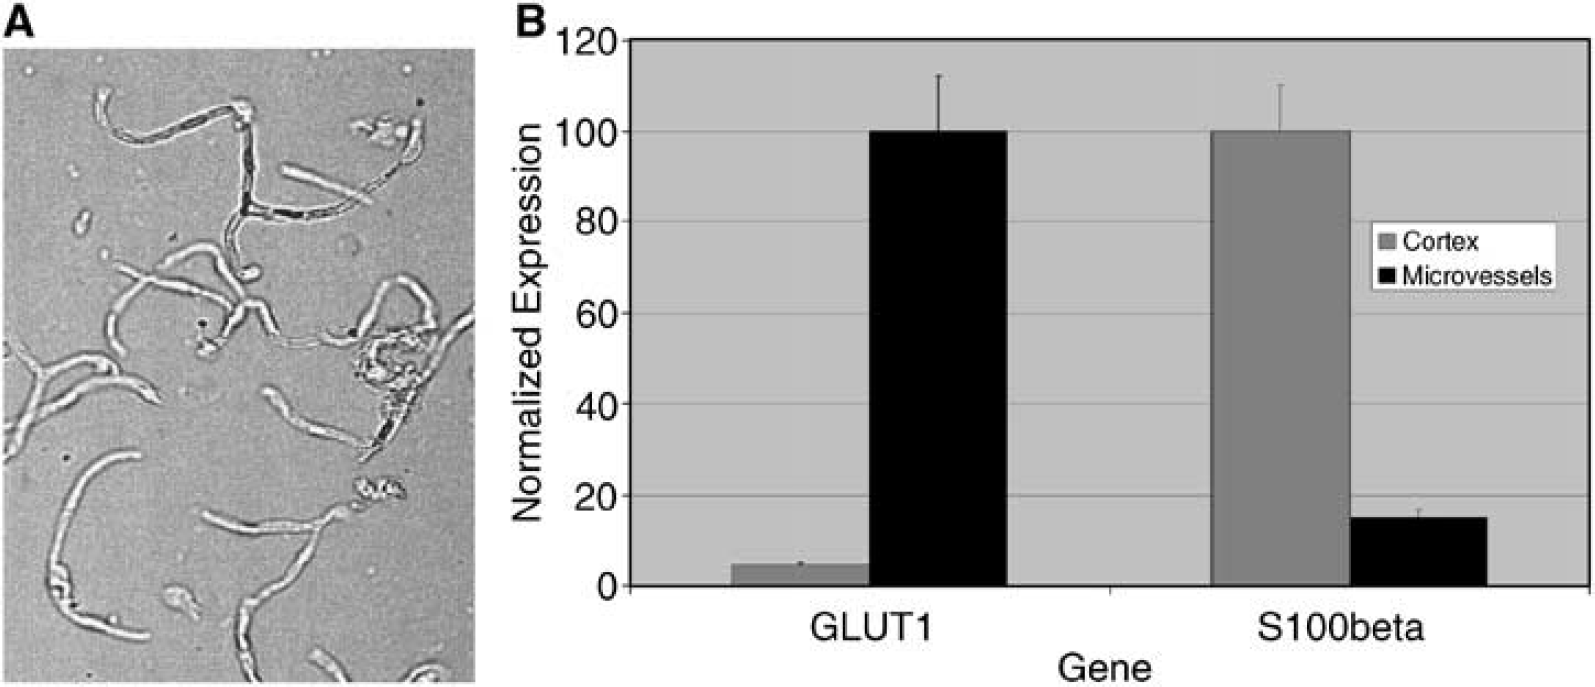
Isolated rat brain microvessels. Isolated rat brain microvessels. (
Serial Analysis of Gene Expression Library Statistics
Sequencing of SAGE tags from the microvessel and cortex SAGE libraries resulted in the assembly of catalogs containing 101,364 and 57,620 tags, respectively, per library (Table 1). Approximately 24% of the microvessel tags and 22% were observed only once. To minimize the possibility that these singleton tags were due to errors, the sequence data was scanned for low-quality sequence using the phred algorithm (Ewing and Green, 1998; Ewing et al, 1998). Regions of sequence with a low phred score (< 20) were trimmed and removed before tag extraction, adding confidence that the singleton tags represent mRNAs that are expressed at very low levels. In this report, we have limited further analysis to tags observed at a frequency of 2 or greater.
After singleton tags and linker tags were removed, the individual tags for unique transcripts were combined. The total number of different transcripts was 10,996 for the microvessel library and 5407 for the cortex library. The unique tags were compared with the NCBI gene-to-tag mapping data set (Rat Unigene Build 141, NCBI) to assign tags to specific genes (Lash et al, 2000). This analysis revealed that 33% of microvessel tags and 35% of cortex tags matched known genes, while 51% of both microvessel tags and cortex tags matched transcribed sequences (ESTs) in the Unigene database. The remaining 16% and 14% of tags in the microvessel and cortex libraries, respectively, could not be assigned to known genes or ESTs.
ROT Analysis
To determine whether the tags in the rat microvessel SAGE catalog were representative of an expected mRNA population, we performed a virtual Rot analysis (Supplementary Figure 1). A Rot analysis measures mRNA re-association kinetics to examine the relative fraction of mRNA composed of transcripts expressed at high, medium, and low levels. A virtual Rot performs the same type of analysis in silico. Our analysis of the relative fraction of total mRNA containing transcripts of different expression levels revealed several abundances classes that represented transcripts expressed at high, medium, or low levels spanning three orders of magnitude. When the virtual Rot of microvessel RNA was compared with an actual Rot analysis of mouse brain RNA, a strong similarity is revealed (Supplementary Figure 1).
Microvessel Catalog
Analysis of the 50 most abundant tags in the microvessel catalog reveals that seven tags are derived from mitochondrial genes and several from transcripts of ribosomal proteins (Table 2). Other notable tags identified are SPARC (osteonectin), basigin (Bsg, CD147), and apolipoprotein E (Apoe), which are known to be abundantly expressed at the BBB. Myelin basic protein (Mbp), although recognized as an oligodendroglial product, is also relatively abundant in the brain microvessel catalog, a finding that corroborates a previous report that brain endothelial cells express this unique transcript (Li et al, 2002). Transcripts for structural proteins, such as cofilin 1 and alpha tubulin, are also among the top 50 list.
Catalog of the 50 most abundant tags in rat brain microvessels
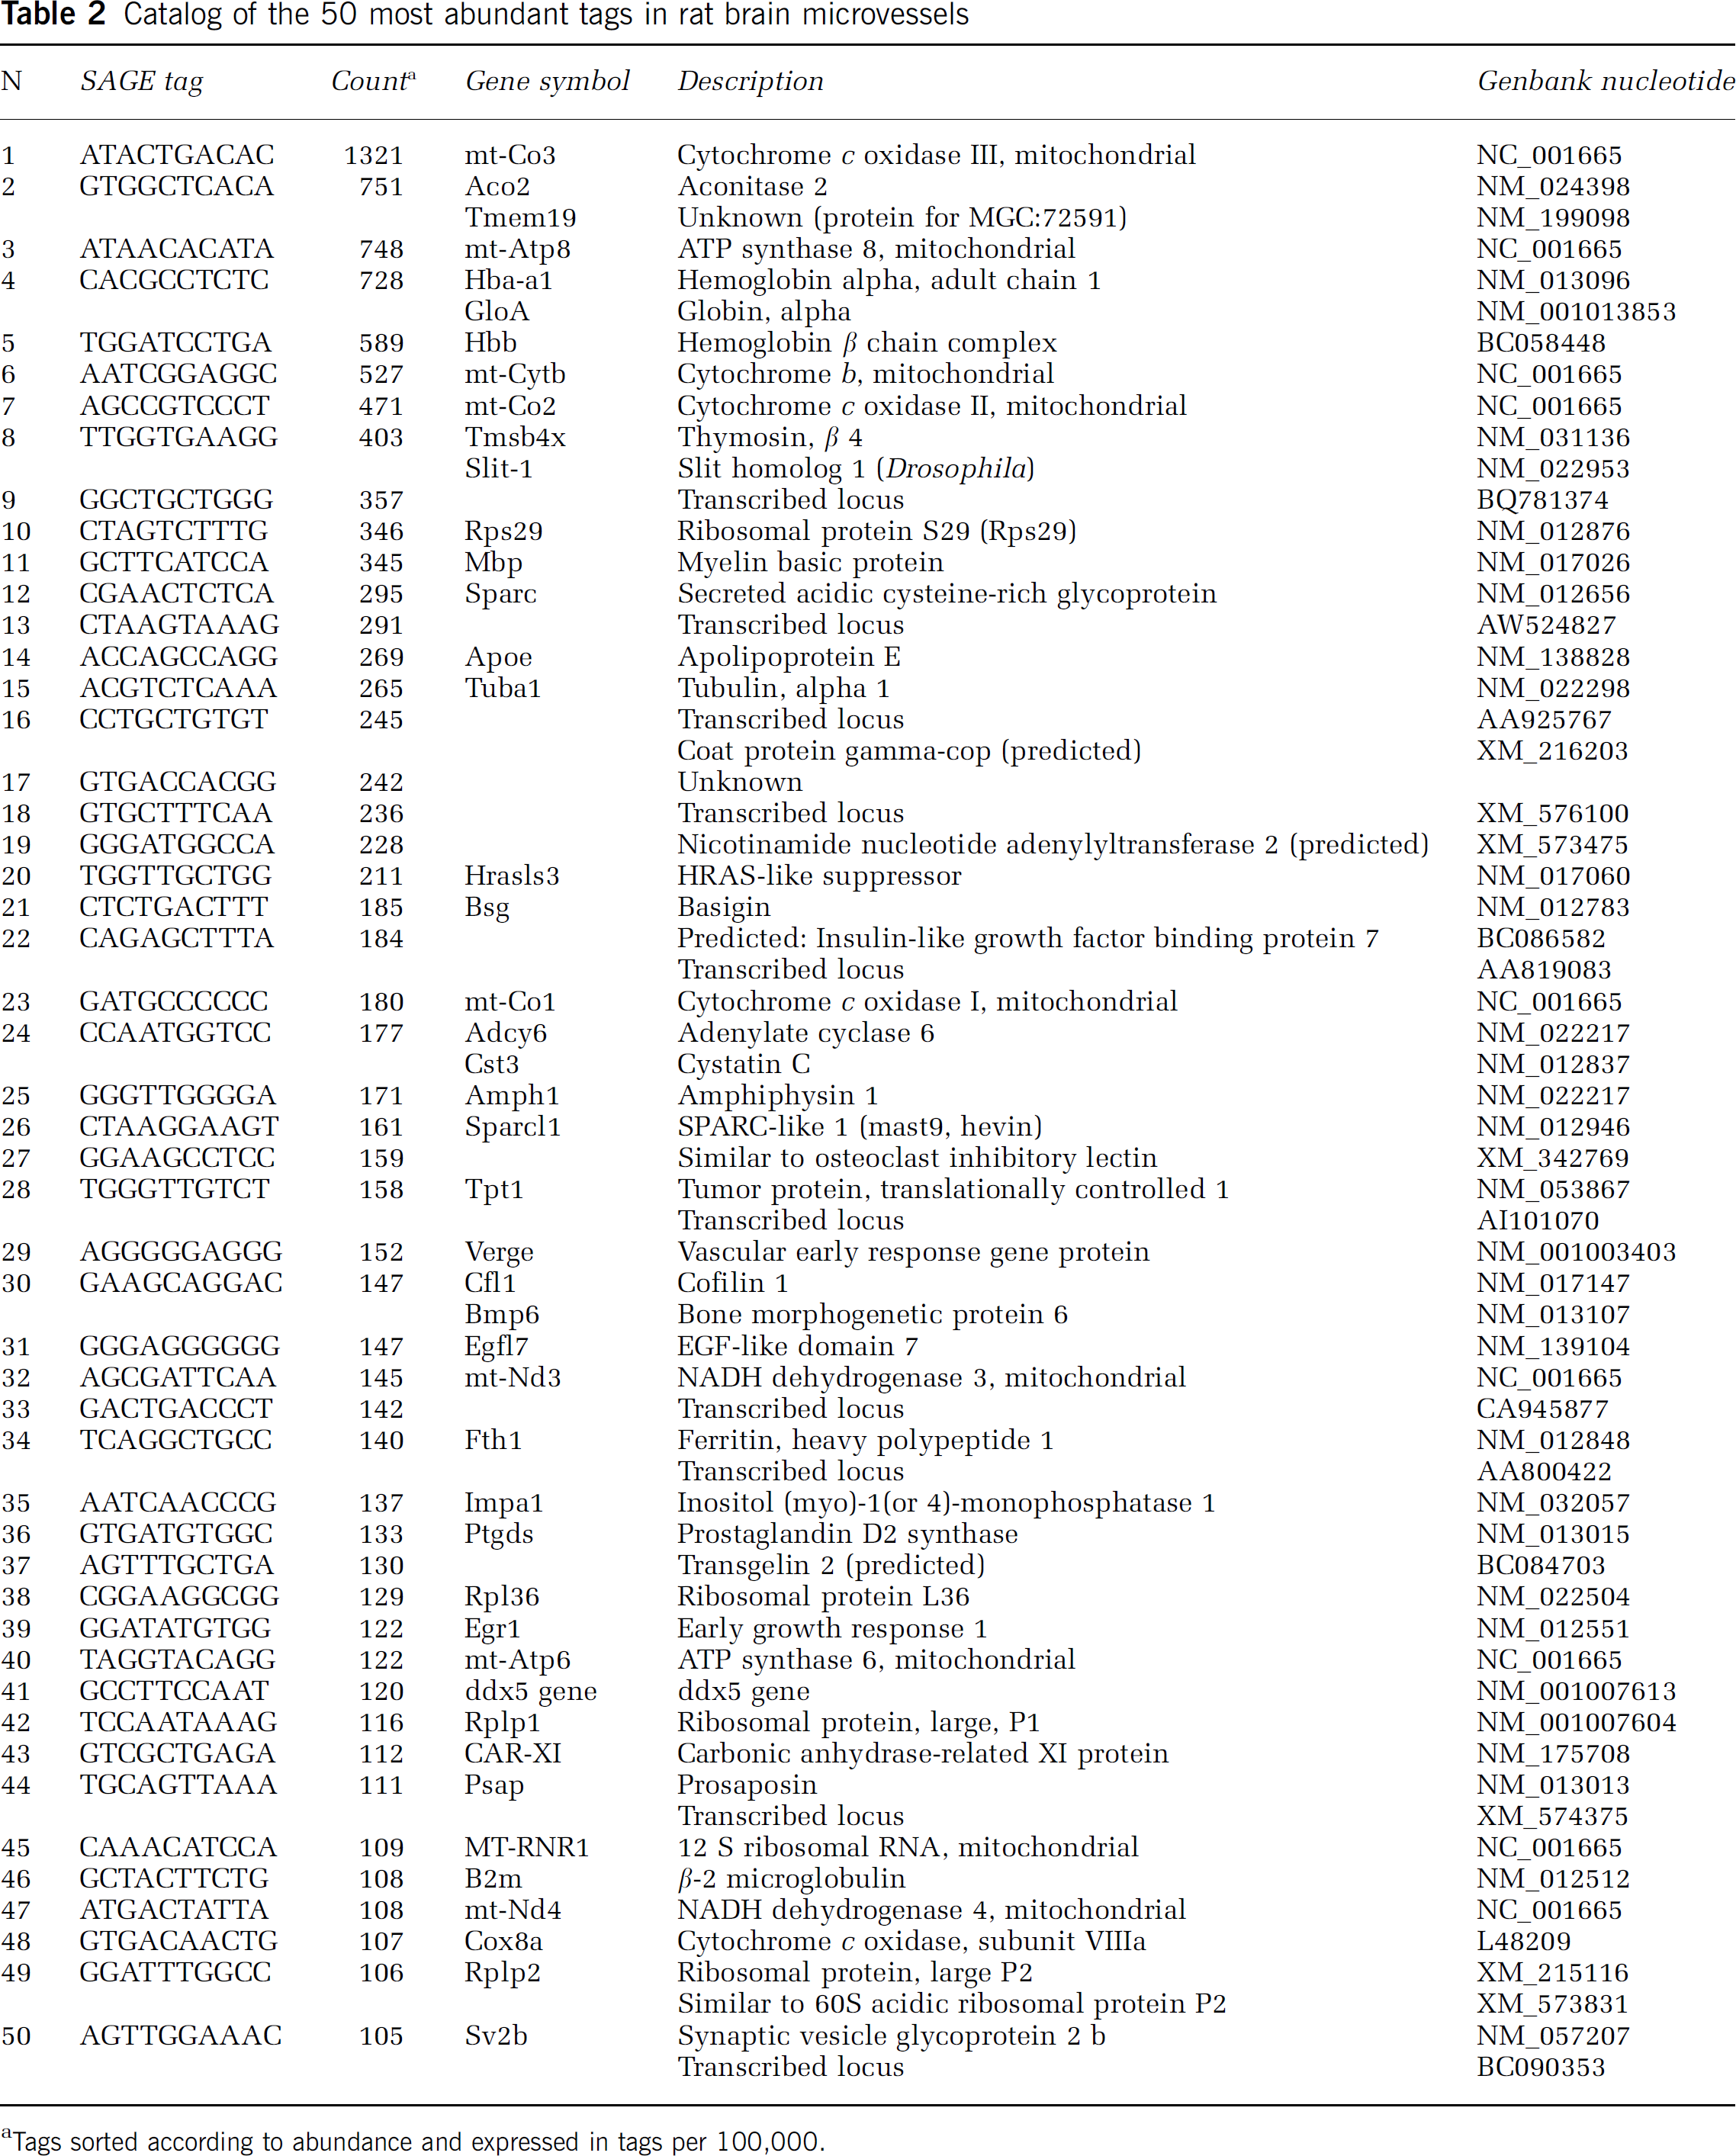
Tags sorted according to abundance and expressed in tags per 100,000.
The catalog was examined for the presence of genes associated with the BBB phenotype, including tight junction and adhesion proteins (Table 3), members of the Slc transporter families (Slc members; Table 4), and ATP-dependent transporters (ATP-binding cassette, ABC transporters; Table 5). Tags for transcripts encoding proteins of three major types of cell-cell junctional complexes are represented in the catalog, including tight junctions (claudins, occludin, junctional adhesion molecules, zona occludens proteins), adherins junctions (cadherins, protocadherins), and gap junctions (connexins). Several nutrient transporters expected in brain microvessels are abundantly expressed in the catalog and the variety of carrier proteins is remarkably extensive (Table 4). ATP-dependent transporters, including several that are implicated in drug transport into and from cells, are also expressed (Table 5).
Tight junction and adhesion tags present in microvessel SAGE catalog
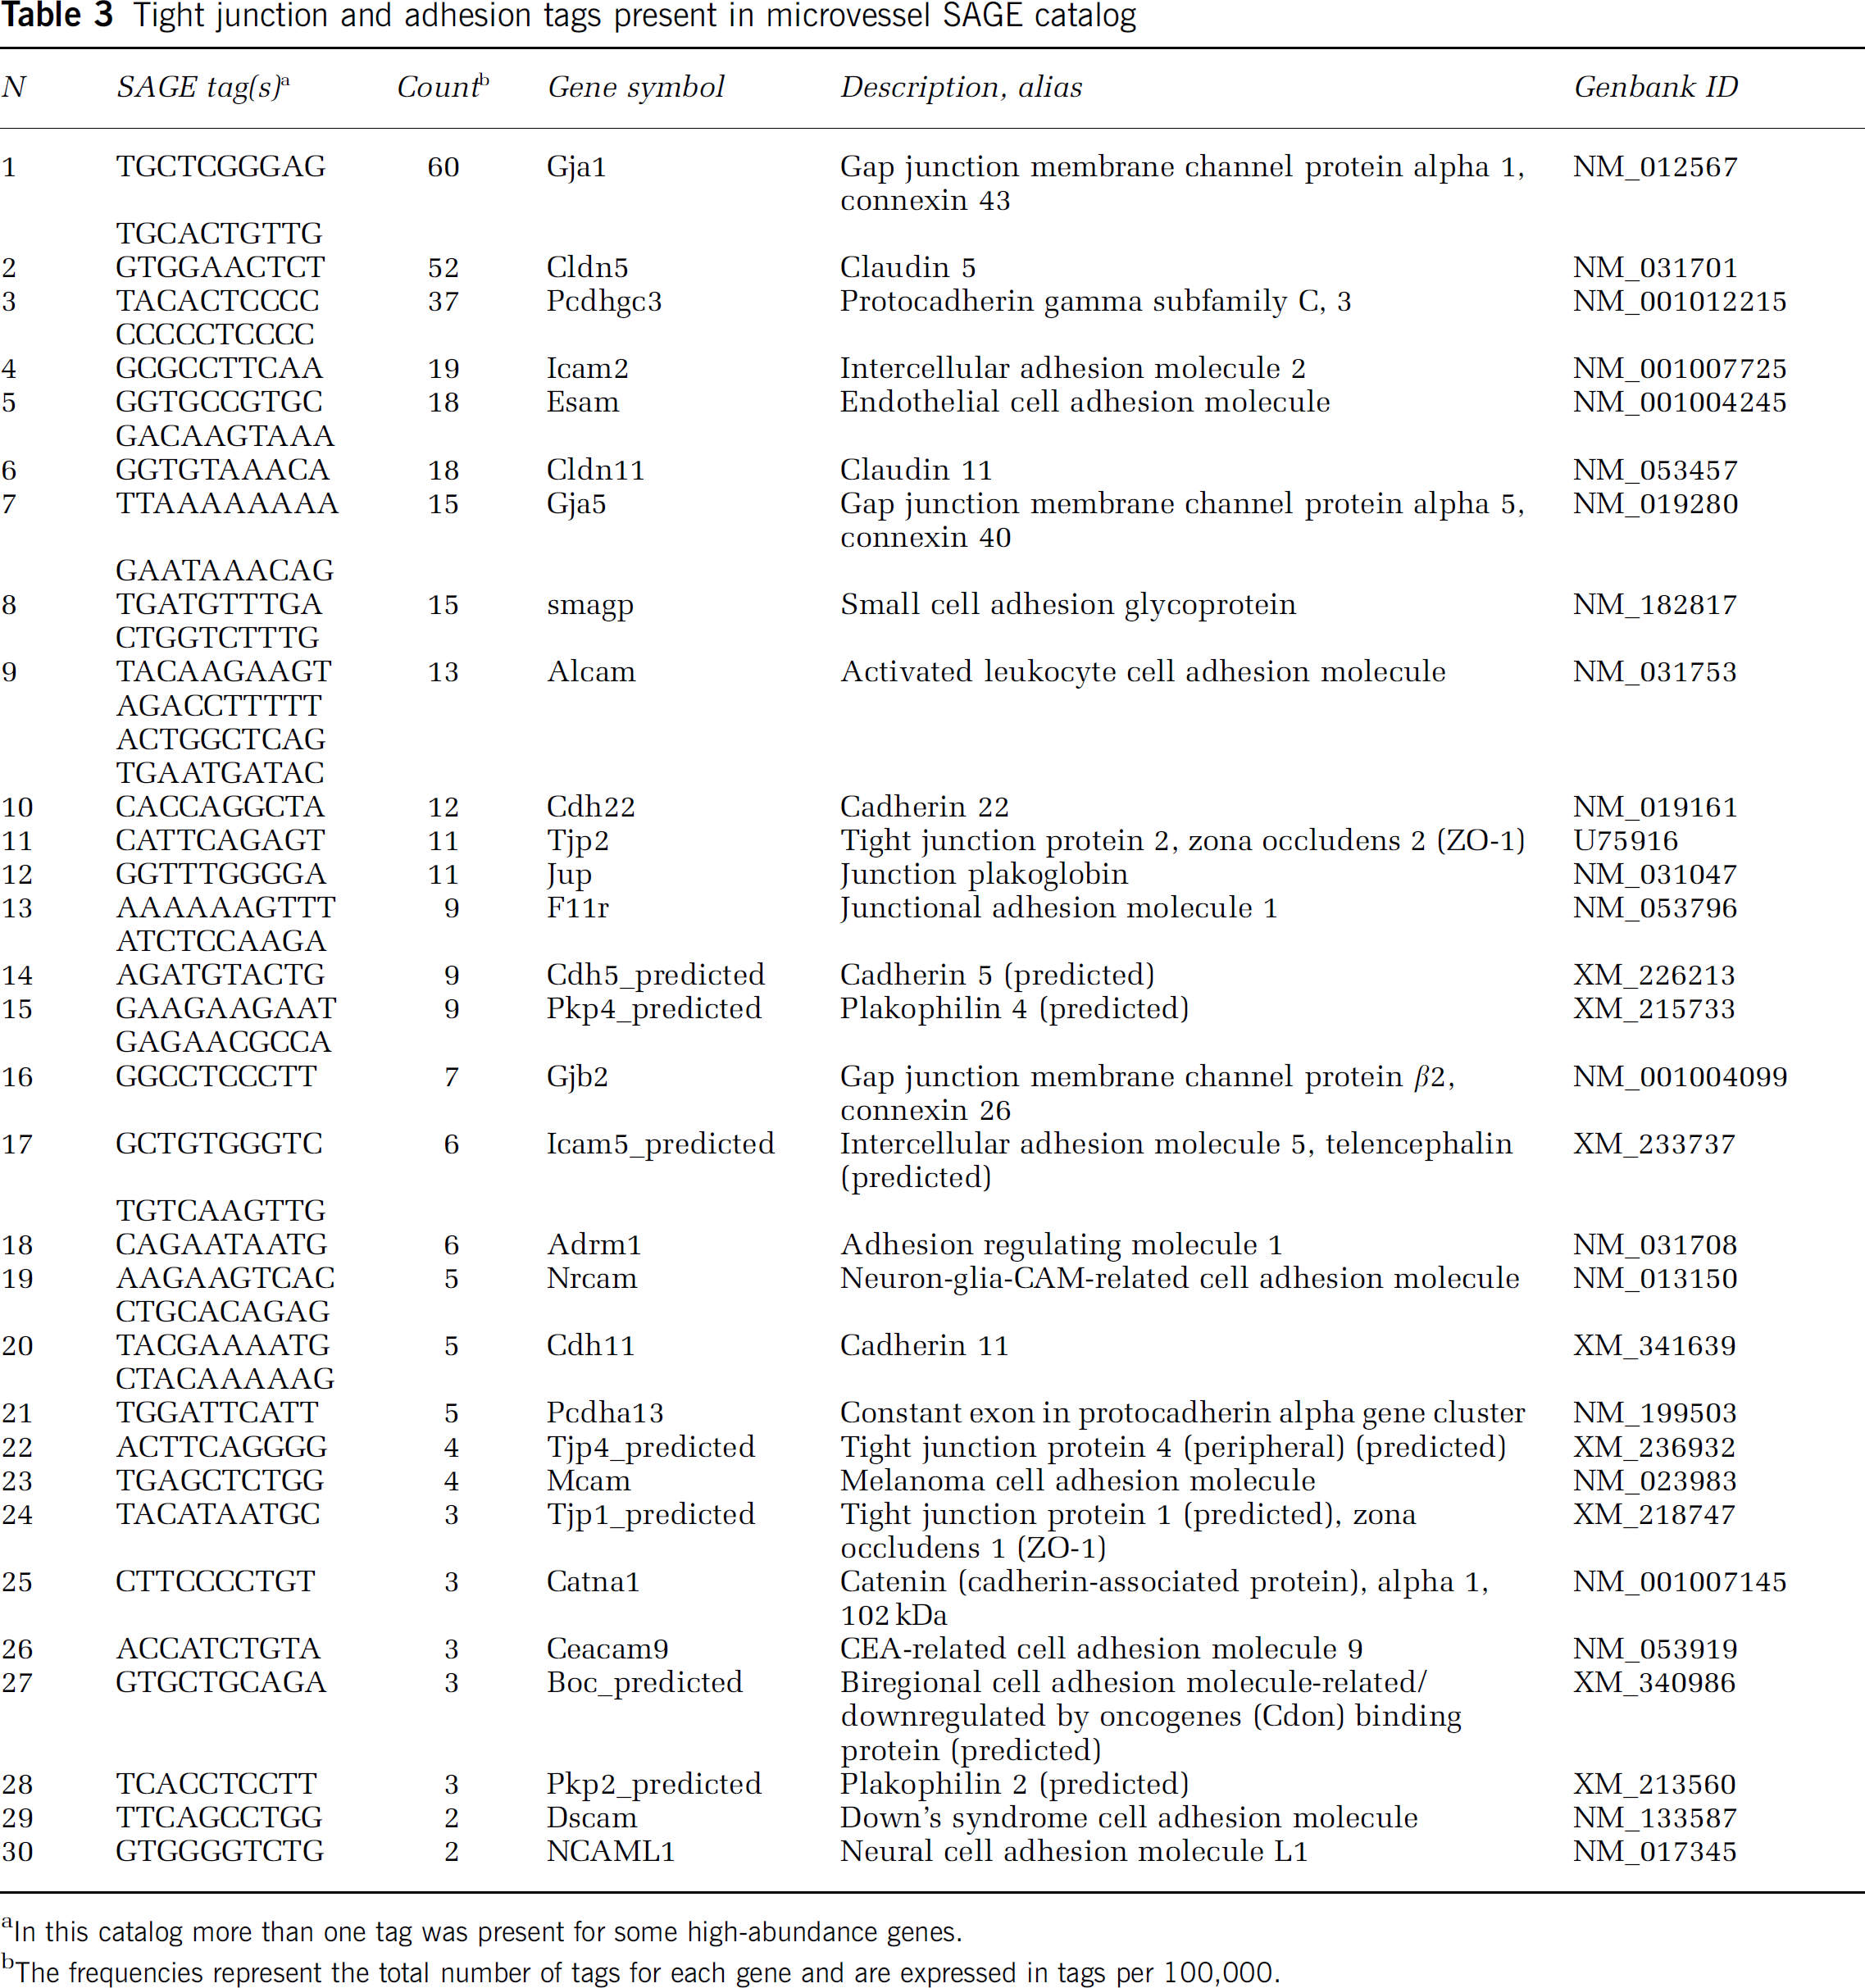
In this catalog more than one tag was present for some high-abundance genes.
The frequencies represent the total number of tags for each gene and are expressed in tags per 100,000.
Tags identifying transporters in the microvessel SAGE catalog
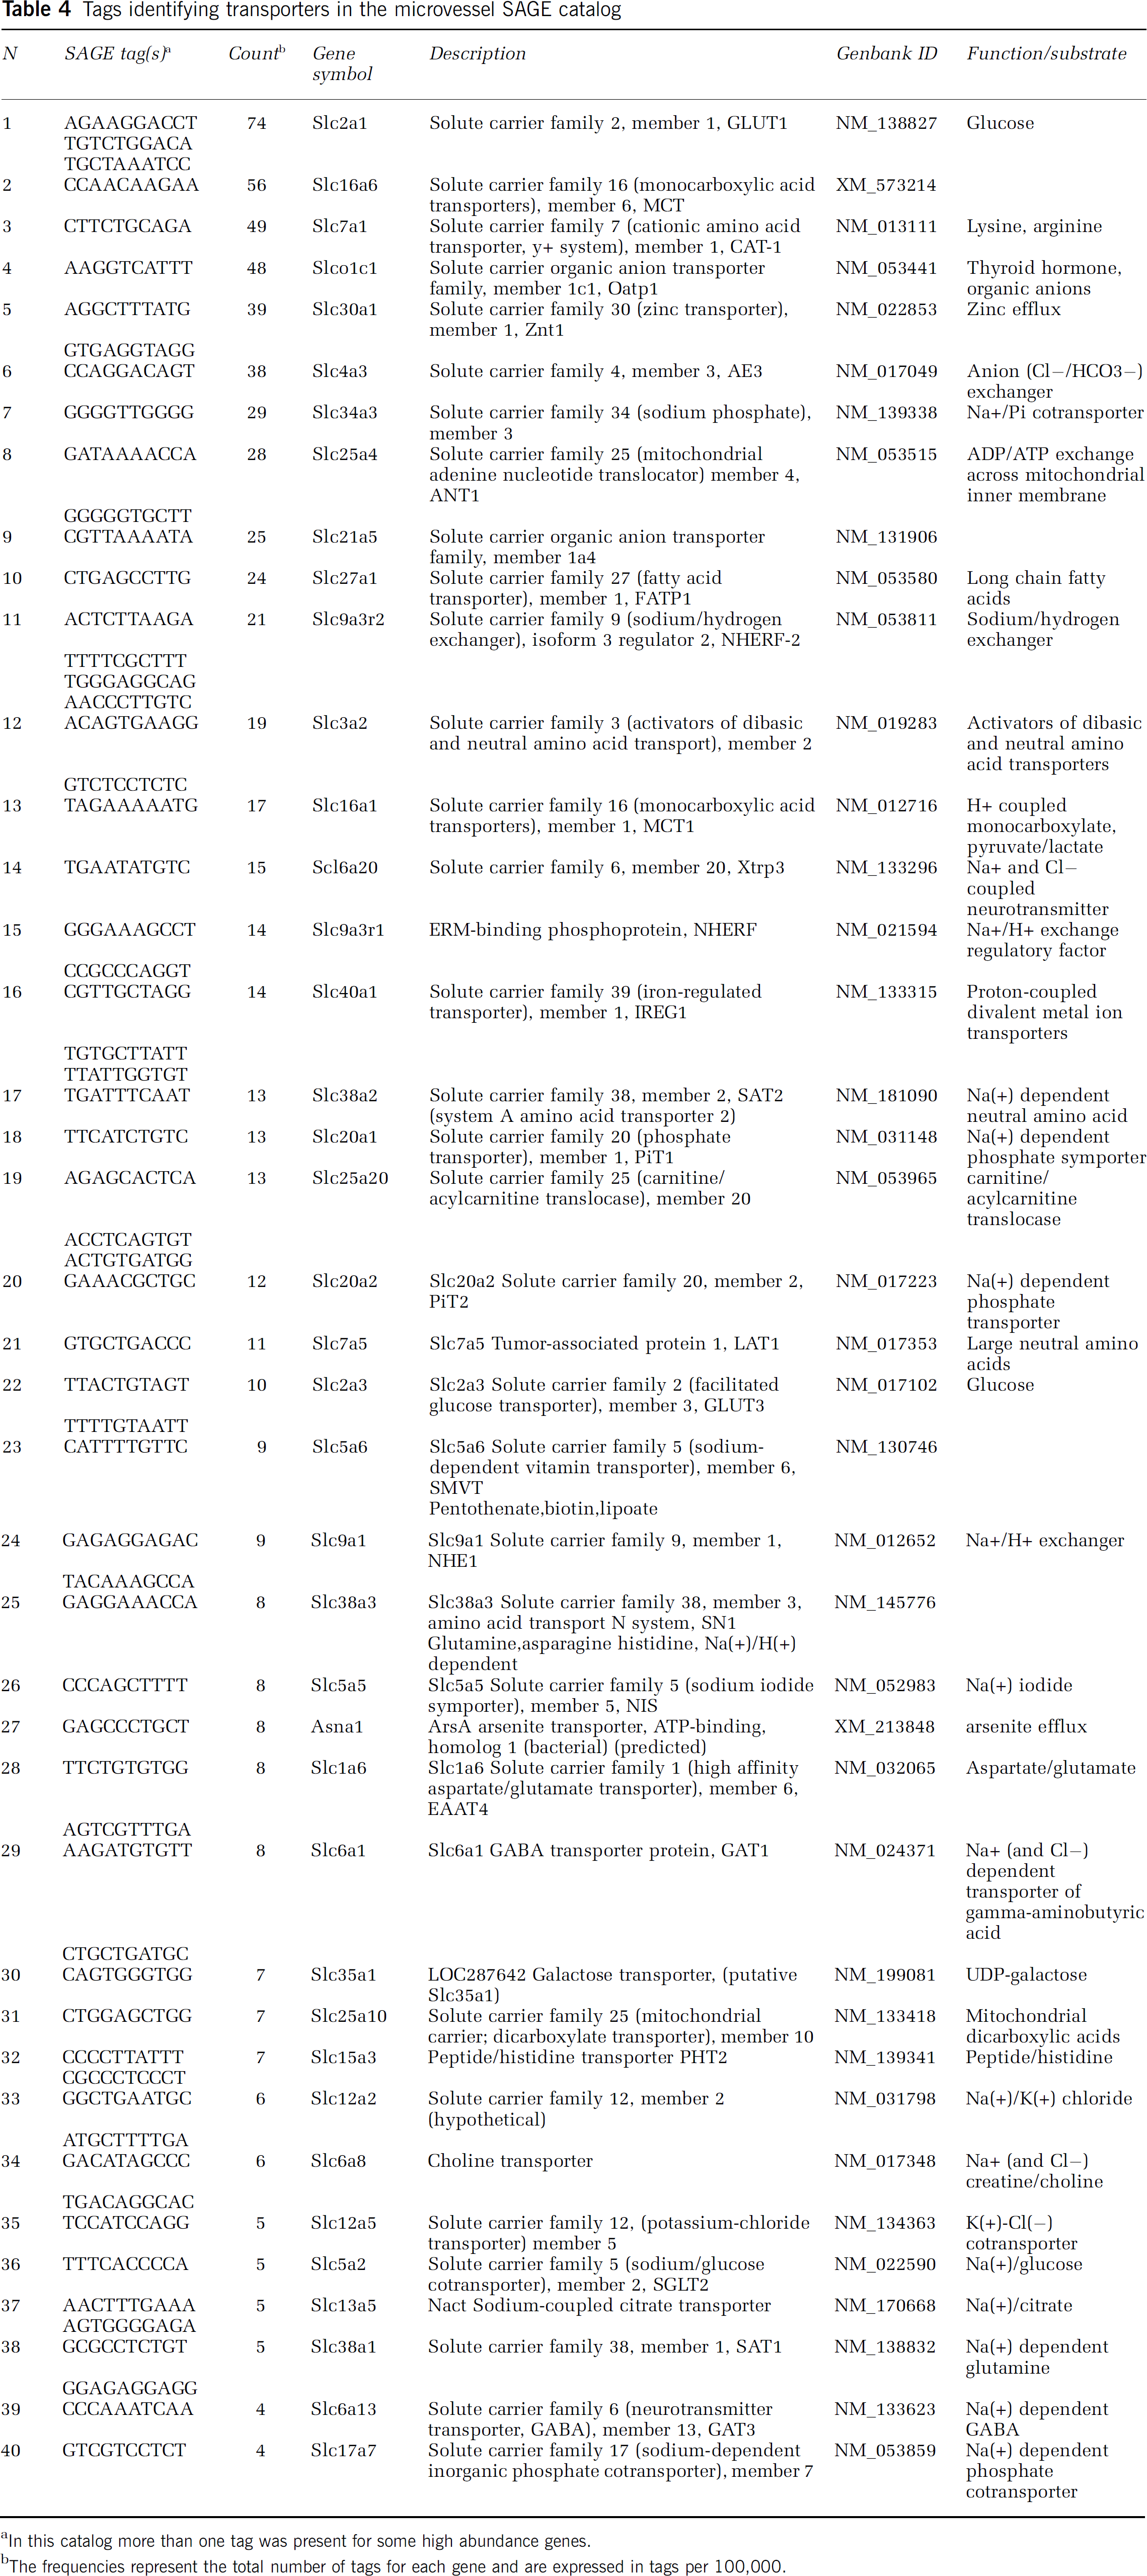
In this catalog more than one tag was present for some high abundance genes.
The frequencies represent the total number of tags for each gene and are expressed in tags per 100,000.
ATP-binding cassette SAGE tags in the microvessel catalog
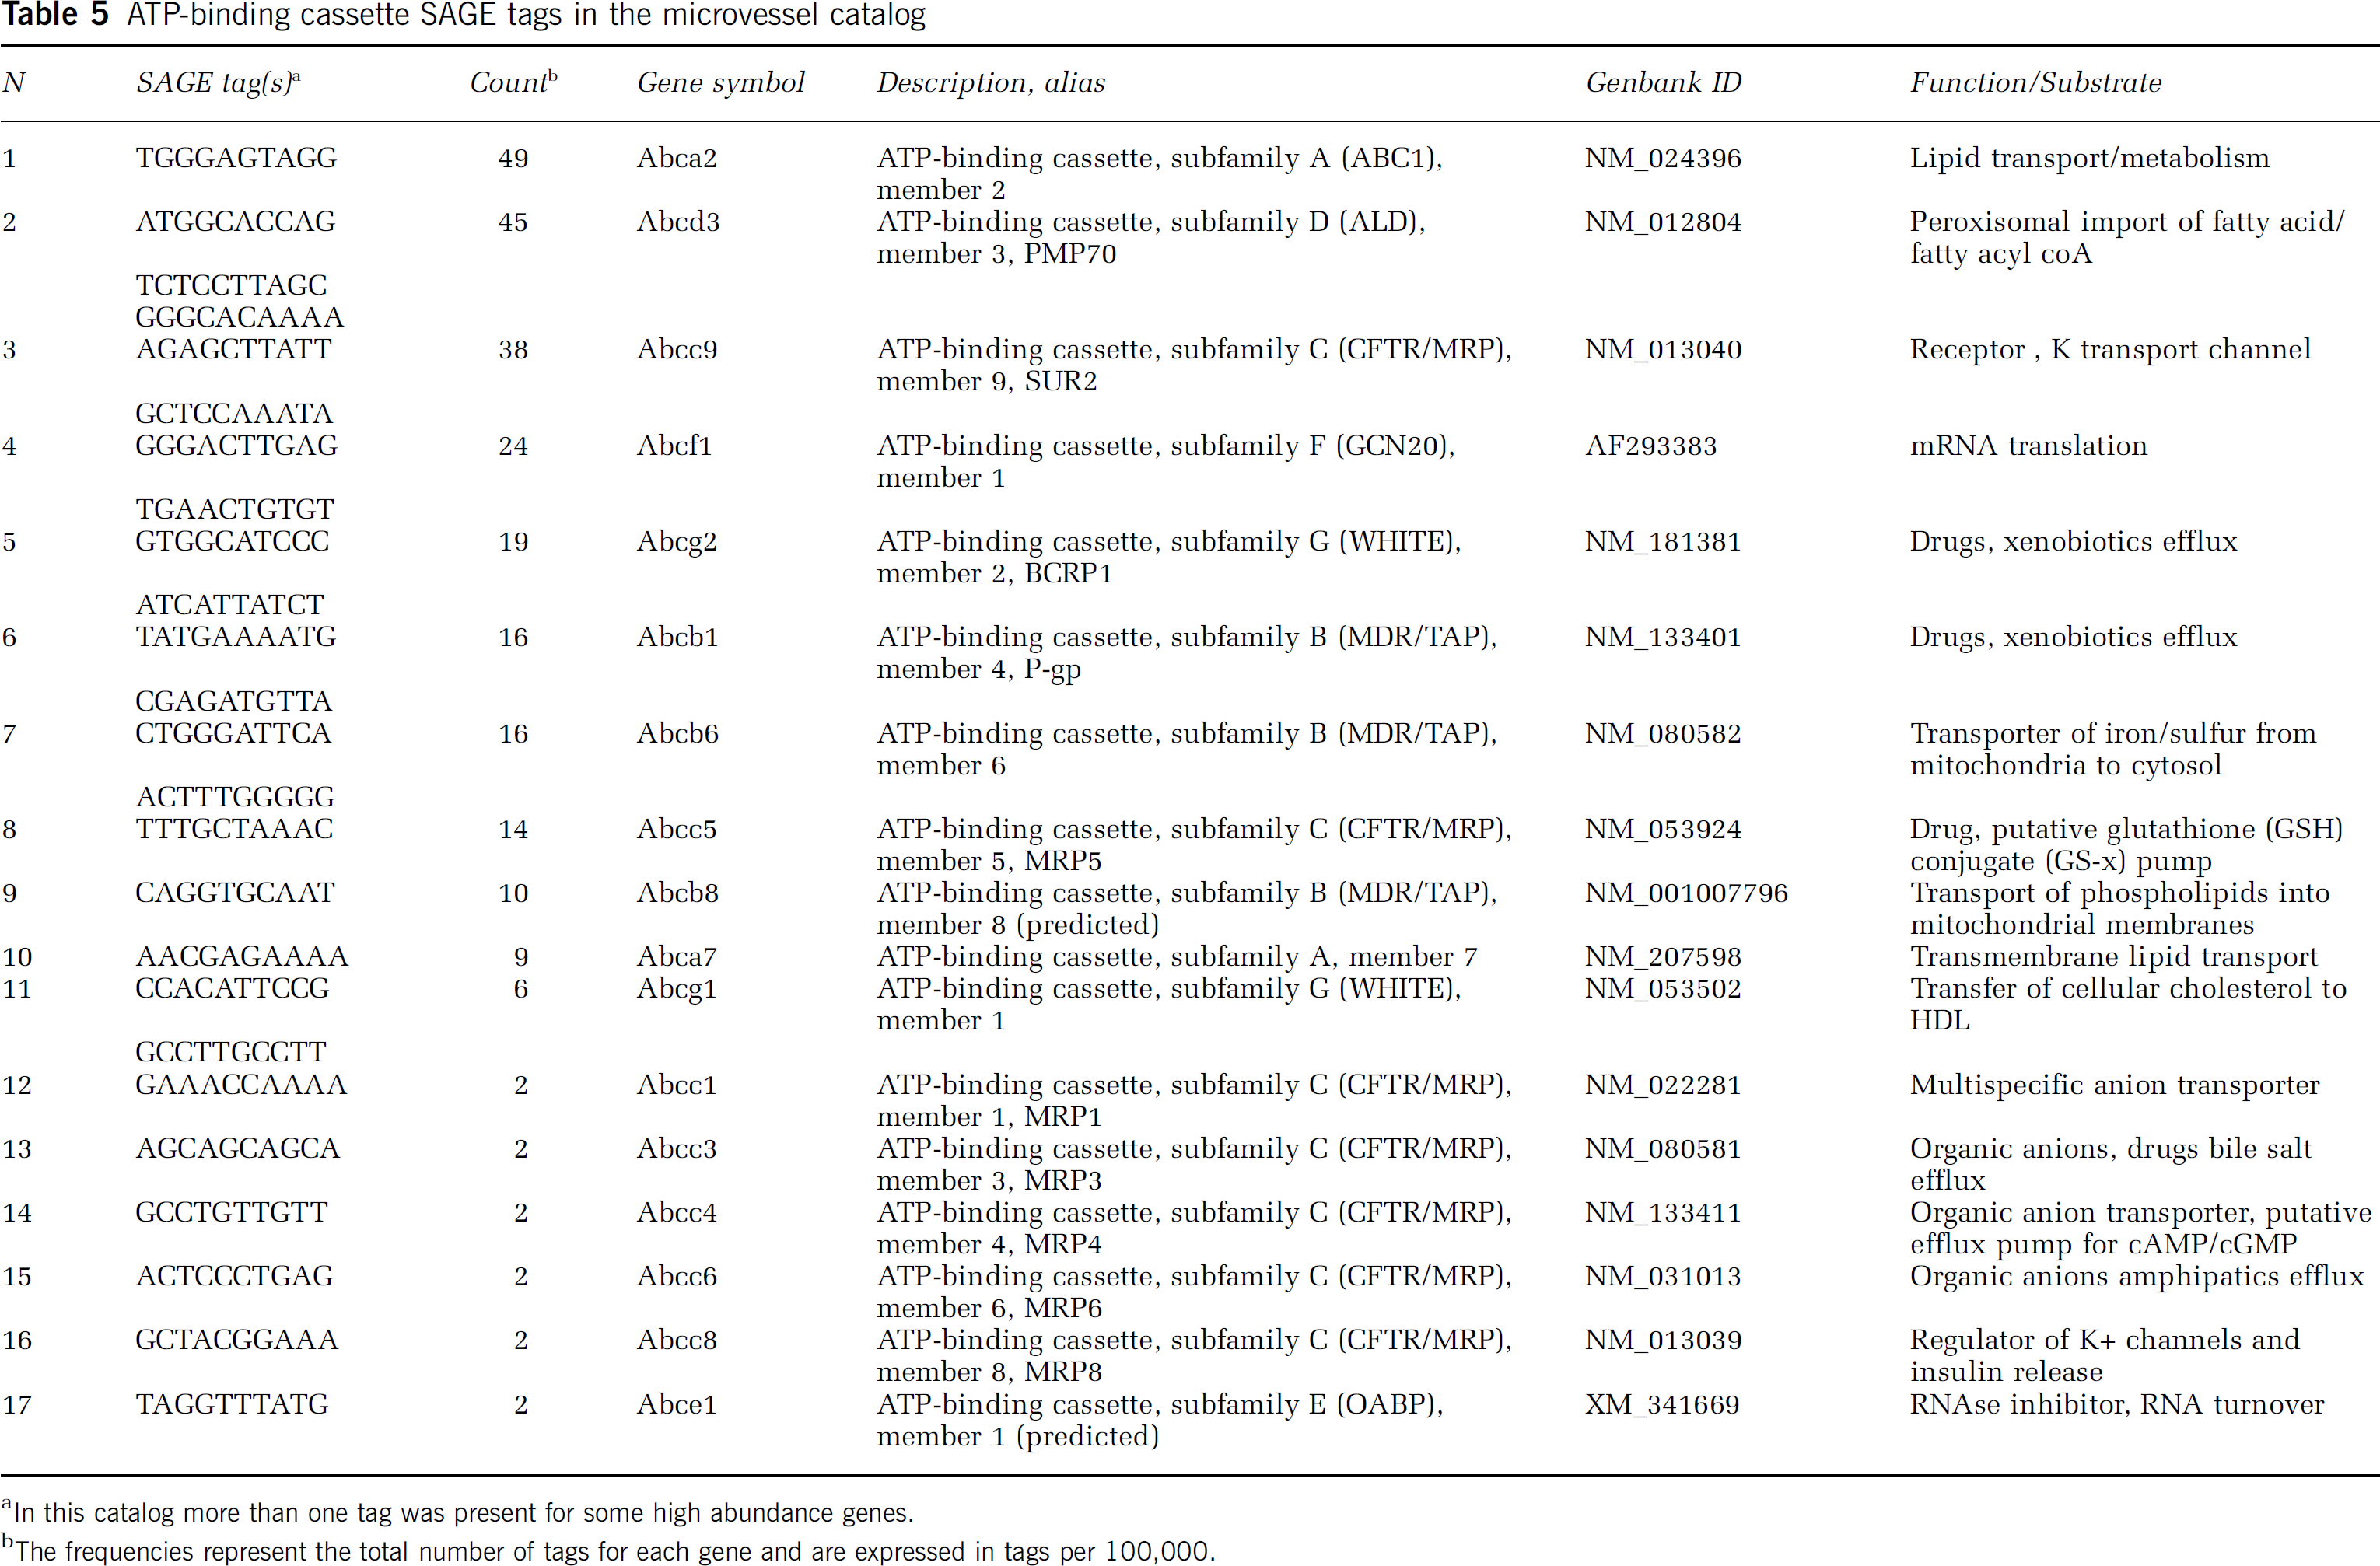
In this catalog more than one tag was present for some high abundance genes.
The frequencies represent the total number of tags for each gene and are expressed in tags per 100,000.
Identification of Microvessel-Enriched Tags
To identify tags for genes that are enriched in microvessels, we compared the microvessel catalog to the cortex catalog and the rat hippocampus catalog generated by Datson et al (2001). Tags with an abundance ratio of at least 10 between the microvessel preparation and either the cortex catalog or the hippocampus catalog were considered enriched. Tags not found in a catalog were assigned an arbitrary value of 1 to avoid division by 0 in the fold difference calculation. In addition, for a gene to be considered enriched, a subjective threshold of expression was set after it was normalized to the total tag count in its respective catalog. A threshold of 50 tags per million was set as the cutoff. As the catalogs were of unequal sizes, to be considered for the enriched pool a microvessel tag had to be represented six times, a hippocampal tag five times, and a cortex tag four times in their respective catalogs. The results of this approach show that, of the 17,440 tags present in all catalogs, 864 are enriched in brain microvessels (Figure 2).
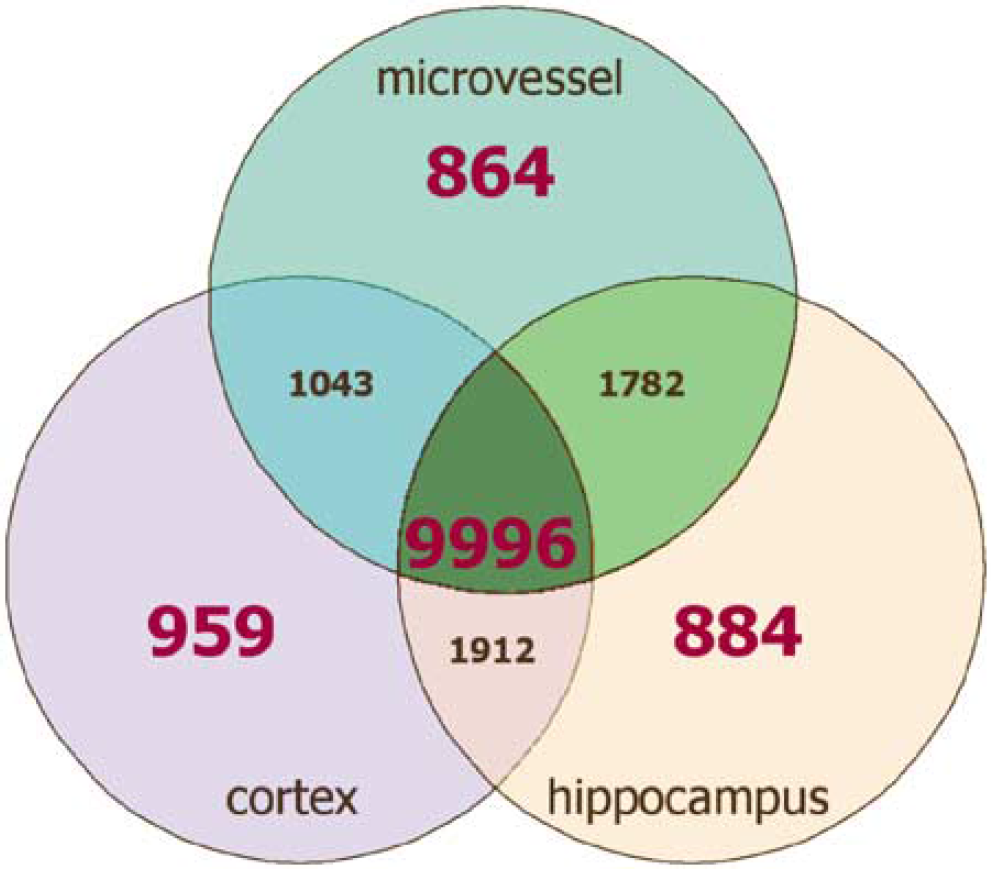
Venn diagram comparing the rat microvessel, cortex, and hippocampus SAGE libraries. Tags with an abundance ratio of at least 10 between the microvessel preparation and either the cortex library or the hippocampus library were considered enriched. Tags not found in a library were assigned an arbitrary value of 1 to avoid division by 0 in the fold difference calculation. In addition, for a gene to be considered enriched, a threshold of 50 tags per million was set as the cutoff.
The 864 tags enriched in the microvessel SAGE catalog were annotated by comparisons to the UniGene reliable tag-to-gene-mapping data set. Only 31% of the microvessel-enriched tags correspond to known genes, while 61% matched transcribed sequences (ESTs) in the Unigene database (Figure 3A). Tags that did not match any sequence in the database represented 8% of the enriched pool. The assignment of a functional category for the proteins encoded by the mRNAs identified in our analysis was primarily based on the gene ontology database (http://www.geneontology.org).
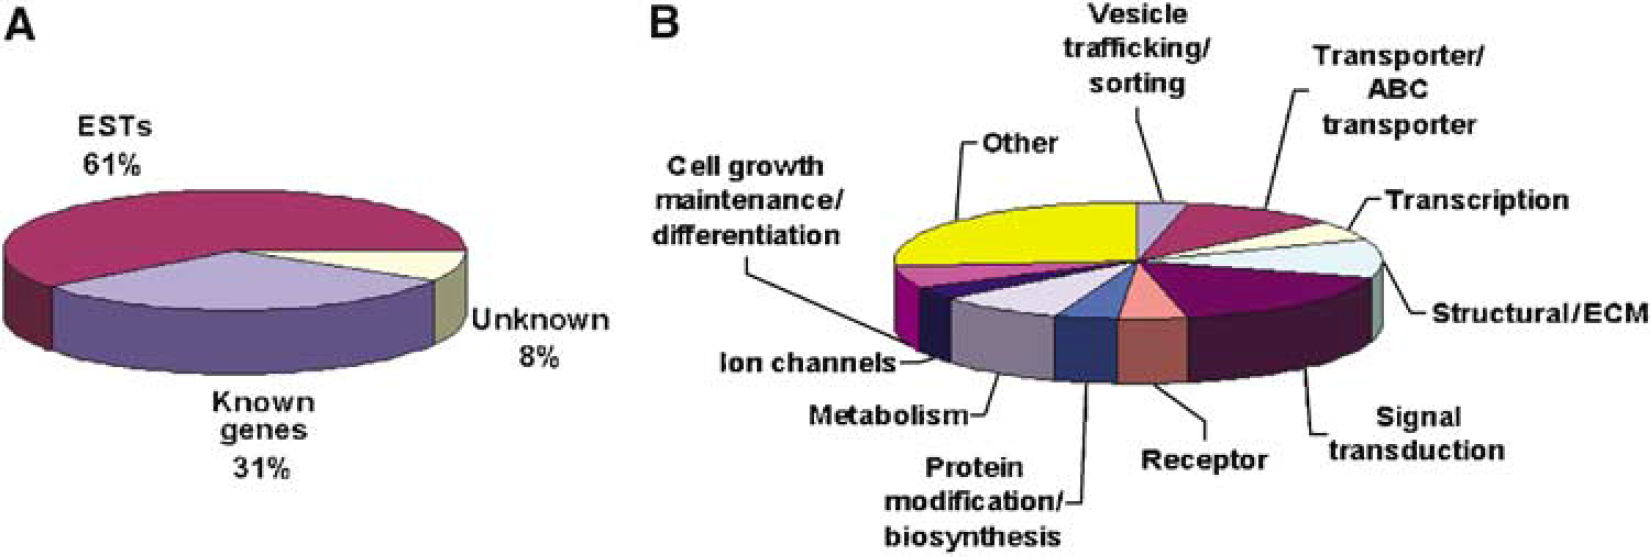
Distribution of microvessel-enriched genes based on functional classification. (
Of the known genes in the enriched catalog, a large percentage of the tags identify mRNAs for transporters, receptors, and proteins involved in signal transduction, vesicle trafficking, and the extracellular matrix (Figure 3B). Analysis of the 50 most abundant tags in the microvessel-enriched catalog (Table 6) reveals a number of expressed genes known from previous studies to be enriched in the brain endothelium. These include the transferrin receptor (TfR), GLUT1 (Slc2a1), claudin 5, cationic amino acid transporter-1 (CAT-1), organic anion transporter-1 (Oatplcl), vonWillibrandt factor (vWF), and the VEGF receptor-1 (Flt-1).
Catalog of the 50 most abundant tags enriched in rat brain microvesselsa
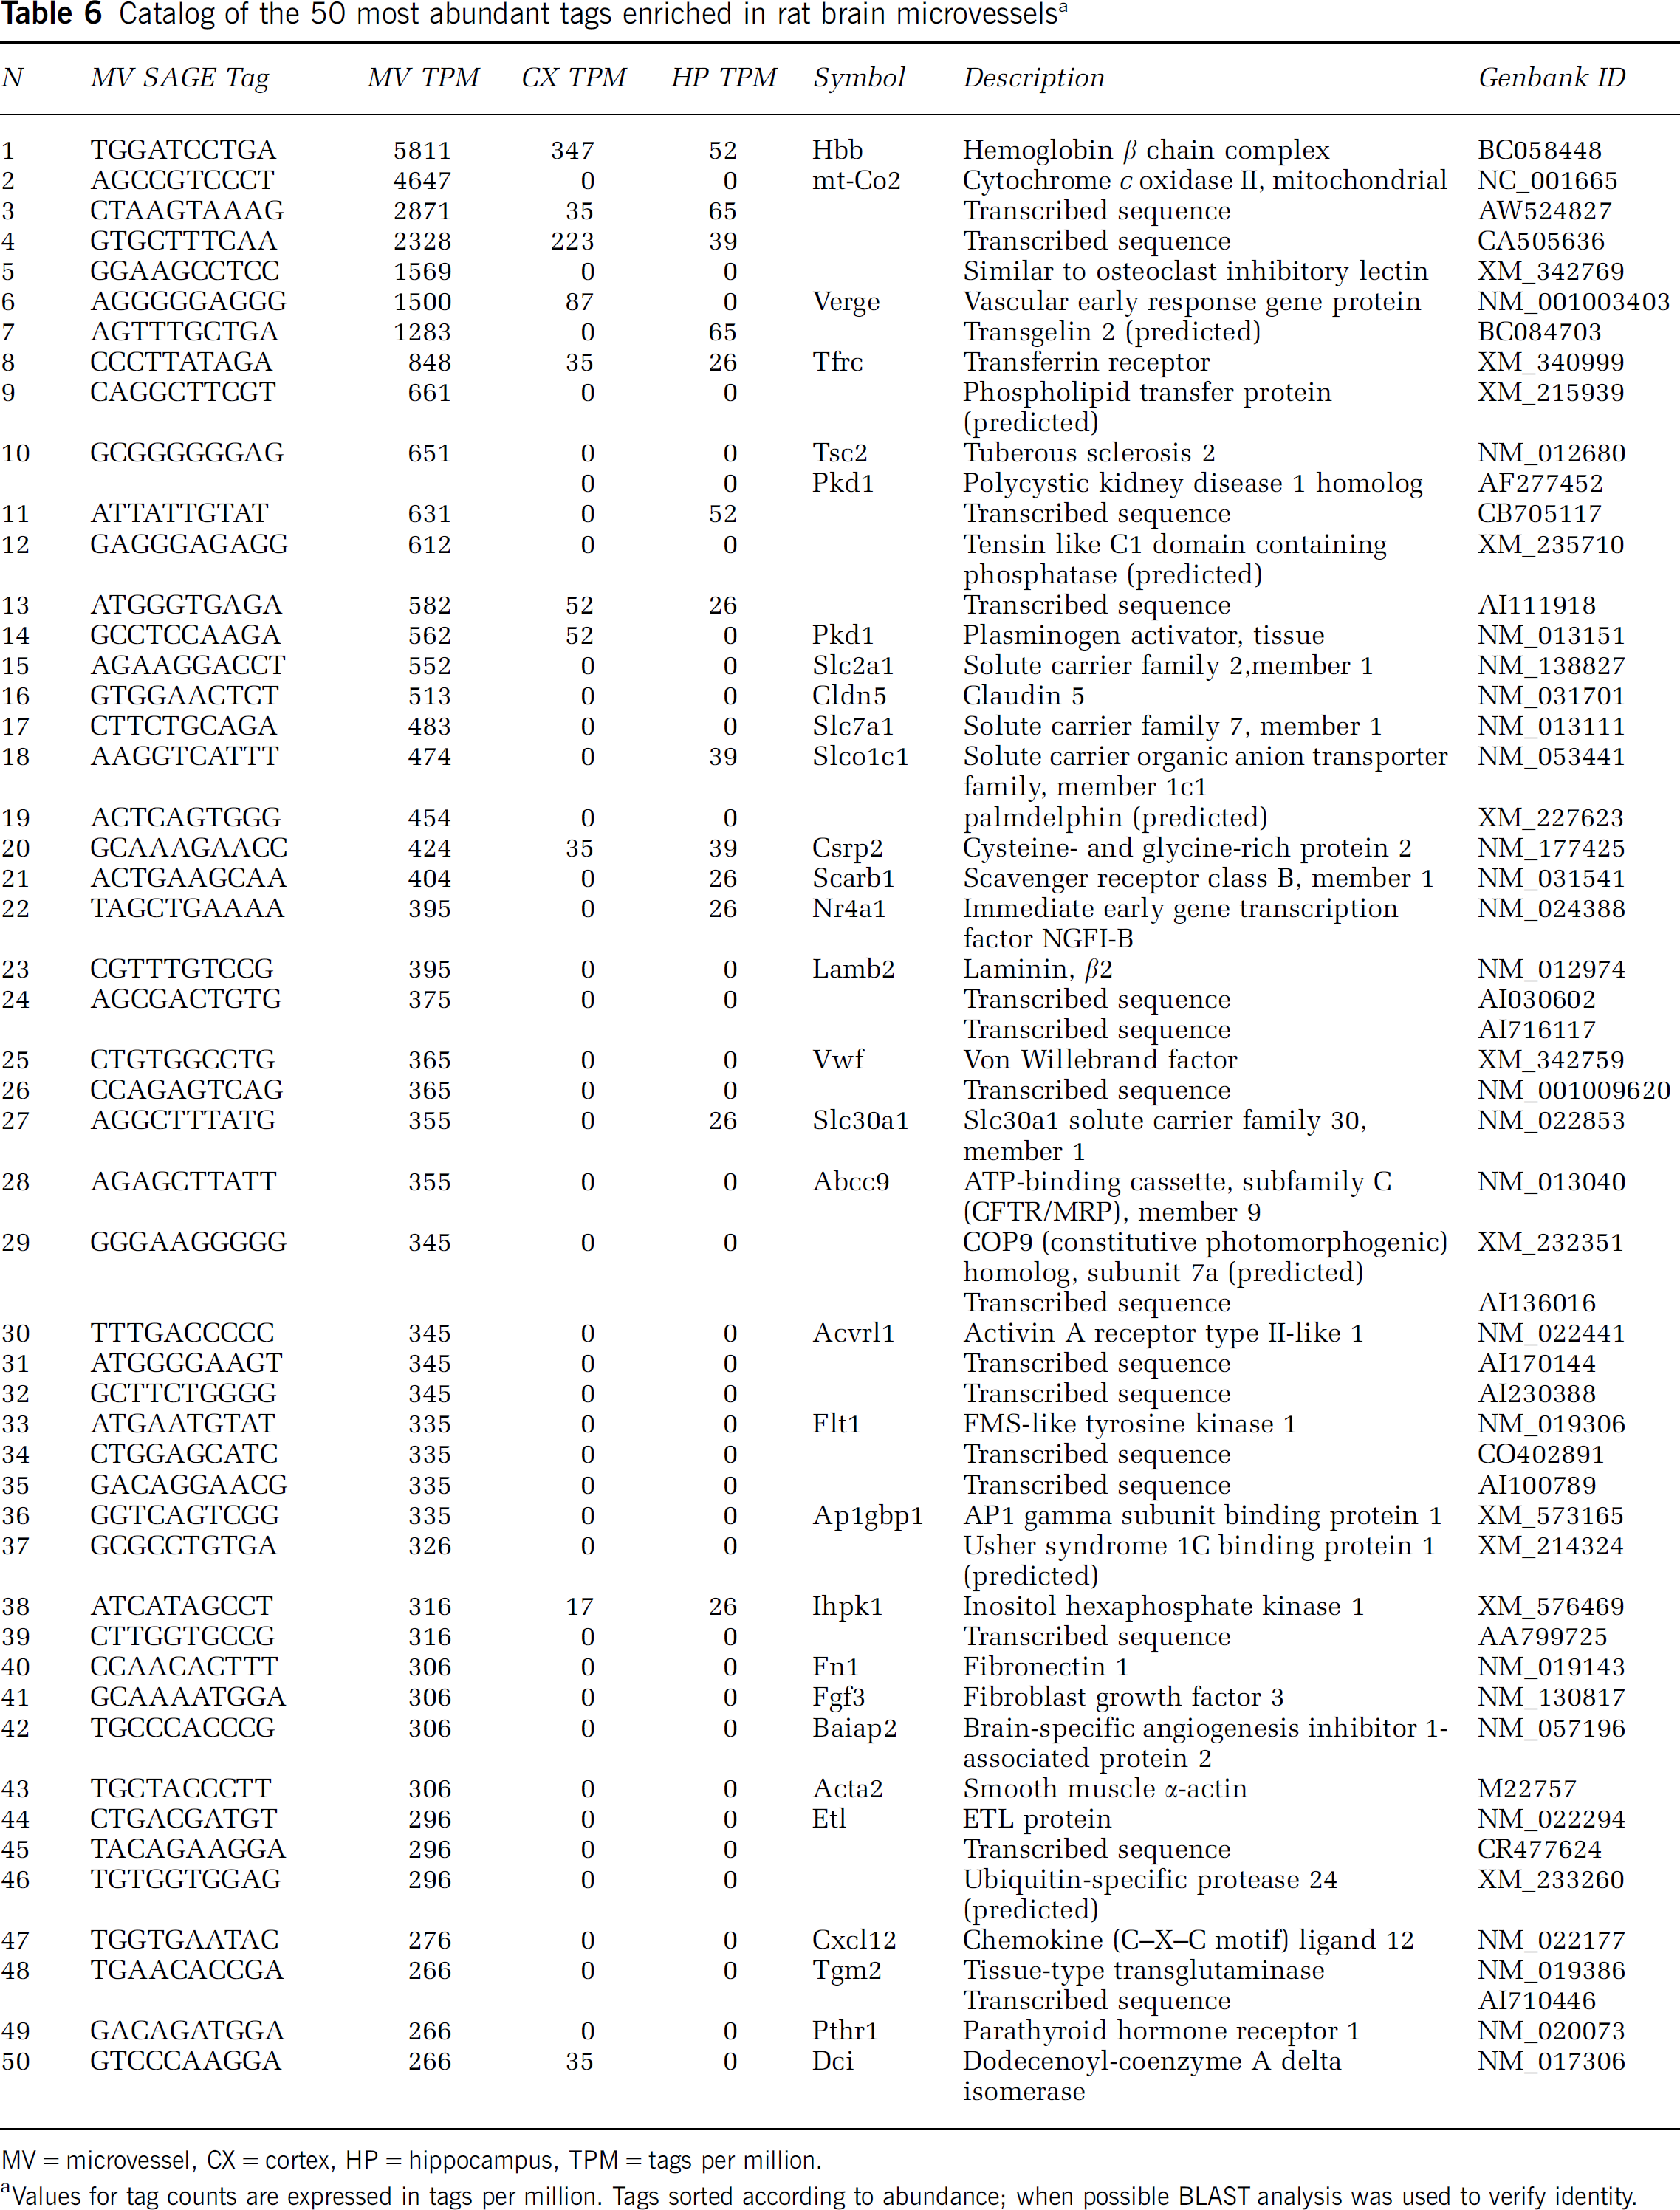
MV= microvessel, CX = cortex, HP = hippocampus, TPM = tags per million.
Values for tag counts are expressed in tags per million. Tags sorted according to abundance; when possible BLAST analysis was used to verify identity.
Real-Time Polymerase Chain Reaction Analysis
Real-time PCR analysis was used to confirm microvessel enrichment of select genes (Figure 4). Analysis of six genes verified the enrichment and presence of β-hemoglobin, SPARC (osteonectin), GLUT1, monocarboxylate transporter 1 (MCT1), and CD36 in the microvessel preparation when compared with cortex. Cytochrome c oxidase II was determined to be more highly expressed in cortex than microvessels.
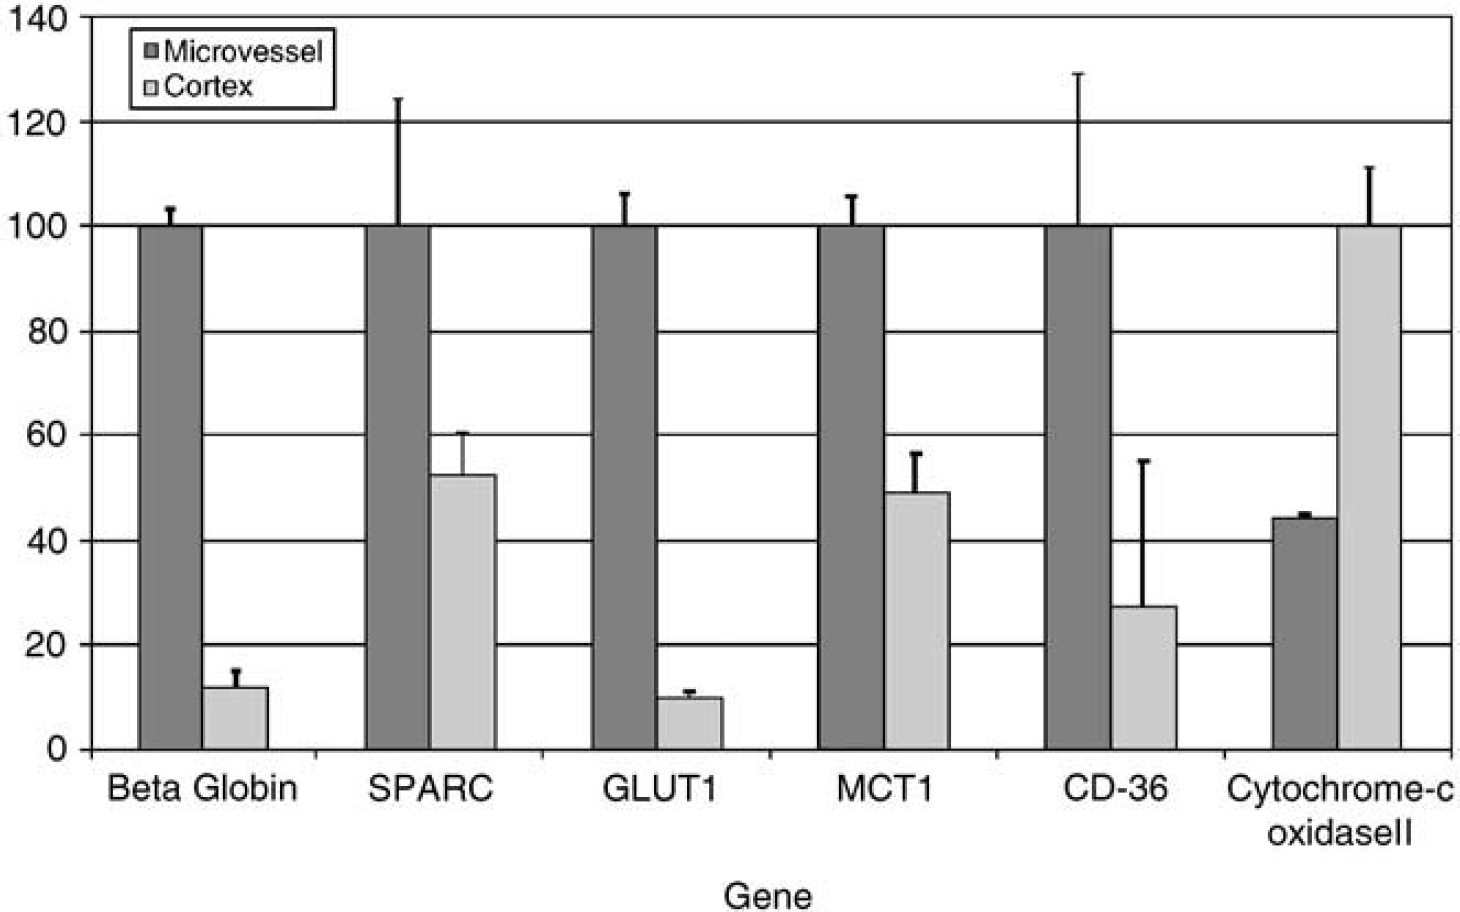
Confirmation of selected genes identified by SAGE to be enriched in rat brain microvessels. Real-time quantitative PCR was performed on a LightCycler™ instrument to quantify selected genes in microvessel mRNA and cortex mRNA preparations. Standard curves for candidate cDNAs were prepared from a series of four to six 10-fold serial dilutions of target cDNA. The quantity of DNA in each sample was normalized to 18S ribosomal RNA. The average normalized value from the samples showing larger amounts of target was set to 100. Error bars indicate standard deviation, n = 3 per group.
Discussion
The tight junctions between the endothelial cells that line the capillaries in the brain prevent paracellular movement of solutes between blood and brain. Therefore, it is not surprising that the endothelial cells are essential for the maintenance of metabolic homeostasis in the brain, and for serving as a conduit for metabolites and for communication between blood and brain. As endothelial cells account for only 1/1000 of total brain volume and are associated with the vasculature, the brain endothelium is often overlooked when global brain function is considered. In this report, we used SAGE analysis and conservatively identified a large number of genes specifically enriched in the cerebral capillaries. This catalog suggests a more prominent role for the brain microvasculature in neurological function than previously recognized. Knowledge of the unique genomic architecture of the BBB coupled with its distinctive physiologic properties further illustrates that the brain microvasculature is a unique and vital component of the CNS.
The brain microvessel SAGE catalog generated in this report is the first attempt at large-scale analysis of the BBB transcriptome. Serial analysis of gene expression was chosen over less-expensive and time-consuming hybridization-based gene expression technologies because it identifies unknown genes and produces information on absolute gene expression, corresponding well to Northern blot and real-time PCR expression data. In addition, SAGE catalogs from different tissues or different laboratories are easily comparable and shared. Here, we identify 34,712 unique tags in our catalog, of which 10,996 are present at least twice. It should be noted that the depth of this catalog is such that low-abundance tags are not reliably quantitative, a common problem for all gene expression technologies. Among these, low-abundance transcripts are likely to be those that encode signal transduction molecules and transcription factors. It has been estimated that, to identify all transcripts present at a single copy per mammalian cell, a catalog of 650,000 tags would need to be sequenced (Velculescu et al, 1999). In our study, the number of unique tags as a function of the total number of tags sequenced was plotted and subjected to nonlinear regression analysis (Supplementary Figure 2). Extrapolation of the resulting curve reached a plateau of approximately 78,000 unique tags for expressed genes predicting the theoretical limit of unique transcripts.
While slight impurities exist in our microvessel preparation (Figure 1B), most tags derived from parenchymal brain tissue (nonvascular cells) are also present in the cortex and hippocampus catalogs. Therefore, when the microvessel catalog is compared with the brain tissue catalogs, the derived list represents genes that are unique or highly expressed in only microvessel-associated cells, including primarily endothelial cells (Table 6). Although this in silico method towards defining the microvessel-enriched set of tags was accomplished using a heuristic approach, the validity of this approach is shown by the presence of a number of genes previously identified as enriched in brain endothelium. Most well-defined BBB markers are present in our set of enriched tags. These genes include: glucose transporter (GLUT1), P-glycoprotein (MDR1a, data not shown), CAT-1, TfR, MCT1, vWF, and Oatp1c1 (Slco1c1). A number of these known markers were confirmed by quantitative RT-PCR. One gene identified as enriched, cytochrome c oxidase II, mitochondrial, was expressed at higher levels in cortex than microvessels. This most likely results from one or more genes sharing a common SAGE tag and shows the need to verify specific SAGE data by other methods. A β-hemoglobin tag in the catalog is most likely derived from transcripts extracted from reticulocytes that might have been entrapped in the microvessel preparation.
This SAGE catalog intersects well with previous BBB gene discovery efforts. For example, in a recent report, Li et al (2002) identified 69 clones for genes selectively enriched in the rat brain microvasculature by the suppressive subtractive hybridization method, using driver cDNA from liver and kidney. Of the 36 known genes identified, 75% match genes were identified by tags in the total microvessel catalog (Table 2) and 42% are found in the microvessel-enriched catalog (Table 6). The lack of full concordance between the data sets is to be expected due to inherent differences in the methodologies. Our microvessel-enriched catalog also contains many of the pan endothelial markers defined by SAGE analysis of human colorectal endothelium (St Croix et al, 2000). Recently, a SAGE analysis was conducted on endothelial cells isolated from human brain microvessels (Madden et al, 2004). Several cell-type-specific transcripts were identified in these other endothelial cell catalogs and their abundance correlated closely with the rat microvessel tag abundance reported here (Table 7). One evident difference is that the glucose transporter, GLUT1, was much more abundant in brain microvessels and endothelial cells than in colon endothelial cells. This might be related to different functions of endothelial cells in the respective tissues.
Comparison of cell-type-specific gene expression levels between rat brain microvessels and endothelial cells from human brain and colon
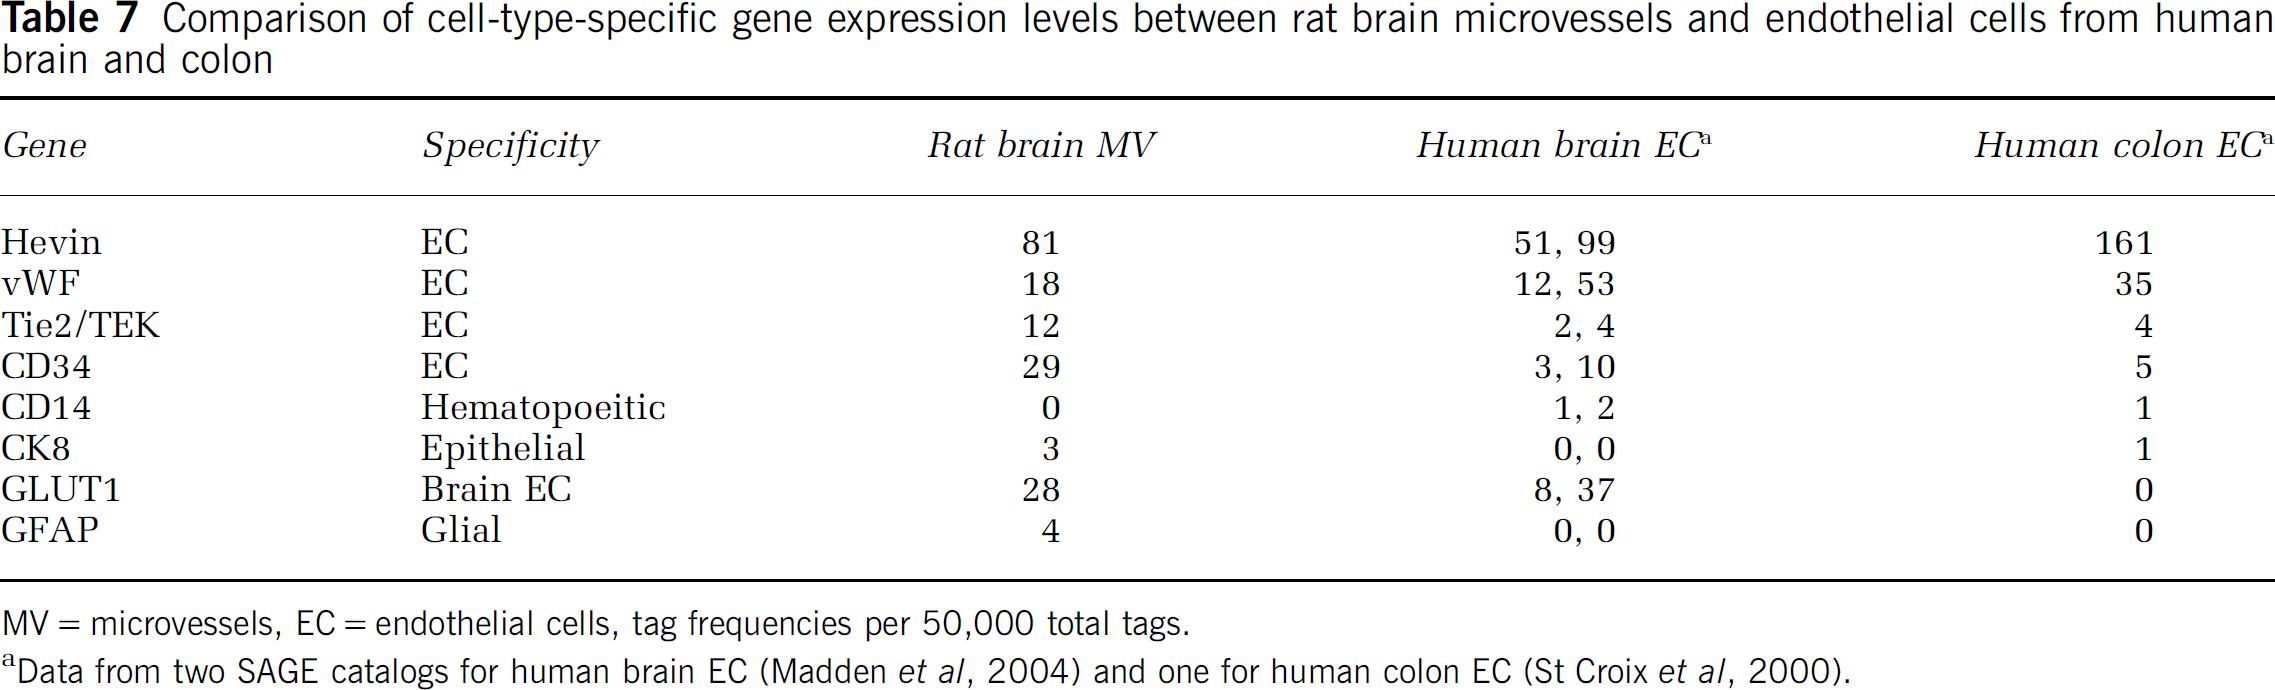
MV = microvessels, EC = endothelial cells, tag frequencies per 50,000 total tags.
Data from two SAGE catalogs for human brain EC (Madden et al, 2004) and one for human colon EC (St Croix et al, 2000).
We examined the full microvessel SAGE tag catalog for genes associated with the BBB phenotype, including transporters, adhesion molecules, and ABC cassette containing transporters. Blood-brain barrier transport processes have been well documented at the biochemical and molecular levels (Drewes, 2001). The microvessel SAGE tag catalog generated in this report includes known BBB transporters (GLUT1, MCT1, CAT-1, Oatp1c1, and others) and cloned transporters that have not previously been identified at the BBB (Gerhart et al, 1997; Pardridge et al, 1990). For example, our analysis shows for the first time that the sodium-dependent vitamin transporter (SMVT, NM_130746), a specific transporter for pantothenate, biotin, and lipoate, is present in the microvessel catalog as well as the microvessel-enriched catalog (Prasad et al, 1998). In addition, our data suggest that the sodium/iodide symporter, Slcs5a5 (NIS), is present and enriched at the BBB. Interestingly, although iodide is actively transported from blood to brain, there are no reports of Slcs5a5 expression at BBB (Davson and Hollingsworth, 1973). Finally, while functional evidence exists for the abluminal expression of a sodium/glucose transporter at the BBB, the responsible transporter has not been identified (Lee et al, 1997). A SAGE tag for the mRNA encoding the low-affinity Na/glucose transporter, SGLT2, is also present and enriched in the microvessel SAGE catalog; its existence is supported by previous reports indicating low levels of transcript in rat brain (You et al, 1995).
Junctional complexes present between endothelial cells are the main structures responsible for the barrier function of brain capillaries. The barrier consists of intrinsic, that is, integral membrane, proteins, and frequently is associated with peripheral proteins that make up the junctional complex. The constituents of tight junctions are mostly present in the full microvessel catalog (Table 2) and include occludin, claudins, and junctional adhesion molecules. Also present are various cadherin proteins that exist in adherins-type junctions along with peripheral molecules such as ZO-1 and ZO-2 that might be found in both types of junctions. As occludin, ZO-1, and ZO-2, junctional proteins that are associated with the characteristic tight junctions of the BBB, are reportedly present in astrocytes (Bauer et al, 1999; Duffy et al, 2000; Howarth and Stevenson, 1995), they are represented in the full microvessel catalog, but not in the enriched catalog (Table 6).
Tags encoding transcripts for ATP cassette containing proteins are present in the microvessel SAGE catalog (Table 5). Among these ABC transporters are members such as p-glycoprotein that are characterized to deter the entry of drugs and xenobiotics into the brain. Others such as ABCg2 (BCRP1) and ABCc5 (MRP5) are much less well characterized.
The physiological functions of the BBB are also revealed by examining the functional categorization of BBB enriched genes (Figure 3B). In fact, nearly 40% of the 864 BBB enriched genes of known function encode transporters, receptors, and signal transduction proteins. The large group of mRNAs for proteins involved in signaling pathways show how the BBB may function in mediating signals from the periphery to the CNS, which is possibly a significant and common occurrence (Ek et al, 2001). For example, the enrichment of type I iodothyronine deiodinase in the microvessel catalog suggests a role for the brain endothelium in potentiating the availability of thyroid hormones to the brain. In addition, components of pathways that regulate endothelial cell growth and differentiation are also present in the pool of microvessel-enriched tags such as activin receptor-like kinase 1 (Table 6). Activin receptor-like kinase 1 is an endothelialspecific receptor of the TGF-β receptor family that has been implicated in angiogenesis. Mutations in this gene cause hereditary hemorrhagic telangiectasia (Lamouille et al, 2002; Lux et al, 1999). Also, present is flt-1, another angiogenesis-related signaling system.
It is not surprising that structural proteins and proteins that are involved in cell adhesion are strongly represented in the catalog of microvessel-enriched genes. Some of the proteins encoded by these genes, such as laminin and fibronectin, form the basement membrane that surrounds the endothelial cells and pericytes. Cytoskeletal genes are also represented in the data set, including vimentin, tubulin, and smooth muscle α-actin.
The molecular portrait of the BBB revealed by this initial quantitative and comprehensive analysis of its transcriptome uncovers numerous features of this cellular interface between blood and brain. First, the genomic repertoire emphasizes the unique cellular phenotype existing within the brain and sheds light on potential novel functions linking the brain and periphery. The BBB transcriptome catalog also identifies a number of tags for transcripts encoding known proteins that might be targets for affecting brain drug delivery. These transporters are known for their efflux properties and may contribute significantly to the regulation of the brain extracellular fluid composition and the effectiveness by which drugs penetrate the brain. Finally, these findings provide a useful resource and reference point for future studies in which the effects of different physiological, developmental, and disease processes on BBB gene expression are examined.
Footnotes
References
Supplementary Material
Please find the following supplemental material available below.
For Open Access articles published under a Creative Commons License, all supplemental material carries the same license as the article it is associated with.
For non-Open Access articles published, all supplemental material carries a non-exclusive license, and permission requests for re-use of supplemental material or any part of supplemental material shall be sent directly to the copyright owner as specified in the copyright notice associated with the article.