
Abstract
Translation of many non-invasive hemodynamic MRI methods to cerebrovascular disease patients has been hampered by well-known artifacts associated with delayed blood arrival times and reduced microvascular compliance. Using machine learning and support vector machine (SVM) algorithms, we investigated whether arrival time-related artifacts in these methods could be exploited as novel contrast sources to discriminate angiographically confirmed stenotic flow territories. Intracranial steno-occlusive moyamoya patients (n = 53; age = 45 ± 14.2 years; sex = 43 F) underwent (i) catheter angiography, (ii) anatomical MRI, (iii) cerebral blood flow (CBF)-weighted arterial spin labeling, and (iv) cerebrovascular reactivity (CVR)-weighted hypercapnic blood-oxygenation-level-dependent MRI. Mean, standard deviation (std), and 99th percentile of CBF, CVR, CVRDelay, and CVRMax were calculated in major anterior and posterior flow territories perfused by vessels with vs. without stenosis (≥70%) confirmed by catheter angiography. These and demographic variables were input into SVMs to evaluate discriminatory capacity for stenotic flow territories using k-fold cross-validation and receiver-operating-characteristic-area-under-the-curve to quantify variable combination relevance. Anterior circulation CBF-std, attributable to heterogeneous endovascular signal and prolonged arterial transit times, was the best performing single variable and CVRDelay-mean and CBF-std, both reflective of delayed vascular compliance, were a high-performing two-variable combination (specificity = 0.67; sensitivity = 0.75). Findings highlight the relevance of hemodynamic imaging and machine learning for identifying cerebrovascular impairment.
Keywords
Introduction
Arterial spin labeling (ASL) and blood oxygenation level-dependent (BOLD) are magnetic resonance imaging (MRI) methods that have improved our ability to monitor hemodynamic impairment in patients with cerebrovascular disease through non-invasive measurement of cerebral blood flow (CBF) and cerebrovascular reactivity (CVR). This functional hemodynamic information has been used in acute1,2 and chronic3,4 stages of cerebrovascular disease to aid in diagnosis, as well as in surveillance imaging to evaluate intervention response.5,6
Under conditions of cerebral ischemia and arterial steno-occlusion, blood transit through the arterial system and associated blood arrival times may be lengthened, which can manifest as image artifacts on CBF and CVR-weighted maps. For instance, delayed blood arrival on ASL-MRI can manifest as signal voids in extreme cases, or hyperintense endovascular signal in more modest cases, owing to labeled blood water that remains in the arterial tree prior to exchange with tissue water in the capillaries.7,8 On CVR-weighted BOLD-MRI maps, delays in vascular compliance can manifest as apparent negative signal or underestimation of CVR on statistical analysis, due to misidentification of baseline BOLD signal.9–12 These artifacts are fundamental, as they preclude accurate quantitative assessment of hemodynamic parameters in one of the most obvious applications, cerebrovascular disease. We investigated whether emerging machine learning approaches could utilize information from these apparent artifacts as novel contrast sources to distinguish flow territories with vs. without clinical indicators of hemodynamic impairment in patients with moyamoya.
Moyamoya is an intracranial arterial steno-occlusive disease affecting the supraclinoid internal carotid artery (ICA) and its proximal branches, which leads to delayed blood arrival times, 13 delayed reactivity timing, 9 and development of compensatory collateral vessels. Moyamoya is clinically relevant as it incurs a seven-fold increase in stroke risk compared to age- and race-matched adults 14 and treatment regimens, which may comprise either medical management or surgical revascularization, have not been established by randomized clinical trials. The current standard for identifying disease severity in moyamoya is stenosis grading of major intracranial vessels with catheter angiography; however, this procedure carries perioperative risk and exposes patients to ionizing radiation, and for these reasons is suboptimal for surveillance.
Machine-learning techniques, which have been successfully applied in both anatomical15,16 and functional imaging,17,18 should have relevance for identifying functional hemodynamic biomarkers in patients with moyamoya. Machine learning algorithms include but are not limited to artificial neural networks (ANNs),15,19 random forests, 20 decision trees, 21 and support vector machines (SVMs).17,18,22 To investigate the possibility of analyzing contrasts in functional hemodynamic maps with machine learning techniques, we applied SVMs to evaluate multiple functional imaging contrasts to discriminate hemispheres with vs. without known hemodynamic impairment.
We hypothesized that transit time-related artifacts in hemodynamic images, such as endovascular signal on ASL-MRI and reactivity delays on CVR-weighted MRI (CVRw-MRI), can classify brain parenchyma supplied by angiographically confirmed stenotic vessels. To test this hypothesis, we sequentially acquired catheter angiography, anatomical imaging, and ASL- and BOLD-MRI in a cohort of moyamoya patients, and evaluated discriminatory capacity of hemodynamic imaging methods for hemispheres supplied by steno-occlusive vessels using machine learning approaches. As an exploratory analysis, we used similar methods to identify variables indicative of new infarct risk in tissue. Finally, we discuss potential and remaining limitations to machine learning algorithms in this cohort, as well as potential relevance of these findings to more common atherosclerotic cerebrovascular disease patients.
Materials and methods
Participant demographics
All participants provided informed, written consent, and all components of the study were approved by the Vanderbilt University Institutional Review Board. Criteria for inclusion were adult patients with a clinical diagnosis of moyamoya confirmed by catheter angiography, identified from the Vanderbilt Neurology and Neurosurgery services between 27 January 2011 and 19 January 2018. Hemispheres with prior surgical revascularization (direct or indirect) were excluded. Healthy controls were recruited if they had no prior neurological condition and no current cerebrovascular disease confirmed by vascular and anatomical imaging at the time of enrollment. Demographic information is shown in Supplementary Table 1. All components of this study were performed in compliance with the Declaration of Helsinki of 1975 (and as revised in 1983), Health Insurance Portability and Accountability Act, and all protocols were approved by the Vanderbilt University Institutional Review Board (IRB Study 140915).
Acquisition
Data were acquired using a 3.0T MRI scanner (Philips, Best, The Netherlands) with body coil radiofrequency (RF) transmission and 16-channel SENSE-array neurovascular coil reception.
Anatomical imaging
MRI acquisition included T2-weighted (TR/TE = 3000/80 ms; spatial resolution = 0.6 × 0.6 × 4.0 mm3), T2-weighted axial fluid-attenuated inversion recovery (FLAIR) (turbo inversion recovery; TR/TI/TE = 11000/2800/120 ms; spatial resolution = 0.9 × 1.1 × 3.0 mm), and T1-weighted (magnetization-prepared-rapid-gradient-echo; spatial resolution = 1.0 × 1.0 × 1.0 mm3, 3D turbo field echo; TR/TE = 8.2/3.7 ms) scans.
Catheter angiography
Clinically indicated digital subtraction angiography (DSA) was performed with a Philips Allura Xper biplane neuro X-ray system. Data were collected per clinical indication with manual catheter injection of contrast to the common carotid arteries or ICAs and vertebral arteries (four injections per patient). 23
ASL
Quantitative CBF measurements were obtained with a 2D multi-slice (slices = 17; spatial resolution = 3 × 3×7 mm3) pseudo-continuous ASL (pCASL) sequence (TR/TE = 4200/12.5 ms). 24 Due to the seven-year duration of this study, pCASL parameters were similar but varied slightly: protocol A (label duration=1600 ms; label delay = 1525 ms) and pCASL protocol B (label duration = 1650 ms; label delay = 1800 ms). These post-label delay values are common for 3.0T ASL studies, but are shorter than expected circulation times in many moyamoya patients,7,23 which may lead to endovascular signal artifacts that are of interest to this study. The potential influence of multiple pCASL protocols is addressed in the Discussion.
CVR-weighted BOLD imaging
CVR-weighted measurements were obtained during BOLD imaging (TR/TE = 2000/30 ms; spatial resolution = 2.7 × 2.7 × 3.5 mm3; 360 dynamics) with a vasodilatory hypercapnic-hyperoxic stimulus (95% O2, 5% CO2). The stimulus paradigm consisted of 180 s hypercapnic-hyperoxia interleaved with 180 s normocapnic-normoxia repeated once. This stimulus has been investigated previously for reproducibility and sensitivity to lateralizing disease in the moyamoya patient population.25,26 Differences between stimuli are addressed in the Discussion. Throughout the scan, respiratory rate, blood pressure, end-tidal CO2, arterial oxygen saturation, and heart rate were monitored (Medtronic, Dublin, Ireland).
Analysis
Anatomical imaging and catheter angiography
T2-weighted, T2-weighted FLAIR, and T1-weighted MRI were used to record prior infarcts by a board-certified radiologist (LTD) who was blinded to other hemodynamic and functional imaging findings. Moyamoya patient hemispheres were separated into groups that were supplied by either a severely stenotic vessel or mildly stenotic vessels, in which Stenting versus Aggressive Medical Management in Patients at-Risk for stroke with Intracranial Stenosis (SAMMPRIS) 27 criteria were used. More specifically, a hemisphere with severe stenosis was supplied by a major intracranial vessel (first segment of middle cerebral artery, posterior cerebral artery, or anterior cerebral artery; intracranial ICA; or basilar artery) with ≥ 70% stenosis, and mild stenosis was a hemisphere with all supplying vessels <70%. Although stenosis of smaller and more distal vessels is possible, vascular stenosis of these more distal segments is difficult to quantify even on catheter angiography, and more importantly, the spatial extent of impairment from these vessels will be more focal and potentially variable. Here, as a first-principle study, and to ensure that the regions considered met accepted clinical criteria for impairment as recommended by prior trials, 27 we focused on stenosis in major intracranial vessels as defined above. We define stenosis<70% as mildly impaired, as moyamoya is a bilateral condition and stenosis of smaller vessels not apparent on angiography is likely.
ASL
ASL preprocessing included affine motion correction,
28
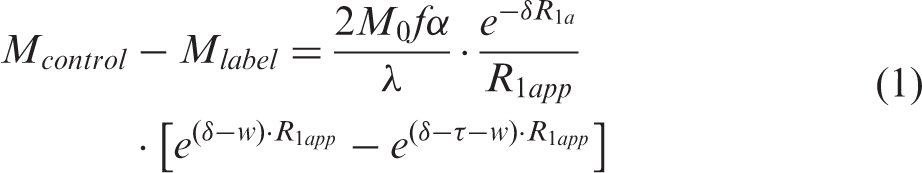
spatial smoothing (full-width-half-maximum = 3 mm), slice-time correction, control and label pair-wise subtraction, and dynamic averaging (protocol A: measurements = 27; protocol B: measurements = 20). Additionally, T1-weighted images served as an intermediate template to register the control images from ASL acquisition to Montreal Neurological Institute (MNI) space using linear co-registration (FMRIB's Linear Image Registration Tool; FLIRT) with 12 degrees of freedom. Images were co-registered to ensure that comparisons could be made between hemispheres, while keeping proportions of gray and white matter approximately consistent in volumes of interest, and so that anterior and posterior flow territories could be identified consistently between participants. The transformation matrix was recorded and applied to the quantitative ASL difference magnetization map. Quantitative CBF maps were calculated according to a two-compartment model applied to the processed difference magnetization (M
control
–M
label
), using the fmincon constrained non-linear optimization function in Matlab29,30
CVR-weighted BOLD imaging
BOLD preprocessing included motion correction and spatial smoothing, similar to ASL preprocessing, and images were corrected for slice-timing using the FSL software, FEAT.
35
Following affine motion correction, both BOLD and ASL images were qualitatively evaluated for residual motion effects, manifesting as peripheral signal hyperintensities on the ASL difference images and focal hyperintensities on the BOLD time courses, and any images with residual motion that was deemed to preclude interpretability were excluded. BOLD images were co-registered to an MNI atlas using the same techniques as described in the ASL section above. Three CVR parameters were calculated from BOLD reactivity data. First, CVR was defined as the mean BOLD signal change in response to stimulus, for which the last 60 s of both 180 s hypercapnic stimulus blocks (30 images per 60 s) were averaged to calculate a stimulus image and the last 120 s of the 180 s interleaved period were averaged to calculate a baseline image. The CVR map is the fractional signal change map. To analyze time-delayed vascular response to stimulus,
9
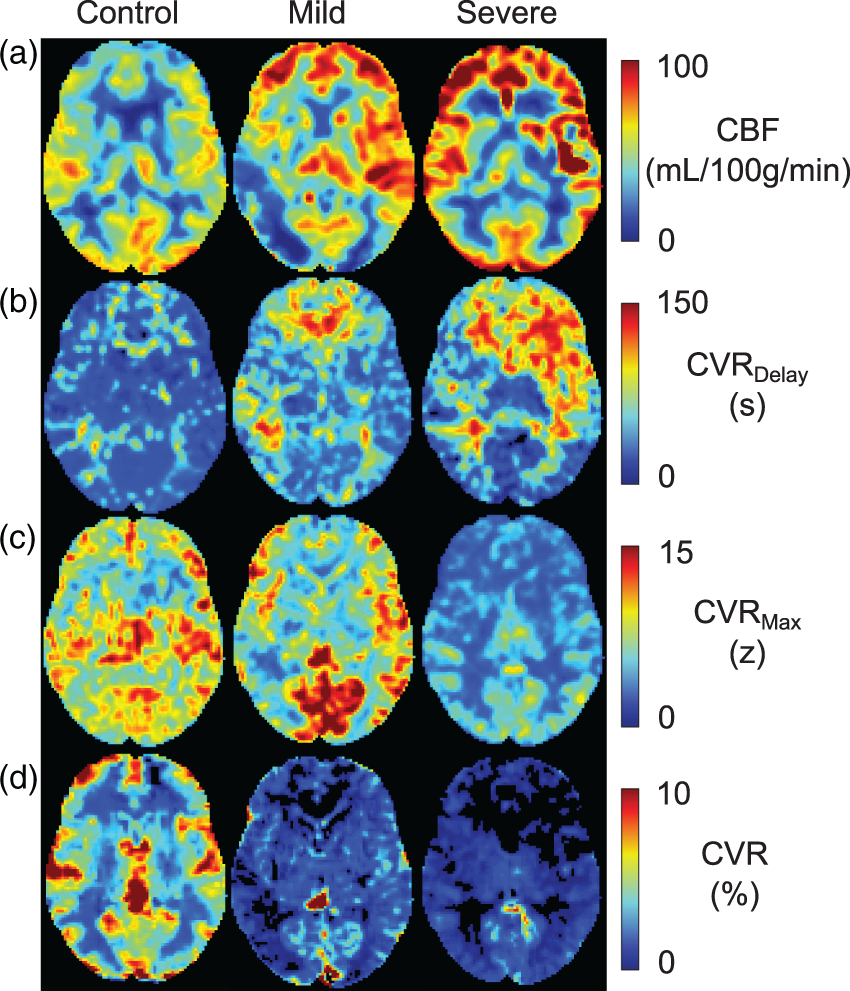
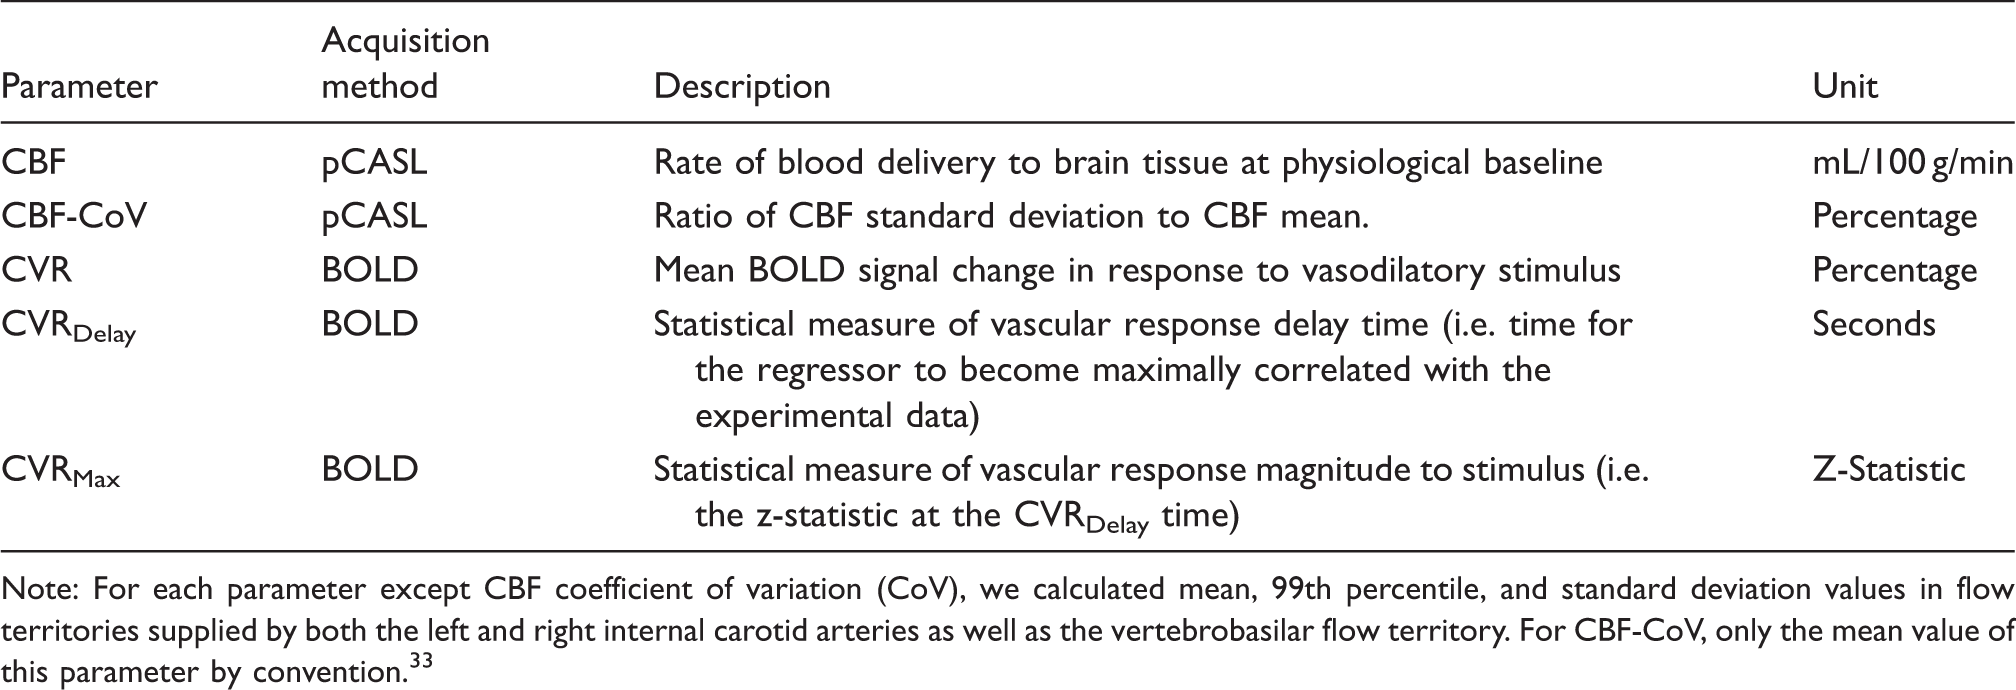
a rectangular regressor was applied to represent on and off stages of the paradigm. This regressor was advanced in time until maximum correlation between voxel time course and shifted regressor was found. Time until maximum correlation was defined as CVRDelay (seconds), and the value of maximum correlation is CVRMax (z-statistic between shifted regressor and voxel time course). These values are calculated on a voxel-wise basis to create CVRDelay (time delay) and CVRMax (maximal statistical response) maps. Representative maps are shown in Figure 1; all parameters are defined in Table 1.
Representative images for each physiological parameter (rows) and patient group (columns) used to test the primary hypothesis in this study. The mild stenosis moyamoya patient is a 48-year-old female with stenosis in the right M1 segment of the MCA and left supraclinoid ICA. The severe stenosis patient is a 23-year-old female with stenosis bilaterally in both M1 MCA and supraclinoid ICA segments. With increasing arterial steno-occlusion, CBF-weighted data demonstrate heterogeneous hyperintense endovascular signal, CVRDelay lengthening, and CVR reduction. Definitions of the four physiological parameters used in this study. Note: For each parameter except CBF coefficient of variation (CoV), we calculated mean, 99th percentile, and standard deviation values in flow territories supplied by both the left and right internal carotid arteries as well as the vertebrobasilar flow territory. For CBF-CoV, only the mean value of this parameter by convention.
33
Quantification of observables
While moyamoya is generally a bilateral condition, severity can vary regionally, therefore hemispheres were considered separately. 36 Each hemisphere was separated into two regions, one approximately supplied by the ICA and another by the vertebrobasilar (VBA) arteries. These were estimated from a common flow territory map atlas calculated with vessel-encoded ASL.37,38 A standard histogram and associated voxel-intensity threshold approach was applied to the T1-weighted atlas to estimate the fractional tissue volumes in each region.
The inputs to machine learning techniques are regional imaging and demographic information. In ICA and VBA flow territories, we calculated three standard statistical measures (i) 99th percentile (99th%), (ii) mean, and (iii) standard deviation (std) of the voxel intensities for CBF, CVR, CVRDelay, and CVRMax maps (Table 1). Owing to recent evidence suggesting that the coefficient of variation (CoV) in ASL maps has relevance for discerning important arrival time information,
33
spatial CoV of CBF was also calculated in both ICA and VBA flow territories according to the following equation.
33

This yielded 13 imaging measures per flow territory (26 per brain hemisphere). Additionally, five demographic and risk factor variables, including age (continuous), sex (dichotomous), race (categorical: Black, Asian, or White), smoking status (dichotomous), and diabetes (dichotomous) were considered.
Statistical considerations and hypothesis testing
The overall goal of this work was to consider each brain hemisphere in each patient as a separate data point, and to divide these hemispheres into (i) healthy controls (control), (ii) patients with all supplying vessels with stenosis < 70% (mild), or (iii) patients with at least one supplying vessel with stenosis ≥ 70% (severe). Next, we evaluated the performance of single or combinations of imaging and demographic variables using machine learning for discriminating the hemispheres by category.
For machine learning, the SVM classifier algorithm was utilized. An SVM performs binary classifications by transforming the data space into a higher dimensional space using a kernel, and optimizing the position of a hyper-plane to define a boundary separating input groups. 22 SVM classifiers were trained in MATLAB using the fitcsvm function with a radial bias function kernel and fitcsvm default parameters, including kernel scale set to 1, box constraints set to 1, standardized data, and solving with sequential minimal optimization. 39 Predictive performance was assessed with receiver operating characteristic (ROC) analysis using the ROC area under the curve (ROCAUC). Sensitivity and specificity were recorded at the point along the ROC curve that yielded maximum Youden's index. 40 Youden's index is the sum of sensitivity and specificity minus one, and is a common method used to define a threshold with optimal compromise between sensitivity and specificity.41,42 For comparisons made by stenosis extent, classifiers were validated with stratified, repeated 3-fold validation, where ROC curves were averaged for each fold, and the final reported ROC was the average of all repetitions. 43
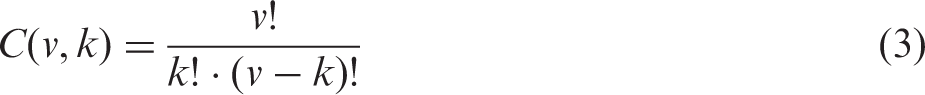
Hemispheres were grouped into one of three categories: (i) control (from healthy subjects), (ii) mild (major supplying vessels all with stenosis <70%) and (iii) severe (at least one major intracranial vessel with stenosis ≥70%). Single-variable, two-variable, and three-variable SVM classifiers were tested with all combinations of variables for each of the three group-comparisons: controls vs. mild regions, controls vs. severe regions, and mild vs. severe regions. The number of variable combinations tested is
The process of ranking best performing variables was by maximum ROCAUC value for the control vs. mild hemispheres as this was a more clinically meaningful and challenging criteria (e.g. compared with distinguishing control vs. severe); however, ROCAUC values for other hemisphere classifications are also included.
As an exploratory analysis, hemispheres were grouped by those with vs. without new infarcts in the subgroup of patients with surveillance imaging. A similar procedure with single- and two-variable classifiers was applied to determine potential for identifying hemispheres that progressed to develop new infarcts. Here, due to a smaller sample size, a leave-one-out approach was used instead of 3-fold validation for cross validation.
While the primary focus of this study was on SVM performance, we also summarize group-wise comparisons of the input variables using two-sided p-values calculated with a Wilcoxon rank-sum test for parameters in each of the three hemisphere groups: control vs. mild, control vs. severe, and mild vs. severe. When p < 0.0038 (after a correction for the 13 functional variables calculated in each flow territory), the group-wise difference was denoted as significant. This analysis was repeated in the exploratory analysis to determine group-wise effects in hemispheres that had recurrent stroke at follow up.
CBF-CoV, CBF-mean, and CBF-std were compared in separate linear regression analyses, in which the Pearson correlation coefficient (r) was used to assess correlation between variables. For presenting variables, the map used is shown first, followed by the hyphenated statistical measure and the flow territory denoted in parentheses. For example, CBF-std (ICA) denotes the standard deviation of the CBF in the ICA territory.
Availability of data
De-identified data will be made available to those interested in reproducing the results.
Results
Sixty-six moyamoya patients were enrolled, of whom 53 patients met inclusion criteria, and 22 patients received follow-up imaging (follow-up duration = 363 ± 145 days). Eleven patients were excluded due to prior bilateral revascularization surgeries and two for incomplete or motion-corrupted data sets. Fourteen patients had only one hemisphere excluded due to unilateral revascularization surgery. Ultimately, this study included 92 patient hemispheres from 53 moyamoya patients, and 20 control hemispheres from 10 control subjects. Of 92 patient hemispheres, 64 were supplied by at least one flow-limiting stenotic vessel of the anterior circulation. The distribution of stenotic arteries was the intracranial segment of the ICA (33 right, 30 left), first segment of the MCA (31 right, 25 left), first segment of the ACA (18 right, 10 left), and first segment of the PCA (4 right, 3 left) (Supplementary Table 1). Preservation of posterior circulation until late disease stages is common in moyamoya, consistent with the finding that all hemispheres had anterior vessel stenosis, but only 7.6% of hemispheres were also supplied by a severely stenotic vessel from the posterior circulation. The mild stenosis group had 20 hemispheres collected with pCASL protocol A, and 8 hemispheres collected with protocol B; the severe stenosis group had 32 hemispheres collected with pCASL protocol A and 32 hemispheres collected with protocol B. All control data were collected with pCASL protocol B.
Twenty-two patients received follow-up imaging. Five hemispheres were excluded from recurrent stroke analysis due to unilateral revascularization surgery. Six hemispheres had new infarcts and 33 hemispheres had no new infarcts at follow-up. All but one of the new infarcts occurred in anterior flow territories. Of the six hemispheres with new infarcts, two had arterial stenosis <70% of the supplying vessels in that hemisphere and four had stenosis ≥70%. Of the 33 hemispheres without new infarcts, 11 had arterial stenosis <70% and 22 had stenosis ≥70%.
Mean tissue composition was calculated in each of the flow territory maps and was determined to be 64% and 70% gray matter for ICA and VBA flow territories, respectively. The same regions were used in all subjects and therefore tissue composition bias is anticipated to be similar across all subjects. This fraction of gray matter is to be expected for typical BOLD and ASL voxel dimensions of 2–7 mm as used here.
In machine learning analysis, data were input to single-variable (C = 31 total variable combinations), two-variable (C = 465 total variable combinations), and three-variable (C = 4495 total variable combinations) SVM algorithms, in which all possible combinations of variables were tested for classification performance. In single variable learning, the best performing variable was CBF-std (ICA) with ROCAUC = 0.70 for control vs. mild classification and ROCAUC = 0.75 for mild vs. severe classification. No other variables yielded ROCAUC>0.60 for all classifications.
The highest performing two and three variable classifications are shown in Table 2. All highest performing variable combinations contained CBF-std (ICA). Fifteen imaging variables and two demographic variables (diabetes and smoking) were identified. A high performing two-variable SVM using CBF-std (ICA) and CVRDelay-mean (ICA) is displayed in Figure 2 in comparison to a two-variable SVM using variables that are often recorded: CVR-mean (ICA) and CBF-mean (ICA). In Figure 2, when comparing control vs. mild hemispheres, SVM performance is similar for CBF-mean (ICA) and CVR-mean (ICA) (ROCAUC = 0.65) compared to CBF-std (ICA) and CVRDelay-mean (ICA) (ROCAUC = 0.70). However, when classifying mild vs. severe hemispheres, CBF-mean (ICA) and CVR-mean (ICA) (ROCAUC = 0.54) are outperformed by CBF-std (ICA) and CVRDelay-mean (ICA) (ROCAUC = 0.75).
A comparison of classification performance for variables more commonly used for identifying cerebrovascular impairment (CVR-mean and CBF-mean measured in the ICA flow territory; a) to the newly identified variables from the SVM analysis (CBF-std and CVRDelay-mean in the ICA territory; b). The highest performing variable combinations, for control vs. mildly stenotic and mildly stenotic vs. severely stenotic hemisphere SVM algorithms, in comparison to one combination of commonly measured variables (CVR-mean and CBF-mean measured in the ICA flow territory; top). Note: Region is shown in parentheses for each variable. CBF-std (ICA) is the only single variable that displays classification with ROCAUC > 0.60 for both control vs. mild and mild vs. severe comparisons. Additionally, CBF-std (ICA) is present in all of the highest performing variable combinations. Sensitivity and specificity are reported at the point along the ROC curve with maximum Youden's index.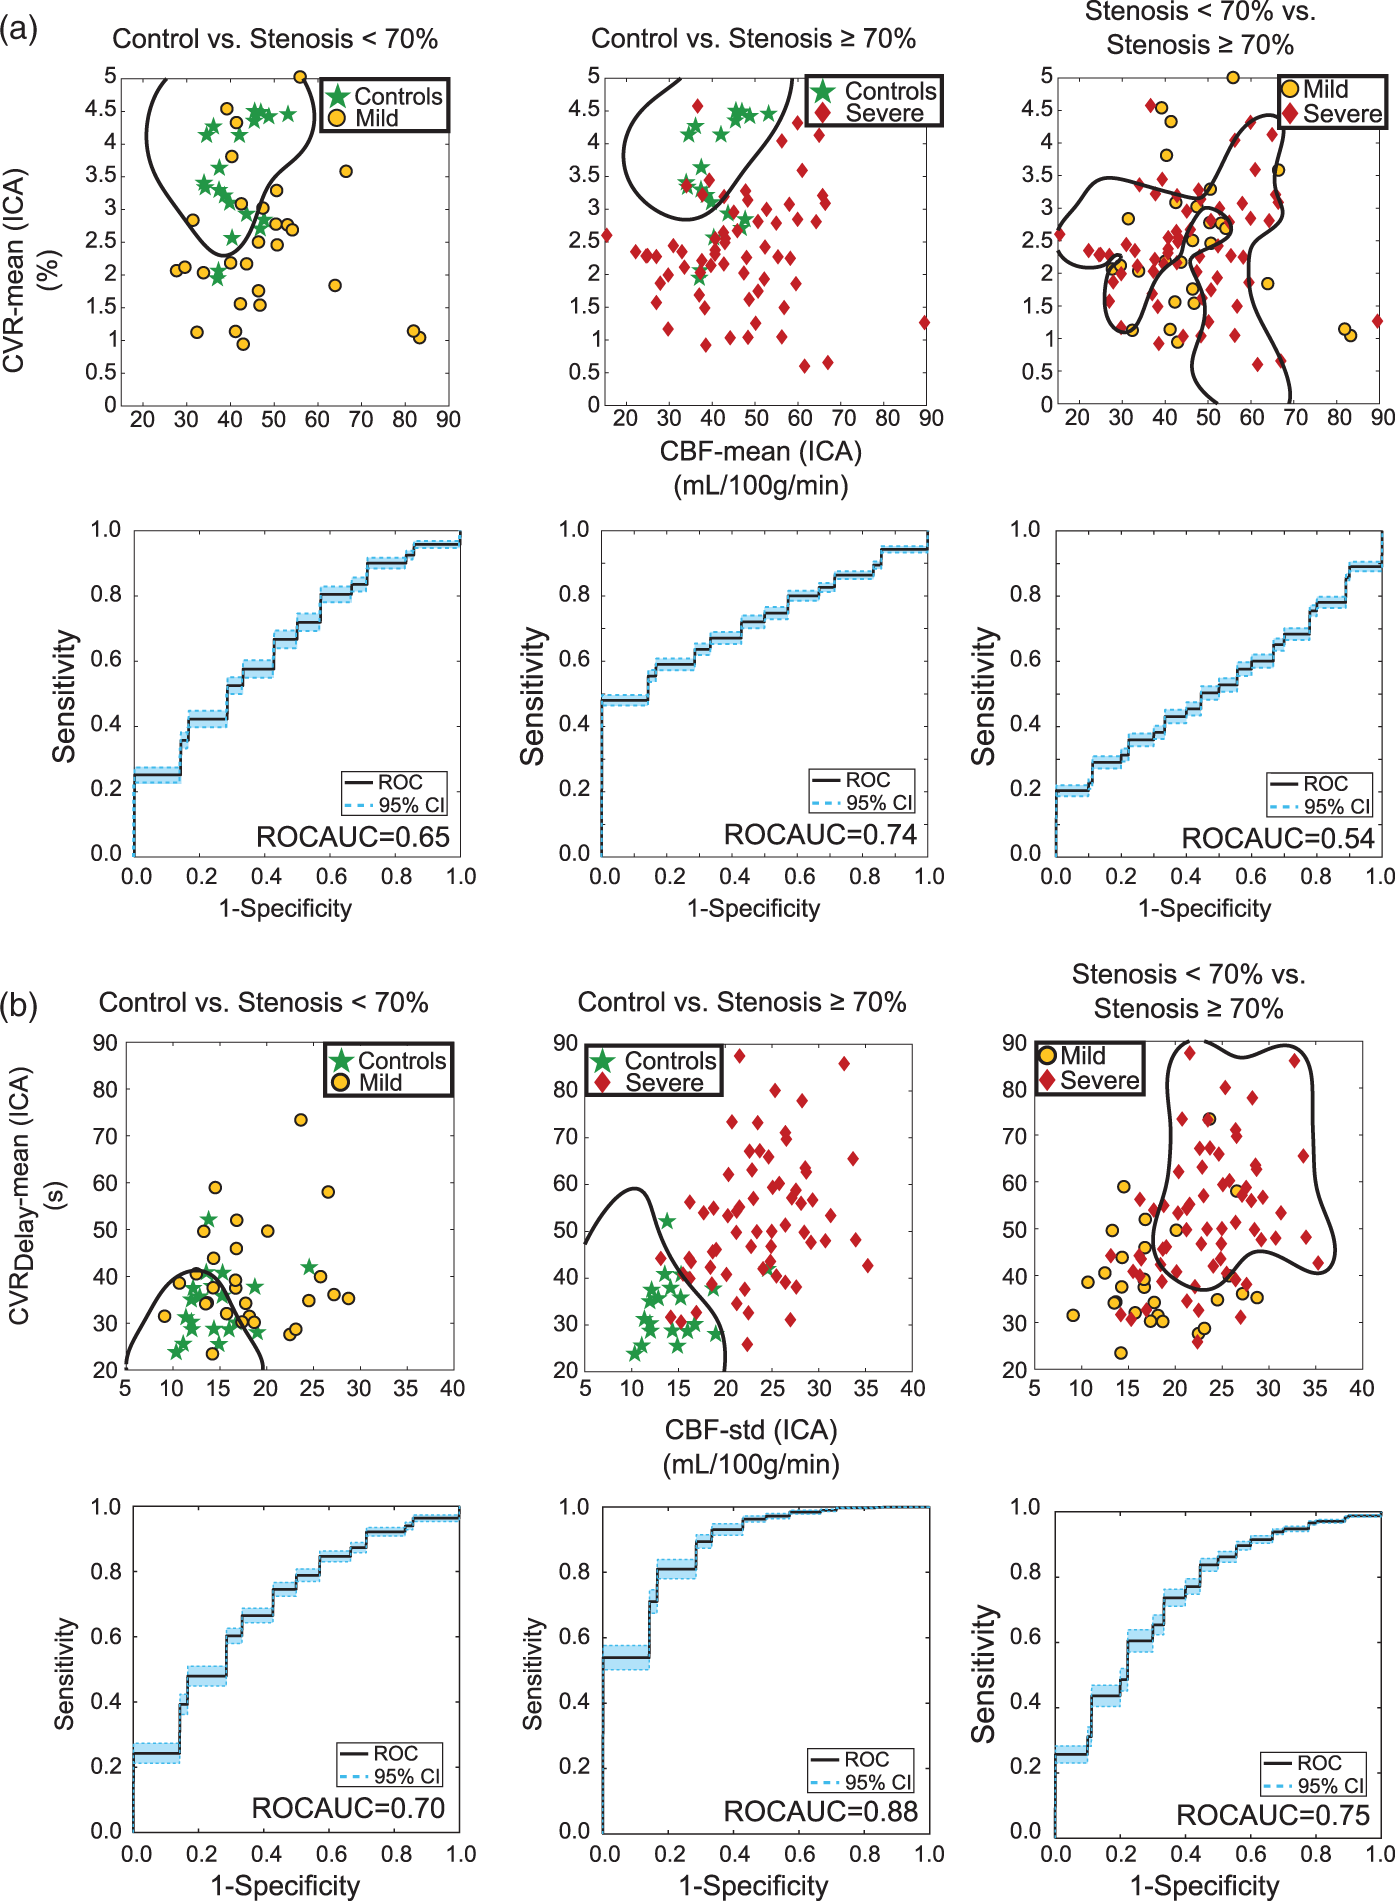
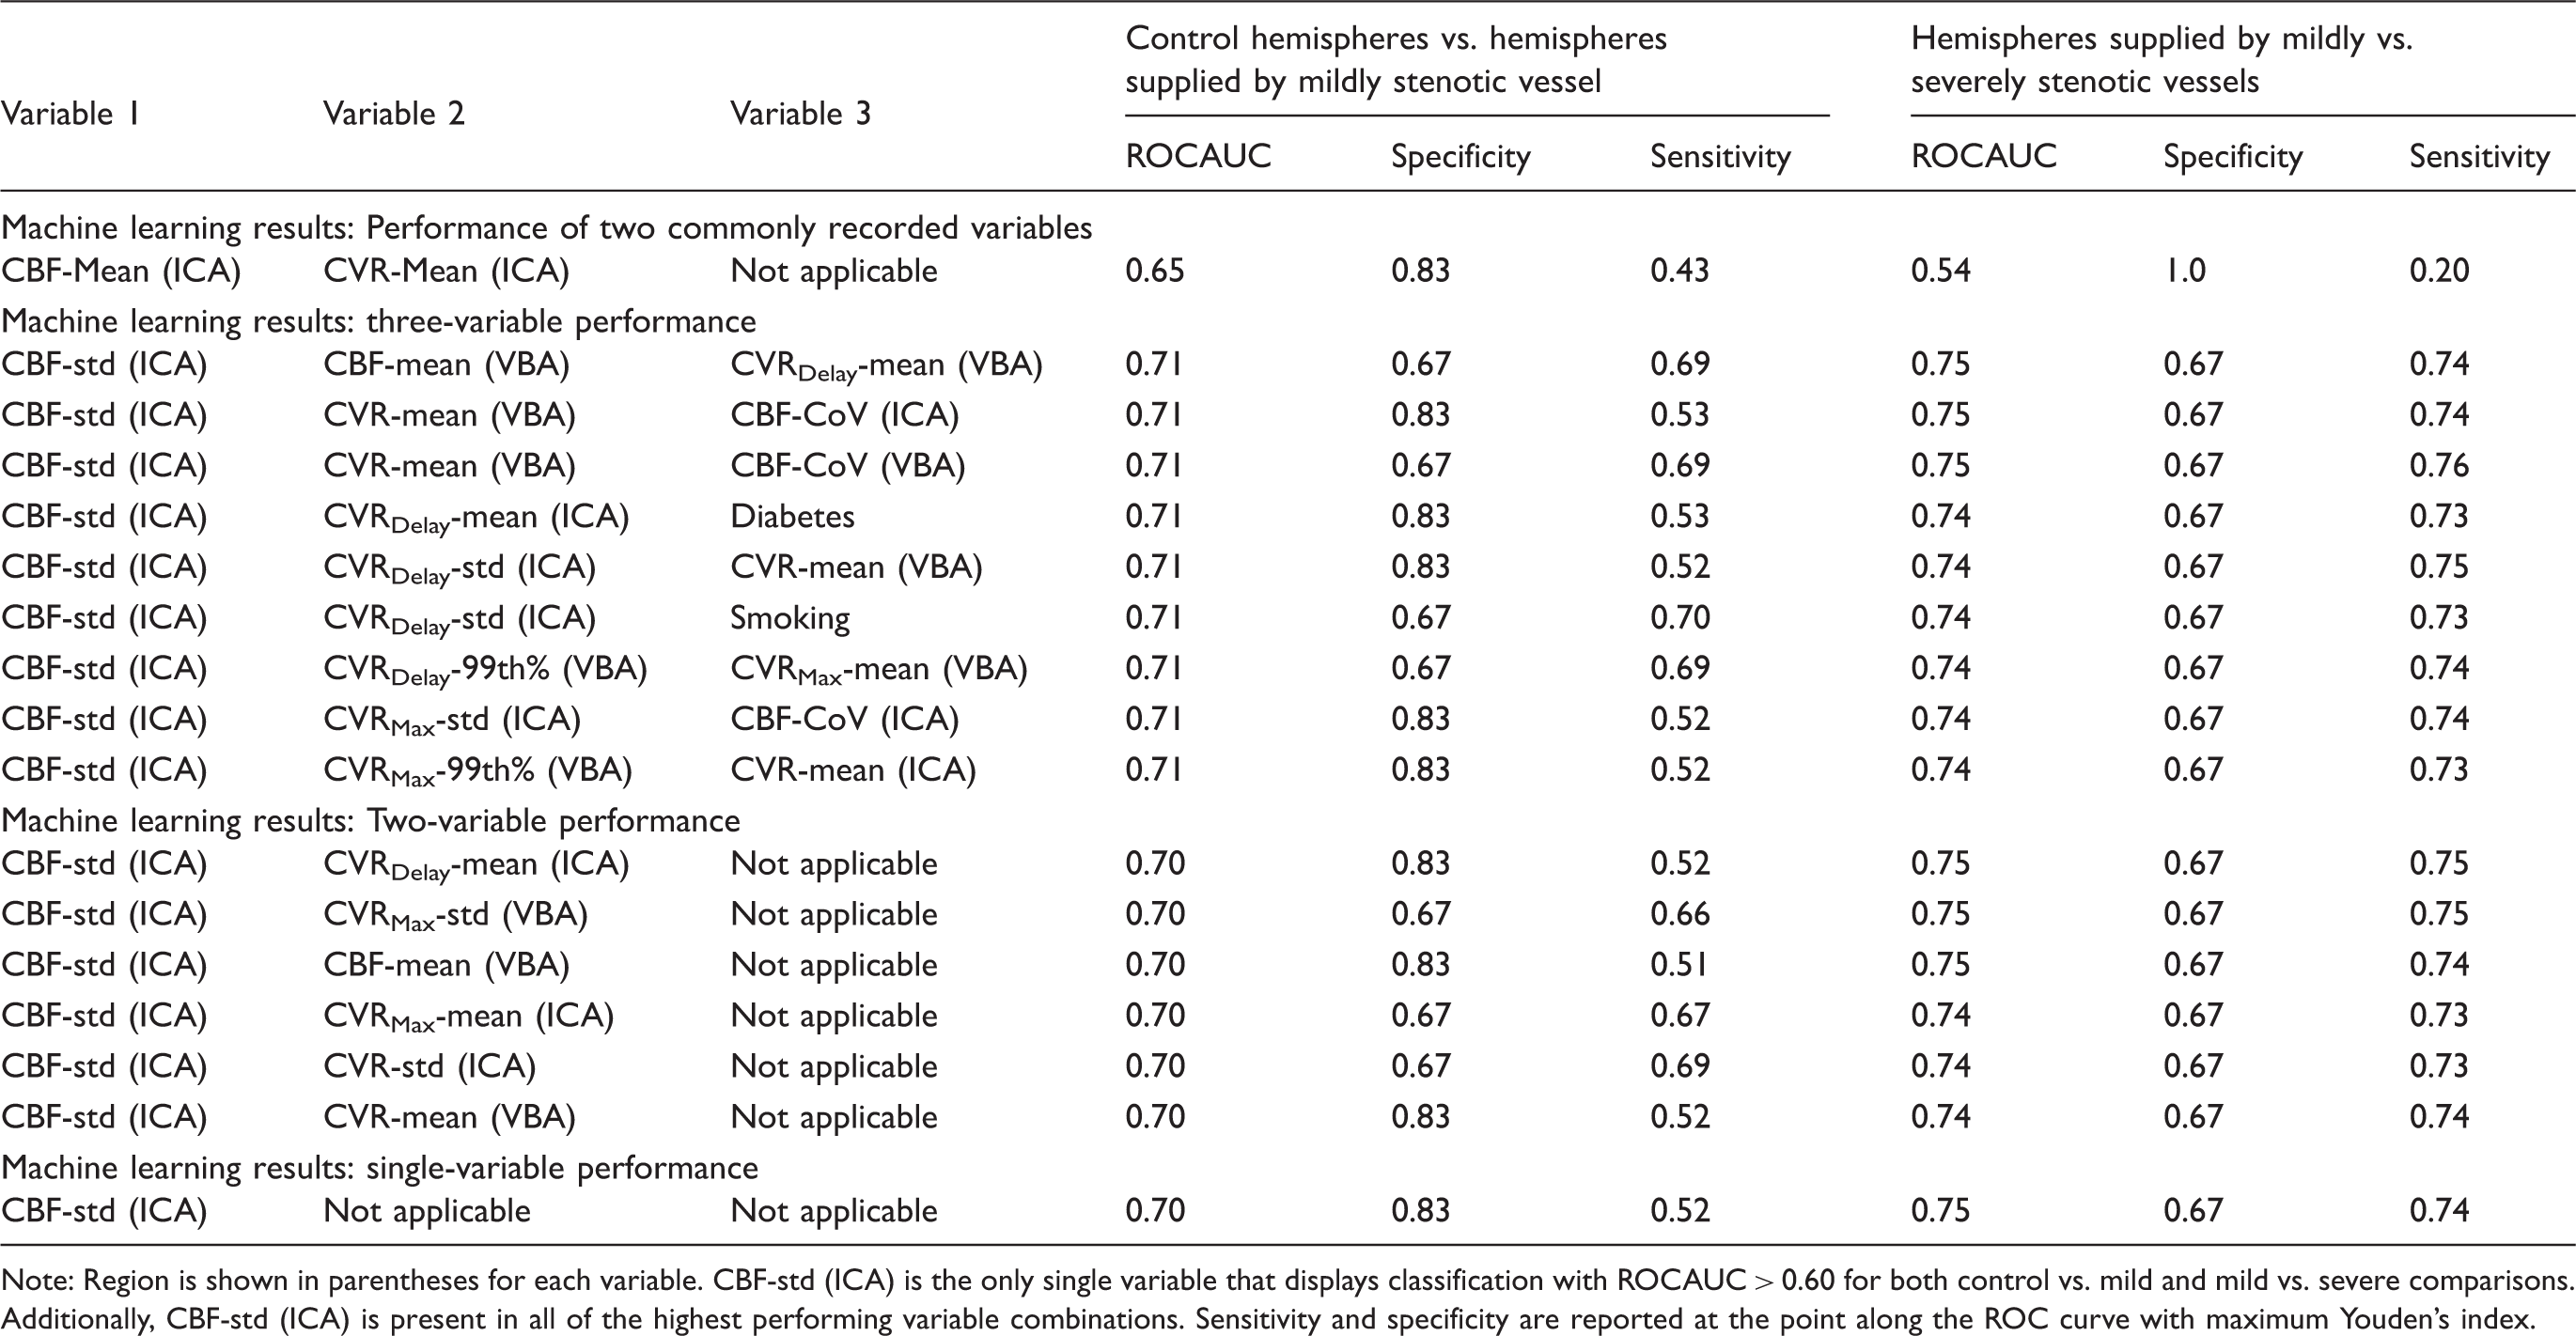
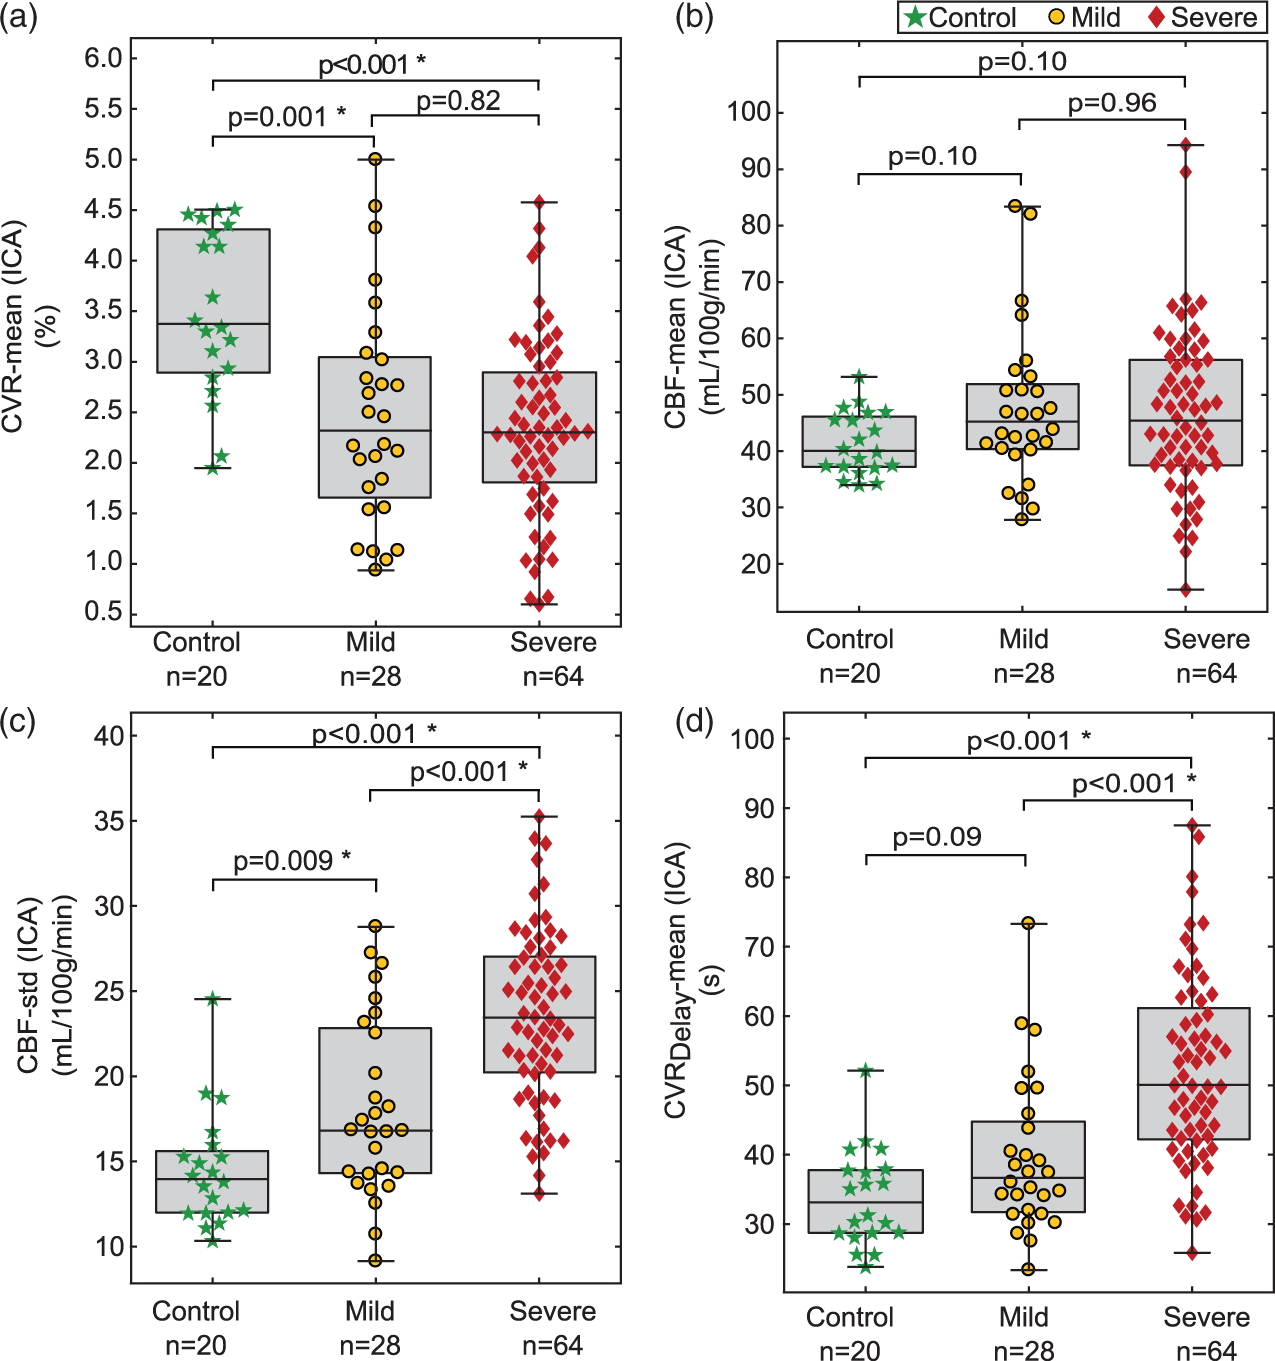
Figure 3 summarizes all functional variables using standard Wilcoxon rank-sum analysis. In control vs. mild hemisphere comparison, two significant variables were found in the ICA territory, CBF-99th%, and CVR-mean, compared to no variables from the VBA territory. In comparisons between hemispheres supplied by mild vs. severely stenotic vessels, significance was found for six variables in the ICA flow territory: CBF-99th%, CBF-std, CBF-CoV, CVRDelay-mean, CVRDelay-99th%, and CVRDelay-std, compared to only one from the VBA territory, CVRDelay-std. Figure 4 contains box plots comparing two commonly recorded hemodynamic variables displayed in Figure 2 (CVR-mean and CBF-mean from the ICA flow territory) to candidate variables identified through SVM analysis from Figure 2 (CBF-std and CVRDelay-mean in the ICA flow territory). Variables identified from SVM analysis are consistent with moyamoya pathophysiology and prolonged blood arrival times.
P-values from a Wilcoxon rank-sum test for each imaging variable when comparing controls to hemispheres supplied by mildly stenotic vessels (a, d), controls to hemispheres supplied by severely stenotic vessels (c, e), and hemispheres supplied by mildly versus severely stenotic vessels (c, f). Each variable is shown for the ICA flow territory (top) and the VBA flow territory values (bottom). Variables are considered significant at or below p = 0.0038, which includes a multiple-comparison correction accounting for 13 imaging variables. Group-wise comparisons between variables commonly used for identifying cerebrovascular impairment (CVR-mean and CBF-mean measured in the ICA flow territory; a, b) and variables identified in this study (CBF-std and CVRDelay-mean in the ICA flow territory; c, d).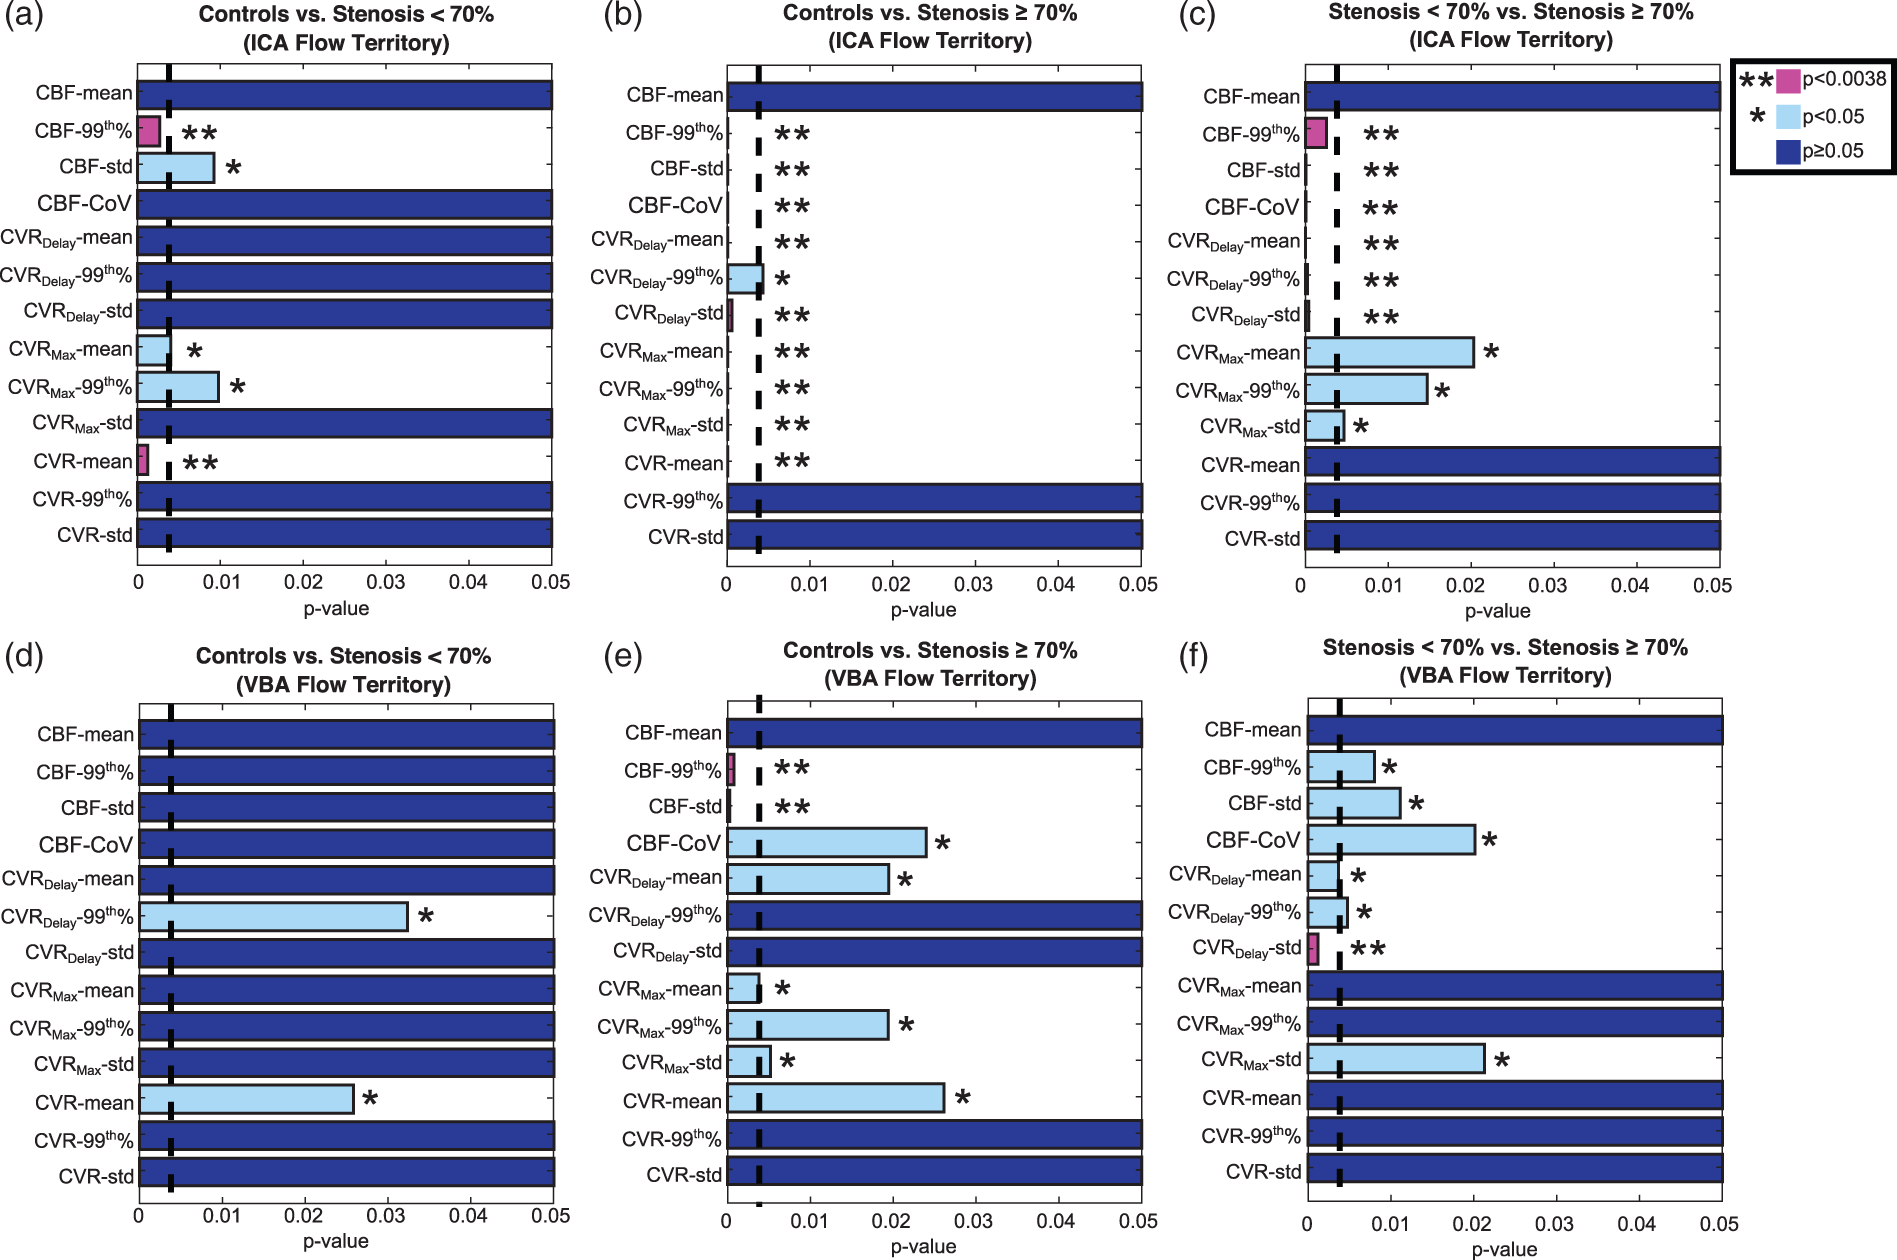
Relationships between CBF-CoV, CBF-mean, and CBF-std from the ICA territory were investigated with linear regression to identify how these variables, which all reflect spatial properties of CBF heterogeneity and blood arrival, may be related at different stages of impairment in moyamoya disease (Supplementary Figure 1). CBF-std (ICA) correlated with CBF-mean (ICA) for control (r = 0.72) and mild (r = 0.74) hemispheres, but not in hemispheres supplied by severely stenotic vessels (r = 0.37). The CBF-CoV (ICA) was correlated with CBF-std (ICA) in control hemispheres (r = 0.81) and inversely with CBF-mean (ICA) in hemispheres supplied by severely stenotic vessels (r = −0.72). In all comparisons, significance of relationships between CBF-CoV (which comprises CBF-std and CBF-mean; equation (2)), CBF-std, and CBF-mean were dependent on supplying artery stenosis. Results demonstrate that CBF-CoV may be closely related to CBF-std in control hemispheres and to CBF-mean in severely stenotic hemispheres; however, CBF-CoV may present unique information in hemispheres supplied by mildly stenotic vessels.
As an exploratory analysis, in the subgroup of patients with follow-up imaging, we investigated abilities to distinguish hemispheres with vs. without new infarcts at follow-up using single and two-variable SVM classifiers applied to data acquired at the first time point (Figure 5). In single-variable machine learning analysis, the four highest performing variables were CVRDelay-mean (VBA) (ROCAUC = 0.90, Specificity = 0.97, Sensitivity = 0.83), Age (ROCAUC = 0.84, Specificity = 0.70, Sensitivity = 1.0), CBF-mean (ICA) (ROCAUC = 0.82, Specificity = 0.91, Sensitivity = 0.83), and CBF-mean (VBA) (ROCAUC = 0.65, Specificity = 0.55, Sensitivity = 0.83). In two-variable SVM analysis, the four highest performing variable combinations were CBF-mean (ICA) and CVRDelay-mean (VBA) (ROCAUC = 0.94, Specificity = 0.85, Sensitivity = 1.0), CBF-mean (ICA) and CVRDelay-99th% (VBA) (ROCAUC = 0.93, Specificity = 0.79, Sensitivity = 1.0), CVRDelay-mean (VBA) and CVRDelay-99th% (VBA) (ROCAUC = 0.89, Specificity = 0.97, Sensitivity = 0.83), and CVRDelay-mean (VBA) and CBF-CoV (ICA) (ROCAUC = 0.88, Specificity = 0.88, Sensitivity = 0.83). Four variables discriminated hemispheres progressing to new infarcts on Wilcoxon rank-sum analysis: CBF-mean (ICA) (p = 0.001), CVRDelay-mean (VBA) (p = 0.006), CBF-CoV (ICA) (p = 0.045), and CBF-std (VBA) (p = 0.049).
Boxplots and SVM analysis with two promising variables for distinguishing hemispheres with vs. without new infarcts. Boxplots are (a) CBF-mean (ICA) in which recurrent vs. no recurrent stroke hemispheres has p = 0.001 and (b) CVRDelay-mean (VBA) in which recurrent vs. no recurrent stroke hemispheres has p = 0.006. SVM analysis is shown in (c), in which an ROCAUC = 0.94, Specificity = 0.85, and Sensitivity = 1.0 are found for distinguishing recurrent stroke risk with CVRDelay-mean (VBA) and CBF-mean (ICA).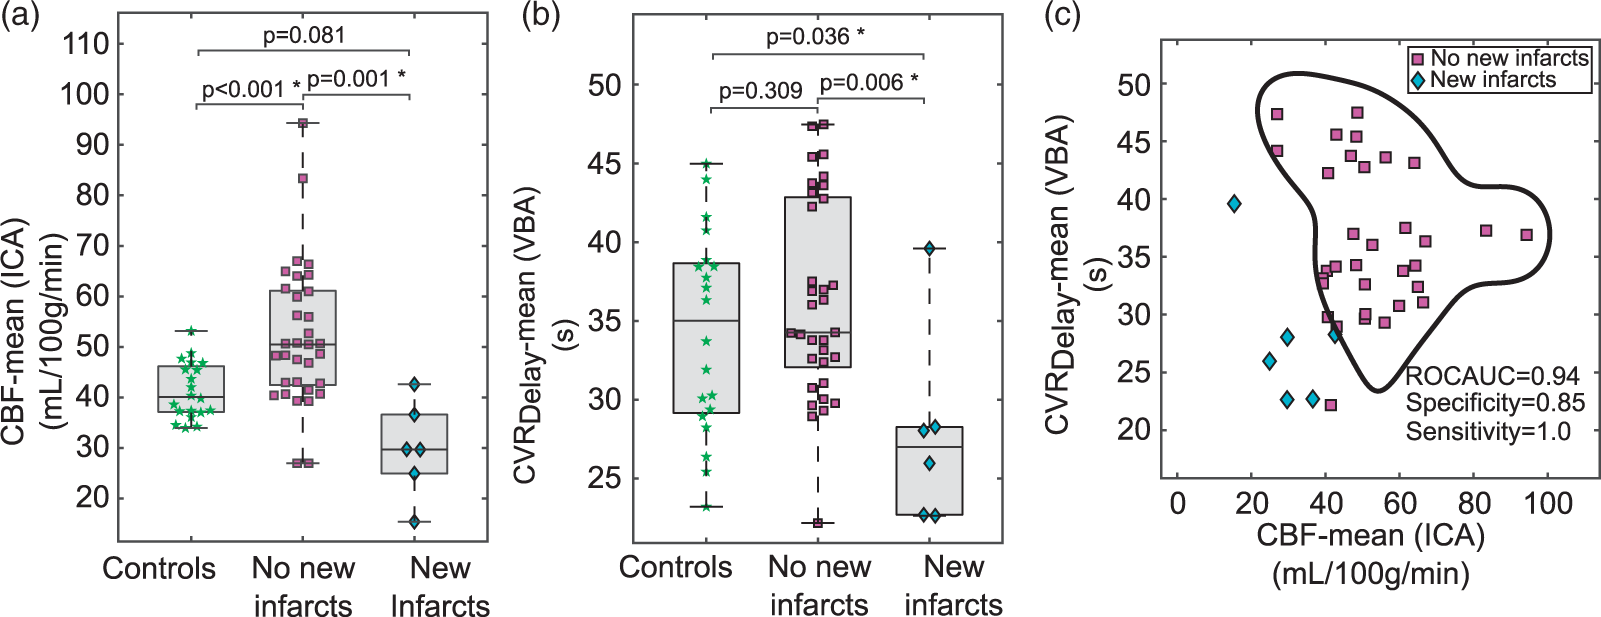
Discussion
This study analyzed non-invasive hemodynamic imaging and demographic variables from patients with non-atherosclerotic intracranial stenosis and moyamoya to understand if machine learning could be applied to classify hemispheres by arterial stenosis confirmed by gold-standard, invasive catheter angiography. The primary hypothesis is that endovascular image artifacts, which are often assumed to complicate interpretation, display maximal performance of the variables considered in SVM algorithms for distinguishing moyamoya hemispheres supplied by vessels with vs. without arterial steno-occlusion. In an exploratory analysis, CVRDelay-mean (VBA), CBF-mean (ICA), CVRDelay-99th% (VBA), CBF-CoV (ICA), and age were identified through similar machine learning procedures as having potential relevance for discriminating hemispheres at risk of developing new infarcts.
Functional contrasts identified for classifying arterial stenosis or recurrent stroke status reflect physiology previously identified in the literature. CBF-std (ICA) is consistent with endovascular signal artifacts due to delayed blood arrival. Increasing arterial collateralization throughout moyamoya progression causes longer blood arrival and arterial circulation times on the order of 2–3 s in many patients, 23 resulting in labeled blood water remaining in the arterial tree during pCASL acquisition when typical post-labeling delays of 1.5–2 s are used. This incomplete water exchange can result in heterogeneous signal intensity and over-estimation of CBF in pCASL data. Zaharchuk et al. 34 showed that hyper-intense endovascular signal artifacts on ASL MRI indicated arterial collateralization in moyamoya disease, confirmed by DSA. Mutsaerts et al. 33 also explored the relationship of CBF-CoV to complex cerebrovascular architecture in older adults with hypertension, and demonstrated that CBF-CoV is correlated with arterial transit time. More recently in patients with steno-occlusive disease, it was shown that CBF-CoV can provide contrast consistent with perfusion abnormalities. 44 Customization of pCASL labeling parameters is also an active area of research to address these limitations, and both correction and optimization strategies have been proposed. 45 In reactivity experiments, it was also previously demonstrated through cross-correlation time-delay analysis that moyamoya patients with intracranial stenosis have delayed hemodynamic response functions to respiratory stimuli. 9 These findings agree with the results of machine learning techniques presented in this work and specifically that arterial arrival artifacts on commonly-parameterized ASL images have potential diagnostic relevance in patients with moyamoya. Interestingly, CBF-mean (ICA), while commonly used to identify status of cerebrovascular disease, was not identified as a high performing variable for distinguishing hemispheres supplied by stenotic vessels in this study. This may be unique to moyamoya pathophysiology, possibly resulting from high endovascular signal artifacts artificially elevating the quantified mean CBF values. Functional variables that are conventionally used for distinguishing cerebrovascular impairment, such as CBF-mean and CVR-mean did not always have highest performance in machine learning classification and group-wise comparisons compared to time delay variables that are less often recorded, such as CBF standard deviation and mean reactivity delay.
It is also likely that some hemodynamic parameters considered here represent redundant information. For example, both CBF-std (ICA) and CBF-99th% (ICA) were found to be significant in group-wise analyses. CBF-std is elevated in patients with moyamoya due to hyperintense signal artifacts in pCASL acquisition caused by long arterial transit times. However, CBF-99th% is elevated in moyamoya due to the same reasons in many cases. Additionally, since the CBF-CoV was found to be correlated with CBF-std (ICA) in controls (r = 0.72) and hemispheres with mild stenosis (r = 0.74) and with CBF-mean (ICA) in hemispheres with severe stenosis (r = −0.72), CBF-std, CBF-mean, and CBF-CoV represent redundant information to some extent; however, this appears to vary with stenosis severity (Supplementary Figure 1).
SVM use with functional hemodynamic information extends earlier results demonstrating that machine learning, which has been applied to provide promising anatomical, 16 and functional17,18,46 classifications, also has diagnostic potential in cerebrovascular disease patients with complex vascular architecture and function. For example, Asadi et al. 47 used ANN and SVM algorithms to predict outcomes for patients receiving thrombectomy for acute ischemic stroke. Additionally, Collij et al. 18 used SVM classifiers to discriminate patients with suspected Alzheimer's disease, from mild cognitive impairment, from subjective cognitive decline using ASL perfusion maps. These findings collectively offer increased support that both anatomical and functional hemodynamic imaging can serve as important machine learning inputs. As functional changes generally precede anatomical changes, machine learning using functional data may have even more relevance for identifying disease trajectory. Applying different classification algorithms to the problem addressed in this study has the potential to improve classification performance. SVM algorithms have the advantage of high performance in binary classification, and no local minima in optimization; however, SVM performance is dependent on the choice of kernel, and most SVM theory is developed for binary classification. 48 One possible alternate classifier is the convolutional neural network (CNN), 49 which exhibits good feature extraction and high performance for analyzing and processing MRI images, and has been implemented in processing and interpretation applications for functional data, 50 segmentation,15,51 and reconstruction. 19 The random forest classifier may also perform well for distinguishing moyamoya patients based on functional image properties. 52 The random forest algorithm can be robust against over-fitting, having high performance in classification tasks, and success in a wide variety of applications, including image segmentation, 53 and disease classification. 20 Many algorithms may be suited for identifying characteristic physiology in hemo-metabolic images; however, we chose SVM since it inherently accounts for non-linearity in data, always finds global solutions, and is relatively resistant to over-fitting for a non-parametric algorithm. 48 Finally, machine learning is often associated with big data applications, to which this study's sample size is comparatively small. Particularly in the exploratory analysis (22 patients with follow-up imaging), where sample size imbalances could bias SVM algorithms. Therefore, these results should be interpreted with caution. However, they could provide motivation for future investigations with larger sample sizes. We considered sample size concerns here by using supervised SVM algorithms with no more than three dimensions, reducing model complexity and sensitivity to over-fitting.
VBA involvement in patients with new infarcts was unexpected, since only one hemisphere that displayed new infarcts had their stroke in the VBA flow territory. However, this could suggest that abnormal vascular compliance in the VBA territory may indicate a global increase in infarct risk. One possible explanation for the finding that CVRDelay in the VBA flow territory is reduced at later stages of disease is that since highly impaired moyamoya patients typically have extreme stenosis in bilateral anterior flow territories, the VBA supplies anterior flow territories via flow through the posterior communicating artery or other collateral pathways. This may reduce CVRDelay in the VBA flow territory. This could occur with greater severity at later stages of disease, making reduced CVRDelay (VBA) in moyamoya patients indirectly representative of anterior flow impairment and high risk for stroke. Importantly, of all the parameters considered, the parameter most prognostic for new infarcts was simply the mean hemispheric CBF.
It is worthwhile to consider how machine learning results may generalize to other more common cerebrovascular conditions. In atherosclerosis for example, reductions in vascular compliance 4 and increased arterial collateralization 54 are also associated with increased severity of impairment, therefore CVRDelay and CBF-std may also provide information for identifying impairment or risk. However, collateralization and hyper-intense signal artifacts are often less extreme and may influence fewer vessels in patients with atherosclerosis. It is likely that atherosclerotic intracranial stenosis will exhibit similar patterns as moyamoya; however, the extent and conspicuity of these patterns may often be more subtle; as such, these investigations may require larger sample sizes. For both stenosis severity and new infarct classification, demographic variables were not as prevalent in high-performing SVM algorithms as imaging variables. This is likely due to moyamoya patients not exhibiting many traditional stroke risk factors (e.g. smoking, diabetes, hypercholesterolemia, hypertension) as older atherosclerotic patients. However, age was identified as a high performing single-variable SVM for classifying hemispheres by new infarct status. For these reasons, the findings in this study may not translate directly to atherosclerotic intracranial stenosis or other cerebrovascular disease patients.
The results should be considered in light of the following limitations. Patient heterogeneity is always a potential confound in clinical studies. To address this, we enrolled only patients with non-atherosclerotic intracranial stenosis who are typically younger (25–45 years) and in whom traditional stroke risk factors (e.g. hypercholesterolemia, hypertension, and atherosclerosis) are less variable, as these generally become more significant in later life. Additionally, brain hemispheres with prior revascularization surgery were excluded. Second, we utilized a hypercapnic-hyperoxic stimulus, which is medical grade and available at most medical centers, although application for reactivity mapping remains as an off-label use. Hypercapnic-hyperoxia does not elicit the same CVR response as hypercapnic-normoxia; however, hypercapnic-hyperoxia has been characterized in terms of its effect on blood and tissue
In conclusion, we utilized machine-learning techniques to identify characteristic moyamoya physiology from functional hemodynamic images, and used this information to classify patients into groups determined by clinical indicators of impairment, including both vasculopathy extent and development of new infarcts. We found that functional properties that perform well for classification, such as standard deviation of CBF and mean delay in cerebrovascular response to stimulus, can be attributed to known characteristics of moyamoya progression, such as development of arterial collaterals and smooth muscle dysfunction. In an exploratory analysis of patients with new infarcts, one of the most prominent variable of those measured for predicting new infarcts was the baseline CBF in the anterior flow territory.
Supplemental Material
Supplemental material for Classifying intracranial stenosis disease severity from functional MRI data using machine learning
Supplemental Material for Classifying intracranial stenosis disease severity from functional MRI data using machine learning by Spencer L Waddle, Meher R Juttukonda, Sarah K Lants, Larry T Davis, Rohan Chitale, Matthew R Fusco, Lori C Jordan and Manus J Donahue in Journal of Cerebral Blood Flow & Metabolism
Footnotes
Funding
The author(s) disclosed receipt of the following financial support for the research, authorship, and/or publication of this article: We would like to acknowledge these sources of funding: AHA (14CSA20380466), NIH/NINDS (5R01NS078828), and NIH/NINDS (R01NS096127).
Declaration of conflicting interests
The author(s) declared the following potential conflicts of interest with respect to the research, authorship, and/or publication of this article: Manus Donahue receives research-related support from Philips North America and is the CEO of Biosight, LLC, which provides clinical trials consulting services. These arrangements have been approved by Vanderbilt University Medical Center in accordance with its conflict of interest policy.
Authors' contributions
Spencer L Waddle: Data acquisition, analysis, manuscript drafting, interpretation of results, and study conception. Meher R Juttukonda: Data acquisition, manuscript revision, analysis and interpretation of results. Sarah K Lants: Data acquisition, analysis, and manuscript revision. Larry T Davis: Referral of moyamoya patients, performed clinical procedures and grading of images. Rohan Chitale: Referral of moyamoya patients, performed clinical procedures and grading of images. Matthew R Fusco: Referral of moyamoya patients, performed clinical procedures and grading of images. Lori C Jordan: Interpretation of results, manuscript revision, grading of images, and study conception. Manus J Donahue: Data acquisition, manuscript revision, interpretation of results, study conception, and analysis.
Supplementary material
Supplemental material for this article is available online.
References
Supplementary Material
Please find the following supplemental material available below.
For Open Access articles published under a Creative Commons License, all supplemental material carries the same license as the article it is associated with.
For non-Open Access articles published, all supplemental material carries a non-exclusive license, and permission requests for re-use of supplemental material or any part of supplemental material shall be sent directly to the copyright owner as specified in the copyright notice associated with the article.