
Abstract
Rodent 13C magnetic resonance spectroscopy studies show that glutamatergic signaling requires high oxidative energy in the awake resting state and allowed calibration of functional magnetic resonance imaging (fMRI) signal in terms of energy relative to the resting energy. Here, we derived energy used for glutamatergic signaling in the awake resting human. We analyzed human data of electroencephalography (EEG), positron emission tomography (PET) maps of oxygen (CMRO2) and glucose (CMRglc) utilization, and calibrated fMRI from a variety of experimental conditions. CMRglc and EEG in the visual cortex were tightly coupled over several conditions, showing that the oxidative demand for signaling was four times greater than the demand for nonsignaling events in the awake state. Variations of CMRO2 and CMRglc from gray-matter regions and networks were within ± 10% of means, suggesting that most areas required similar energy for ubiquitously high resting activity. Human calibrated fMRI results suggest that changes of fMRI signal in cognitive studies contribute at most ± 10% CMRO2 changes from rest. The PET data of sleep, vegetative state, and anesthesia show metabolic reductions from rest, uniformly >20% across, indicating no region is selectively reduced when consciousness is lost. Future clinical investigations will benefit from using quantitative metabolic measures.
INTRODUCTION
The human brain consumes 20% of the body's energy at rest despite being only 2% of total body mass. 1 Normally glucose oxidation is the source of energy production supporting brain function 2 in which gray-matter signaling (i.e., events associated with neuronal firing) is dominated by glutamatergic neurons. 3 Estimates of the fraction of resting brain energy devoted to signaling were originally quite low. 4 But recent experimental studies in rodents and theoretical modeling have converged on the conclusion that majority of the resting energy consumption supports glutamatergic signaling and the energy demand changes linearly with pyramidal neuron firing rates and glutamate neurotransmitter release and reuptake.5–9 Therefore in rodent models it is possible, to a first order, to show that the resting energy is primarily dedicated to total glutamatergic signaling, and the changes in neuronal signaling relative to a well-defined resting activity level can be used to calibrate changes in energy consumption during functional magnetic resonance imaging (fMRI) experiments.10,11
In the awake human brain, however, the fraction of resting energy usage devoted to glutamatergic signaling is less well understood. The magnitude of neuronal signaling in the human brain, and by inference the commensurate energy demand, underscores the functional relevance of resting activity and has profound implications for interpreting fMRI experiments in humans.12–14 Given the rapidly increasing use of resting-state fMRI in mapping networks—defined as a subset of cortical and subcortical gray-matter regions that function together15,16—it is important to quantitatively establish if in the resting human the metabolic demand for neuronal signaling is high, as has been established for the rodent,5,7–9 and to what extent metabolic demand varies across gray-matter regions.
13 C magnetic resonance spectroscopy (MRS) of 13 C-labeled substrates (e.g., glucose and acetate) can measure rates of 13 C label incorporation into cell-specific pools (e.g., glutamate and γamino butyric acid (GABA) are predominantly neuronal and glutamine is predominantly glial) thereby estimating metabolic fluxes 17 of neuronal glucose oxidation (CMRglc(ox),N) and of total glutamate neurotransmitter cycling (Vcyc(tot)). Rat 13 C MRS studies, over a wide range of activities (i.e., from isoelectric pentobarbital anesthesia under which there is no excitatory signaling to mildly anesthetized or awake states with higher signaling), showed a tight correlation between Vcyc(tot) and CMRglc(ox),N (Figure 1; Supplementary Table 1). This neurometabolic coupling in the rat somatosensory cortex, spanning from awake to anesthetized conditions (Figure 1), has significance for a wide range of cerebral activities. First, it showed a linear relationship between neuronal activity (as measured by glutamatergic function) and oxidative demand. Furthermore at the intercept where Vcyc(tot) decreases to zero, CMRglc(ox),N is ~0.1 μmol/g per minute, which corresponds to at most ~20% of total energy in the awake brain. Hence, in the awake resting rodent brain at least 80% of the neuronal energy demand is devoted to events associated with neuronal signaling.
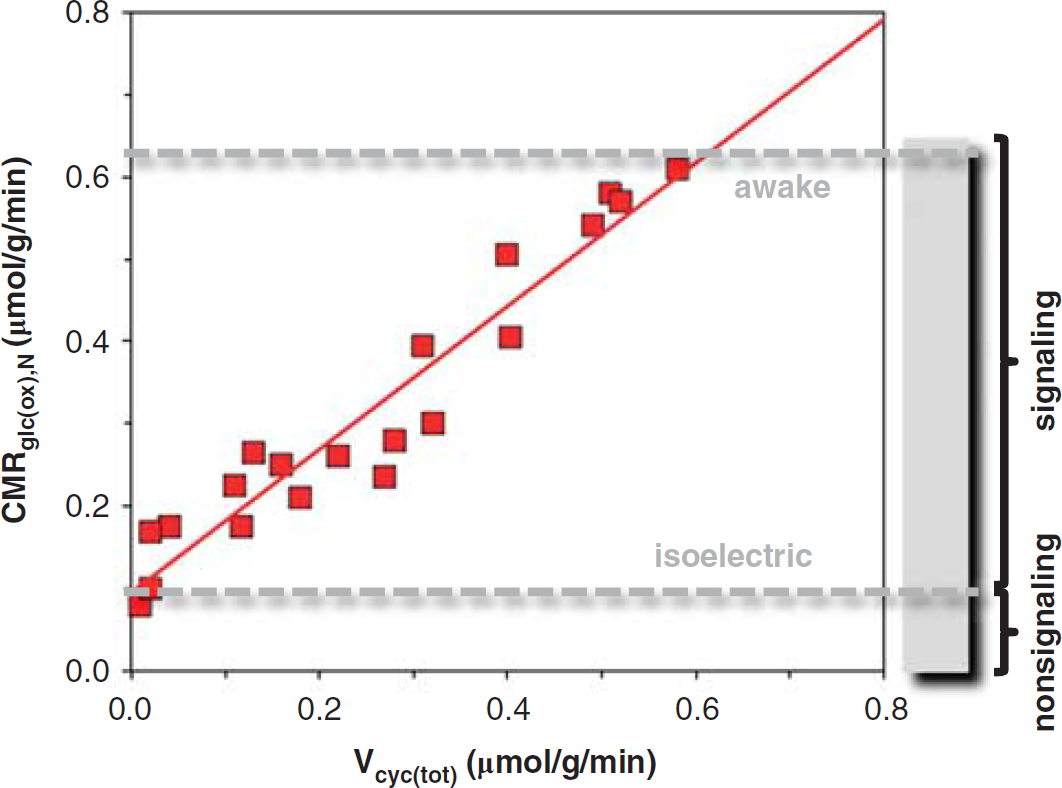
Summary of 13 C magnetic resonance spectroscopy (MRS) results from the rat somatosensory cortex. Relationship between rates of glutamate neurotransmitter cycling (Vcyc(tot)) and glucose oxidation in neurons (CMRglc(ox),N) derived by 13 C MRS. The different data points represent a variety of anesthetized and awake conditions (Supplementary Table 1). The results suggest that ~80% of the resting energy consumption in the awake rat brain is dedicated to events associated with neuronal activity. The red line is the best-fit linear regression of the rat data (i.e., CMRglc(ox),N = 0.9 Vcyc(tot) + 0.1, R 2 = 0.92).
Because the blood oxygenation level-dependent (BOLD) contrast in fMRI is an indirect measure of neuronal activity, 18 new methods have been developed for calibrating or converting the BOLD response into changes of oxidative energy demanded by neuronal signaling (for a historical perspective, see Hyder and Rothman 19 ). Calibrated fMRI uses multimodal fMRI measurements of changes in BOLD signal, blood flow (CBF), and blood volume (CBV) to evaluate changes in oxidative demand (CMRO2), which is a fundamental parameter of brain function. Rat studies over a wide range of activities in the somatosensory cortex showed that values of (CMRO2) obtained from calibrated fMRI agreed with rates of pyramidal neuron firing (ν) measured by extracellular recordings. These studies, which measured changes in CMRO2 and ν during sensory stimulation from deeply and mildly anesthetized resting states, also show tight neurometabolic coupling (Figure 2).
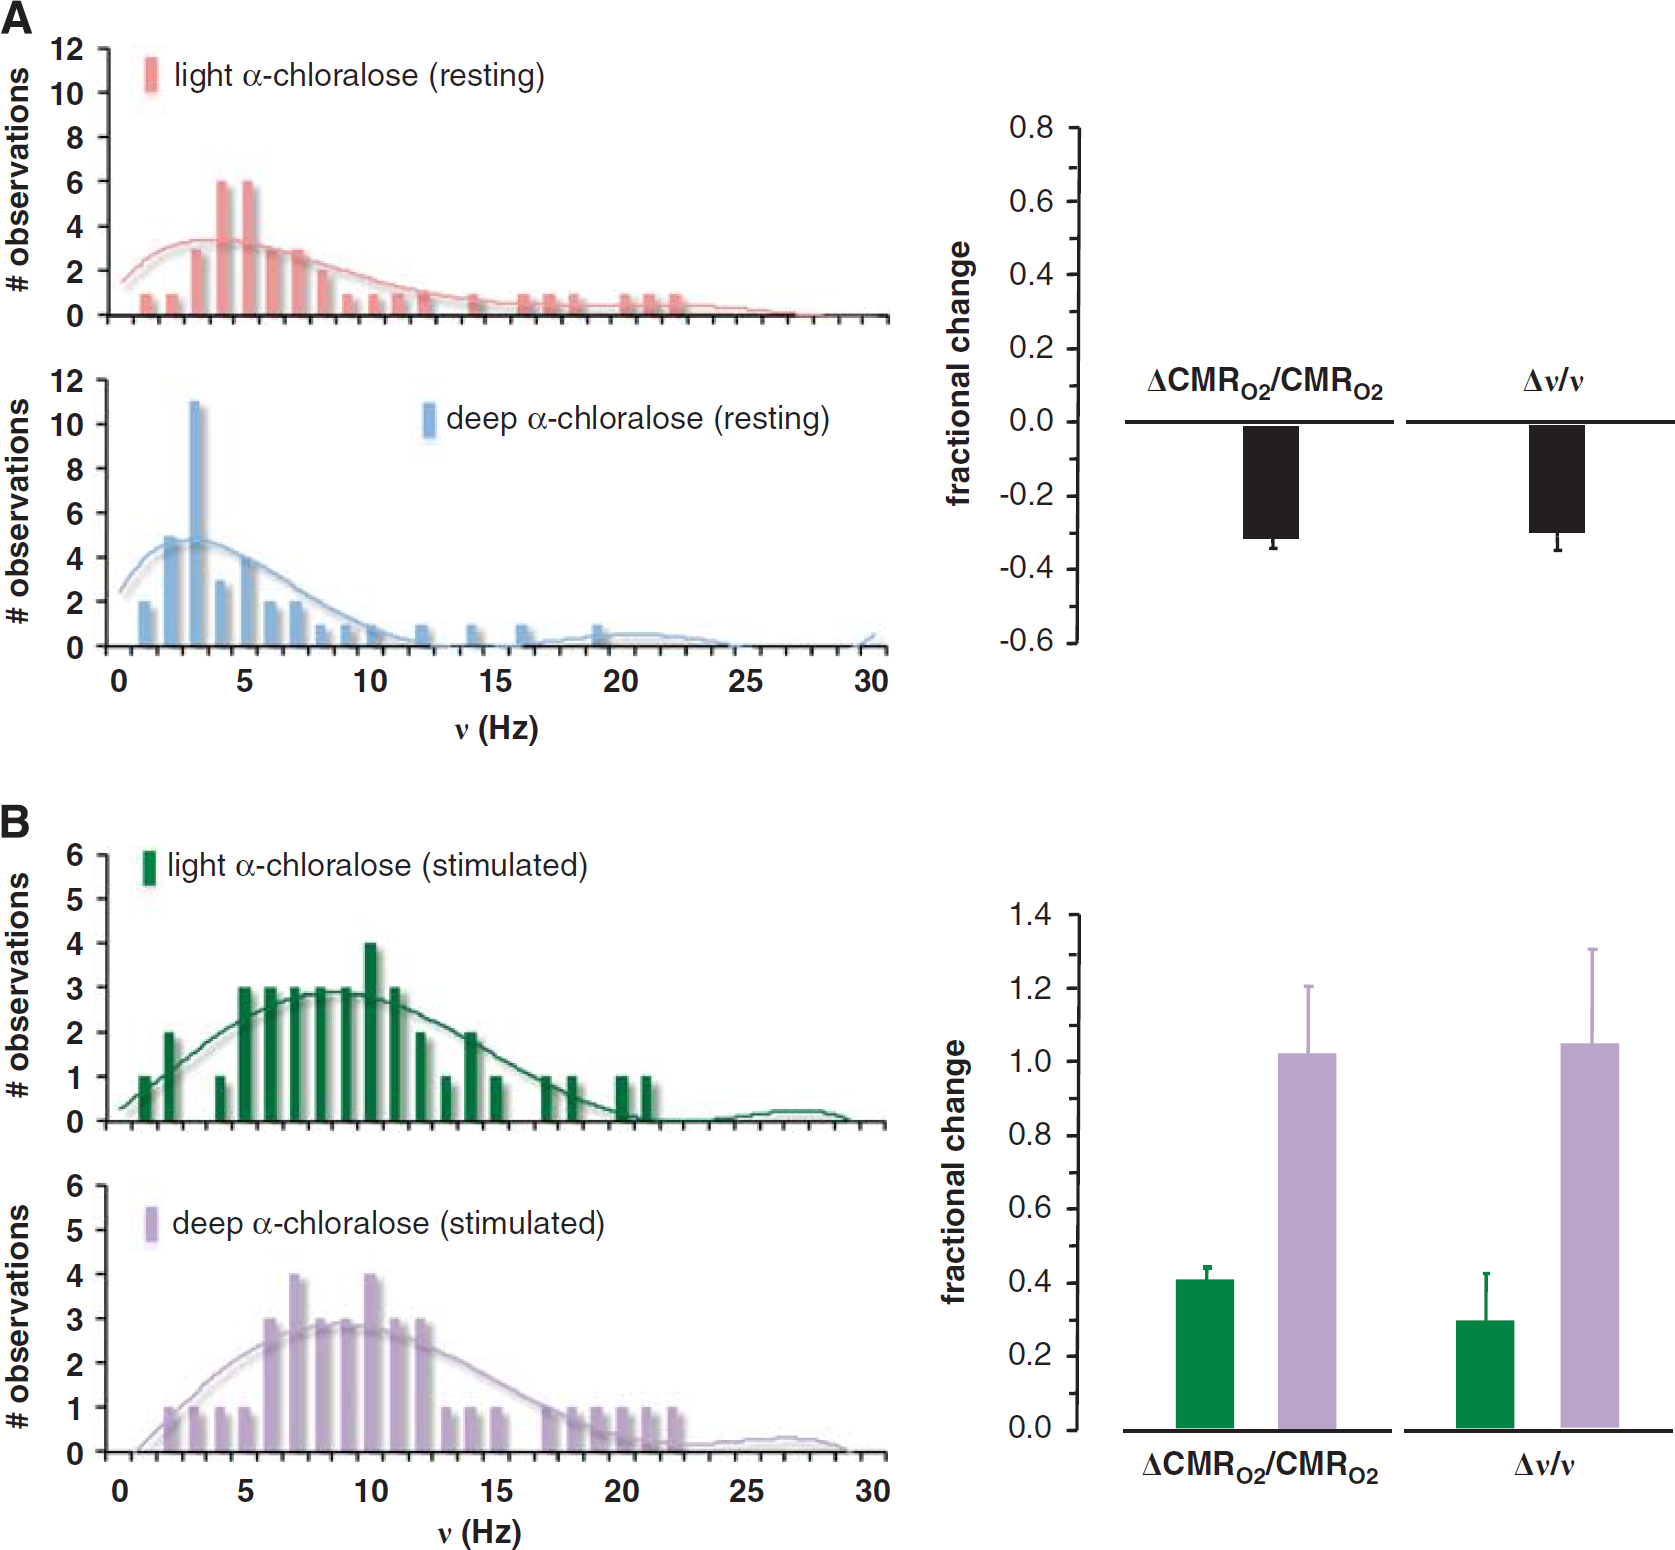
Summary of electrophysiology and calibrated functional magnetic resonance imaging (fMRI) results from the rat somatosensory cortex. Relationship between fractional changes in oxidative energy demand of neurons (ΔCMRO2/CMRO2) and pyramidal neuron firing rate (Δν/ν) obtained by calibrated fMRI and electrophysiology, respectively.
7
Histograms, which represent firing rates of a population of neurons, are shown for (
These studies 7 reported that as anesthetic dose increased the histograms, which represent firing rates of a population of neurons, shifted to lower firing rates so that both CMRO2 and ν decreased proportionately (Figure 2A). Moreover, on sensory stimulation from each of the anesthetized states the histograms shifted to higher firing rates so that both CMRO2 and ν increased consistently (Figure 2B). In agreement with the earlier 13 C MRS results (Figure 1), these calibrated fMRI and electrophysiology results (Figure 2) showed a direct relationship between neuronal activities, as measured by multiunit firing of pyramidal neurons, and their oxidative demand. These results also showed that CMRO2 changes derived from calibrated fMRI are closely associated with glutamatergic function.20,21
Results from other methods (e.g., electroencephalography (EEG), positron emission tomography (PET), 2-deoxyglucose (2DG) autoradiography) generally showed coupling between cortical activity and oxidative demand. 2DG autoradiographic studies in rats 22 and PET studies in primates 23 showed that anesthetic-dependent CMRglc decreased uniformly in the cerebral cortex. In humans, as discussed in the next section, EEG and PET data collected under different anesthetized states 24 measured coupled decreases in electrical activity and energy metabolism in the cerebral cortex.
These converging results by independent methods, in addition to the results depicted in Figures 1 and 2, are consistent with the current understanding of molecular action of anesthetics, 25 in which the dose-dependent potentiation of GABAergic systems affects the glutamatergic system by decreasing cortical activity/firing and energy demand. Glutamate and GABA, the major excitatory and inhibitory neurotransmitters, constitute >90% of cortical neurons in the adult mammalian brain. 3
Results from rat studies suggest a tight neurometabolic coupling (i.e., nearly 1:1 relationship of ΔVcyc(tot):ΔCMRglc(ox),N and Δν:ΔCMRO2 as shown in Figures 1 and 2), with much smaller nonsignaling energy demand in the awake brain. But the question remains as to whether the same is true in the human brain. Moreover, it is not known if the energy demand for glutamatergic function in the awake resting human varies across brain regions. We used quantitative human brain imaging results from multiple modalities—EEG, PET, and calibrated fMRI—to estimate the fraction of resting energy consumption that supports glutamatergic signaling and to determine how gray-matter signaling varies regionally and under different conditions. The results of this meta-analysis, the potency of which is based on data collected from methods independent of 13 C MRS and on data collected in other laboratories, suggest that the oxidative energy demand of glutamatergic signaling in the resting awake human brain is close to uniform in gray-matter space of the whole brain, a measurable property that could be of potential use in neurologic and psychiatric diagnosis.
ASSESSING THE OXIDATIVE DEMAND FOR EXCITATORY SIGNALING IN THE HUMAN BRAIN
To derive evidence for an experimentally based relationship between neuronal oxidative demand and neuronal activity in the human brain, we analyzed human PET measurements of glucose utilization (CMRglc) under different conditions and compared them with human EEG measurements under similar conditions. These CMRglc and EEG data came from numerous behavioral conditions—awake, sleep, and different vegetative and sedated (i.e., anesthetized) states (Supplementary Table 2). All averaged CMRglc values were localized to the primary visual cortex. The EEG data were presented as bispectral index (BIS) values, ranging from 0 to 100, representing EEG silence (i.e., isoelectricity) to awake condition, respectively. 26 Bispectral index is based on the weighted sum of several EEG parameters, spanning both time and frequency domains. The BIS measure is intended for monitoring the depth of anesthesia during surgeries where expert interpretation of the raw EEG data in terms of the different frequency bands, which change with overt behavioral variations, is not easily available.26,27 While EEG is not as quantitative as microelectrode recordings, it has the advantage of noninvasively measuring small voltage fluctuations in vivo resulting from current flows within pyramidal neurons spanning cortical gray matter. 28
As shown in Figure 3A, there is a close to linear dependence of BIS (measured by EEG) with CMRglc (measured by PET). The BIS and CMRglc values were obtained from different studies, but for the same experimental conditions. A best-fit of the data suggests that at isoelectricity (i.e., no neuronal signaling) CMRglc is reduced to ~20% of the resting awake value, which means that at least 80% of total energy production in the human cerebral cortex is dedicated to excitatory signaling demands while the remaining fraction supports nonsignaling events. Another estimate of energy expenditure for minimal neuronal signaling can be obtained from comparing the CMRglc values in the persistent vegetative state (0.09 ± 0.02 μmol/g per minute) with the resting awake state (0.34 ± 0.04 μmol/g per minute). The comparison suggests that as much as 25% of the awake CMRglc value could be assigned to isoelectricity if it is assumed that the persistent vegetative state represents a state with minimal cortical activity. In other words, the finite intercept of the human PET and EEG data suggests nonnegligible energy consumption during isoelectric situations (Figure 3A), in congruence with 13 C MRS values from rat brain (Figure 1), which are ~20% to 25% of the energy in the awake state. Unfortunately, the 13 C MRS data in the human are not as comprehensive as for the rat. While available human 13 C MRS data are limited to the visual cortex with varying degrees of partial volume effects arising from white matter (Supplementary Table 1), the measured proportions of ΔVcyc(tot) and ΔCMRglc(ox),N agree quite well across both species (Supplementary Figure 1). Furthermore, as shown in Figure 3B, the high ratio of Vcyc(tot)/CMRglc(ox),N for the awake resting condition in the human suggests that events associated with glutamatergic neurotransmission consumes a majority of brain oxidative energy, similar to the rat. However, the absolute values of Vcyc(tot) and CMRglc(ox),N in the awake human and awake rat are significantly different, potentially because of lower metabolic rates in the human cerebral cortex.
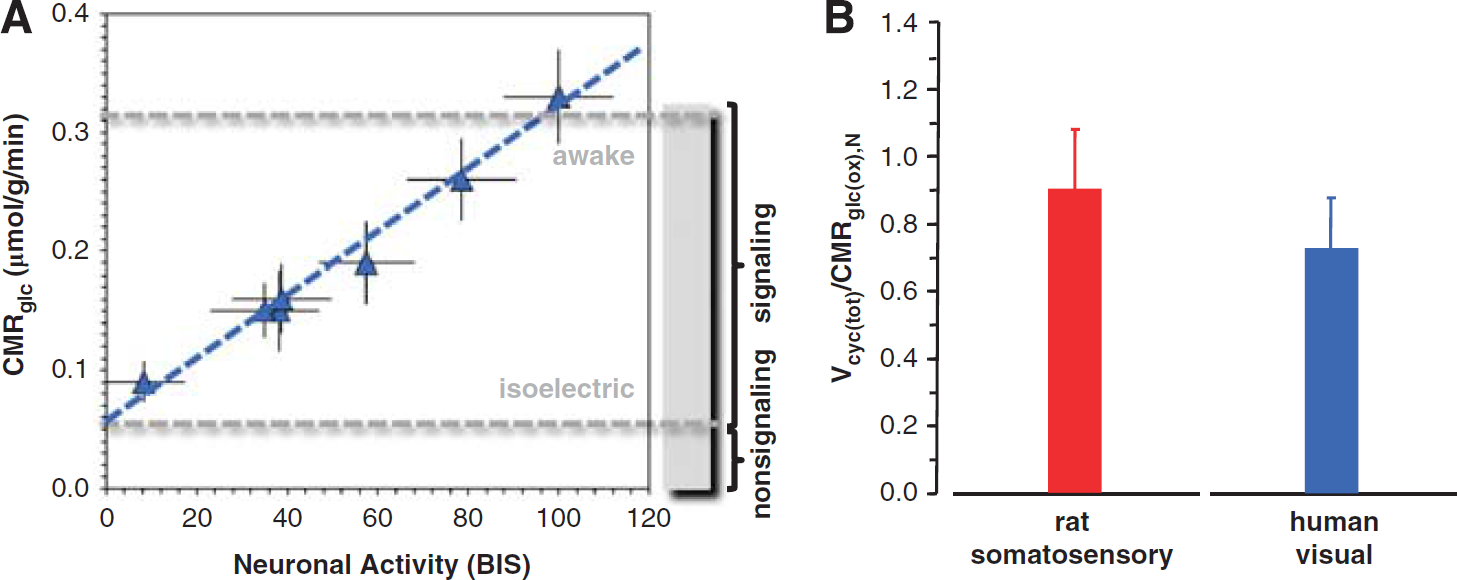
Summary of positron emission tomography (PET), electroencephalography (EEG), and
13
C magnetic resonance spectroscopy (MRS) results from the human visual cortex. (
Overall, these results suggest that metabolic energy demand for neuronal activity in the awake human is quite high and that there is tight neurometabolic coupling. However, a limitation of this analysis is that it depends on the quantitative accuracy with which BIS reflects various behavioral states.27,29 While studies have shown that BIS values correlate well with other clinical sedation scores,26,27 more studies are needed to assess the trends of BIS values across different sedation levels with different anesthetics. Clearly, the weakest data points in Figure 3A are the vegetative states because of possible tissue damage in cortical regions, which if included or removed do not significantly vary the linear regression tests (i.e., with or without the vegetative state data points, the slope is unchanged while the intercept changes from 0.06 to 0.04 μmol/g per minute). The similar values for these regressions argue that some minimal metabolism is present even in vegetative states, presumably for reduced signaling but other unknown factors could also be active. In the future, it should be possible to measure Vcyc(tot) and CMRglc(ox),N in humans by 13 C MRS studies under different anesthetized states, as previously performed in rats. In some cases, such as in patients undergoing presurgical evaluation, it may be possible to directly measure neuronal firing 30 and then relate those measurements to cerebral metabolism.
REGIONAL OXIDATIVE DEMAND FOR GLUTAMATERGIC ACTIVITY IN THE RESTING AWAKE HUMAN BRAIN
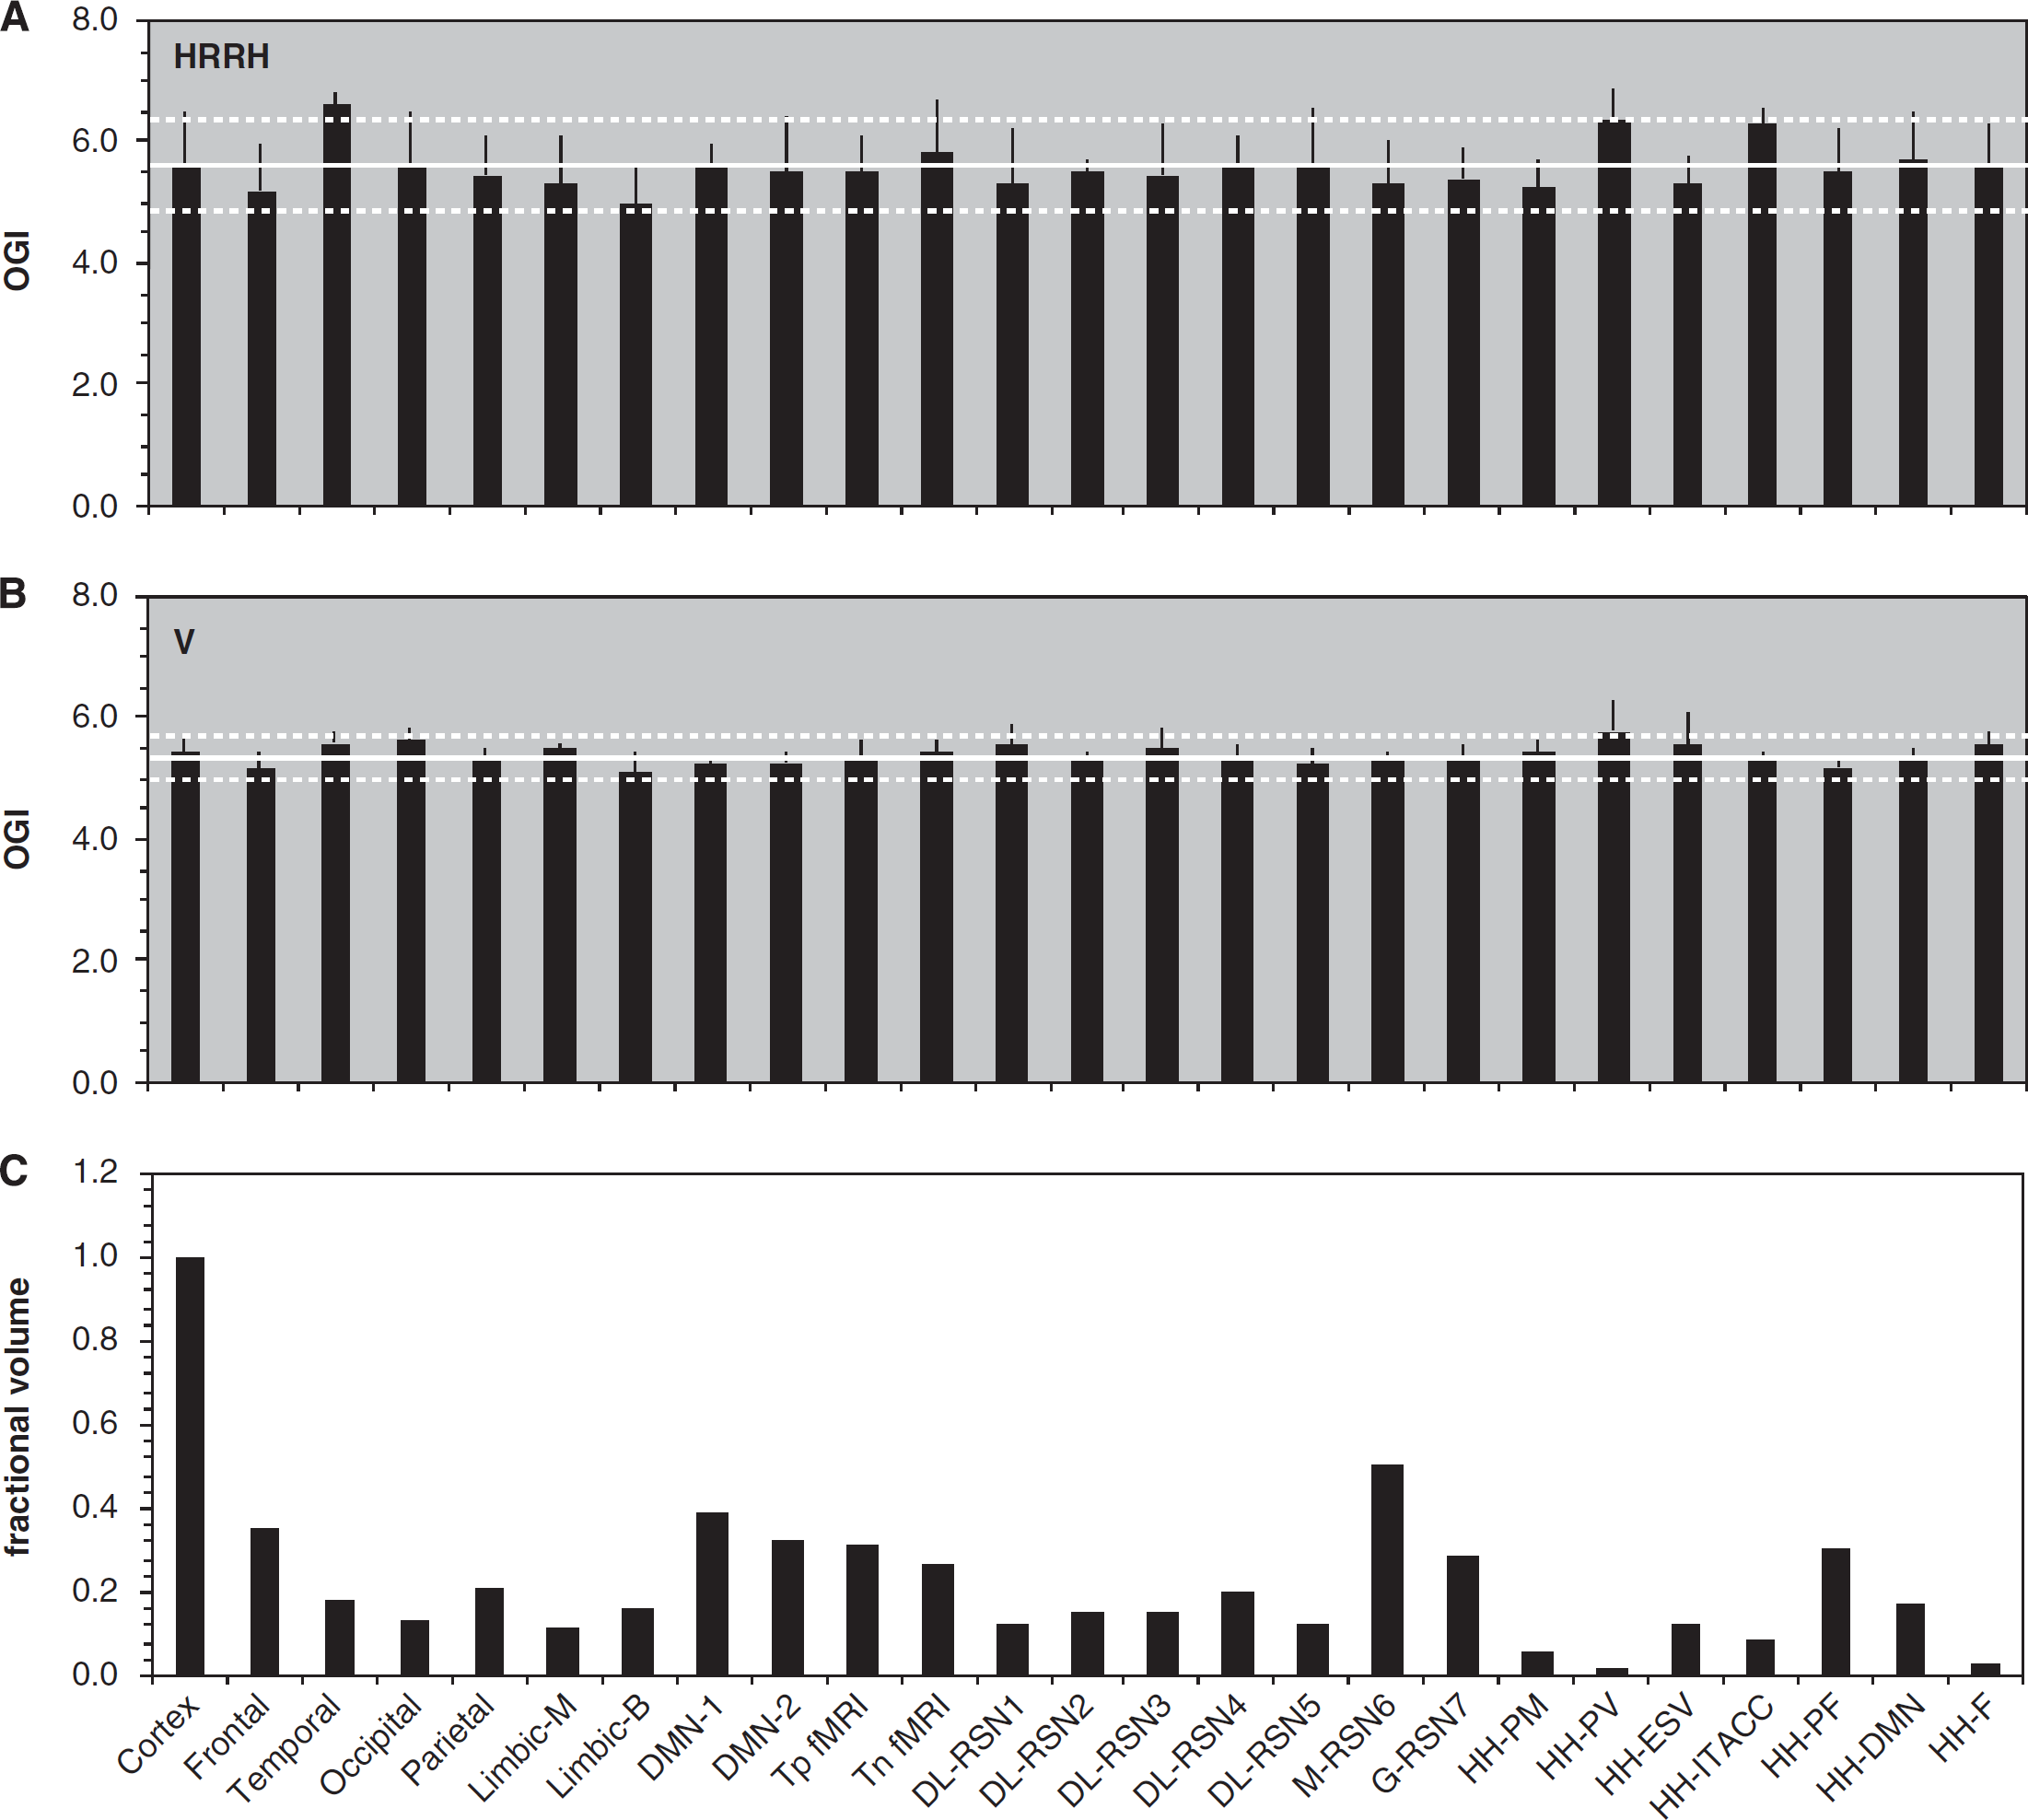
To determine whether awake resting energy and coupled neuronal activity are uniform across different regions, we analyzed regional distributions of CMRO2 and CMRglc in the normal human brain from PET data acquired under typical experimental settings of awake but eyes closed and ears covered (i.e., quiet experimental settings).31–35 The meta-analysis was composed of CMRO2 and CMRglc values from as few as 23 and as many as 46 distinct brain areas in 109 subjects. BioImage Suite (www.bioimagesuite.org)—an integrated image analysis software 36 —was used for reporting coordinates in standard brain templates to represent gray-matter regions in cortical and subcortical areas (Supplementary Figure 2; Supplementary Table 3). Four older data sets reported CMRO2 and CMRglc in absolute units,31–34 whereas a more recent data set reported CMRO2 and CMRglc in relative units. 35 The older and newer data, abbreviated as HRRH and V, were analyzed separately. From the HRRH data, we obtained one gray-matter mean absolute value of CMRglc and one mean gray-matter absolute value of CMRO2. The respective gray matter mean absolute values of CMRglc and CMRO2 from the HRRH data were then multiplied by the gray-matter relative values of CMRglc and CMRO2 from the V data. The oxygen-to-glucose index (OGI) was calculated from the CMRO2/CMRglc ratio. The left-right asymmetries in HRRH and V data were negligible (Supplementary Figure 3). Although the HRRH and V data had slightly different brain coverage, the pooled data sets allowed representation of the entire gray-matter space because missing regions in an individual data set were compensated by availability of coverage from other data sets (Supplementary Figure 4).
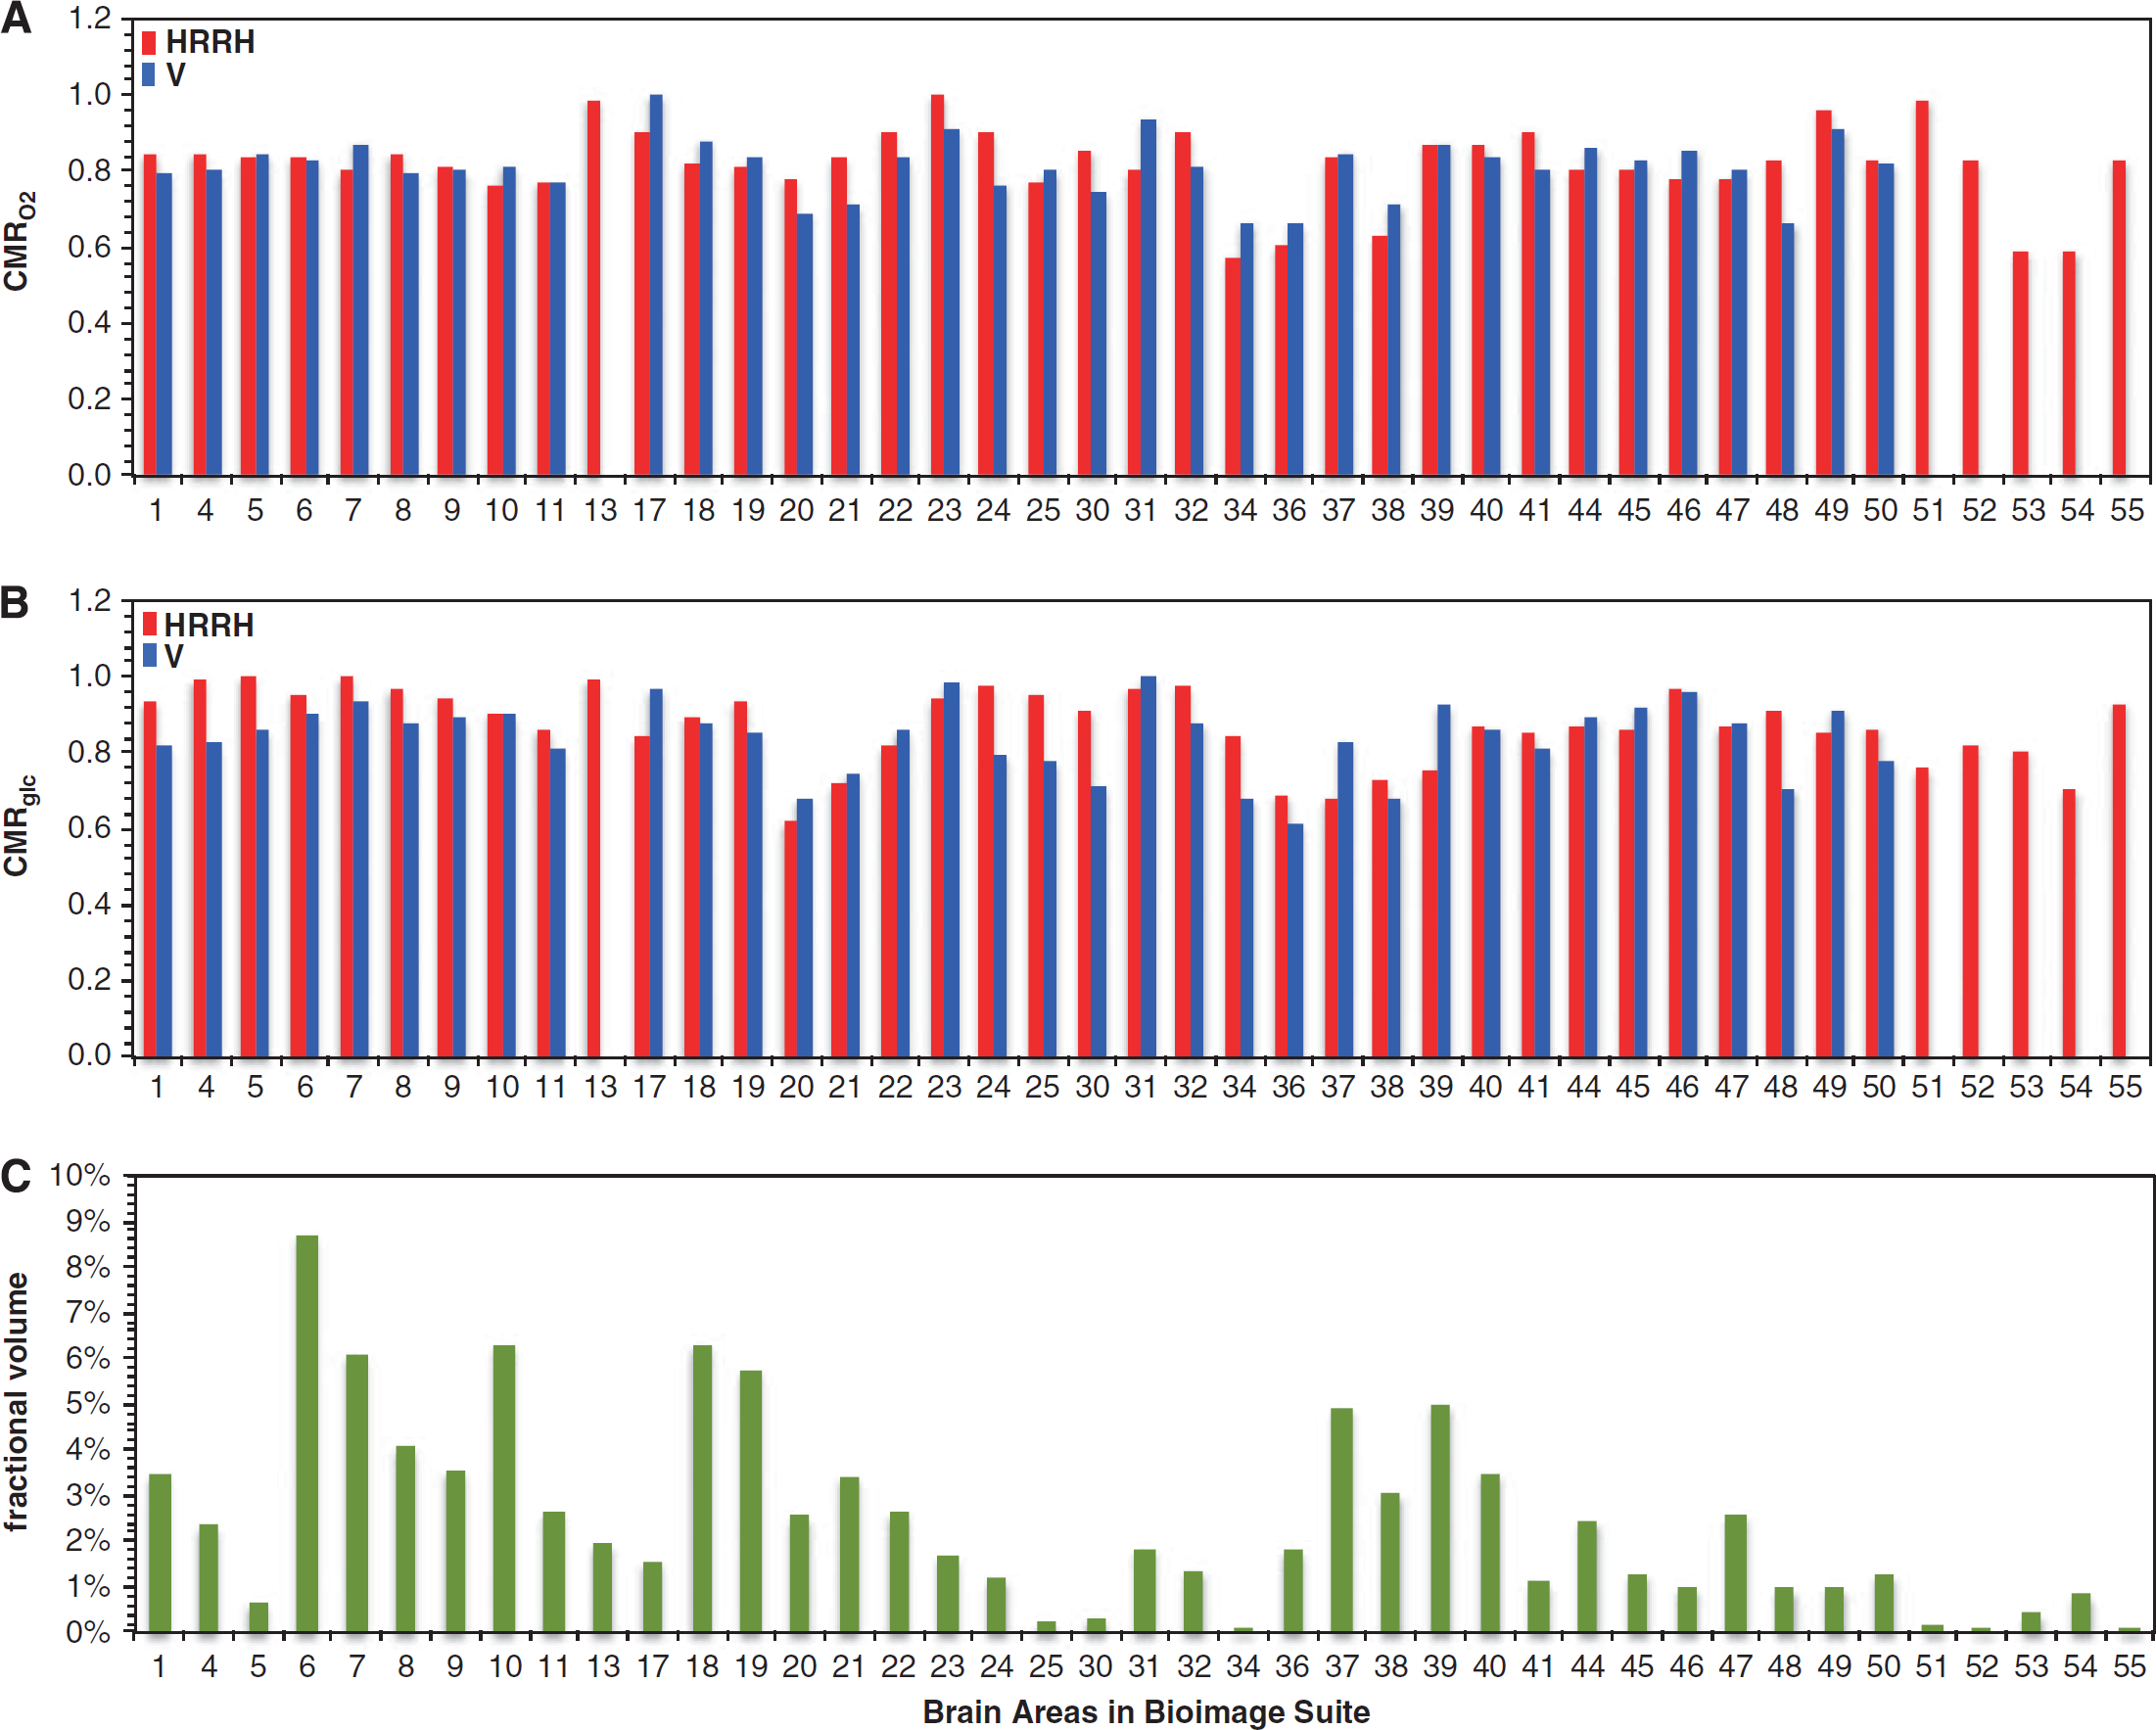
Summary of oxidative demand across regions for the resting awake human brain. Comparison of relative values of (
While deviations of ± 10% from the mean CMRO2 and CMRglc values were observed across the majority of regions in HRRH and V data separately, the pooled data showed that regions with >10% deviations in CMRO2 and CMRglc corresponded to <10% of the entire gray-matter space (Figure 4). Some of the lowest metabolic values were found in the amygdala, hippocampus, entorhinal cortex, parahippocampal cortex, and temporopolar area, whereas some of the highest metabolic values were located in the insular cortex, cingulate cortex, putamen, and globus pallidus (Supplementary Figure 5).
Summary of oxidative demand in various networks for the resting awake human brain. Comparison of (
But how do these cortical CMRglc differences in the awake human PET data compare with awake primate PET data and awake rat 2DG data? Direct metabolic comparisons at rest across species should be made cautiously because the human PET data are usually from subjects in quiet settings (i.e., eyes closed and ears covered) without exposure to any drugs,31–35 whereas rat 2DG 22 and primate PET 23 data may be from variable experimental conditions (e.g., some level of thalamic activation when awake and reawakening from mild sedation). In 2DG studies, most cortical areas in mammals show <20% variation from the mean CMRglc values in the awake state, whereas PET data from human (reviewed here) and primate brains show <10% CMRglc variation across cortical and subcortical regions.
In the HRRH and V data, the respective mean CMRO2 values were 1.7 ± 0.2 and 1.8 ± 0.2 μmol/g per minute, whereas respective mean CMRglc values were 0.30 ± 0.03 and 0.34 ± 0.04 μmol/g per minute. These mean CMRO2 and CMRglc values corresponded to respective mean OGI values of 5.6 ± 0.8 and 5.4 ± 0.3 for the HRRH and V data sets, which are in good agreement with prior results.37–41 The slightly better regional stability in the V data (versus the HRRH data) was likely because of better spatial resolution in the V data, which were presumably less affected by partial volume effects arising from white matter, which has a much lower average metabolic rate than gray matter and a variable percentage within the image voxels can cause significant rate variations even with a constant rate of gray-matter metabolism. However in some small brain regions the metabolic values varied by as much as 50% from the gray-matter mean (Figure 4).
For example, in the HRRH data the lowest/highest metabolic values, in units of μmol/g per minute, were ~1.2/2.0 for CMRO2 (gray-matter mean of 1.7 μmol/g per minute) and 0.21/0.34 for CMRglc (gray-matter mean of 0.30 μmol/g per minute), respectively. The lowest and highest CMRO2 values were located in parahippocampal gyrus and ventral posterior cingulate cortex (i.e., see # 34 and 23 in Supplementary Table 3). The lowest CMRglc value was located in inferior temporal gyrus, whereas the highest CMRglc values were found in areas like primary motor cortex, somatosensory association cortex, and insular cortex (i.e., see # 20, 4, 5, and 13 in Supplementary Table 3). But each of these regions corresponded to <2% of gray-matter space (see Supplementary Table 3). Similar trends were observed in the V data. Thus the majority of regions, which together represented >85% of gray-matter space, were within 10% of the mean CMRO2 and CMRglc values (Supplementary Figure 5).
We also examined whether there are differences in metabolic demands of brain networks, because considerable interest had been raised for the default mode network by reports that it has exceptionally high metabolic rate.42–44 Networks were identified as either classic or contemporary based on anatomic and functional boundaries, respectively (Supplementary Table 4). Classic networks consisted of homologous areas of major vascular branching, for example, frontal lobe, temporal lobe, occipital lobe, parietal lobe, and medial or basolateral limbic areas. 45 Contemporary networks consisted of regions identified from resting-state fMRI experimental results.42,46–52 Sizes of classic networks varied from ~11% (medial limbic area) to 35% (frontal lobe) of gray-matter space, whereas sizes of contemporary networks varied substantially, for example, a frontal network (HH-F in Figure 5) was only 2.5% of gray-matter space, 52 whereas a conscious resting-state network (M-RSN6 in Figure 5) was ~50% of gray-matter space. 50 All networks examined were found to be within ± 10% of the mean OGI in gray matter (Figure 5), which are based on similar variations of CMRO2 and CMRglc across gray-matter space (Supplementary Figure 6).
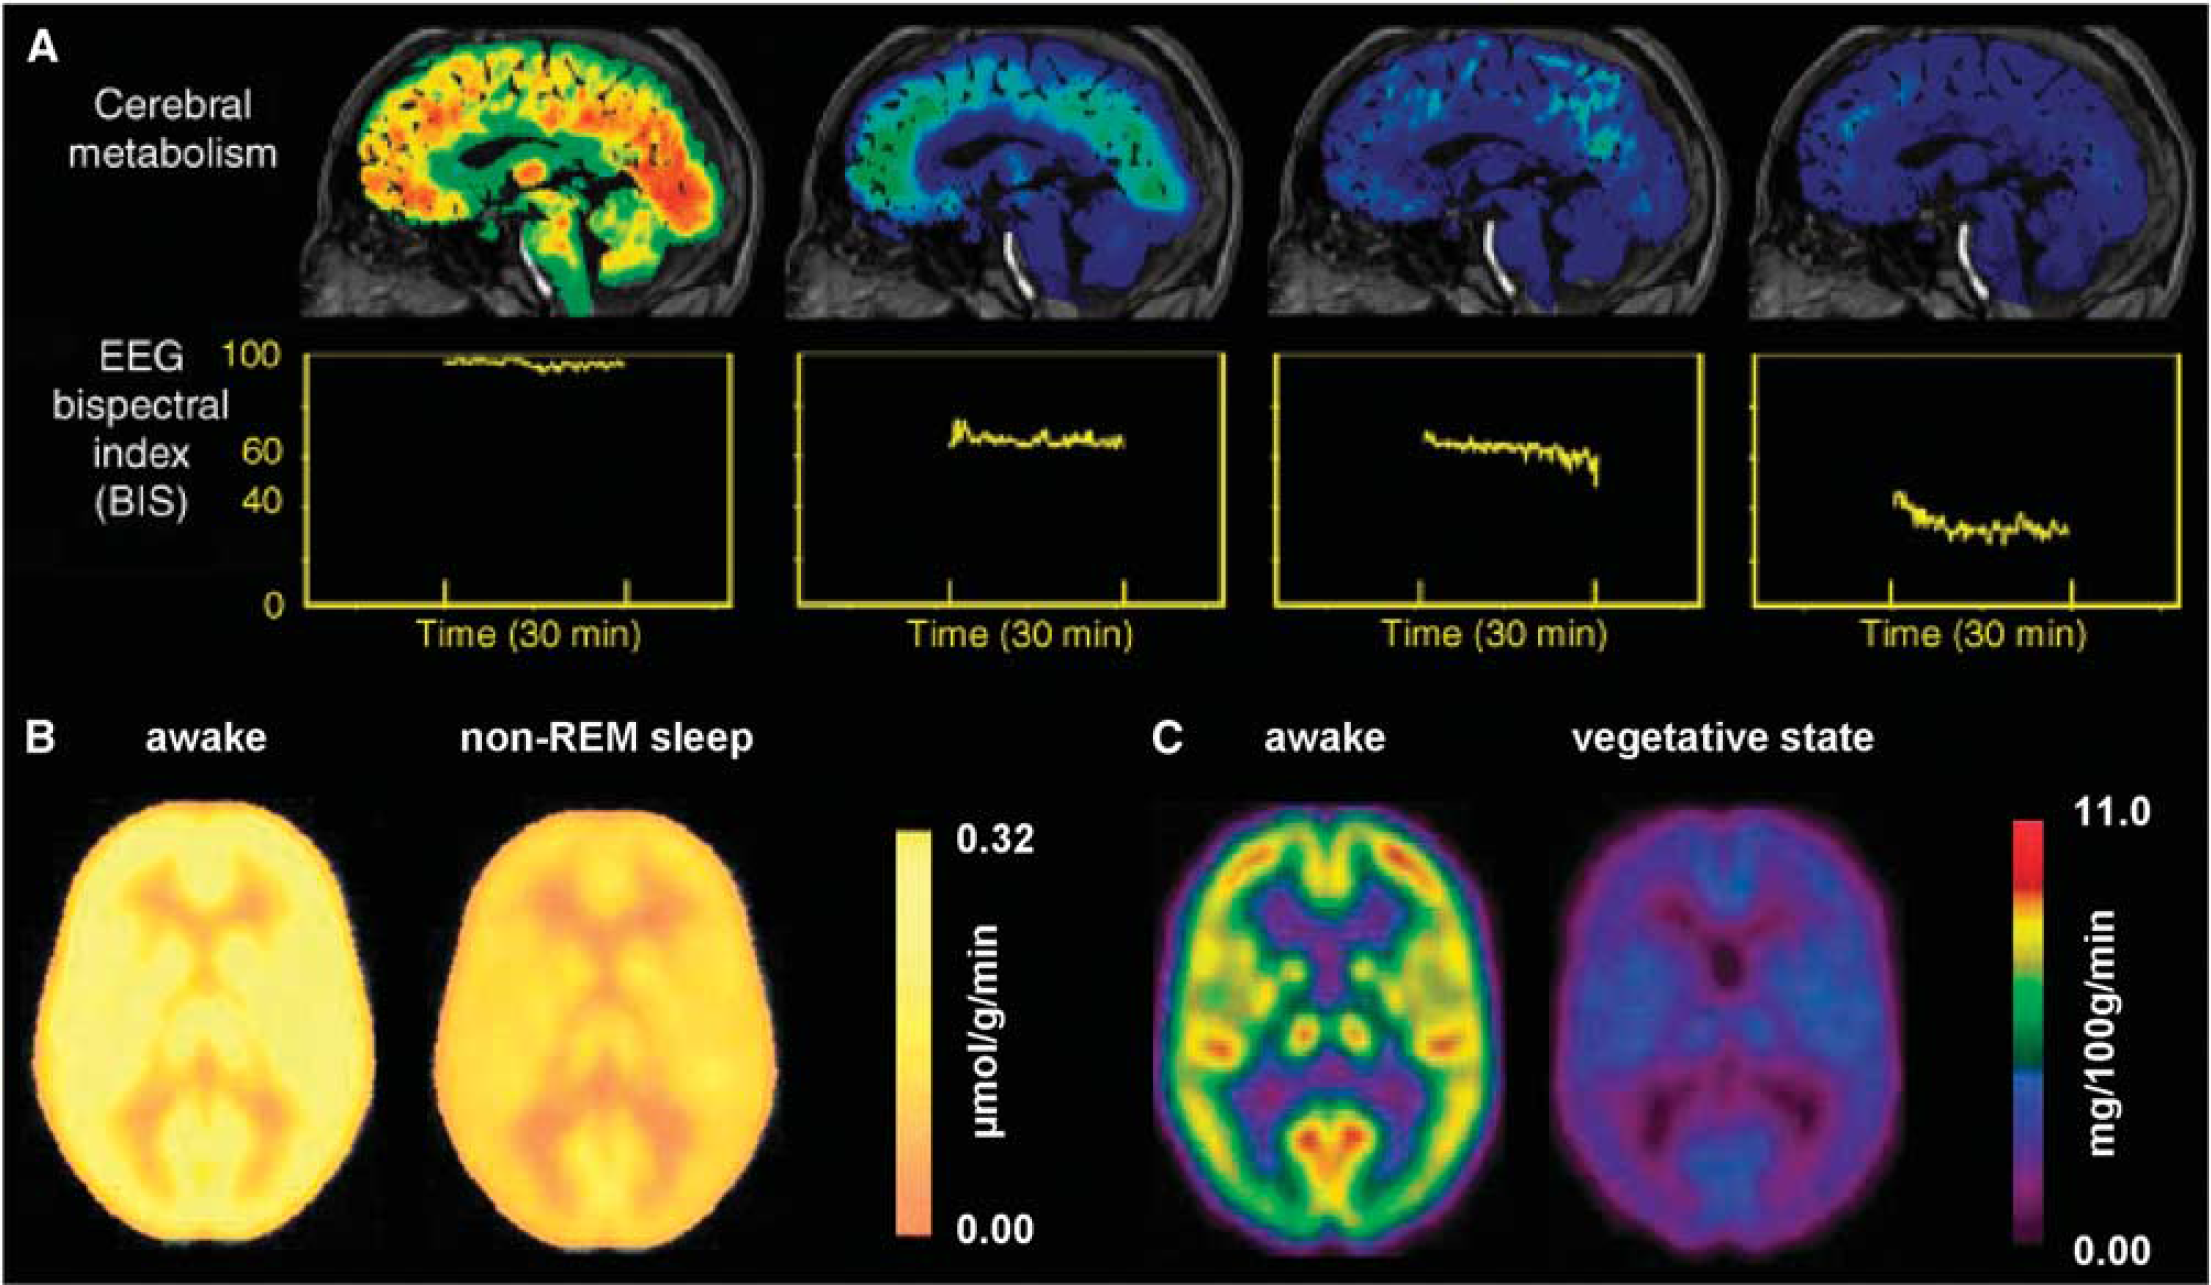
Summary of global reduction in oxidative demand and neuronal activity in the human brain. Deep or nonrapid eye movement (non-REM) sleep states, different stages of the vegetative brain, and varying degrees of anesthesia depth show significant reductions in energy metabolism as measured by CMRglc with positron emission tomography (PET) and electrical activity as reflected with bispectral index (BIS) values from electroencephalography (EEG) recordings. (
DYNAMIC VARIABILITY OF OXIDATIVE DEMAND IN THE RESTING AWAKE HUMAN BRAIN
Since resting-state fMRI is used to identify networks based on spontaneous BOLD signal fluctuations, it is important to determine moment-to-moment metabolic demand of these fluctuations relative to the average resting level energy for the spontaneous neuronal activity in the awake state. Studies, to date, have not investigated this issue specifically because dynamic CMRO2 and CMRglc fluctuations are difficult to measure with MRS or PET methods. However, an estimate of CMRO2 fluctuations may be obtained from calibrated fMRI studies of the human cerebral cortex during sensory stimulation (for a recent review, see Hyder et al 21 ).
In calibrated fMRI studies, the CMRO2 change is determined by combining BOLD signal measurements with CBF and CBV measurements (or indirectly from measured responses of changes in BOLD signal, CBF, and CBV with CO2 inhalation53–55). Based on these human studies at 1.5 to 3.0 T, an approximately ± 1% fluctuation in the BOLD signal corresponds to at most ± 10% variation in CMRO2 relative to the resting awake average.56–58 This is a maximum estimate because a considerable amount of the fluctuation amplitude of the BOLD signal may also be influenced by physiologic noise, motion, and electronic imperfections in the scanner.59–61 Furthermore, the BOLD signal fluctuations measured in resting-state fMRI, which are on the order of <0.1 Hz, do not account for the majority of spontaneous neuronal signal variations, 62 suggesting lower than 10% variations in CMRO2. Therefore, we believe that the energy demand for the lower frequency signaling could be less than our current energy estimate for spontaneous fluctuations in the BOLD signal. 58
GLOBAL REDUCTIONS OF OXIDATIVE DEMAND AND NEURONAL ACTIVITY IN THE HUMAN BRAIN
Since the regional and dynamic deviations in metabolism are small, a plausible hypothesis is that the energy demand in brain networks is uniformly high to support widespread signaling in the awake human. 63 In other words, the less than ± 10% variations of oxidative energy across gray-matter space do not necessarily indicate which regions are of greater or lesser importance given the similarly high metabolic activity in all regions. A test of this hypothesis is the extent to which oxidative metabolism, in relation to neuronal activity, is affected in states where consciousness is lost.
It is well known that a variety of sleep levels, states achieved with different anesthetics, or vegetative situations reduce cortical energy demand and electrical activity.64–76 In principle, if specific regions within the brain selectively reduce metabolic (and neuronal) activity when consciousness was lost, it might indicate that these regions have a preferentially important role in resting awake brain function. However, human PET studies with sleep, vegetative, and anesthetized states all show quite uniform CMRglc reductions— > 20%—across gray-matter space, which seems to also parallel decreased EEG power (Figure 6). As shown previously in Figure 3, the decrease in CMRglc and EEG power (based on the BIS measure), is close to linear. Although a more detailed analysis will be required as was performed for CMRglc and CMRO2 studies in the resting awake state (Figures 4 and 5), present comparison of regional activity during states of altered consciousness do not show specific regions with selectively depressed activity.
CONCLUSIONS
Our meta-analysis of cerebral energy consumption and its coupling with neuronal activity suggests that metabolic energy is quite uniform in gray-matter space of the human brain. This conclusion does not make any claims about uniformity of cellular density because the measured metabolic data from PET are susceptible to partial volume effects arising from either white matter or varying cortical thickness across the entire brain. 77 We made no attempt to apply any partial volume corrections based on the cortical thickness alone, which would presumably reduce the heterogeneity of metabolic values across regions even further. Until individual voxel PET and MRI data are available on an individual subject basis, partial volume effects of gray versus white matter cannot be quantitatively addressed. This metabolic activity (i.e., CMRglc or CMRO2 with PET, CMRglc(ox),N with 13 C MRS, CMRO2 with calibrated fMRI) changes in proportion to overall electrical activity (i.e., by BIS with EEG, neuronal firing rate with electrophysiology, Vcyc(tot) with 13 C MRS), but it is reduced to ~20% of resting awake levels in isoelectric conditions, indicating that the majority of metabolic demand is to support signaling and events downstream of signaling. Direct measurements by 13 C MRS (i.e., Vcyc(tot) and CMRglc(ox),N) in human occipital lobe show that the coupling between metabolic activity and glutamate neurotransmitter cycling and neuronal firing rate is similar to the rodent somatosensory cortex (Figures 1 to 3), indicating that most of the metabolic activity is used to support mammalian brain glutamatergic signaling. 78 The neurometabolic coupling for glutamatergic activity appears to be uniform across gray-matter space based on comparisons of CMRglc and CMRO2 data, all measured by PET, showing good regional agreement (Figures 4 to 6). The use of small average metabolic differences across regions as evidence that some networks have greater functional importance than others (e.g., default mode network42–44) does not seem justified given the much larger underlying activity that all networks and regions share. However, future studies with better spatial resolution are needed to resolve white-matter partial volume effects to represent metabolism in gray matter, especially across the cerebral cortex where gray-matter thickness varies considerably, 77 such that regional differences can be more quantitatively assessed. The dependence of task-induced response on the resting brain activity strongly argues for the functional relevance of high metabolic demand of the resting awake state.12–14 The total resting brain activity is an independent parameter and when included in data analysis opens the way for new experimental paradigms that can delineate functions of the total energy. Additionally, the 13 C MRS separation of neuronal and glial metabolic rates,79,80 dissociating contributions from neuronal and glial populations across brain regions, is now seen to be another variable under experimental measure when studying networks in health and disease. Finally, given the importance of ubiquitously high oxidative energy demand for supporting conscious human behavior, 63 we propose that clinical fMRI studies could take advantage of quantitative measures of metabolic energy when evaluating patients.
DISCLOSURE/CONFLICT OF INTEREST
The functional imaging group at Washington University at St Louis specifically Marcus Raichle and his colleagues are in direct conflict with this work and our conclusions based on their recent paper (Vaishnavi SN et al (2010) Regional aerobic glycolysis in the human brain. Proc Natl Acad Sci USA 107:17757–17762).
Footnotes
References
Supplementary Material
Please find the following supplemental material available below.
For Open Access articles published under a Creative Commons License, all supplemental material carries the same license as the article it is associated with.
For non-Open Access articles published, all supplemental material carries a non-exclusive license, and permission requests for re-use of supplemental material or any part of supplemental material shall be sent directly to the copyright owner as specified in the copyright notice associated with the article.