
Abstract
The present study applied T2- and diffusion-weighted magnetic resonance imaging to examine if mild cerebral edema and subsequent brain swelling are implicated in the pathophysiology of acute mountain sickness (AMS). Twenty-two subjects were examined in normoxia (21% O2), after 16 hours passive exposure to normobaric hypoxia (12% O2) corresponding to a simulated altitude of 4,500 m and after 6 hours recovery in normoxia. Clinical AMS was diagnosed in 50% of subjects during hypoxia and corresponding headache scores were markedly elevated (P < 0.05 versus non-AMS). Hypoxia was associated with a mild increase in brain volume (+ 7.0 ± 4.8 ml, P < 0.05 versus preexposure baseline) that resolved during normoxic recovery. Hypoxia was also associated with an increased T2 relaxation time (T2rt) and a general trend toward an increased apparent diffusion coefficient (ADC). During the normoxic recovery, brain volume and T2rt recovered to pre-exposure baseline values, whereas a more marked reduction in ADC in the splenium of the corpus callosum (SCC) was observed (P < 0.05). While changes in brain volume and T2rt were not selectively different in AMS, ADC values were consistently lower (P < 0.05 versus non-AMS) and associated with the severity of neurologic symptoms. Acute mountain sickness was also characterized by an increased brain to intracranial volume ratio (P < 0.05 versus non-AMS). These findings indicate that mild extracellular vasogenic edema contributes to the generalized brain swelling observed at high altitude, independent of AMS. In contrast, intracellular cytotoxic edema combined with an anatomic predisposition to a ‘tight-fit’ brain may prove of pathophysiologic significance, although the increase in brain volume in hypoxia was only about 0.5% of total brain volume.
Keywords
Introduction
Acute exposure to inspiratory hypoxia and the attendant decrease in cerebral oxygenation can induce neurologic sequelae collectively known as acute mountain sickness (AMS) in the otherwise healthy human brain. In addition to headache, the principal symptom of AMS, anorexia, dizziness, and insomnia can occur in non-acclimatized individuals within 6 to 8 hours after rapid exposure to altitudes ≥2,500 m (Bärtsch et al, 2004; Roach and Hackett, 2001). Severity and prevalence of AMS depend on the degree of acclimatization, rate of ascent, altitude, and individual susceptibility (Schneider et al, 2002). If left untreated, AMS can progress to high-altitude cerebral edema, a life-threatening condition (Hackett and Roach, 2001).
It has been hypothesized that AMS may be due to an increase in intracranial pressure resulting from increased intracranial volume subsequent to augmented blood volume, cerebral edema, or both (Krasney, 1994). Compression of pain-sensitive structures was suggested to account for headache. However, recent magnetic resonance imaging (MRI) studies do not support this hypothesis. One investigation reported no signs of cerebral edema and a reduction in inner cerebrospinal fluid volume independent of AMS after 10 hours at a simulated altitude of 4,500 m (Fischer et al, 2004). A separate study identified that 32 hours exposure to a simulated altitude of 4,572 m resulted in a 2.8% increase in total brain volume without any change in T2 relaxation time (T2rt) or differences between subjects with and without AMS (Mórocz et al, 2001; Muza et al, 1998).
In light of these observations, the present study was designed to examine whether AMS induced by normobaric hypoxia (inspiratory fraction of oxygen FIO2 = 0.12) resulting in an inspiratory PO2 occurring at an altitude of 4,500 m would be accompanied by increased brain volume and brain edema after 16 hours of exposure, when symptoms after an overnight stay are typically most prominent (Serrano-Duenas, 2005). Furthermore, we also examined the reversibility of changes induced by hypoxia after 6 hours of recovery in normoxia (FIO2 = 0.21). T2 relaxation time was calculated to evaluate changes in parenchymal water content (Fu et al, 1990) and diffusion-weighted imaging with calculation of the apparent diffusion coefficient (ADC) was applied to differentiate vasogenic from cytotoxic edema based on the fact that ADC reflects changes in the diffusibility of water molecules (Ebisu et al, 1993; Sevick et al, 1992).
High-altitude cerebral edema is characterized by T2-hyperintensities confined to the white matter, thus implying an increase in water content, which had been interpreted as vasogenic by Hackett et al (1998), because of its reversibility. Since high-altitude cerebral edema is considered to be the end stage of AMS, we hypothesized that subjects with AMS would be characterized by an increase in brain volume subsequent to vasogenic edema represented by a prolongation in T2rt and an increase in ADC.
Materials and methods
Sample
Twenty-two apparently healthy subjects (14 males, 8 females) aged 24 ± 2 years were recruited for the present study after written informed consent was obtained according to the ethical requirements of the University of Heidelberg. Specific exclusion criteria included any history of chronic headache disorder or habitual antioxidant vitamin supplementation.
Experimental Design
The subjects were exposed to normobaric hypoxia in an environmental chamber maintained at 21°C. The trial involved an 18 hours passive exposure incorporating an overnight stay to an FIO2 = 0.12. The ambient partial pressure of oxygen (PO2 = ≈ 90 torr) equated to a terrestrial altitude of ≈ 4,600 m (Bärtsch et al, 2002).
Experimental Procedures
On the morning of the study, a baseline MR scan was performed in normoxia 7 hours before the hypoxic exposure (NORMOXIA-PRE). Subjects were then instructed to enter the normobaric hypoxic chamber where they remained for 16 hours. Thereafter, they were fitted with a neoprene mask connected to a two-way non-rebreathing valve (Hans Rudolph, 2400 series, Kansas City, MO, USA), which they wore until completion of the second MR scan (HYPOXIA). The inspiratory port was connected by a 2 m length of Falconia tubing to a 250 L Douglas bag that contained medical grade quality hypoxic (12% O2, balanced nitrogen) gas mixture that was delivered by pressurized gas cylinders. For the second MRI scan, subjects were transported from the environmental chamber to the neuroimaging unit. After completion of the second MR examination, they received a comprehensive neurologic examination and lumbar puncture (data reported in Bailey et al (2006)) after 18 hours. Thereafter, subjects were allowed to recover supine in normoxia for 6 hours under medical supervision. A third and final MR scan in normoxia (NORMOXIA-RECOVERY) was obtained before medical discharge.
Magnetic Resonance Imaging
Magnetic resonance images were acquired on a clinical 1.5-T whole-body scanner (Edge, Marconi, Cleveland, OH, USA) using a standard head coil. The following sequences were obtained:
T1-weighted gradient-echo sequence (axial orientation; time to echo (TE) 4.4 ms; time to repetition (TR) 30 ms; flip angle 30°; field of view 256; 85 slices, thickness 2.0), covering the whole brain to the level of foramen magnum.
Dual echo sequence consisting of T2- and proton density-weighted images (T2w/PDw) (axial orientation; TE 20/90; TR 2,248; flip angle 90°; field of view 220).
Diffusion-weighted imaging (axial orientation; TE 113; TR 6,612; flip angle 90°; field of view 220), 4 b-values (b = 0, 333, 666, 1,000) in three dimensions (read, phase, slice); echo planar imaging.
Post-processing of MRI Data
T2rt was calculated using the term T2rt = (TE2–TE1)[ln(
Apparent diffusion coefficient maps were calculated and ROI measurements were performed precisely as on the T2rt maps. The measurements were performed by a separate investigator masked to the study subjects’ data and not knowing under which condition the scan was obtained.
Clinical Assessment
Acute mountain sickness: Neurologic symptoms typically ascribed to AMS were comprehensively examined using the Lake Louise (LL) (Roach et al, 1993) and Environmental Symptoms Questionnaires (Sampson et al, 1983). Clinical AMS was defined if a subject presented with a total LL score (self-assessment + clinical scores) of ≥5 points in the presence of a headache and an Environmental Symptoms Questionnaire-Cerebral Symptoms score ≥0.7 points at the point when the lumbar puncture was performed during the hypoxic trial (18 hours exposure) (Bailey et al, 2006).
Headache: Subjects were asked to rate their cephalgia using a clinically validated visual analogue scale (0 to 100 mm) incorporating hedonic descriptors (0 = no headache, 10 mm = mild headache including a sensation of pressing or throbbing, 50 mm = moderate intensity headache, and 100 mm = worst possible headache) (Iversen et al, 1989).
Pulse Oximetry
SaO2 was measured every 2 hours when subjects were awake and every half hour during the night between 2400 and 0600 hours using a fingertip pulse oximeter (3740 Biox Pulse Oximeter, Ohmeda Biox, Louisville, KY, USA).
Safety Measures
Chamber exposure: Although subjects were informed that the experimental procedures would result in considerable discomfort, principally headache and emesis, they were made aware that they could terminate the study at their own free will and at any stage without prejudice. For persistent, particularly debilitating AMS often resulting in emesis that challenged their continued participation, subjects received an oral dose of paracetamol and/or metoclopramide hydrochloride. Supplemental O2 was also made available during the hypoxic exposure, although not used by any of the subjects.
Missing Values
We obtained a complete diagnostic MRI (volumetric and double echo sequence) data set in only 20 subjects. There was one T2 data set, two T1 data sets, and two diffusion-weighted imaging data sets dropped out because of motion artifacts. Furthermore, ADC maps could not be calculated in another three subjects because of severe echo planar imaging distortion (a well-known and common problem of the echo planar imaging technique) (n = 2) and ghosting artifacts resulting from deficient shimming (n = 1). Statistical analysis was performed with all data sets available for a particular measurement. Limiting the analysis to subjects with complete data sets for all measurements (n = 17) did not affect the qualitative outcome reported in the result section.
Statistical Analyzes
A Shapiro—Wilks test was applied to each dependent variable to mathematically assess distribution normality. Parametric and non-parametric equivalents of a one-factor (trial: PRE NORMOXIA vs HYPOXIA vs RECOVERY NORMOXIA) repeated measures analysis of variance (ANOVA) and two-way mixed ANOVA with one between (state: non-AMS versus AMS) and one within (exposure time) factor were incorporated to examine the effects of trial, exposure time, and state on selected variables. After a simple main effect and interaction, Bonferroni-corrected paired samples t-tests were employed to make a posteriori comparisons at each level of the within-subjects factor of interest. Bonferroni-corrected Wilcoxon matched pairs signed ranks tests served as the nonparametric equivalents. Between-state comparisons were assessed using independent samples t-tests or Mann—Whitney U-tests applied to each level of the exposure time factor. Significance for all two-tailed tests was established at an α level of P < 0.05 and data are expressed as a mean ± s.d.
Results
Clinical Findings
Eleven subjects developed AMS and 11 subjects had only minor symptoms that did not fulfill the criteria for AMS. SaO2 was not different between subjects with and without AMS during wakefulness (80% ± 4% versus 80% ± 4%, P = 0.82) and during sleeping (71% ± 4% versus 74% ± 5%, P = 0.13).
Rescue Medication
Seven subjects who presented with incapacitating headache and emesis received pain-relief medication after ≈15 hours exposure to hypoxia consistent with sound ethical practice. They received an acute oral dose of metoclopramide hydrochloride (21 to 32 mg) in combination with paracetamol (500 to 1,000 mg). While providing temporary relief from cephalgia, medication did not influence any of the morphologic changes to the brain observed during hypoxia or the normoxic recovery period.
Brain Volume
Brain volume (BV) increased significantly in the whole group during hypoxia and was not significantly different from baseline 6 hours after hypoxia (Table 1). The brain volume in both groups (with and without AMS) paralleled these changes with a constant difference of about 60 mL less brain volume in the group without AMS in all examinations. The significant increase of brain volume was in the order of 0.5% of total brain volume: 8.3 ± 5.1 mL in the AMS and 5.7 ± 4.3 mL in the non-AMS group (P = 0.23) during hypoxia and 2.5 ± 6.7 versus 3.6 ± 4.9 mL (P = 0.67), respectively, 6 hours after termination of hypoxic exposure. Differences between groups were also not significant when the five sickest subjects were compared with the five subjects who felt best. Normalizing the brain volume for body size did not alter the results of the analysis on changes in brain volume over time and between groups. The ratio of brain volume to total intracranial volume was significantly increased in subjects developing AMS versus those without AMS in all examinations and it increases slightly but significantly in both groups with hypoxia (Table 2).
Effects of hypoxia on changes in absolute brain volume
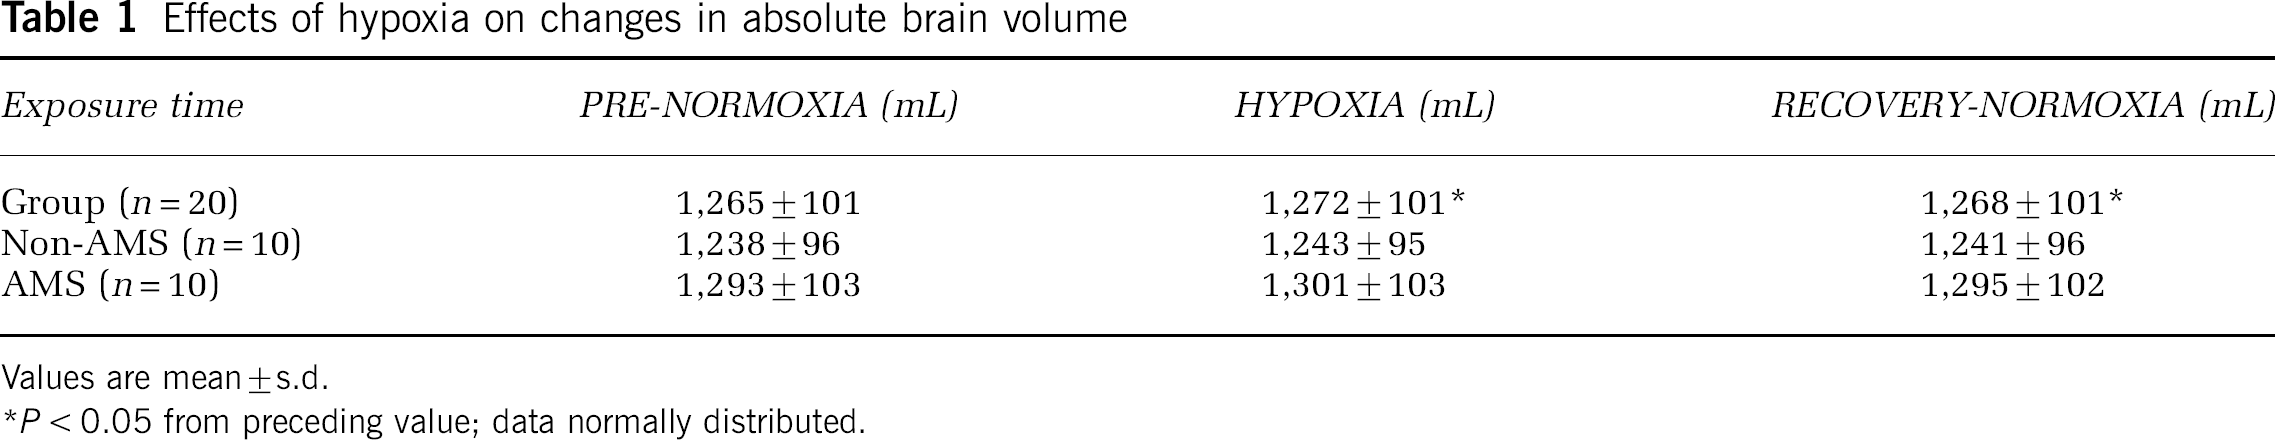
Values are mean ± s.d.
P < 0.05 from preceding value; data normally distributed.
Ratio of brain volume to intracranial volume ratio
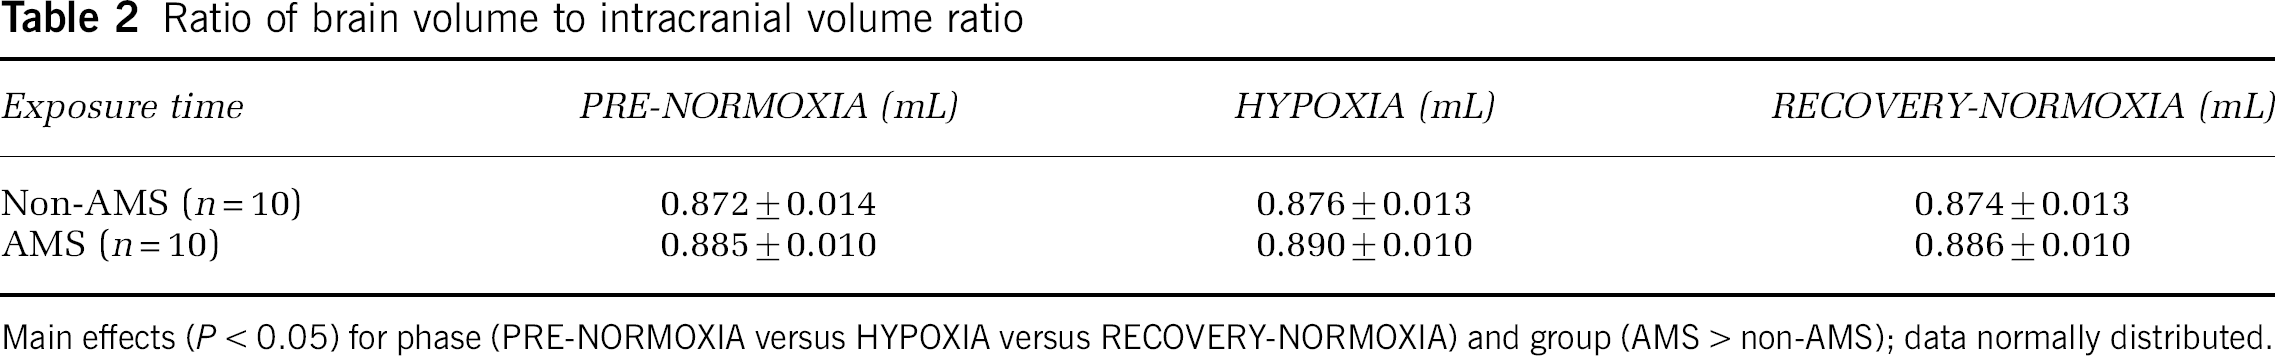
Main effects (P < 0.05) for phase (PRE-NORMOXIA versus HYPOXIA versus RECOVERY-NORMOXIA) and group (AMS > non-AMS); data normally distributed.
T2 Relaxation Time
Although there was a slight increase of T2rt in all supratentorial ROIs and in the mean of all ROIs during hypoxia, none of these changes were significant, with the exception of a prolongation of T2rt during hypoxia in the splenium of the corpus callosum (SCC): 64 ± 2.9 versus 66.6 ± 2.6 ms (P = 0.01) (Table 3). Furthermore, all changes of T2rt values from baseline between the groups with and without AMS were not statistically significant (Table 4). Analysis of the five most versus the five least affected subjects did not alter these findings (data not shown). There were no correlations of changes of T2rt (mean of all six ROI) with AMS-C, LL, or headache scores.
Effects of hypoxia on regional changes in T2rt
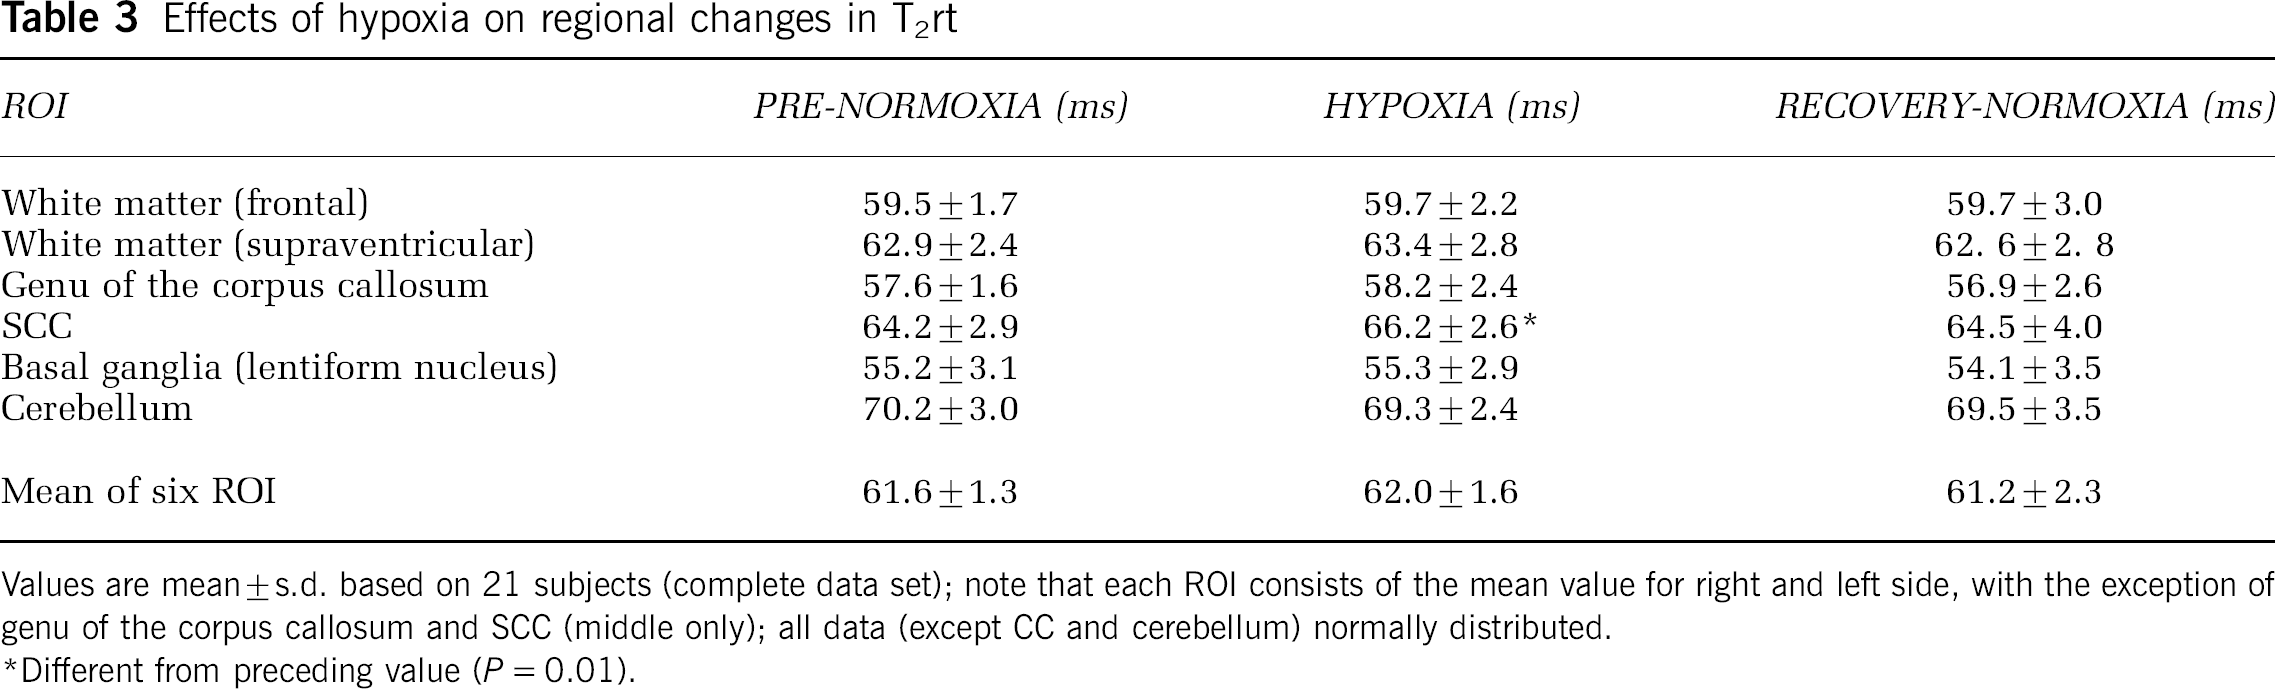
Values are mean ± s.d. based on 21 subjects (complete data set); note that each ROI consists of the mean value for right and left side, with the exception of genu of the corpus callosum and SCC (middle only); all data (except CC and cerebellum) normally distributed.
Different from preceding value (P = 0.01).
Differences in changes of T2rt in the groups with and without AMS in six ROI
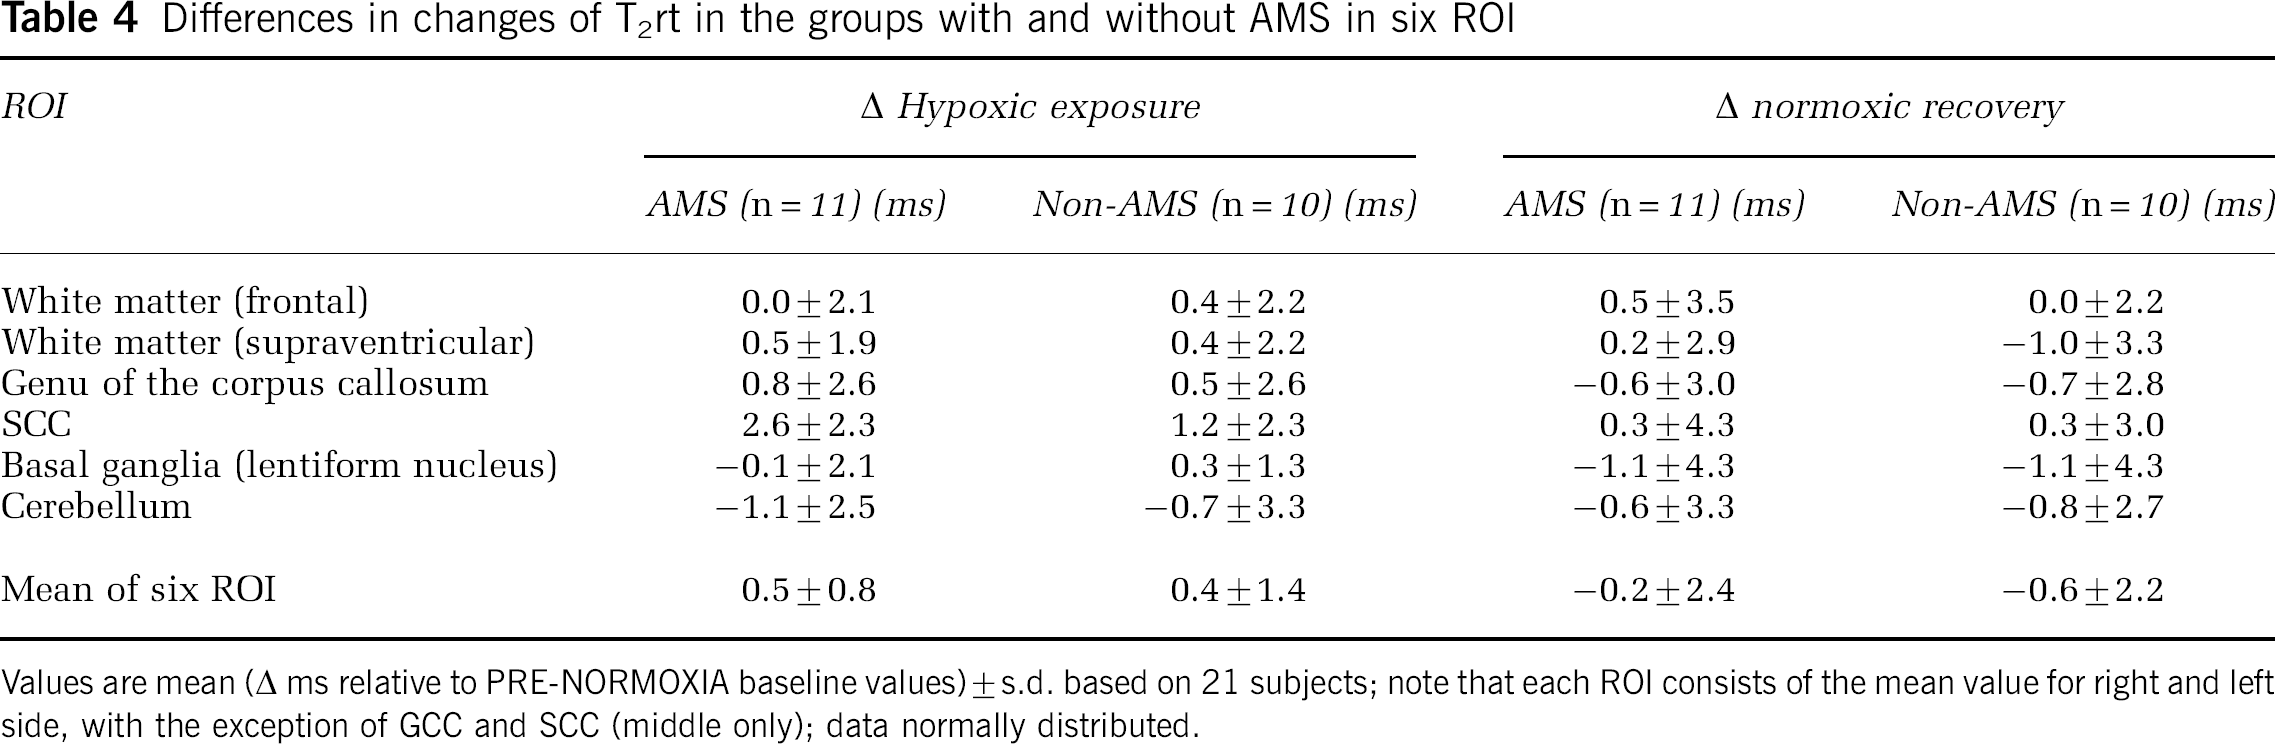
Values are mean (Δ ms relative to PRE-NORMOXIA baseline values) ± s.d. based on 21 subjects; note that each ROI consists of the mean value for right and left side, with the exception of GCC and SCC (middle only); data normally distributed.
Apparent Diffusion Coefficient Maps
Apparent diffusion coefficient values did not significantly change during and after hypoxia when data of all subjects are analyzed together, with the exception of the decrease in the SCC after hypoxia (Table 5). There was, however, a remarkable difference between the AMS group, in which ADC decreased in all but one ROI during hypoxic exposure, while the corresponding values increased in the non-AMS group. This difference was statistically significant for the genu of the corpus callosum and for the mean values of all six ROI (Table 6). Figure 1 illustrates the relationships observed between the decrease in ADC (mean of six ROI) in hypoxia (relative to the normoxic baseline) and increase in the LL (r =–0.53, P = 0.03), Environmental Symptoms Questionnaires-Cerebral Symptoms (r = −0.66, P = 0.004), and visual analogue scale headache scores (r = −0.52, P = 0.03).
Effects of hypoxia on regional differences in ADC
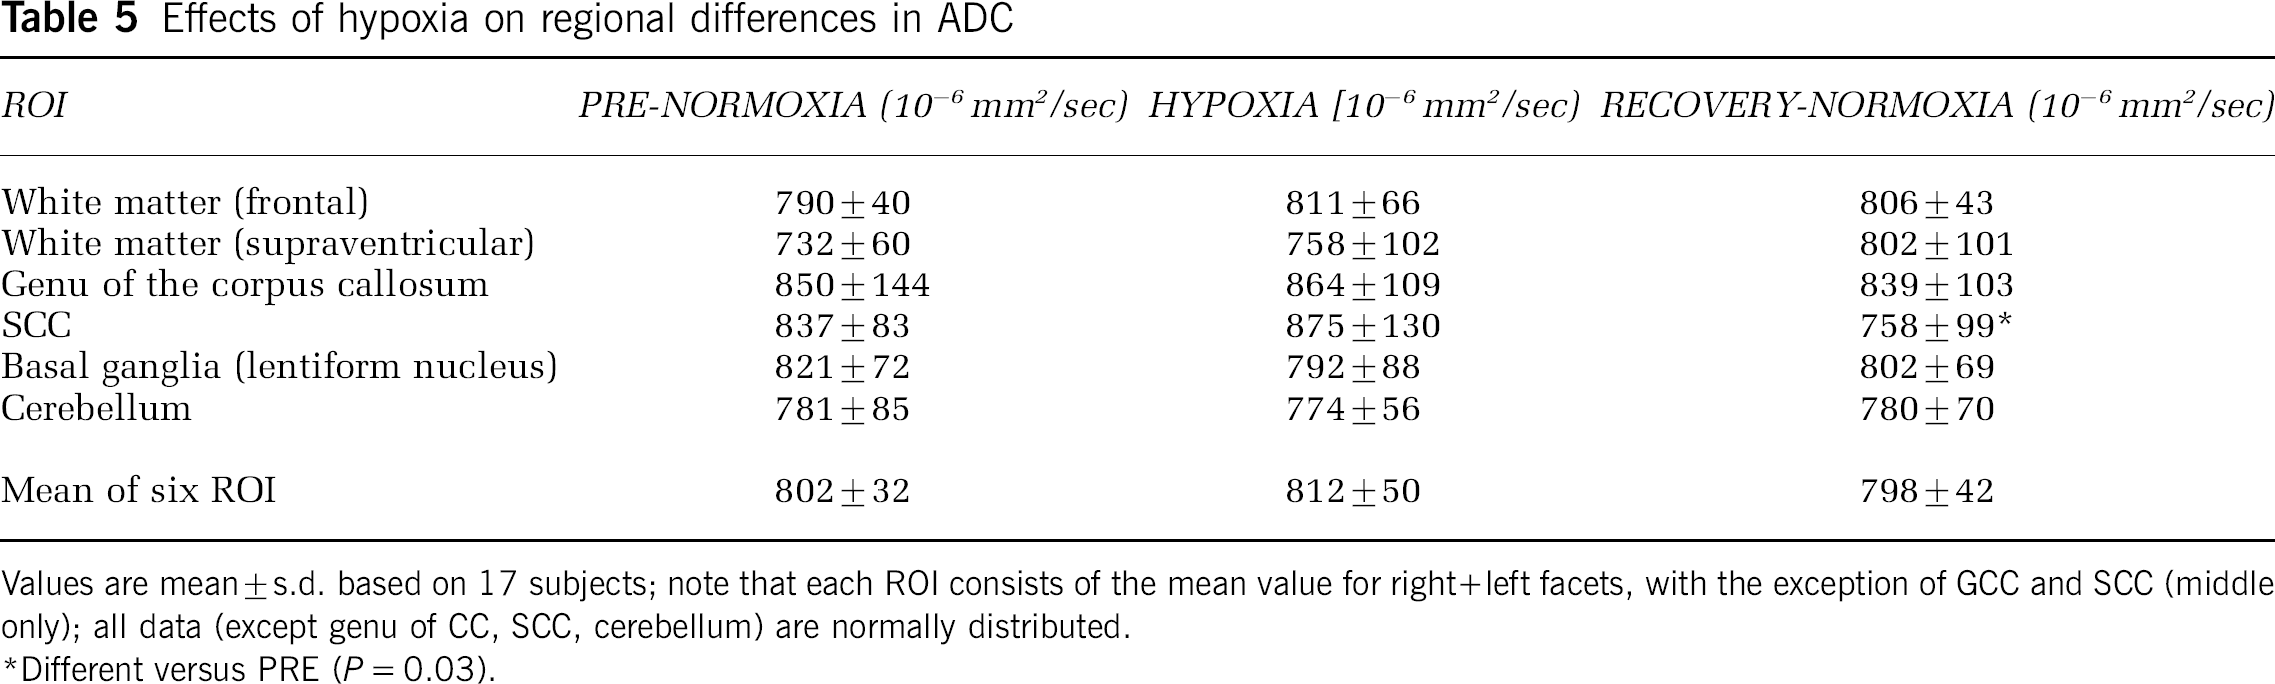
Values are mean ± s.d. based on 17 subjects; note that each ROI consists of the mean value for right + left facets, with the exception of GCC and SCC (middle only); all data (except genu of CC, SCC, cerebellum) are normally distributed.
Different versus PRE (P = 0.03).
Effects of AMS on regional differences in ADC
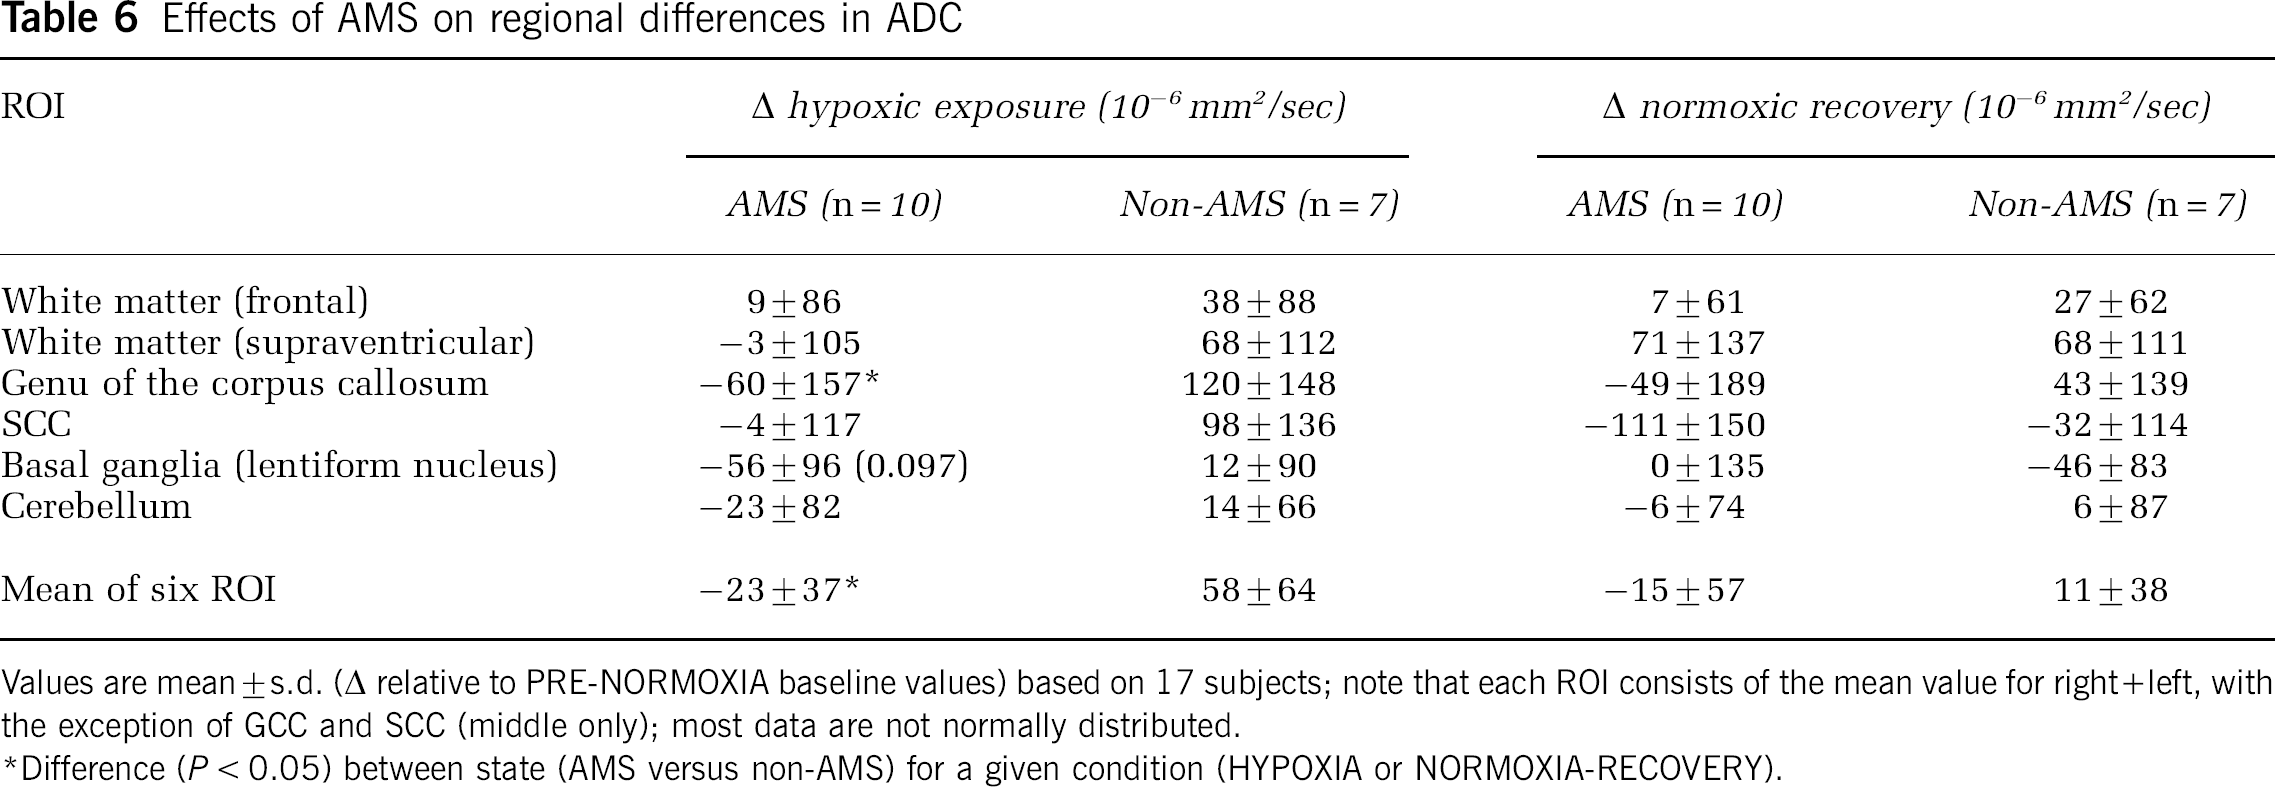
Values are mean ± s.d. (Δ relative to PRE-NORMOXIA baseline values) based on 17 subjects; note that each ROI consists of the mean value for right + left, with the exception of GCC and SCC (middle only); most data are not normally distributed.
Difference (P < 0.05) between state (AMS versus non-AMS) for a given condition (HYPOXIA or NORMOXIA-RECOVERY).
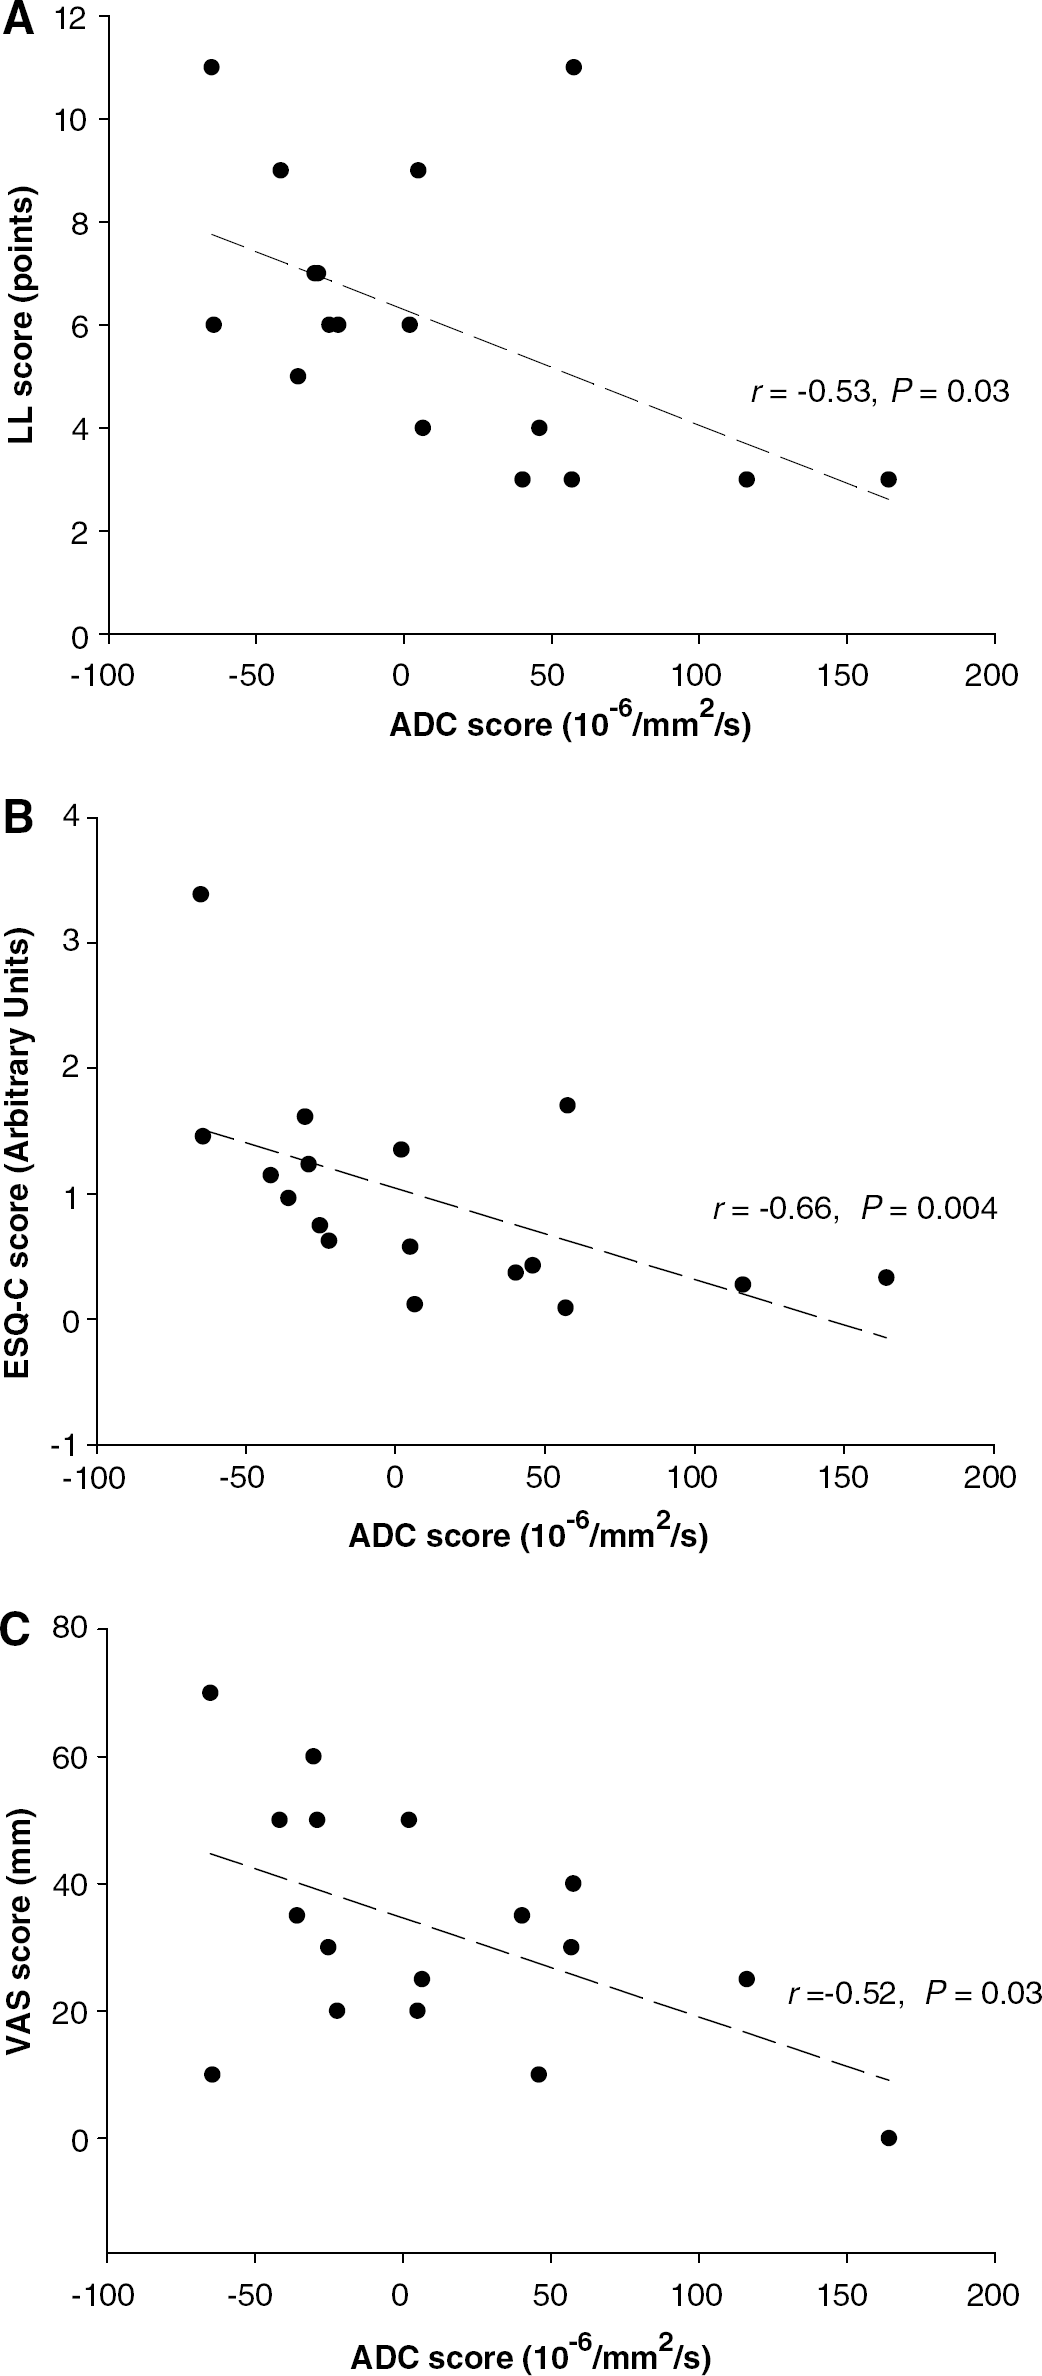
Relationship between the changes (HYPOXIA minus PRE-NORMOXIA) in ADC scores and LL AMS score (
Discussion
An increase in brain volume and prolongation of T2rt during hypoxia signifies an accumulation of water in brain tissue in terms of edema. The ADC permitted differentiation between cytotoxic and vasogenic edema. The latter is characterized by an increase in ADC, whereas decreased ADC values are caused by a shift of water from the extra- to the intracellular compartment (cytotoxic edema).
Our measurements indicate that a 16-hour exposure to normobaric hypoxia equivalent to an altitude of 4,500 m leads to a small but significant increase of 0.6% of total brain volume. In combination with the increase in T2rt, this is evidence of brain swelling caused by parenchymal edema. This increase is not related to AMS and it normalizes to pre-exposure values within 6 hours of recovery in normoxia. Increased T2rt in the corpus callosum independent of AMS is compatible with mild cerebral edema in all exposed subjects, while a decrease of ADC in the corpus callosum in those with AMS suggests that AMS is associated with mild intracellular swelling (cytotoxic edema) that is more pronounced with more severe AMS.
The uniform (although with the exception of the SCC not significant) increase of the T2rt of all supratentorial ROI and especially the increase of ADC in the subjects not developing AMS is evidence for vasogenic edema, which most likely was present in all subjects. However, in the AMS group there was a decrease in ADC values—indicating at least a cytotoxic component. Thus, we conclude that in AMS subjects the additional cytotoxic edema was probably outweighing the ADC-elevating effect of vasogenic edema. In the follow-up examination, the decrease of ADC values indicating cytotoxic edema persisted at least in the SCC, which, for unknown reasons, seems to be the predilection site of MR detectable changes in AMS and high-altitude cerebral edema (Hackett et al, 1998). However, this interpretation is limited to the analyzed areas, particularly with regard to the fact that some symptoms of AMS point toward the brainstem and cerebellum as the origin of the symptoms. Owing to image distortion, the brainstem is a very difficult area to be evaluated by echo planar imaging-diffusion-weighted imaging. Possibly new imaging techniques such as STEAM (stimulated echo acquisition mode) may in the future provide a better method to examine the diffusivity in the brainstem and in the cerebellum (Rieseberg et al, 2005).
The inverse association observed between the ADC and AMS-C, LL, and visual analogue scale headache scores, while not disassociating cause from effect, further supports the notion that more advanced AMS is associated with cytotoxic edema. The fact that mild cytotoxic edema persists at least in the SCC while the symptoms of AMS rapidly improve after normoxia is restored suggests that there is no simple cause and effect relation. The presence of sustained cytotoxic edema was an unexpected finding in light of the current evidence, which favors vasogenic edema as the major pathophysiologic component (Roach and Hackett, 2001). However, our observation that prolonged cellular swelling during hypoxic exposure, which continues 6 hours into normoxia, agrees with data observed in vitro and support the concept of PO2-mediated inhibition of the sodium—potassium pump as a potential mechanism. A reduction in cellular PO2 has been shown to decrease the expression and/or activity of the sodium—potassium ATPase in various types of cells, such as alveolar epithelial cells (Mairbäurl et al, 1997; Planes et al, 1997), endothelial cells (Kawai et al, 1997), as well as neuronal cells (De Angelis and Haupert, 1998; Graham et al, 1993). This may represent a mechanism that cells use to reduce energy expenditure in hypoxia (Hylland et al, 1997), which though controversial (Moller et al, 2002) has been suggested to occur in the hypoxic human brain (Hochachka et al, 1994). There is a large variability of inhibition in various brain regions (Razdan et al, 1993) and species (Bari et al, 2002).
It was intriguing to note that cytotoxic edema was a clear feature of AMS despite no documented evidence to date that has indicated a decrease in either global cerebral oxygen delivery or the cerebral metabolic rate of oxygen (CMRO2) in humans acutely (Severinghaus et al, 1966) or chronically exposed to high altitude (Moller et al, 2002). However, arterial PO2 in the study of Severinghaus performed at an altitude of 3,810 m was 43.5 ± 3.4 (s.d.) mm Hg, which is considerably higher than arterial PO2 in AMS at 4,559 m with 37.6 ± 4.3 (s.d.) mm Hg in mild and 33.9 ± 4.0 (s.d.) mm Hg in severe disease (Bärtsch et al, 1987). In light of our evidence for cytotoxic edema, it is not unreasonable therefore to suggest that a regional diffusion limitation and attendant decrease in arterial oxygen content may have depressed CMRO2, which despite the anticipated increase in CBF rendered neuronal cells comparatively more hypoxic. Cellular hypoxia equivalent to 3% O2, which corresponds to an in vivo PO2 of 22 mm Hg, has been shown to impair sodium—potassium ATPase of alveolar epithelial cells (Mairbäurl et al, 1997). It is likely that even hypoxia of 5% O2 already has an inhibitory effect since it was found to impair transepithelial Na transport in these cells (Mairbäurl et al, 2002). This level of hypoxia corresponds to an in vivo arterial PO2 of 37 mm Hg, which is higher than that previously documented in subjects with severe AMS at an altitude of 4,559 m (Bärtsch et al, 1987). Thus, a decrease in sodium—potassium ATPase activity might account for the neuronal cell swelling observed in the present study in subjects with AMS.
However, a recent positron emission tomography-MR study (Guadagno et al, 2006) identified that ADC is a poor predictor of CMRO2 in the clinical setting of stroke over a wide range of values, except when severely reduced, which was clearly not the case in the present study. Only minor decreases in CMRO2 have been shown to occur despite marked reductions in the ADC of hypoxic tissue subsequent to localized activation of anaerobic glycolysis and intracellular accumulation of lactic acid that can restrict water diffusion (Kohno et al, 1995). Clearly, future studies need to consider the combined application of positron emission tomography-MR techniques and serial measurements of CMRO2 to examine if water diffusion restriction adequately reflects the severity of regional oxygen deprivation in the AMS-prone brain and the underlying mechanisms.
During hypoxia, we observed, independent of AMS, a significant increase in total brain volume, which normalized to preexposure values after 6 hours of normoxic recovery and which can be attributed to edematous swelling because the prolongation of T2rts during hypoxia shows an increase of the parenchymal water content. The consistent small elevation of the ratio brain volume/intracranial volume is compatible with the hypothesis of Ross (1985), according to which less intracranial reserve volume that can compensate for brain swelling predisposes for AMS (‘tight-fit’ hypothesis). Whether the minor volumetric changes are sufficient to cause mechanical irritation of the meninges and/or other pain-sensitive structures is not presently known and subject of recent debate (Bärtsch et al, 2004). The observed increase in brain volume may appear negligible unless inspiratory hypoxia sensitizes pain-sensitive structures in AMS or if volumetric changes are inhomogeneous and considerably larger in susceptible areas of the brain, specifically the SCC, as diffusion-weighted imaging changes would tentatively suggest.
In summary, this study shows that mild extracellular vasogenic edema contributes to the generalized brain swelling observed at high altitude, independent of AMS. In contrast, intracellular cytotoxic edema combined with an anatomic predisposition to a ‘tight-fit’ brain may prove of pathophysiologic significance, which deserves consideration in future studies.