
Abstract
This study determined whether stroke and other types of insults produced a gene expression profile in blood that correlated with the presence of neuronal injury. Adult rats were subjected to ischemic stroke, intracerebral hemorrhage, status epilepticus, and insulin-induced hypoglycemia and compared with untouched, sham surgery, and hypoxia animals that had no brain injury. One day later, microarray analyses showed that 117 genes were upregulated and 80 genes were downregulated in mononuclear blood cells of the “injury” (n = 12) compared with the “no injury” (n = 9) animals. A second experiment examined the whole blood genomic response of adult rats after global ischemia and kainate seizures. Animals with no brain injury were compared with those with brain injury documented by TUNEL and PANT staining. One day later, microarray analyses showed that 37 genes were upregulated and 67 genes were downregulated in whole blood of the injury (n = 4) animals compared with the no-injury (n = 4) animals. Quantitative reverse transcription–polymerase chain reaction confirmed that the vesicular monoamine transporter-2 increased 2.3- and 1.6-fold in animals with severe and mild brain injury, respectively, compared with no-injury animals. Vascular tyrosine phosphatase-1 increased 2.0-fold after severe injury compared with no injury. The data support the hypothesis that there is a peripheral blood genomic response to neuronal injury, and that this blood response is associated with a specific blood mRNA gene expression profile that can be used as a marker of the neuronal damage.
An inflammatory, immune response occurs after all types of brain injury including ischemia, status epilepticus, hemorrhage, hypoglycemia, or trauma. Several clinical trials of stroke have targeted this inflammatory response (Furuya et al., 2001; Iadecola and Alexander, 2001). Although white blood cell functions have been investigated in brain injury, it was not known if gene expression of white blood cells might also provide an indicator of neuronal cell death. Using microarrays to assess the gene expression profiles of mononuclear blood cells, we found that stroke, seizures, hypoxia, and hypoglycemia produced gene expression profiles characteristic of each condition (Tang et al., 2001). The present study was designed to test whether there is a common blood gene expression profile that correlates with neuronal injury that occurs in all of these conditions.
There are many causes of neuronal injury. Cerebral infarction and hemorrhage can be imaged using computed tomography and magnetic resonance imaging. The diffuse neuronal cell death produced by global cerebral ischemia, status epilepticus, hypoglycemia, and degenerative diseases, however, cannot be imaged. This prompted measurements of neuronal and glial proteins in serum and CSF that are released from injured cells, including neuron-specific enolase, the glial S-100B protein, and myelin basic protein. Though increased serum levels of these proteins have been reported after stroke (Missler et al., 1997), cardiac arrest (Rosen et al., 1998), head trauma (Pleines et al., 2001), and cardiopulmonary bypass (Basile et al., 2001), their utility as injury markers for seizures and hypoglycemia-induced brain injury has been controversial (Buttner et al., 1999; DeGiorgio et al., 1999; Suzuki et al., 1999). After injury, however, many cytokines, chemokines, and other immuno-regulatory molecules are expressed by neurons, glia, blood vessels, and white cells (del Zoppo et al., 2000; Feuerstein et al., 1998). We postulated that there is a peripheral immune response to the occurrence of neuronal death but independent of the cause of the injury, and that this would produce a specific blood gene expression profile.
Two experiments addressed this hypothesis. First, the genomic expression of blood mononuclear cells in animals with brain injury (ischemia, hemorrhage, seizures, and hypoglycemia) was compared with that in animals without injury (sham surgery, untouched controls, and hypoxia). Second, the whole blood genomic expression in animals with neuronal death produced by global ischemia and kainate-induced seizures and documented by TUNEL or PANT staining was compared with that in animals with no neuronal death after global ischemia and kainate seizures. The data show blood gene expression profiles that correlate with neuronal injury in brain.
MATERIALS AND METHODS
Mononuclear cell experiment
This experiment was performed as previously described (Tang et al., 2001). Briefly, adult male Sprague-Dawley rats (Harlan, Indianapolis, IN, U.S.A.) were subjected to ischemic stroke, hemorrhagic stroke, kainate-induced seizures, insulin-induced hypoglycemia, hypoxia, sham surgery, or assigned as untouched controls. Twenty-four hours later, rats were killed and blood was drawn. Total RNA was isolated from mononuclear cells and surveyed with triplicate Affymetrix U34A arrays (Affymetrix, Santa Clara, CA, U.S.A.). Three separate samples per group were hybridized to three separate arrays (n = 21; Fig. 1).
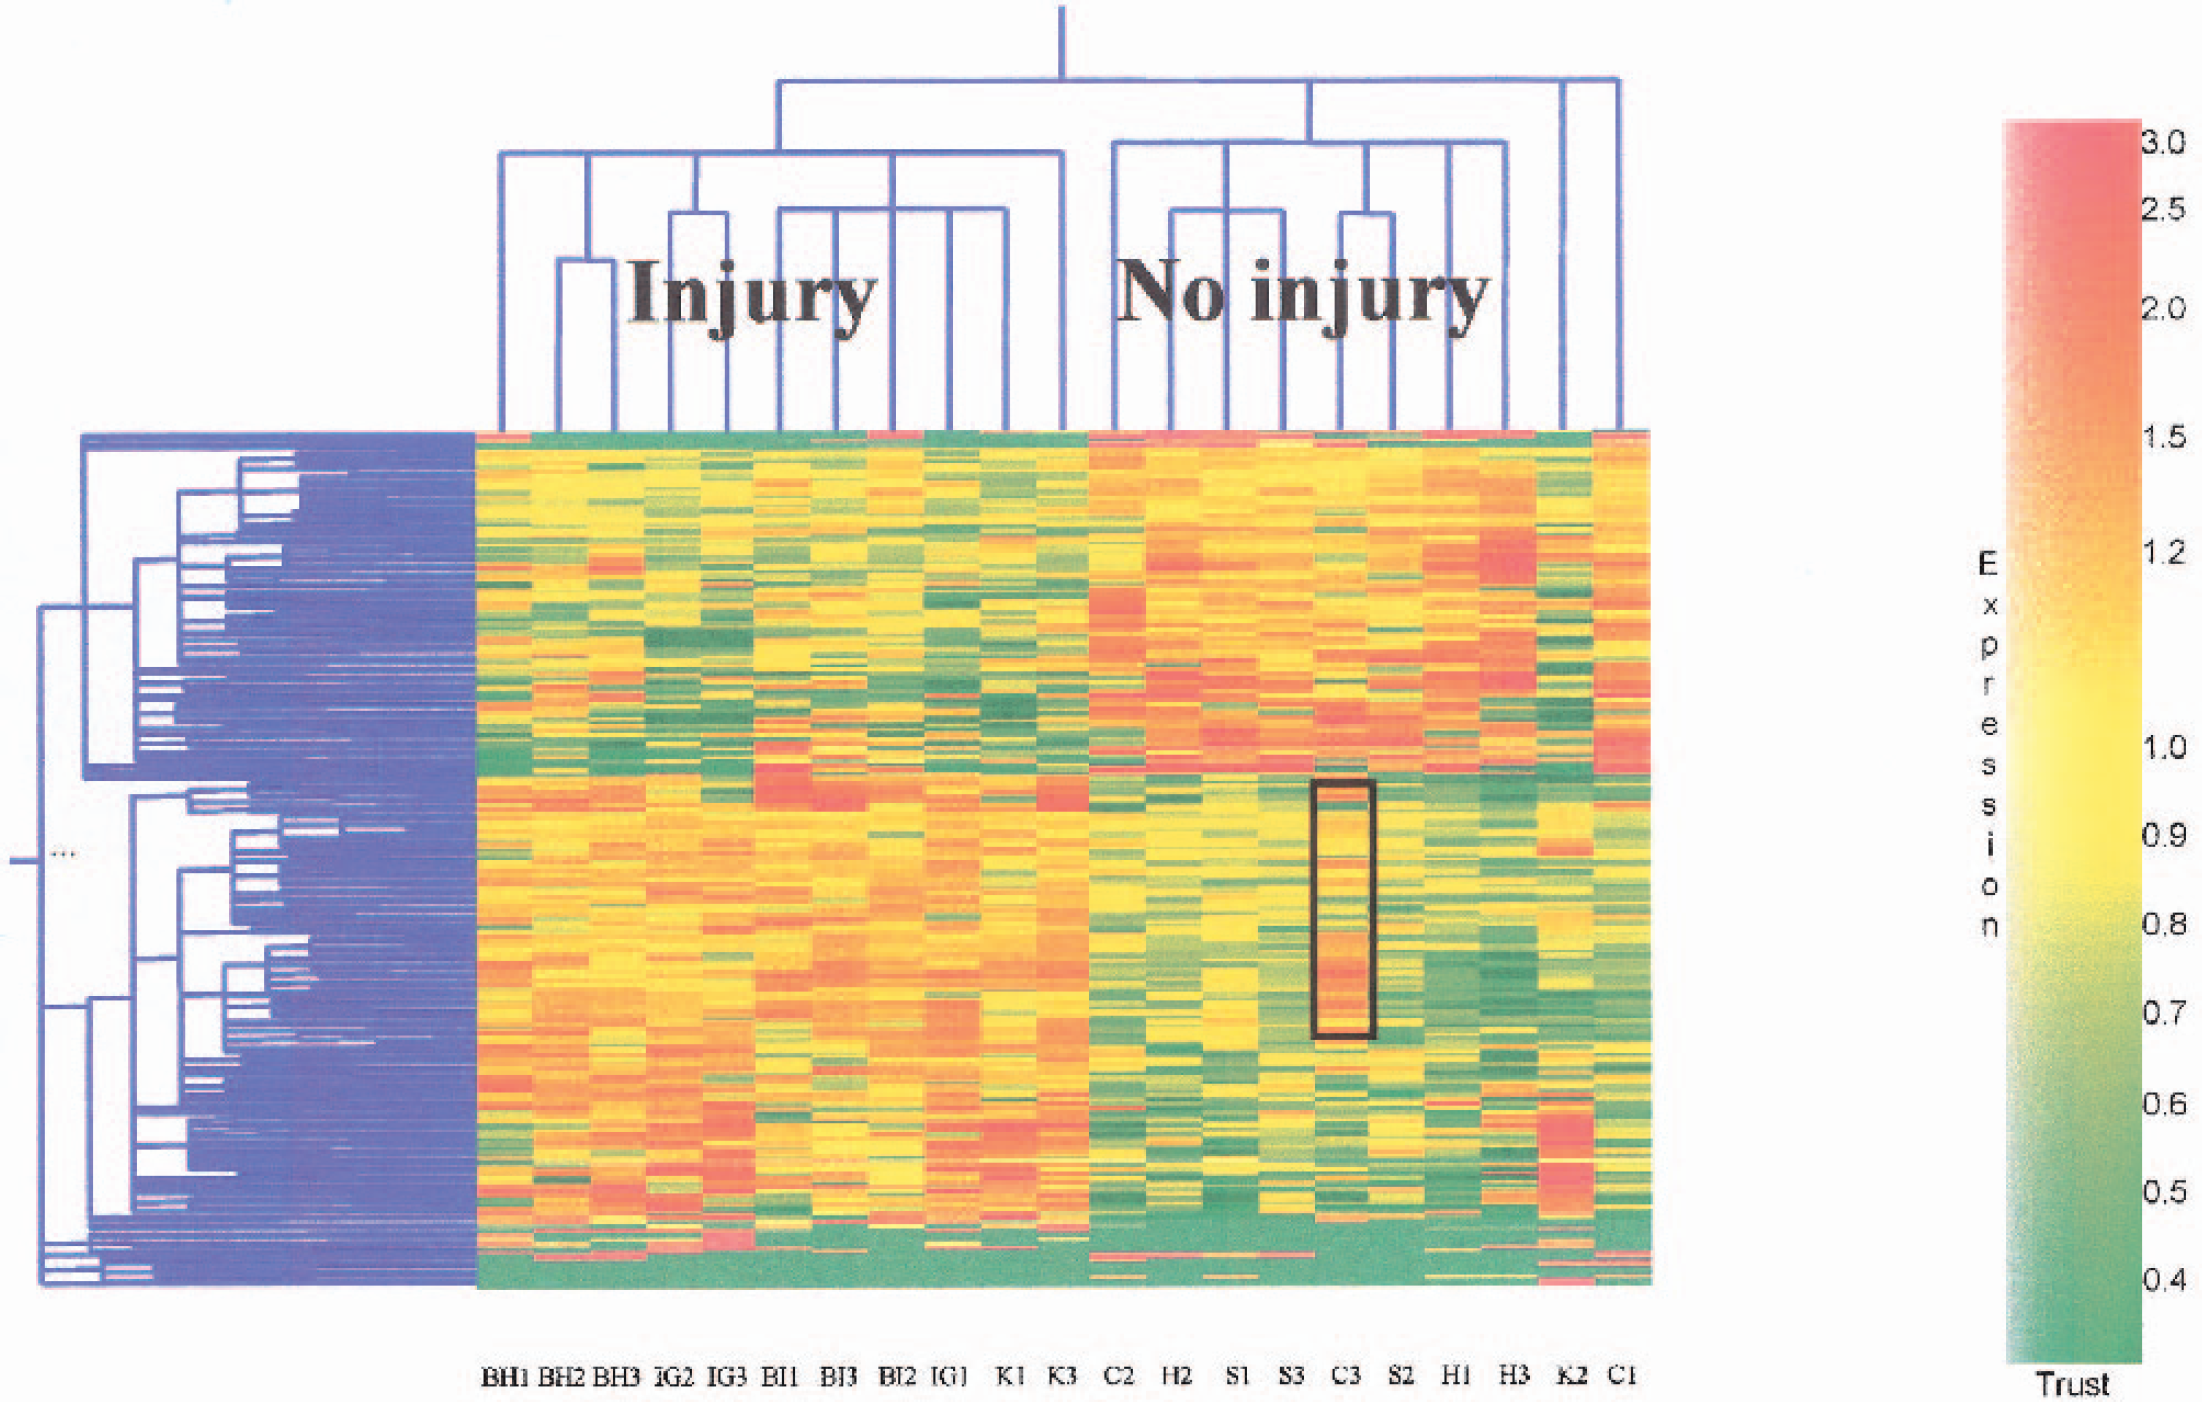
Genes upregulated (red) and downregulated (green) in blood monocytes of animals with brain injury (
Whole blood experiments
RNA isolated from whole blood is from mononuclear cells and polymorphonuclear cells and may include RNA from red cells and platelets. Compared with mononuclear cells, using whole blood produces less technical variability, since no cell separation is required, and could be more advantageous for genomic studies. Two additional groups of animals were used for microarray studies of whole blood. Animals were subjected to either four-vessel global cerebral ischemia or they were injected intraperitoneally with kainic acid (KA). Twenty-four hours later, blood was drawn via cardiac puncture. Animals were then killed and their brains were removed, frozen, and processed for TUNEL and PANT staining. A total of 20 rats were used: 10 for kainate-induced seizures and 10 for global ischemia. Four RNA samples in each group were placed on Affymetrix U34A microarrays, whereas all samples were used for reverse transcription–polymerase chain reaction (RT-PCR) confirmation.
The TUNEL- and PANT-positive cells were detected and counted using MCID software (Imaging Research, St. Catherines, Ontario, Canada). The numbers of cells per mm2 were counted on at least four sections in at least eight fields from each subject through the neocortex, entorhinal cortex, and the hippocampus.
Microarray analysis
Sample labeling, hybridization, and image scanning were carried out as described in the Affymetrix Expression Analysis Technical Manual. At least 10 μg total RNA from each sample was used for microarray study. The Affymetrix rat U34A array contains more than 7,000 known genes and 1,000 expressed-sequence tags. Only genes that had relatively higher expression (called “present” on at least one array), however, were used for subsequent analysis, using GeneSpring software (Silicon Genetics, Redwood City, CA, U.S.A.).
Hierarchical clustering analyses were performed on the genes that passed the statistical thresholds. A standard correlation coefficient of 0.95 was used as the measure for significant statistical similarity. The branching behavior of the tree was controlled using a separation ratio setting of 0.5 and a minimum distance setting of 0.001.
Quantitative reverse transcription–polymerase chain reaction
Taqman RT-PCR was performed on two selected genes using the 5700 Sequence Detection System (Applied Biosystems, Foster City, CA, U.S.A.). All primers and probes were designed using Primer Express 2.0 (Applied Biosystems). A one-step RT-PCR was performed according to Taqman One-Step RT-PCR Master Mix Reagents Kit protocol (Applied Biosystems). Normalization to GAPDH was performed to account for variability in the initial concentration and quality of total RNA and in the conversion efficiency of the reverse transcription reaction.
RESULTS
Genomic responses of mononuclear blood cells to neuronal injury
There were a total of 5,084 genes expressed at relatively high levels in mononuclear white blood cells and that had at least one “present call” by the Affymetrix software. Of these, 197 genes were differentially expressed in the mononuclear white blood cells in the injury group compared with the no-injury group of animals. The focal ischemia produces death of neurons and glia, whereas intracerebral hemorrhage, prolonged kainate seizures, and prolonged hypoglycemia produce isolated neuronal cell death (Auer et al., 1984; Matsushita et al., 2000; Zhang et al., 1997). This contrasts to pure hypoxia (Simon, 1999) as well as sham controls and untouched controls that have no isolated cell death and have no TUNEL- or PANT-stained cells in brain (Chen et al., 1997). Therefore, the 197 genes may serve as potential candidate markers of neuronal injury in mononuclear blood cells. Among these 197 genes, 117 were upregulated and 80 were downregulated in the injury samples compared with the no-injury samples. Using the expression data of these regulated genes, a hierarchical cluster analysis discriminated the injury samples from no-injury samples (Fig. 1). The only two samples that did not seem to cluster with the appropriate groups were one kainate-treated animal (K2) and one untouched animal (C1; right two columns; note cluster dendrogram for these above). The expression pattern of the kainate K2 animal, however, resembled the pattern of the injury animals, and the expression pattern of the control C1 animal was similar to that of the no-injury animals. To confirm the results of hierarchical clustering, we adopted the approach of “leave-one-out” cross-validation, which takes one sample out and uses the remaining samples to build an algorithm and predict the category of the remaining sample (Golub et al., 1999). This approach successfully predicted the category of the 21 samples as either injury or no injury.
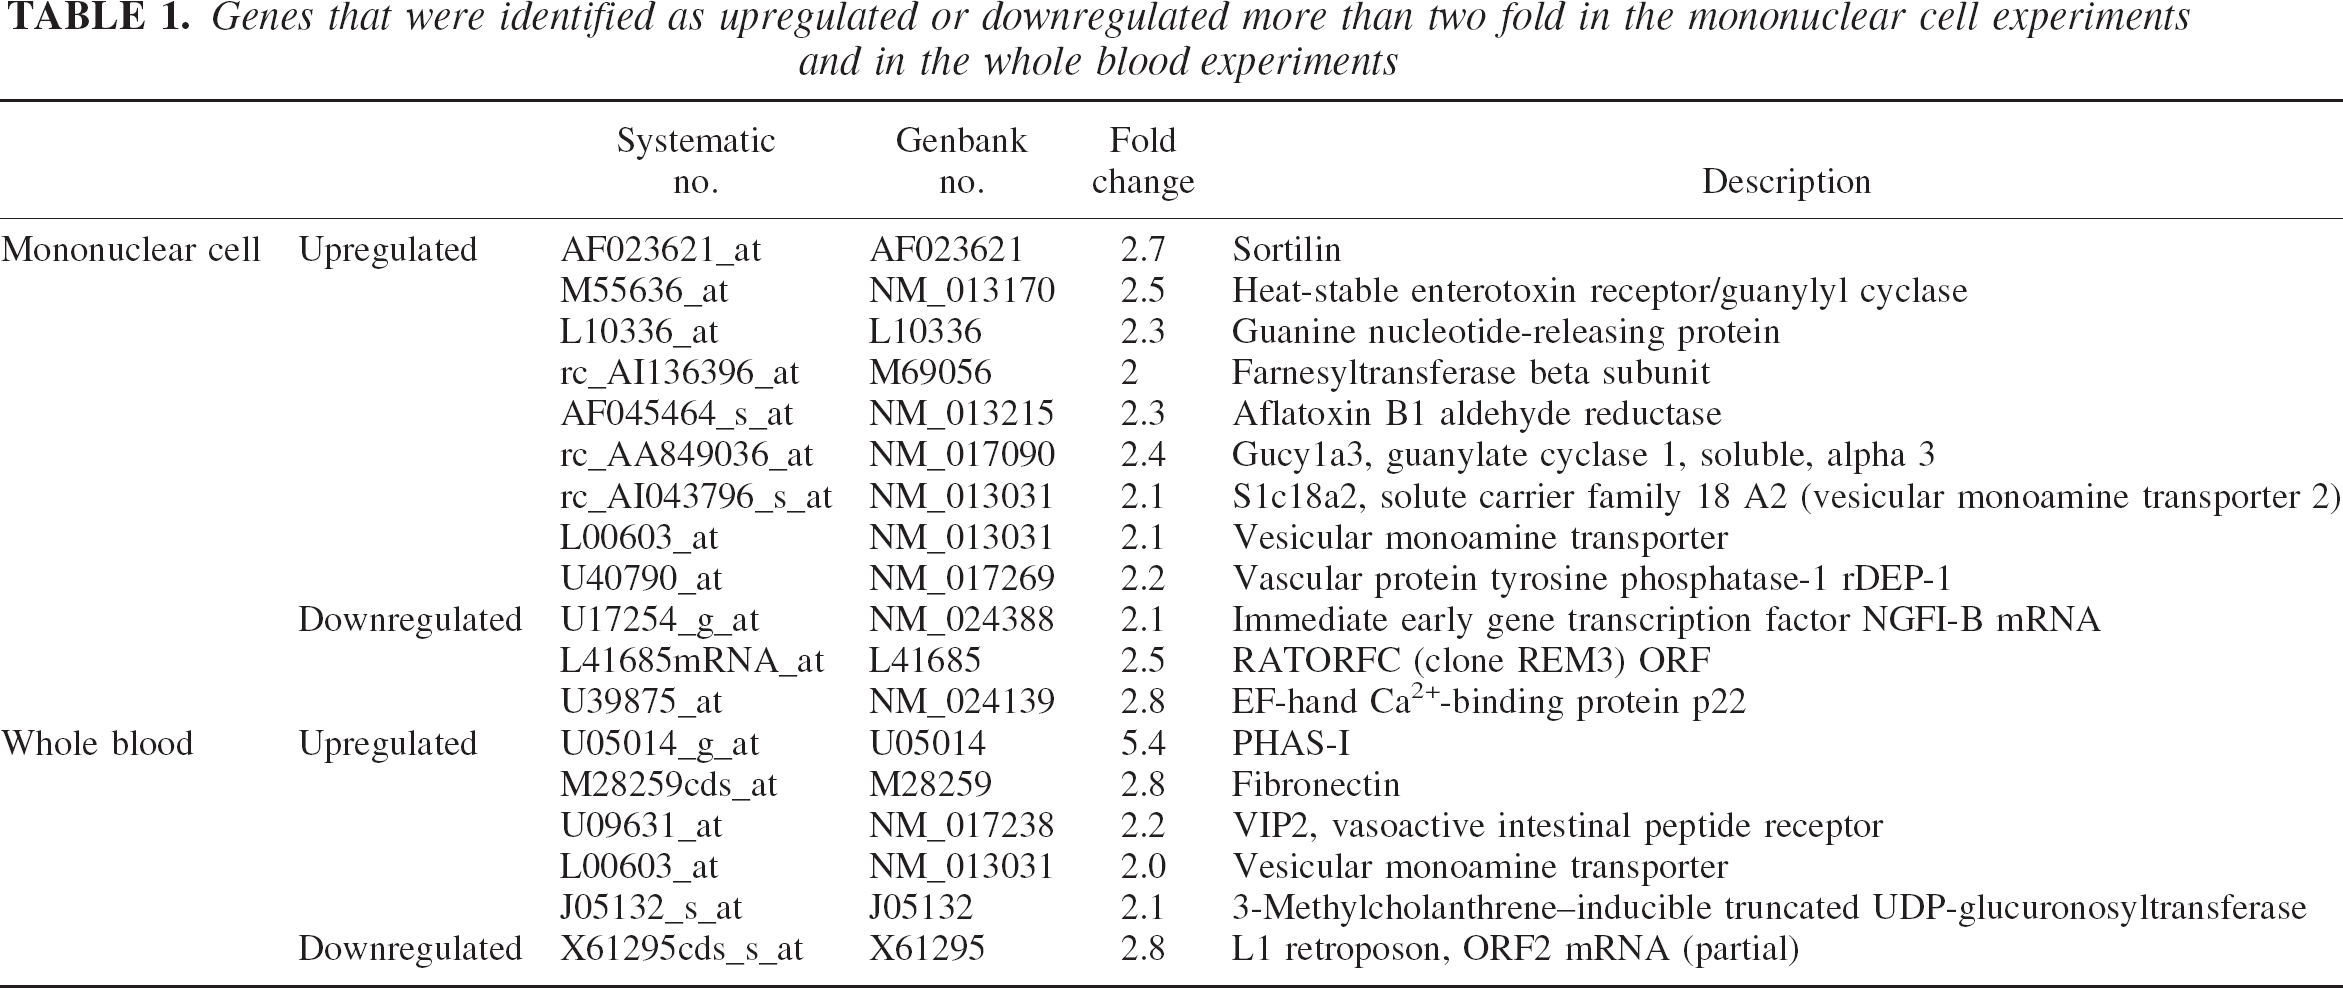
It is noteworthy that the majority of the 197 genes were regulated within a twofold range. Genes that are regulated more than twofold are listed in Table 1.
Genes that were identified as upregulated or downregulated more than two fold in the mononuclear cell experiments and in the whole blood experiments
There is variability in the patterns of gene expression within subjects for both groups. In particular, the K2 (kainate, second sample) animal had fewer upregulated genes (red) compared with the other subjects in the injury group. Since TUNEL and PANT staining were not performed on these animals, it is not known if this animal had a different degree of neuronal injury compared with the other subjects. It is also notable that one no-injury animal (C3) had a pattern that was different from the other no-injury animals in the group (Fig. 1). It shared some upregulated injury-group genes (some genes in the box, Fig. 1). Though the significance of these genes is unclear, they may be induced in blood in response to injury or stress that was not otherwise apparent in this control subject C3, possibly due to an unrecognized infection.
Whole blood experiments
Among rats with seizure scores of 4 or 5, we found significant PANT- and TUNEL-positive cells within the amygdala and entorhinal cortex (Fig. 2, right panel) that accounted for almost half of the neuron population in that region, followed by smaller percentages of positive cells found in the thalamus and the hippocampal CA-3 region (not shown). We did not detect any TUNEL- or PANT-positive cells in rats with a seizure score of 3 or less (Fig. 2, left panel).

PANT staining is shown in rat brain after severe
Genomic responses of whole blood to neuronal injury
Among 5,084 genes examined, 104 genes showed differential expression between injury and no-injury animals. Since the injury and no-injury animals were generally treated identically for each type of injury, it is likely that they would have similar levels of systemic stress. Therefore, we propose that these 104 genes represent whole blood markers of neuronal injury. Genes regulated greater than twofold in whole blood are listed at the bottom of Table 1. A hierarchical cluster analysis successfully classified 8 samples from whole blood into 2 clusters with one cluster consisting of the 4 injury samples and the other cluster consisting of 3 no-injury samples (Fig. 3). The remaining no-injury sample, although not automatically clustered, showed a similar expression profile to other no-injury samples (Fig. 3).
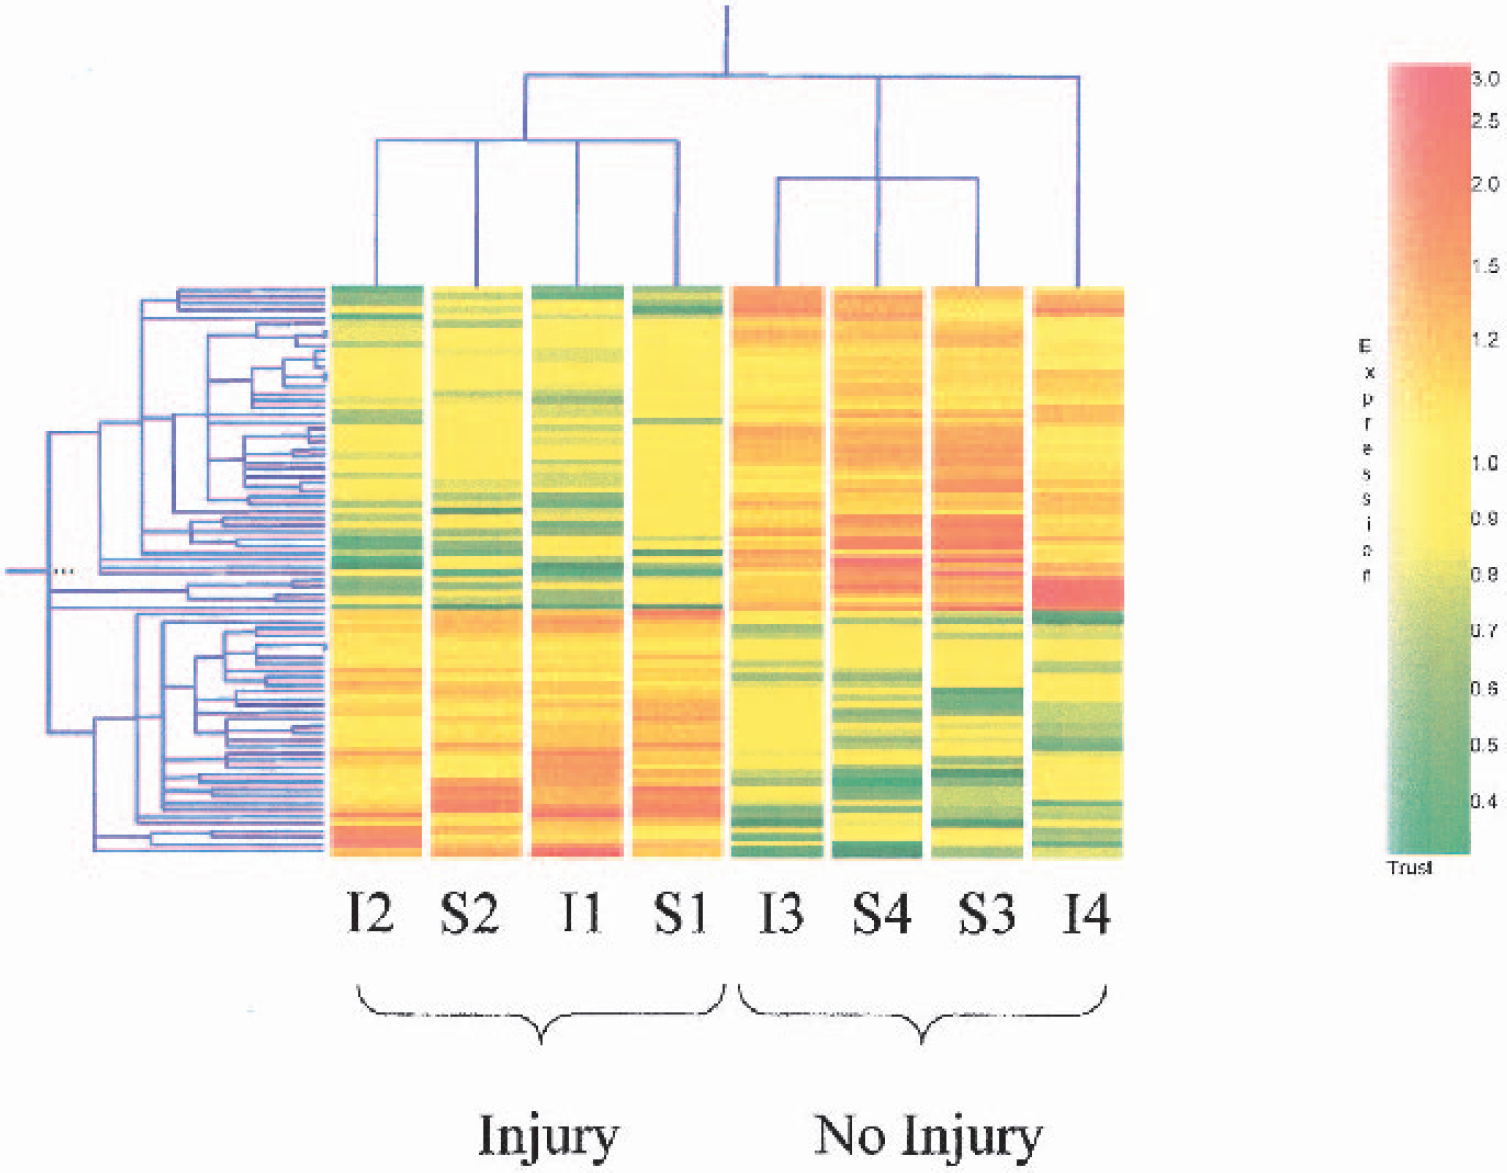
Genes upregulated (red) and downregulated (green) in whole blood of adult rats 24 h after global ischemia (I) or seizures (S) in a group of four animals that had brain “injury” compared with a group of four animals that had no brain injury—“no injury.” The plot shows hierarchical clustering of 104 regulated genes (y-axis) from whole blood of 8 different rats (x-axis). Rats were killed 24 h after global ischemia or kainate-induced seizures and their brains were processed for both PANT and TUNEL staining. Total RNA from whole blood was isolated and gene expression assessed using Affymetrix U34A microarrays. The brain samples were classified as injury or no injury. Injury-group animals (I2, S2, I1, S1) had multiple PANT- and TUNEL-stained nuclei in brain, including entorhinal cortex, hippocampus, and neocortex. No-injury animals (I3, S4, S3, I4) had no PANT- or TUNEL-stained cells in brain. A nonparametric Wilcoxon-Mann-Whitney test was used to screen genes that are differentially expressed between injury samples and no-injury samples. A Benjamini and Hochberg false discovery rate of <0.3 was used as a significance threshold. For each of 104 genes that met the threshold, the raw expression data were normalized to the median value of 8 measurements if the median value was greater than 100. Hierarchical clustering was performed with GeneSpring software. Genes that show similar expression patterns across different treatments cluster together. The color bar indicates normalized expression levels.
The next analysis determined whether there were genes that correlated with the degree of neuronal injury. A total of nine genes were significantly regulated as determined by the SAM program (Table 2). These genes showed the highest expression levels in severe-injury samples, slightly elevated expression in mild-injury samples, and lowest expression in no-injury samples (Fig. 4A). A hierarchical cluster analysis of these genes separated eight samples into two major clusters (Fig. 4B). One cluster consisted of two severe-injury samples, whereas the other cluster was further separated into two subclusters. One subcluster included two mild-injury samples, and the other subcluster consisted of three no-injury samples. Although the remaining no-injury sample was not automatically clustered, it showed similar expression profile to the other no-injury samples (Fig. 4B).
Genes with expression levels that were correlated with the degree of injury in the whole blood experiments as determined using SAM software
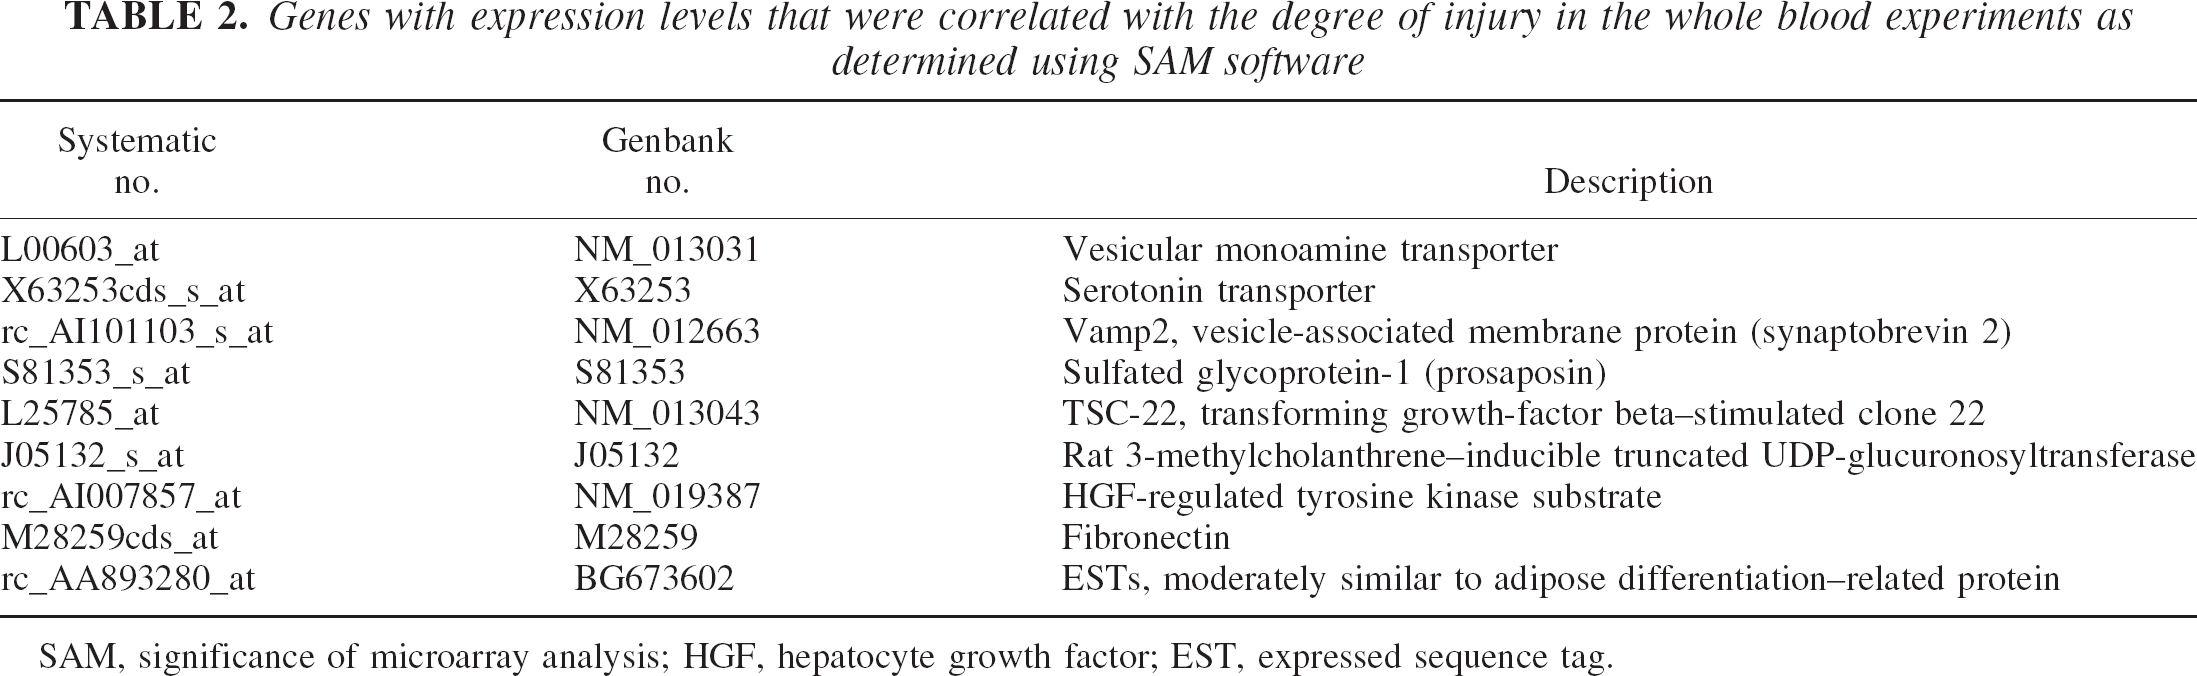
SAM, significance of microarray analysis; HGF, hepatocyte growth factor; EST, expressed sequence tag.
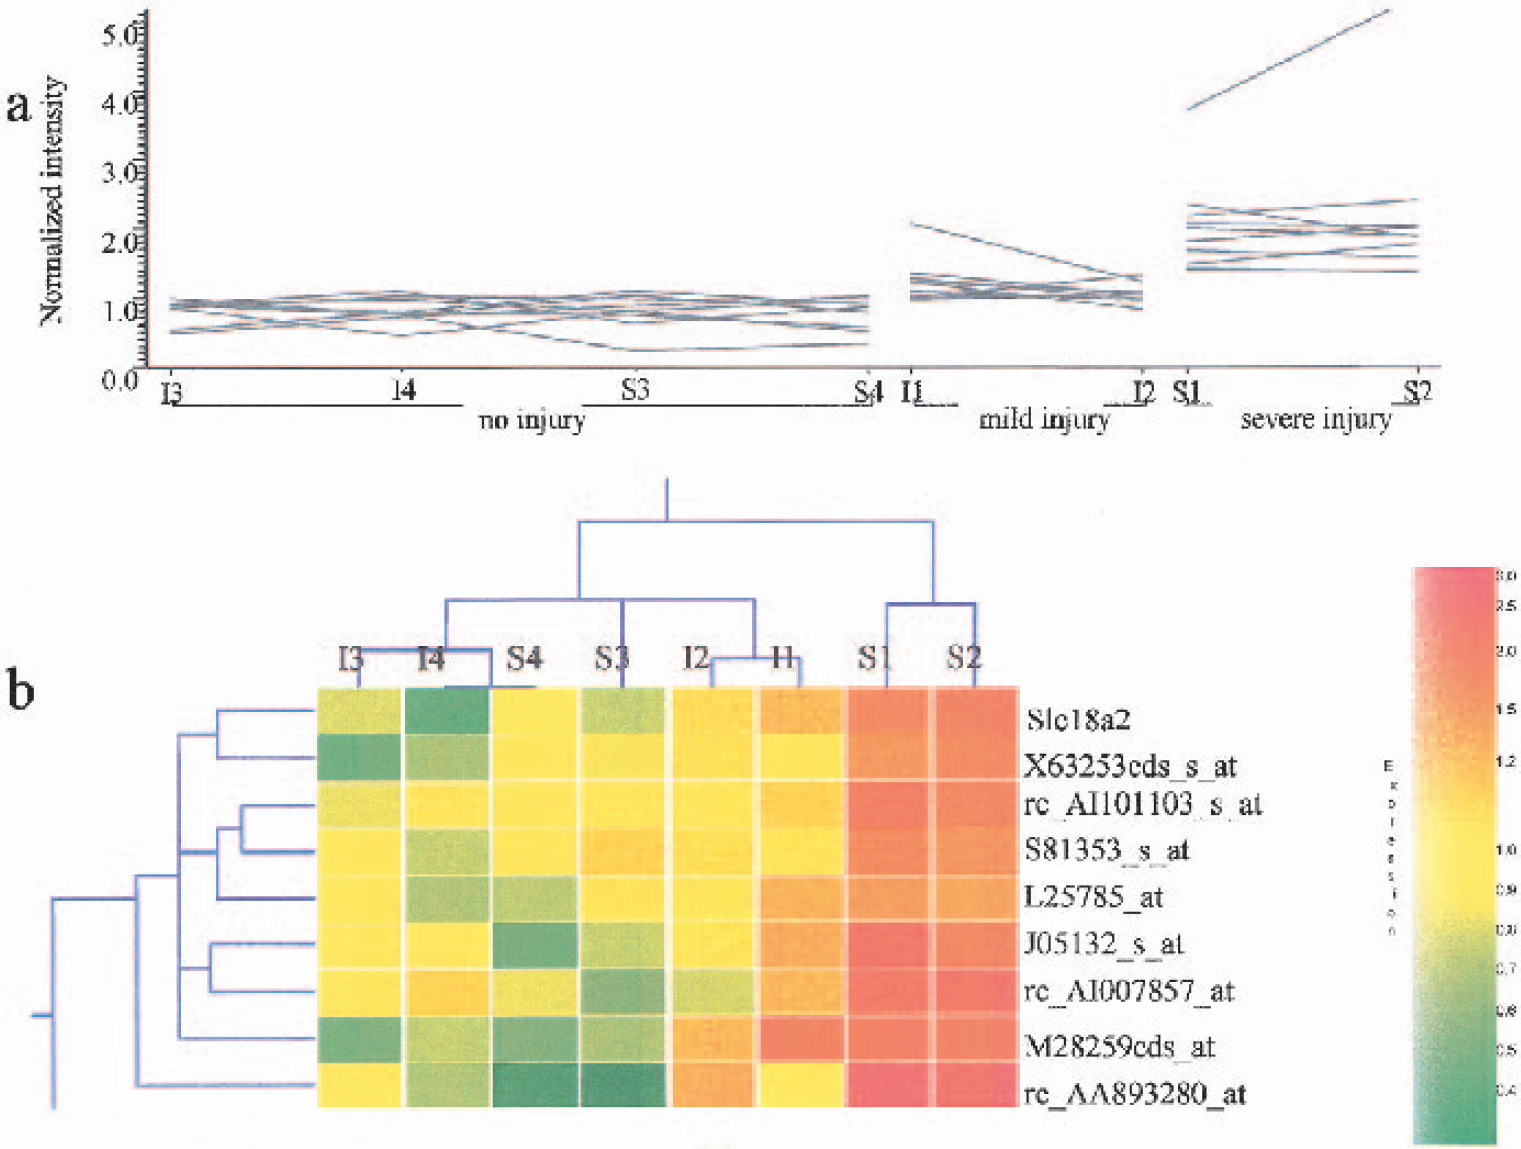
Expression profiles of 9 genes in whole blood of rats that correlate with the degree of brain injury. Twenty-four hours after global ischemia (I) or kainate-induced seizures (S), adult rats were killed and their brains were processed for TUNEL and PANT staining. Total RNA from whole blood was isolated and gene expression was assessed with Affymetrix U34A microarrays. The brain samples were classified as showing “severe injury” (S1, S2), “mild injury” (I1, I2) or “no injury” (I3, I4, S4, S3) according to the results of TUNEL and PANT staining. A Significance of Microarray Analysis (SAM) program was used to identify 9 genes whose expression in whole blood correlated with the degree of brain injury.
Many of the regulated genes shown in Tables 1 and 2 have potential brain- or vascular-related functions. For example, the vesicular monoamine transporter (Tables 1 and 2) accumulates cytosolic monoamines into synaptic vesicles and is expressed in dopamine neurons in the striatum (Miller et al., 1999). Its expression in striatal dopaminergic neurons may regulate susceptibility to neuronal damage (Wang et al., 1997). Considering the report that dopamine levels are significantly increased after brain trauma (Levitt et al., 1995), the elevation of vesicular monoamine transporter-2 (VMAT-2) may represent an adaptive mechanism of lymphocytes to decrease the systemic levels of dopamine after neuronal injury produced by stroke, seizures, and trauma.
Fibronectin, a glycoprotein that exists in blood plasma and extracellular matrix, plays a crucial role in a variety of morphogenetic processes such as cell adhesion, migration, and signal transduction (Owens and Cimino, 1982). Of interest is the report that plasma fibronectin–deficient mice show increased neuronal apoptosis and larger infarcts after focal cerebral ischemia (Sakai et al., 2001).
Prosaposin is a precursor of activator proteins for sphingolipid hydrolases (saposin) (O'Brien and Kishimoto, 1991). In human blood, leukocytes contain mainly saposin, whereas plasma contains mainly precursor forms, and platelets show many forms (Sano et al., 1989). It is reported that prosaposin protects against focal and global ischemia (Lu et al., 2000) and reduces cavity formation after stab wounds in rat brain (Hozumi et al., 1999).
Quantitative reverse transcription–polymerase chain reaction
Taqman quantitative RT-PCR was performed on 2 selected genes using 20 whole blood samples with each sample duplicated (total n = 40): severe-injury samples (n = 12), mild-injury samples (n = 6), no-injury samples (n = 22) (Fig. 5). The results show a 2.15-fold increase of VMAT-2 messenger RNA (mRNA) expression after 24 h in peripheral blood in both KA-induced seizure and global cerebral ischemia models. Rat density-enhanced phosphatase-1 (rDEP-1) mRNA levels showed similar increases in injured rats compared with uninjured, though the differences were less pronounced in global cerebral ischemia: 1.49- and 1.38-fold increase in KA-induced seizures and global ischemia, respectively. When the kainate and global ischemia data were combined, the expression level of VMAT-2 showed excellent correlation with the number of dead cells in brain: highest expression occurred with severe-injury samples, moderate expression with the mild-injury samples, and lowest expression in no-injury samples (Fig. 5). In contrast, the expression of rDEP-1 was also increased in the severe-injury samples but did not show upregulation in mild-injury compared with no-injury samples (Fig. 5).
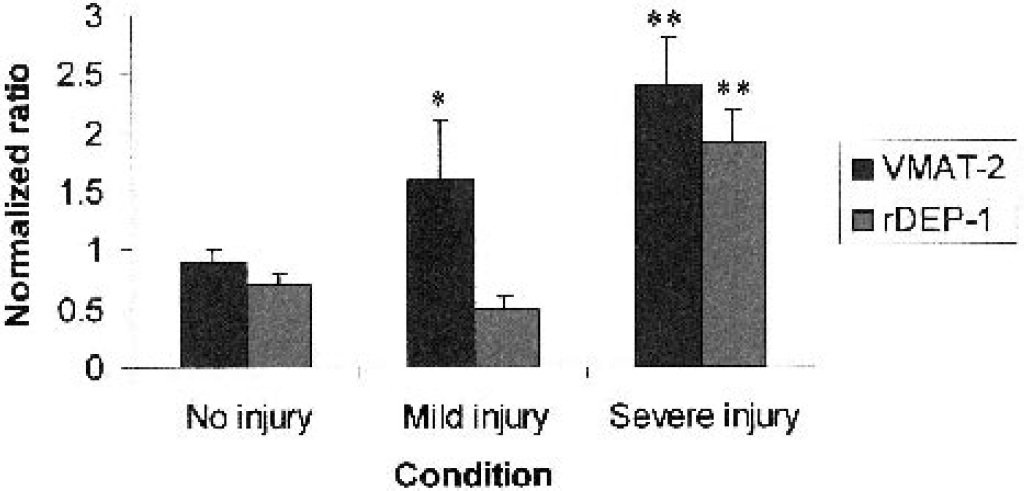
Reverse transcription–polymerase chain reaction quantification of whole blood vesicular monoamine transporter (VMAT-2) RNA and rat density-enhanced phosphatase-1 (rDEP-1), a vascular tyrosine phosphatase 1 RNA. Adult rats were killed 24 h after global cerebral ischemia or kainate-induced seizures, whole blood RNA was isolated, and the brains were processed for TUNEL and PANT staining. Based on the TUNEL and PANT staining, animals were then divided into three groups, those showing “no injury” (n = 22 samples), “mild injury” (n = 6 samples) or “severe injury” (n = 12 samples). The normalized ratio for each gene in each group, plotted on the y-axis, was calculated as the average expression of the gene in each condition normalized to the GAPDH control for each sample. An ANOVA showed an effect of injury on expression for VMAT-2 (P < 0.0009) and rDEP-1 (P < 0.003), and a post hoc Fisher test showed that VMAT-2 was significantly greater in severe-injury (P < 0.0002) and mild-injury (P < 0.01) groups compared with the no-injury group. In addition, rDEP-1 was significantly greater in the severe-injury (P< 0.0005) compared with the no-injury group. **P < 0.001; *P < 0.01.
An ANOVA showed an effect of injury on expression for VMAT-2 (P < 0.0009) and rDEP-1 (P < 0.003), and a post hoc Fisher test showed that VMAT-2 was significantly greater in severe-injury (P < 0.0002) and mild-injury (P < 0.01) compared with the no-injury group. In addition, rDEP-1 was significantly greater in the severe-injury (P < 0.0005) compared with the no-injury group.
DISCUSSION
We previously reported that several disease models in rats including ischemia, hemorrhage, seizures, hypoglycemia, and hypoxia each produce unique, characteristic genomic expression patterns in blood (Tang et al., 2001). In contrast, the present study shows a common gene expression pattern in peripheral blood 1 d after various types of experimental neuronal injuries. This suggests that gene expression profiling of peripheral white blood cells could be used to assess the occurrence of neuronal injury associated with various diseases.
Several underlying mechanisms likely explain the genomic responses of peripheral white cells to neuronal injury. One mechanism likely involves the interaction between peripheral immune cells and dead cells in brain. There is an inflammatory, immune response after various brain injuries. The recruitment of peripheral immune cells through the blood–brain barrier and subsequent inflammatory response may exacerbate brain injury early and contribute to repair later (Raivich et al., 1999). Neutrophils appear in brain a few hours after focal ischemia due to middle cerebral artery occlusion (Kochanek and Hallenbeck, 1992). Both T-lymphocytes and macrophages infiltrate brain by 12 h after middle cerebral artery occlusion and persist for days (Schroeter et al., 1994). After global cerebral ischemia, resident microglial cells and macrophages proliferate throughout hippocampus (Liu et al., 2001). An increase of neutrophils was found in both perivascular and brain parenchymal regions after reperfusion (Bottiger et al., 1998). Excitotoxic lesions produced by injection of KA or N-methyl-d-aspartate recruited neutrophils, macrophages, and some lymphocytes around vessels and in the surrounding parenchyma, with levels peaking as early as 8 h after injection (Bolton and Perry, 1998). According to the clonal selection theory, each lymphocyte is genetically committed to express a unique antibody or receptor. Later, on encountering external antigens, the cells respond by clonal expansion and differentiation (Jerne, 1985). Therefore, it is plausible that various clones of lymphocytes will be selected and expanded after exposure to previously hidden antigens, and the changes in the cumulative transcriptional pattern of blood could reflect the specific genomic programs of selected clones that are responding to the neuronal injury.
In contrast, various signaling molecules related to the immune response are released into serum and CSF in response to neuronal injury (Fassbender et al., 1994; Jankowsky and Patterson, 2001). The induction of cytokine secretion may be the underlying mechanism for upregulation of rDEP-1 expression in the monocyte blood experiments. rDEP-1 is a homolog gene of human DEP-1/human protein tyrosine phosphate-η (Borges et al., 1996), which has inhibitory effects on the immune system and specifically inhibits activation of lymphocytes (Tangye et al., 1998). It is likely that the increased expression of rDEP-1 may partly be due to T-cell activation induced by a serum surge of cytokines caused by acute neuronal injury.
Another mechanism that may contribute to the genomic responses of white cells is the release of neurotransmitters after brain injury. Peripheral white blood cells possess neurotransmitter receptors and transporters (Amenta et al., 2001; Dorsam et al., 2000; Kohm and Sanders, 2000; Lombardi et al., 2001; Stefulj et al., 2000), which may play important roles in the immunomodulation by the CNS. For example, dopamine interacts directly with its D2 and D3 receptors on human T cells and helps the trafficking and extravasation of T cells across blood vessels and tissue barriers (Levite et al., 2001). Catecholamines can also trigger the secretion of interleukin-10 from monocytes through a β-adrenoreceptor–mediated pathway, which causes changes in leukocyte distribution and lymphocytic apoptosis (Stevenson et al., 2001). Our finding that two monoamine transporters, VMAT-2 and serotonin transporter, along with a vesicle-associated membrane protein, synaptobrevin 2, are upregulated in white cells underscores the possible role of neurotransmitter systems in linking CNS injury and peripheral white blood cell genomic responses.
It should be noted that many genes were not shared between the mononuclear and whole blood experiments. There are several explanations for this. One is that the statistical thresholds were not extremely stringent, and hence several false-positive genes would be expected in both groups. A separate biologic problem in these studies is that the expression profiles are the cumulative expression of all the cells used for each experiment. All subsets of lymphocytes and monocytes were included in the mononuclear cell study. For the whole blood study, the RNA was even more heterogeneous, being derived from all cells in blood. It is possible that only a small fraction of the white blood cells respond to neuronal injury, whereas other elements in the system do not respond, but their presence could obscure changes in one cell type. Therefore, surveying whole blood or even just mononuclear cells may not be sensitive enough for identifying patterns of diagnostic value. Genomic profiles of specific subtypes of white blood cells may be required.
With the explosion of sequence information and the advances in genomics and proteomics, it may be possible to diagnose and classify clinical diseases at the molecular level. Transcriptional profiling with complementary DNA or oligonucleotide microarrays has been used to diagnose and classify cancer samples, to evaluate the response to chemotherapy, and to predict prognosis (Alizadeh et al., 2000; Armstrong et al., 2002; Golub et al., 1999; Lu et al., 2000; Ramaswamy et al., 2001). The application of this powerful technology, however, to most neurologic diseases will likely be limited by the unavailability of brain tissue. The many receptors and signal transduction pathways in peripheral blood cells may provide a potential alternative or surrogate for transcriptional profiling of diseases of brain and other organs (Tang et al., 2001, 2002). The present finding that there are rodent blood genomic markers of neuronal injury supports this approach. Compared with using a single or several biochemical markers, using the cumulative pattern of many genes is probably less susceptible to the influences of environmental factors and concurrent diseases and therefore could be more specific. It remains to be seen, however, whether blood genomics will be successful in human disease diagnosis, prognosis, or treatment evaluation.