
Abstract
Cellular hypoxia triggers a homeostatic increase in mitochondrial free radical signaling. In this study, blood was obtained from the radial artery and jugular venous bulb in 10 men during normoxia and 9 hours hypoxia (12.9% O2). Mitochondrial oxygen tension (
Introduction
Although the human brain represents only 2% body weight, it accounts for a disproportionate 25% of basal oxygen (O2) consumption to support the demands of neuronal activity. This commitment to an obligatory high rate of O2 consumption combined with limited glycolytic capacity renders the brain exquisitely sensitive to O2 deprivation (hypoxia), with a correspondingly high vulnerability for failure (Bailey et al, 2009a). As a consequence, elaborate cellular O2-sensing mechanisms have evolved to preserve O2 homeostasis and to ultimately prevent brain damage (Sharp and Bernaudin, 2004).
However, despite considerable progress in our understanding of the cerebral pathways activated during hypoxia, a unified mechanism that allows the brain to sense and ultimately respond to O2 remains elusive. Emerging evidence suggests that the mitochondrion may function as the primary O2 ‘sensor’, given its capacity to increase free radical and associated reactive oxygen–nitrogen species formation during hypoxia (Chandel et al, 1998). Although thermodynamically capable of causing structural damage when in excess, these oxidant signals can act as secondary messengers (Wright et al, 2004), which activate O2 salvage genes through stabilization of the transcription factor hypoxia-inducible factor-1α (Guzy and Schumacker, 2006) in physiologically controlled, although as of yet undefined, amounts.
In support, human studies have documented an increased systemic formation of free radicals during hypoxia in proportion to arterial desaturation (Bailey et al, 2009b). However, whether any potential relationship exists between cerebral mitochondrial PO2 and the focal (cerebral) formation of free radicals remains to be examined. This is clinically relevant, given the cerebral complications encountered in diseases defined by hypoxemia, notably obstructive sleep apnea and chronic obstructive pulmonary disease (Sharp and Bernaudin, 2004).
To investigate this, we combined electron paramagnetic resonance spectroscopy for direct detection of the ascorbate radical (A•−) with calculation of cerebral mitochondrial PO2
Materials and methods
Subjects and Design
Ten males aged 27±4 years old provided written informed consent following approval by the Scientific Ethics Committee of Copenhagen and Frederiksberg Municipalities (Denmark). After local anesthesia (2% lidocaine), subjects received a retrograde catheter in the right internal jugular vein using the Seldinger technique under ultrasound guidance with the tip advanced to the bulb of the vein. A radial arterial catheter was placed in the nondominant arm. Baseline samples were collected during normoxia (21% O2) and after 9 hours passive exposure to hypoxia (12.9% O2).
Cerebral Oxygenation
Hemoglobin (Hb), Hct (hematocrit), partial pressure of oxygen and carbon dioxide (PO2/PCO2), oxyhemoglobin saturation (SO2), pH, P50, temperature, and (whole-blood) glucose were determined using a blood gas analyzer (ABL 715; Radiometer Medical, Copenhagen, Denmark). Global cerebral blood flow (CBF) was measured using the Kety–Schmidt technique in the desaturation mode using nitrous oxide (N2O) as the tracer (Taudorf et al, 2009). In brief, subjects inhaled 5% N2O and O2 in N2 (corresponding to both normoxic and hypoxic inspirates) for 30 minutes. From 2 minutes before the cessation of N2O until 15 minutes thereafter, 12 sets of paired synchronized samples were drawn into gas-tight syringes from the arterial and venous catheters. Samples were equilibrated against air in a water bath at 37°C for 60 minutes, and N2O concentration was measured by photoacoustic spectroscopy (Innova Photoacoustic Field Gas Monitor 1412; Brüel & Kjaer, Copenhagen, Denmark). Unlike our previous study (Taudorf et al, 2009), all tubing was presaturated using a syringe filled with pure N2O, O2, and N2 corresponding to the inspired air mixtures before running experimental samples. Global CBF was subsequently derived by the Kety–Schmidt equation given as:
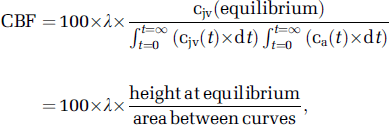
where cjv (t) and ca (t) are the jugular venous and arterial concentration of the tracer at time (t) in minutes, respectively, and λ represents the brain–blood partition coefficient (mL/g) calculated from data reported previously (Kety et al, 1948):

Cerebral plasma flow (CPF) was calculated as CBF × (1−Hct). Cerebral O2 delivery was calculated as:

where caO2 refers to arterial oxygen content (mmol):

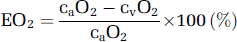
The oxygen extraction fraction (EO2) was determined by:
The global cerebral metabolic rate of oxygen (CMRO2) was calculated as:

where a–jvDO2 refers to the arterio-jugular venous O2 content difference.
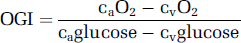
The OGI (oxygen–glucose index) was calculated as:
Using established formalism (Gjedde, 2005; Gjedde et al, 2005; Rasmussen et al, 2007), the mean capillary oxygen saturation
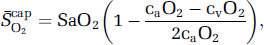
assuming that O2 extraction rises linearly with distance as blood traverses the capillary network. Solution of the Hill equation permitted calculation of the (mean) capillary PO2
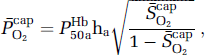
where P50aHb is the PO2 when Hb is half-saturated (29 mm Hg) and ha is Hill's coefficient (2.84 for arterial blood). Given the absence of capillary recruitment in the brain, O2 diffusibility (L) was calculated during hypoxia (in which mitochondrial oxygen tension could be assumed to be negligible) and given as:
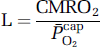
based on group mean values and assumed to be constant at 7.8 μmol/100g/min/mmHg for any given CBF. The mean mitochondrial PO2
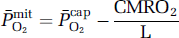
The assumptions and limitations associated with the formalism underlying the nonlinear flow–metabolism coupling model have been discussed in detail elsewhere (Gjedde, 2005).
Ascorbate (Antioxidant)
Exactly 100 μL of plasma was stabilized and deproteinated by adding 900 μL of 5% metaphosphoric acid (Sigma Chemical, Dorset, UK). Ascorbate was assayed by fluorimetry based on the condensation of dehydroascorbic acid with 1,2-phenylenediamine (Bailey et al, 2009d). The intraassay and interassay coefficients of variations were both <5%.
Ascorbate (Free Radical)
Exactly 1 mL of plasma was injected into a high-sensitivity multiple-bore sample cell (AquaX, Bruker Instruments Inc., Billerica, MA, USA) housed within a TM110 cavity and analyzed by X-band electron paramagnetic resonance spectroscopy operating at 100 kHz modulation frequency, 0.65 Gauss (G) modulation amplitude, 10 mW microwave power, 2 × 10⁵ receiver gain, and 41 milliseconds time constant for 3 incremental scans (Bailey et al, 2009b). Spectra were filtered identically using WINEPR (Version 2.11, Bruker, Karlsruhe, Germany), and the double integral of each doublet was calculated using the Origin software (Version 5.0, OriginLab®, Northampton, MA, USA). The intraassay and interassay coefficients of variations were both <5%.
Neuron-Specific Enolase
Neuron-specific enolase was incorporated as a molecular biomarker of neuronal-parenchymal injury using a commercially available enzyme-linked immunosorbent assay (CanAg, Ref 420-10) with a lower detection limit of <1 μg/L. The intraassay and interassay coefficients of variations were both <5%.
Cerebral Net Exchange
This was calculated as:

By convention, a negative value reflects net cerebral output or gain, whereas a positive value reflects consumption or loss.
Cephalalgia
Symptoms of acute mountain sickness (AMS) were assessed using the LL (Lake Louise) (Roach et al, 1993) and ESQ-C (Environmental Symptoms Questionnaire Cerebral) (Sampson et al, 1983) scoring systems. A clinically validated visual analog scale was used to measure headache (Iversen et al, 1989). Clinical AMS was diagnosed if a subject presented with a combined total LL score (self assessment+clinical score) of 5 points and ESQ-C score 0.7 points (Bailey et al, 2009b).
Statistical Analysis
The Shapiro-Wilk W-tests confirmed distribution normality. Cerebral oxygenation and exchange data were analyzed using a combination of paired samples t-tests and two-way repeated-measures ANOVA (analysis of variance). Relationships were examined using a Pearson product moment correlation. Significance was established at P<0.05 and data are presented as mean±s.d.
Results
Cerebral Oxygenation
Hypoxia was associated with a reduction (P<0.05 versus normoxia) in PaO2 (107±6 mm Hg to 46±3 mm Hg), PaCO2 (43±2 mm Hg to 35±2 mm Hg), SaO2 (99%±1% to 83%±3%), and corresponding cerebral O2 delivery (Table 1). As a consequence,
Cerebral oxygenation
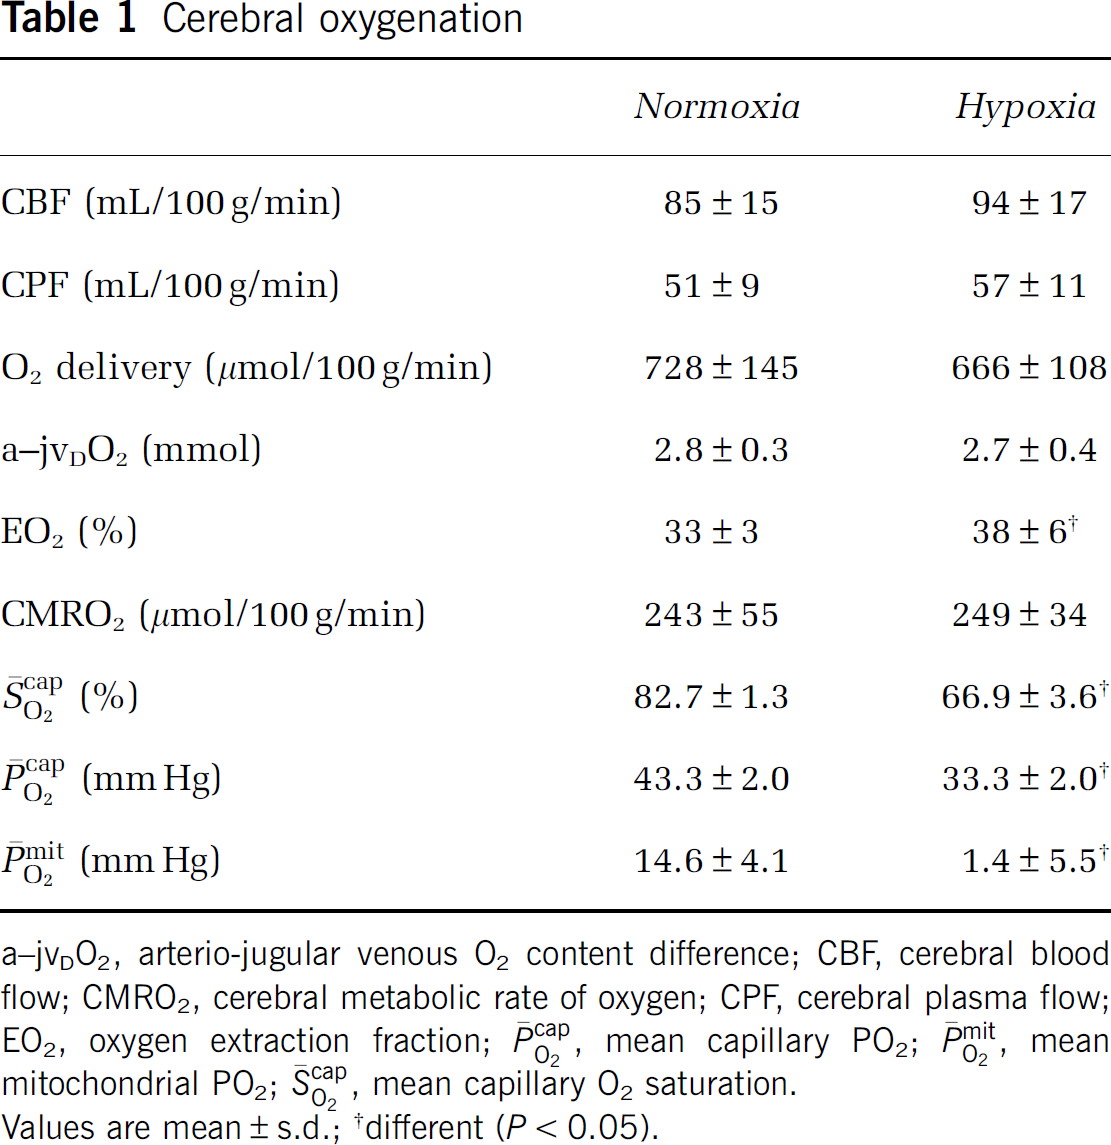
a–jvDO2, arterio-jugular venous O2 content difference; CBF, cerebral blood flow; CMRO2, cerebral metabolic rate of oxygen; CPF, cerebral plasma flow; EO2, oxygen extraction fraction;
Values are mean±s.d.; †different (P<0.05).
Free Radicals
Hypoxia did not affect the a–jvD or subsequent exchange of ascorbate (hypoxia: 0.052±0.250 mmol/100g/min versus normoxia: 0.120±0.249 mmol/100g/min, P>0.05). In contrast, hypoxia decreased the a–jvD of A•− (−522±471 AU/100g versus −148±256 AU/100 g, P<0.05) primarily caused by an increase in jugular venous outflow (P<0.05). Typical examples of A•− spectra (aH4≈1.76 G, ΔHpp=≈0.6 G, and g=2.0052) observed with corresponding signal intensities are illustrated in Figure 1A. This translated into an increased cerebral output in hypoxia (−29,283±25,852 AU/100 g/min versus −7,131±12,260 AU/100g/min, P<0.05), which correlated directly against the reduction in
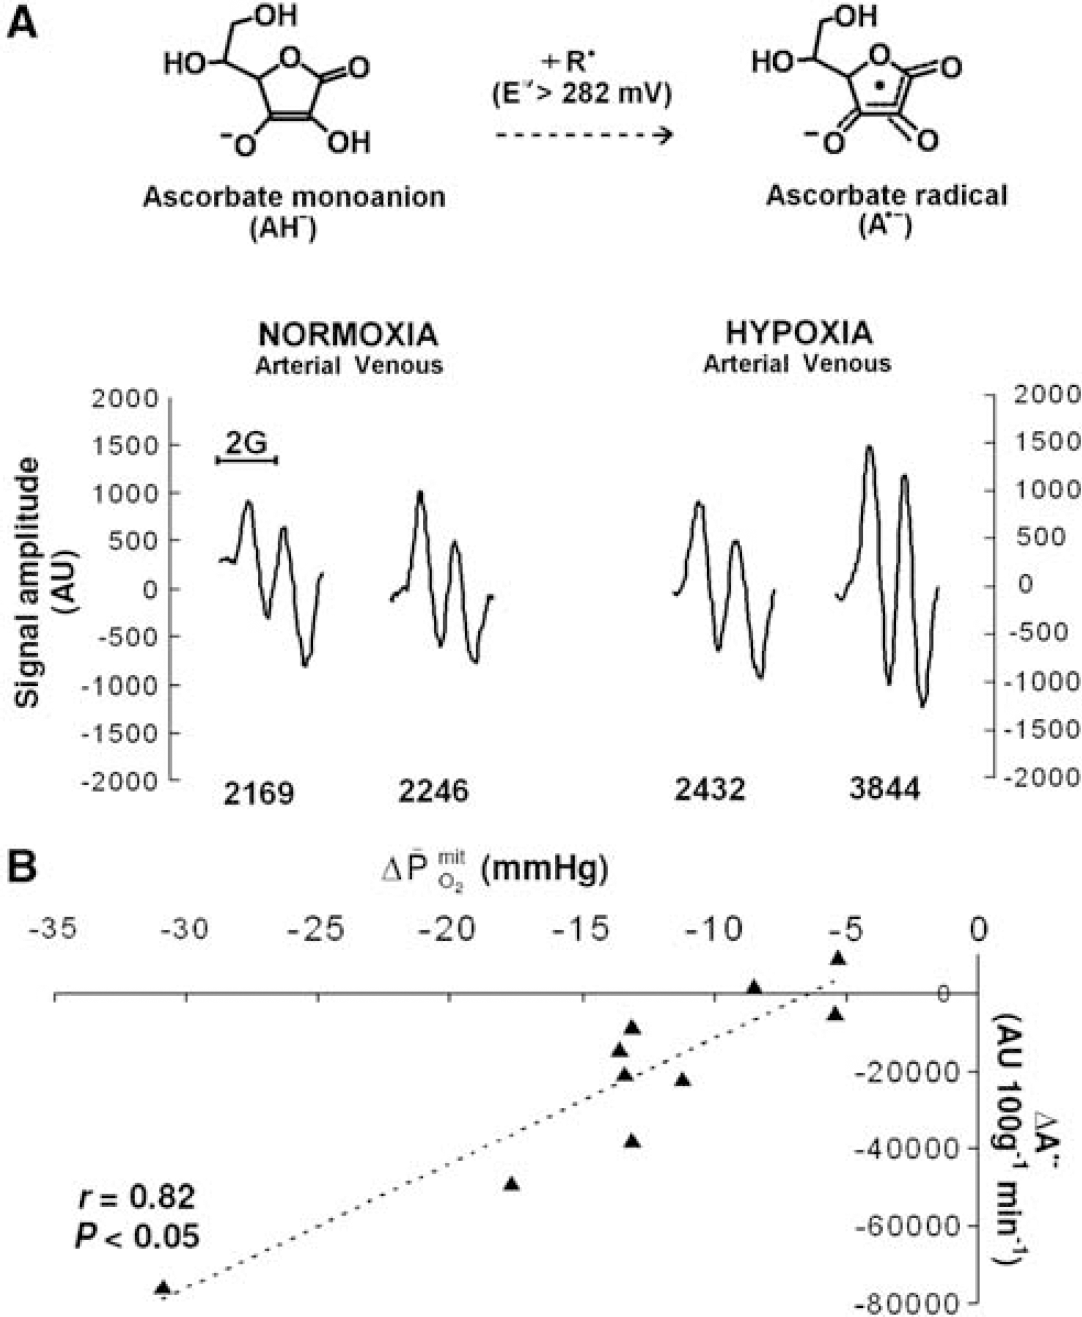
Cerebral formation of the ascorbate radical (A•−) during hypoxia. (
Neurovascular Integrity
There was no evidence of neuronal-parenchymal injury because hypoxia affected neither the a–jvD nor the exchange of NSE (34.6±40.2 μg/100g/min versus normoxia: 30.2±36.3 μg/100g/min, P>0.05).
Cephalalgia
Hypoxia increased AMS (LL: 3±2 points versus normoxia: 0±0 points, P<0.05; ESQ-C: 0.803±0.674 AU versus normoxia: 0.000±0.000 AU, P<0.05) and headache (visual analog scale: 29±23 mm versus normoxia: 0±0 mm, P<0.05) scores, which correlated modestly against the increased cerebral output of A•− (LL: r=−0.61, P=0.06; ESQ-C: r=−0.56, P=0.09; visual analog scale: r=−0.65, P=0.04). Furthermore, the one subject diagnozed with clinical AMS exhibited the greatest reduction in
Discussion
The major finding in this study was that the increased cerebral output of free radicals in the form of A•− observed during hypoxia did not compromize neuronal-parenchymal integrity and correlated directly against the reduction in
These findings extend previous electron paramagnetic resonance spin-trapping reports of an increased cerebrospinal fluid concentration (Bailey et al, 2006) and net cerebral output of blood-borne alkoxyl-alkyl radicals during hypoxia (Bailey et al, 2009d). In the current study, we took advantage of A•− as a biomarker to determine the brain's ‘global’ rate of free radical flux in vivo rather than focus on select species trapped ex vivo whose individual contributions to the neuro-oxidative cascade remain, as a consequence, uncertain. Given that the one-electron reduction potential associated with the A•−/ascorbate monanion (AH−) couple is so low (E°′=+282 mV at pH 7.0), any radical generated across the cerebral circulation will react endogenously with this terminal small-molecule antioxidant to form the distinctive doublet A•− that is readily detectable by electron paramagnetic resonance [(R•+AH− → A•−+R-H (Buettner, 1993)]. The fact that hypoxia did not affect ascorbate exchange further emphasizes that the increased output of A•−, detectable even within the time constraints of a single arterio-venous transit, likely reflects de novo radical formation (and not simply increased ascorbate auto-oxidation) by any number of oxidizing species whose identities remain to be established.
Although beyond the scope of this study, the source, mechanisms, and functional significance of free radical formation in hypoxia remain to be established. Given its modest antioxidant defenses, abundance of catalytic transition metals, auto-oxidizable neurotransmitters, and neuronal membrane lipids rich in polyunsaturated fatty acid side chains exposed to a disproportionately high O2 flux, the human brain has traditionally been considered especially vulnerable to molecular attack (Bailey et al, 2009a). To examine this, we measured exchange of the dimeric enzyme NSE, the neuronal form of the glycolytic enzyme enolase (2-phospho-
As anticipated, hypoxia was associated with AMS and headache with modest correlations observed between symptom scores and the increased cerebral output of A•−. Similar correlations have been observed between the increase in (cephalic) venous A•− and cephalalgia which could be explained, at least in part (≈30% of the variance) by the reduction in arterial oxyhemoglobin saturation (Bailey et al, 2009b). Thus, if AMS is indeed associated with more marked arterial hypoxemia as suggested previously (Ge et al, 1997), symptoms may simply prove the consequence of more marked
These findings force a reappraisal of free radicals as simply damaging or toxic ‘accidents of chemistry’ and argue that their formation by the human brain may represent an adaptive response to hypoxia. It is tempting to speculate that the increases in CBF and EO2 observed in the current study were subject to redox regulation and served to maintain global cerebral oxygenation in the face of severe hypoxemic hypocapnia. This concept is consistent with earlier work implicating (mitochondrial) reactive oxygen–nitrogen species as signaling molecules that coordinate the intrinsic mitochondrial cell death pathway in response to a diverse range of cellular stressors (Wright et al, 2004). More recently, in vitro studies that have identified the electron transport chain as the primary O2 sensor, with complex III-derived reactive oxygen species released to the intermembrane space and cytosol as signals capable of triggering transcriptional and post-translational responses to hypoxia, notably stabilization of hypoxia-inducible factor-1α, which ultimately preserve cellular O2 supply (Waypa et al, 2010). In support, antioxidant prophylaxis was recently associated with a reduction in brachial artery vasodilation in exercising humans (Richardson et al, 2007), further establishing the functional importance of free radical formation in controlled, although as of yet undefined, amounts.
It is important to recognize that our findings reflect ‘global’ as opposed to ‘regional’ cerebral responses to hypoxia and the techniques used lack the temporal resolution required to assess dynamic change. The regional variation in the CBF response to acute (although isocapnic) hypoxia (8 minutes at 10% O2) was confirmed by H215O positron emission tomography (Binks et al, 2008). The authors identified that phylogenetically older structures of the brain (nucleus accumbens, putamen, pallidum, caudate, and thalamus) exhibited greater increases in CBF during hypoxia compared with evolutionary younger (cortical) regions, which they speculated may represent an adaptive response that serves to protect regions responsible for (the more) essential homeostatic functions. Thus, like the skeletal and pulmonary circulatory response to hypoxia, the cerebral tissue is equally defined by marked diffusion-perfusion heterogeneity and as a consequence, one must therefore assume that the
The values obtained for CBF and CMRO2 (and thus by consequence the derivation of L) were noticeably higher than those reported in previous studies using the same technique, although with 133Xe as the tracer (Madsen et al, 1993; Moller et al, 2002). The reasons for this discrepancy are not clear, although we remain confident that they were not caused by the contamination of samples with blood from extracerebral regions or as a consequence of inadequate desaturation.
Extracranial contamination would lead to a higher CBF, but would probably not affect CMRO2 or even decrease the measured values, given the low metabolic rate and oxygen extraction of extracranial tissues. This is further supported by the observed OGIs, which would have been expected to be significantly greater than the observed values of ≈6, given that such tissue would not be expected to be fueled exclusively by glucose. Finally, in the absence of radiographic evidence, all subjects reported a ‘purl’ during saline injection into the catheter, which indirectly confirms correct line placement.
In terms of desaturation, because N2O is less soluble in biologic tissues than 133Xe (Kety et al, 1948), the corresponding washout phase should theoretically be shorter and thus the error of measurement less. Furthermore, the sampling period was expanded from the original 10 minutes as applied with 133Xe (Madsen et al, 1993; Moller et al, 2002) to 15 minutes to confirm a complete washout. Finally, our choice of N2O as the tracer did not influence blood-borne nitric oxide metabolites, thus arguing against nitric oxide-mediated vasodilatation as a potential contaminant (Taudorf et al, 2009). Although the reasons underlying these atypically high CBF and CMRO2 values remain unknown, the repeated-measures design ensured precision with our primary interest focused on the qualitative changes incurred by hypoxia.
In conclusion, the observation that hypoxia triggers a net cerebral output of free radicals in the absence of neurovascular tissue damage and in direct proportion to the reduction in
Footnotes
Acknowledgements
The authors acknowledge Mrs R Rousing and H Villumsen (University of Copenhagen, Denmark) for their technical assistance and Drs DM Murphy and E Carter (University of Cardiff, UK) for informed discussions.
The authors declare no conflict of interest.