
Abstract
Dynamic changes in the regional cerebral glucose metabolic rate induced by hypoxia/reoxygenation or ischemia/reperfusion were investigated with a positron autoradiography technique. Fresh rat brain slices were incubated with [18F]2-fluoro-2-deoxy-D-glucose ([18F]FDG) in oxygenated Krebs-Ringer solution at 36°C, and serial two-dimensional time-resolved images of [18F]FDG uptake in the slices were obtained. In the case of loading hypoxia (oxygen deprivation)/pseudoischemia (oxygen and glucose deprivation) for various periods of time, the net influx constant (K) of [18F]FDG at preloading and after reoxygenation/pseudoreperfusion (post-loading) was quantitatively evaluated by applying the Patlak graphical method to the image data. Regardless of the brain region, with hypoxia lasting ≥20 minutes, the postloading K value was decreased compared with the unloaded control, whereas with pseudoischemia of ≤40 minutes, approximately the same level as the unloaded control was maintained. Next, the neuroprotective effect against hypoxia/pseudoischemia loading induced by the addition of a free radical scavenger or an N-methyl-D-aspartate (NMDA) antagonist was assessed by determining whether a decrease in the postloading K value was prevented. Whereas with 20-minute hypoxia, both agents exhibited a neuroprotective effect, in the case of 50-minute pseudoischemia, only the NMDA antagonist did so, with the free radical scavenger being ineffective. These results demonstrate that hypoxia causes irreversible neuronal damage within a shorter period than ischemia, with both free radicals and glutamate suggested to be involved in tandem in the neurotoxicity induced by hypoxia, whereas glutamate alone is involved in ischemic neurotoxicity.
A continuous supply of oxygen and glucose to the brain is essential to maintain neuronal function and viability. Although hypoxia and ischemia have a lack of oxygen in common, these two states differ with respect to the presence/absence of glucose. As a developmental mechanism of the neuronal damage associated with hypoxia/ischemia, glutamate-induced excitotoxicity has been widely recognized (Benveniste et al., 1984; Simon et al., 1984). Glutamate release is enhanced by energy insufficiency (Siesjö, 1992); hence, ischemia with marked energy insufficiency is mostly associated with more severe neuronal damage than hypoxia, with the former, for example, doing greater damage to the cell membrane than the latter (Goldberg and Choi, 1993; Pringle et al., 1997), and the reversibility of neuronal function (postsynaptic potential and level of high-energy phosphates) being poorer after loading with the former than with the latter (Rego et al., 1996). However, it has subsequently been confirmed that reoxygenation/reperfusion leads to production of free radicals (Braughler and Hall, 1989; Hall and Braughler, 1989). DNA is a major target attacked by free radicals (Halliwell, 1987), and it has been reported that DNA degradation is provoked by hypoxia but not by ischemia (Copin et al., 1996), suggesting hypoxia to be more neurotoxic than ischemia. In this way, no consensus has yet been reached regarding the degree of neuronal damage resulting from hypoxia as compared with ischemia. Further research to clarify the differences in the mechanisms underlying the neuronal damage provoked by these conditions, including the involvement of free radicals and glutamate, is needed.
Limitations exist when strictly studying these issues in in vivo systems because of the difficulty in evenly applying hypoxia/ischemia loading and fluctuations in the hemodynamic state developing during the course (Ames et al., 1968). The in vitro experimental model using brain slices differs from in vivo systems in numerous aspects such as the absence of a circulatory system and blood-brain barrier; in other words, one may study the effect of any desired alteration in that environment in the absence of blood-borne factors with precise control over the extracellular environment of this preparation. In this way, the obtained results are subject to greater control by the experimenter. Measurement of the cerebral glucose metabolic rate (CMRglc) using 2-deoxyglucose and the tracer kinetic model of Sokoloff et al. (1977) has found wide acceptance as a method of assessing brain function. We recently developed an imaging technique in fresh brain slices, dynamic positron autoradiography technique (dPAT), which utilizes positron emitter-labeled tracers as a probe and an imaging plate as the detector (Murata et al., 1996, 1998). Due to the high specific radioactivity of the radiotracers, high energy of positrons, and high sensitivity of the imaging plate, serial two-dimensional images of radioactivity in the slices can be constructed quantitatively with short exposure time, while the brain tissue remains alive in the incubation solution.
The present study, using dPAT with [18F]2-fluoro-2-deoxy-D-glucose ([18F]FDG) and fresh rat brain slices, investigated dynamic changes in the regional CMRglc in response to successive perturbations of hypoxia (oxygen deprivation)/pseudoischemia (oxygen and glucose deprivation) from hypoxia/pseudoischemia preloading until the reoxygenated/pseudoreperfused postloading phase. In addition, using the net influx constant of [18F]FDG as an index, we quantitatively evaluated the injury to brain tissue induced by reoxygenation/pseudoreperfusion after hypoxia/pseudoischemia of various durations as well as the neuroprotective effect against hypoxia/pseudo-ischemia loading of α-phenyl-N-tert-butylnitrone (PBN), a free radical scavenger, and (+)-5-methyl-10,11-dihydro-5H-dibenzo[a,d]cyclohepten-5,10-imine hydrogen maleate (MK-801), an N-methyl-D-aspartate (NMDA) receptor antagonist.
METHODS
Preparation of brain slices and setup for incubation
Male Sprague-Dawley rats weighing 250 to 300 g were anesthetized with diethyl ether. After decapitation, the brains were quickly removed and immersed in oxygenated and cooled (1 to 4°C) Krebs-Ringer solution (having the following composition in millimolar concentrations: NaCl, 124; KCl, 5; MgCl2, 1; CaCl2, 2; KH2PO4, 1.2; NaHCO3, 26; glucose, 10). Brain slices of 300-μm thickness were prepared with a microslicer (DTK-2000; Dosaka EM, Kyoto, Japan). For one trial of measurement, 24 sagittally sectioned brain slices were taken from two rats.
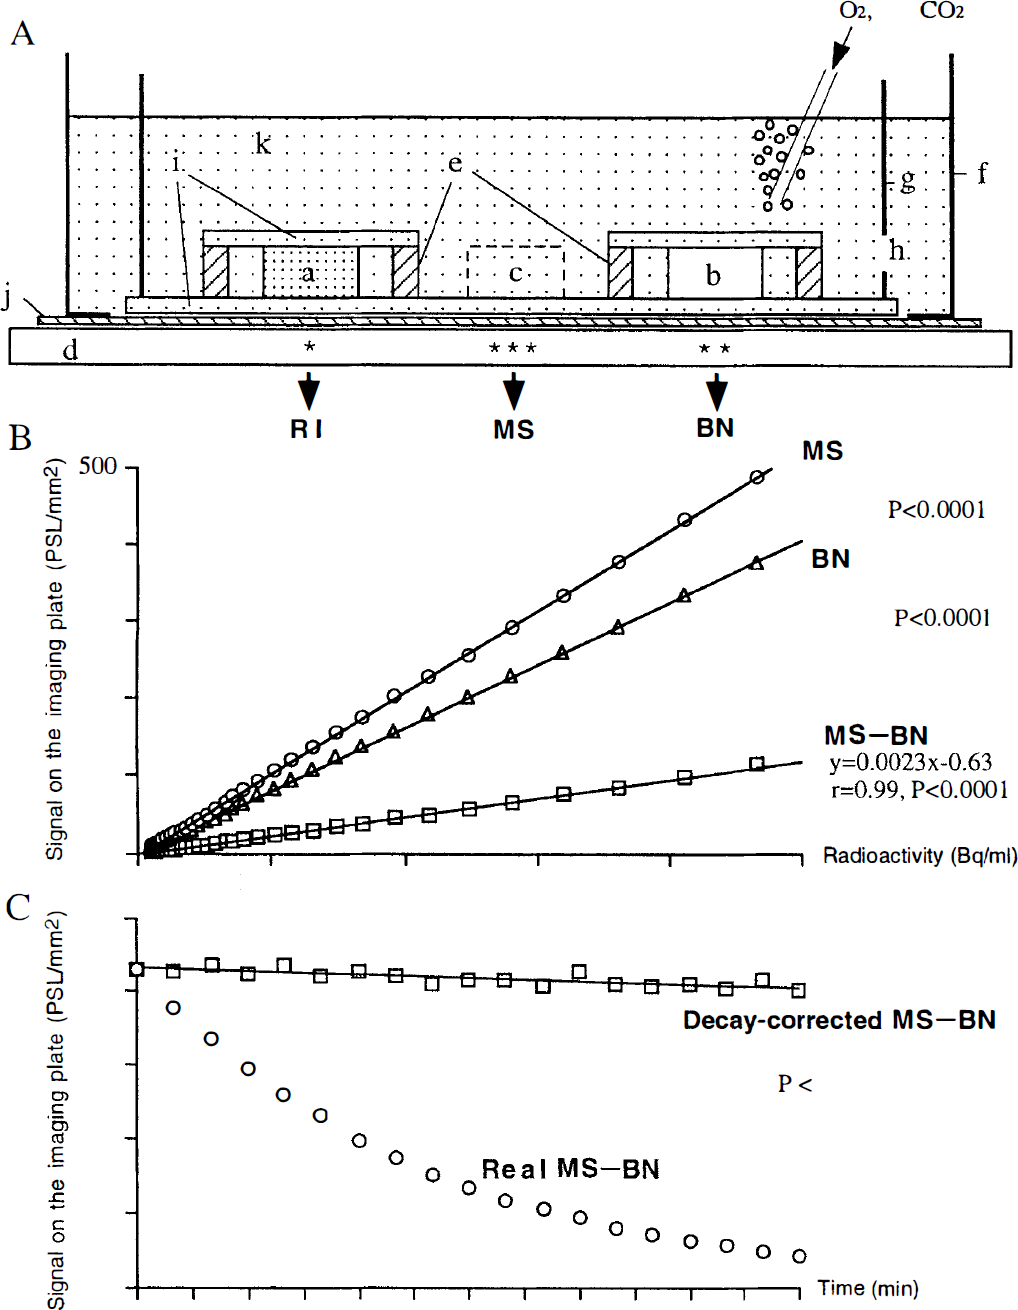
The setup for incubation of the slices was composed of double polystyrene chambers (outer and inner ones), as described previously (Murata et al., 1996, 1998). Their side view is illustrated in Fig. 1A. In brief, the bottom of the outer and inner chambers was cut to make a rectangular hole, over which a transparent polyvinylidene chloride film (10 μm thick) or a fine nylon net (80 μm thick) was tightly stretched and fixed in place by gluing to the side wall. The outer chamber was filled with 80 mL of Krebs-Ringer solution (8 mm in depth), in which the inner chamber with numerous small holes (4 mm in diameter) on the side wall was immersed. Brain slices were arranged on the nylon net of the inner chamber and lightly fixed in place by covering with a fine nylon net, which was stretched and glued to the upper side of a 300-μm-thick stainless-steel ring (2 cm in inner diameter). The bathing solution was kept at 36°C and continuously bubbled with 95% O2/5% CO2 gas supplied through a fine silicone tubing introduced into the inner chamber at six sites, to promote consistent perfusion within the chamber. To minimize evaporative water loss from the bathing solution, a lid was placed on top of the outer chamber. Loading and relief of hypoxia/pseudoischemia were conducted after transferring brain slices, using the inner chamber as the container, to another outer chamber with the same amount of [18F]FDG diluted with prewarmed Krebs-Ringer solution (containing 10 mmol/L or no glucose) bubbled in advance with either 95% N2/5% CO2 gas or 95% O2/5% CO2 gas. The oxygen partial pressure was serially measured in several experiments using a Blood Gas System 280 (Ciba Corning Diagnostics Corp., Medfield, MA, U.S.A.) and was 20 to 25 mm Hg when 95% N2/5% CO2 gas was used and 650 to 700 mm Hg when 95% O2/5% CO2 gas was used. The PBN and MK-801 were purchased from Aldrich Chemical Co. (Milwaukee, WI, U.S.A.) and Research Biochemicals Int. (Natick, MA, U.S.A.), respectively.
Production of radiotracer and measurement of [18F]FDG uptake
18F was produced by 18O(p,n) 18F nuclear reaction, and [18F]FDG was synthesized by the method of Hamacher et al. (1986) with an automated [18F]FDG synthesis system (NKK Co., Tokyo, Japan). The specific radioactivity of [18F]FDG was 1 to 2 Ci/mmol at the end of synthesis, and the total concentration (labeled plus unlabeled) used in this study ranged from 0.41 to 1.32 μg/mL (2.5 to 6.7 μmol/L). After 1-hour preincubation of brain slices in Krebs-Ringer solution at 36°C (pH 7.3 to 7.4), the inner chamber containing the slices was removed and placed in another outer chamber in which [18F]FDG had been diluted at 150 kBq/mL with prewarmed Krebs-Ringer solution. A set of six double polystyrene chambers, each of which contained four slices, was put on an imaging plate (BAS-MP 2040S; Fuji Photo Film Co., Tokyo, Japan), which was replaced with a new plate every 10 minutes. Exposed imaging plates were scanned with a bioimaging analyzer (BAS-1500; Fuji Photo Film Co.), and the images were displayed on a Macintosh computer. The pixel size was 100 μm. When the experiments were finished, photocopies were taken of the brain slices to identify brain regions by referring to the rat brain map (Paxinos and Watson, 1986).
Calculation of cerebral glucose metabolic rate and Patlak graphical analysis
The three-compartment model for [18F]FDG using brain slices is based on the distribution of [18F]FDG in bathing medium [Cp*(t)], [18F]FDG in tissue [Ce*(t)], and [18F]FDG-6-PO4 in tissue [Cm*(t)] (Sokoloff et al., 1977; Newman et al., 1988). First-order rate constants describing the transport between compartments include k1* and k2* for forward and reverse [18F]FDG transport and k3* and k4* for phosphorylation of [18F]FDG and dephosphorylation of [18F]FDG-6-PO4. In the equilibrium condition, as the influx constant of [18F]FDG [=k1*k3*/(k2* + k3*)] is equivalent to the rate of [18F]FDG-6-PO4, CMRglc can be estimated with the following expression (Huang et al., 1980):
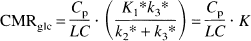
where Cp is the medium glucose concentration and LC is the lumped constant, which accounts for differences in the transport and phosphorylation of [18F]FDG and glucose (Sokoloff et al., 1977; Huang et al., 1980). K is the macroparameter for the net influx constant of [18F]FDG. If both Cp and LC are constant, the linear relationship should be kept between K and CMRglc according to Eq. 1, and thus K itself can be considered an index of CMRglc. The Patlak graphical method (Patlak et al., 1983) employed to determine the macroparameter K was based on the following equation:
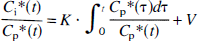
where Ci*(t), which is equal to the sum of Ce*(t) and Cm*(t), is the total brain tissue radioactivity, Cp*(t) is the input function, and V is related to the effective distribution volume of the tracer [18F]FDG. Thus, with the assumption that k4* is equal to zero, K was estimated from the slope of the linear portion of the graph, Ci*(t)/Cp*(t) (vertical Y axis) versus ∫ t 0Cp*(τ)dτ/Cp*(t) (horizontal X axis).
To perform quantitative analysis based on the Patlak graphical method, as a slice phantom, a 300-μm-thick nylon sheet (specific gravity = 1.14) (Fig. 1A, b) of approximately the same size as the slices was set up under the same experimental conditions as the 300-μm-thick brain slices (Fig. 1A, a). Then, in the surrounding medium solution as well, 300-μm-thick bathing solution was assumed in the same position as this (Fig. 1A, c), and the radioactivity signal from each 300-μm-thick layer (brain slice, nylon sheet, bathing solution) and the radioactivity signal from the medium solution above and below these layers were divided, with the contribution of each to the radioactivity signal measured on the imaging plate estimated. First, there were no differences thought to be present in the contribution to radioactivity signal by the medium solution beneath each layer (present in the gaps in the nylon net between each layer and imaging plate). Next, the density of brain tissue, nylon sheet, and medium solution was in each case close to 1, and as the radioactivity signal from the medium solution above each layer passed through each layer with the same attenuation rate, the radioactivity signal contributed by these was thought to be equal.
Accordingly, when RI is defined as the radioactivity signal (photostimulated luminescence/mm2) on the imaging plate detected beneath the region of interest (Fig. 1A, *), BN as the radioactivity signal on the imaging plate detected beneath the nylon sheet for measuring the background noise (Fig. 1A, **), and MS as the average radioactivity signal on the imaging plate detected at four places beneath the bathing medium solution surrounding each brain slice or nylon sheet (Fig. 1A, ***), the portion of the radioactivity signal contributed only by the 300-μm-thick brain tissue can be calculated from RI − BN, and in the same way the portion of the radioactivity signal contributed only by the 300-μm-thick bathing solution can be calculated from MS − BN, as the radioactivity signal from the 300-μm-thick nylon sheet is 0. Here, the same amount of [18F]FDG either in a 300-μm-thick brain slice or in a 300-μm-thick bathing solution layer (the densities of which are nearly equal) should yield the same amount of signal on the imaging plate. Thus, Ci*(t)/Cp*(t) can be expressed in terms of the following ratio:
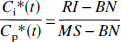
Here, the linearity of the response of the imaging plates (photostimulated luminescence/mm2) to the radioactivity (Bq/mL) was checked previously in the cases of BN, MS, and MS − BN (Fig. 1B). In all three, regression lines passing close to the original points could be fitted, with all the data presented here within the linear range, respectively. In addition, by comparing the slope of the respective regression lines, if within this linear range, it was suggested that an approximate relation of BN = 0.8 × MS could be established. In fact, instead of setting up the slice phantom in all of the experiments to calculate BN of Eq. 3, we routinely substituted 0.8 × MS for BN and calculated Ci*(t)/Cp*(t).
The real radioactivity signal of MS − BN decreased exponentially as time passed from the start of incubation, whereas when decay corrected, it showed an almost constant signal throughout the whole time course (Fig. 1C). Thus, Ci*(t)/Cp*(t) (vertical Y axis) at each time point calculated above was plotted against ∫ t 0Cp*(τ)dτ/Cp*(t) (horizontal X axis), indicating the time (minutes) from the start of incubation based on the Patlak graphical method (as the mean value of eight slices). Time zero (t = 0) is when [18F]FDG was introduced into the bathing medium containing brain slices. As shown in Fig. 2A, for instance, Ci*(t)/Cp*(t) within the initial part (from 0 to 50 minutes) of each plot did not show a linear relationship with time, indicating nonsteady condition between the incubation medium and the slices. After that, the Ci*(t)/Cp*(t) of the unloaded control showed a linear relationship with time (linear regression coefficient r > 0.98, from 60 to 320 minutes), indicating the constant glucose utilization. When various perturbations were introduced into the bathing medium, it took 10 to 20 minutes before reaching a new equilibrium state, with this temporary phase manifested as a transient curve. To evaluate the dynamic changes in the net influx constant of [18F]FDG from hypoxia/pseudoischemia preloading until the reoxygenated/pseudoreperfused postloading phase, the slope (K) was calculated from a linear portion of the Patlak plot under each equilibrium state in the pre- and postloading phases using the linear regression analysis.

Influence on the Patlak plots of [18F]2-fluoro-2-deoxy-D-glucose uptake in the hippocampus of reoxygenation/pseudoreperfusion after various durations of hypoxia/pseudoischemia.
LC and Cp stability analysis
In the present experiment, for K itself to be considered as an index of CMRglc according to Eq. 1, proof of the hypothesis that LC and Cp are constant is required. According to Newman et al. (1988), when FDG and glucose volume of distribution are considered Vd* and Vd, respectively, and LC is proportional to Vd*/Vd, then the following equation is obtained: Vd*/Vd = (Ce*/Cp*)/(Ce/Cp). Here, Ce*/Cp* is the value of the ratio of [18F]FDG radioactivity in the slices and medium and Ce/Cp the ratio of the glucose concentration in the slices and medium (Newman et al., 1988). Then, by adding to the medium [14C]glucose (0.3 μCi/mL) and [18F]FDG (8.7 μCi/mL) and conducting a double-tracer uptake experiment using these two agents, we investigated the presence/absence of changes in Vd*/Vd, which shows a proportional relation to LC before and after subjecting rat brain slices to various durations of hypoxia/pseudoischemia or before and after administering neuroprotective drugs in addition to hypoxia (20 minutes)/pseudoischemia (50 minutes) loading. The conditions concerning the duration of hypoxia/pseudoischemia loading, the administration of neuroprotective drugs, etc., were set according to the experimental protocol for studying CMRglc using dPAT. The [14C]glucose radioactivity of the samples from the medium was measured concomitantly to evaluate the changes in the medium glucose concentration (Cp).
Samples from the medium were prepared using 100 μL of incubation solution from the chamber. Samples were prepared from the medium 100 minutes after the start of the experiment (prehypoxia/pseudoischemia loading), 100 minutes after the termination of various durations of hypoxia/pseudoischemia, and 100 minutes after the termination of hypoxia (20 minutes)/pseudoischemia (50 minutes) loading and simultaneous drug treatment. Samples from the slices were prepared according to the method of Newman et al. (1988) as outlined below. Slices were removed from the chamber, rinsed in 7 mL of well-gassed Krebs-Ringer solution at 36°C for 5 seconds, and freeze-clamped in liquid N2 after excess buffer was removed with a fine camel-hair brush. Total time from chamber to freezing averaged 20 seconds. The frozen slices were homogenized in 0.6 mol/L perchloric acid totaling 200 μL and centrifuged at 12,000 g for 15 minutes. The supernatant after buffering with 48 mL of 3 mol/L KOH was centrifuged at 15,000 g for 15 minutes, and the obtained supernatant was used as the sample. Like the samples from the medium, the samples from the slices were prepared 100 minutes after the start of the experiment (prehypoxia/pseudoischemia loading), 100 minutes after the termination of various durations of hypoxia/pseudoischemia, and 100 minutes after the termination of hypoxia (20 minutes)/pseudoischemia (50 minutes) loading and simultaneous drug treatment.
Metabolite analysis of [14C] glucose and [18F]FDG was performed by thin-layer chromatography (TLC) on Whatman LK6DF silica gel plates (Clifton, NJ, U.S.A.) with a solvent system of acetonitrile/water (95:5). Each sample was subjected to metabolite analysis with TLC and separated into [14C]glucose and [18F]FDG (Waki et al., 1998). Immediately after completion of this step, the TLC plates were exposed to the imaging plate for 1 hour (first exposure: detection of 18F). After 18F was completely attenuated (after 2 days), the TLC plates were again exposed to the imaging plate for 1 day (second exposure: detection of 14C). After the second exposure, measurements were again carried out under the same conditions as at the first detection of 18F, and it was confirmed that the first and second exposure results, respectively, showed the selective detection of 18F and 14C alone.
Experimental analysis
Data analysis was performed on a Macintosh computer, and the images were analyzed using MacBAS software version 2 (Fuji Photo Film Co.) developed for Macintosh computers. The presented values are shown as the mean ± SD of a total of eight slices from four rats obtained in two experiments. The Mann-Whitney U test was used to evaluate the significance of differences.
RESULTS
Influence of reoxygenation/pseudoreperfusion after hypoxia/pseudoischemia of various durations on net influx constant of [18F]FDG
Patlak plots in the hippocampus when reoxygenated after 10-, 20-, 30- or 50-minute hypoxia are shown in Fig. 2A. The graph indicates that the slope (K), reflecting the net influx constant of [18F]FDG, was drastically increased by hypoxia as compared with the unloaded control. This was thought to reflect enhanced glycolysis compensating for the decrease in aerobic metabolism when oxidative phosphorylation is inhibited at the respiratory chain by hypoxia loading. With hypoxia of 10-minute duration, the K value after reoxygenation returned to almost the preloading value. In contrast, with hypoxia lasting ≥20 minutes, the K value did not recover even after 2 hours, with irreversible neuronal damage thought to have been induced. Similar results were obtained in each of the five brain regions examined (Table 1).
Influence of reoxygenation/pseudo-reperfusion after various durations of hypoxia/pseudo-ischemia on the net influx constant of [18F]FDG
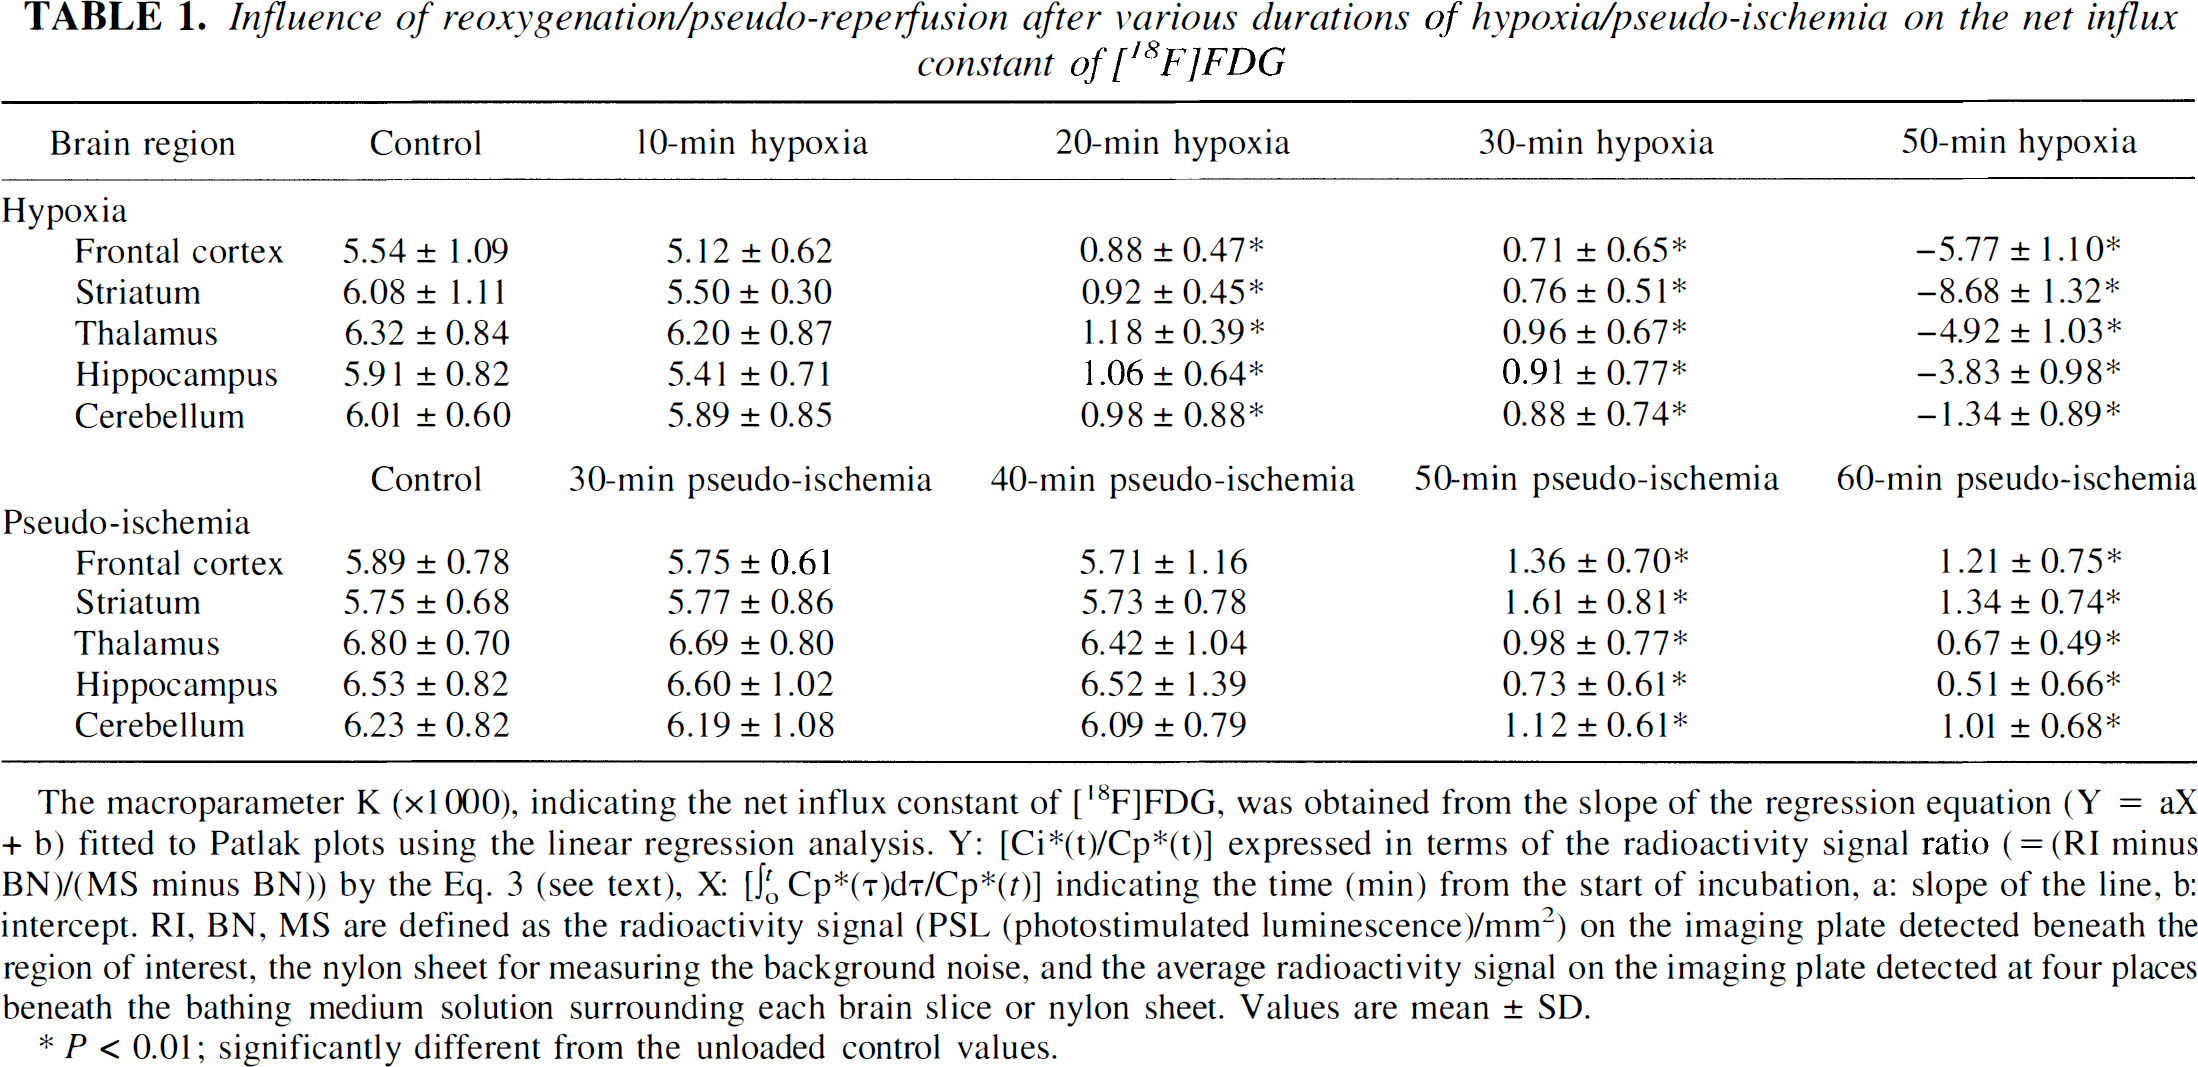
The macroparameter K (x 1000), indicating the net influx constant of [18F]FDG, was obtained from the slope of the regression equation (Y = aX + b) fitted to Patlak plots using the linear regression analysis. Y: [Ci* (t)/Cp*(t)] expressed in terms of the radioactivity signal ratio (= (RI minus BN)/(MS minus BN)) by the Eq. 3 (see text), X: [∫0 t Cp*(τ)dτ/Cp*(t)] indicating the time (min) from the start of incubation, a: slope of the line, b: intercept. RI, BN, MS are defined as the radioactivity signal (PSL (photostimulated luminescence)/mm2) on the imaging plate detected beneath the region of interest, the nylon sheet for measuring the background noise, and the average radioactivity signal on the imaging plate detected at four places beneath the bathing medium solution surrounding each brain slice or nylon sheet. Values are mean ± SD.
P < 0.01; significantly different from the unloaded control values.
Patlak plots in the hippocampus when pseudoreperfused after 30-, 40-, 50- or 60-minute pseudoischemia are shown in Fig. 2B. With pseudoischemia lasting ≤40 minutes, the slope (K) after pseudoreperfusion returned to close to the preloading value. With pseudoischemia lasting ≥50 minutes, the K value did not recover even after 2 hours, with irreversible neuronal damage thought to have been induced. Similar results were obtained in each of the five brain regions examined (Table 1).
Neuroprotective effects of PBN or MK-801 against hypoxia/pseudoischemia loading
Whether or not the posthypoxia loading (from 30 minutes after reoxygenation) decrease in the net influx constant of [18F]FDG was prevented by the administration of PBN (1 mmol/L) or MK-801 (100 μmol/L) during 20-minute hypoxia loading and the 30-minute period immediately after reoxygenation was investigated. The Patlak plots in the hippocampus indicated that both agents exerted a similar protective effect against the decline in the postloading slope (K) (Fig. 3A). Similar results were obtained in each of the five brain regions examined (Table 2).
Influence of administration of PBN or MK-801 against hypoxia/pseudo-ischemia loading on the net influx constant of [18F]FDG
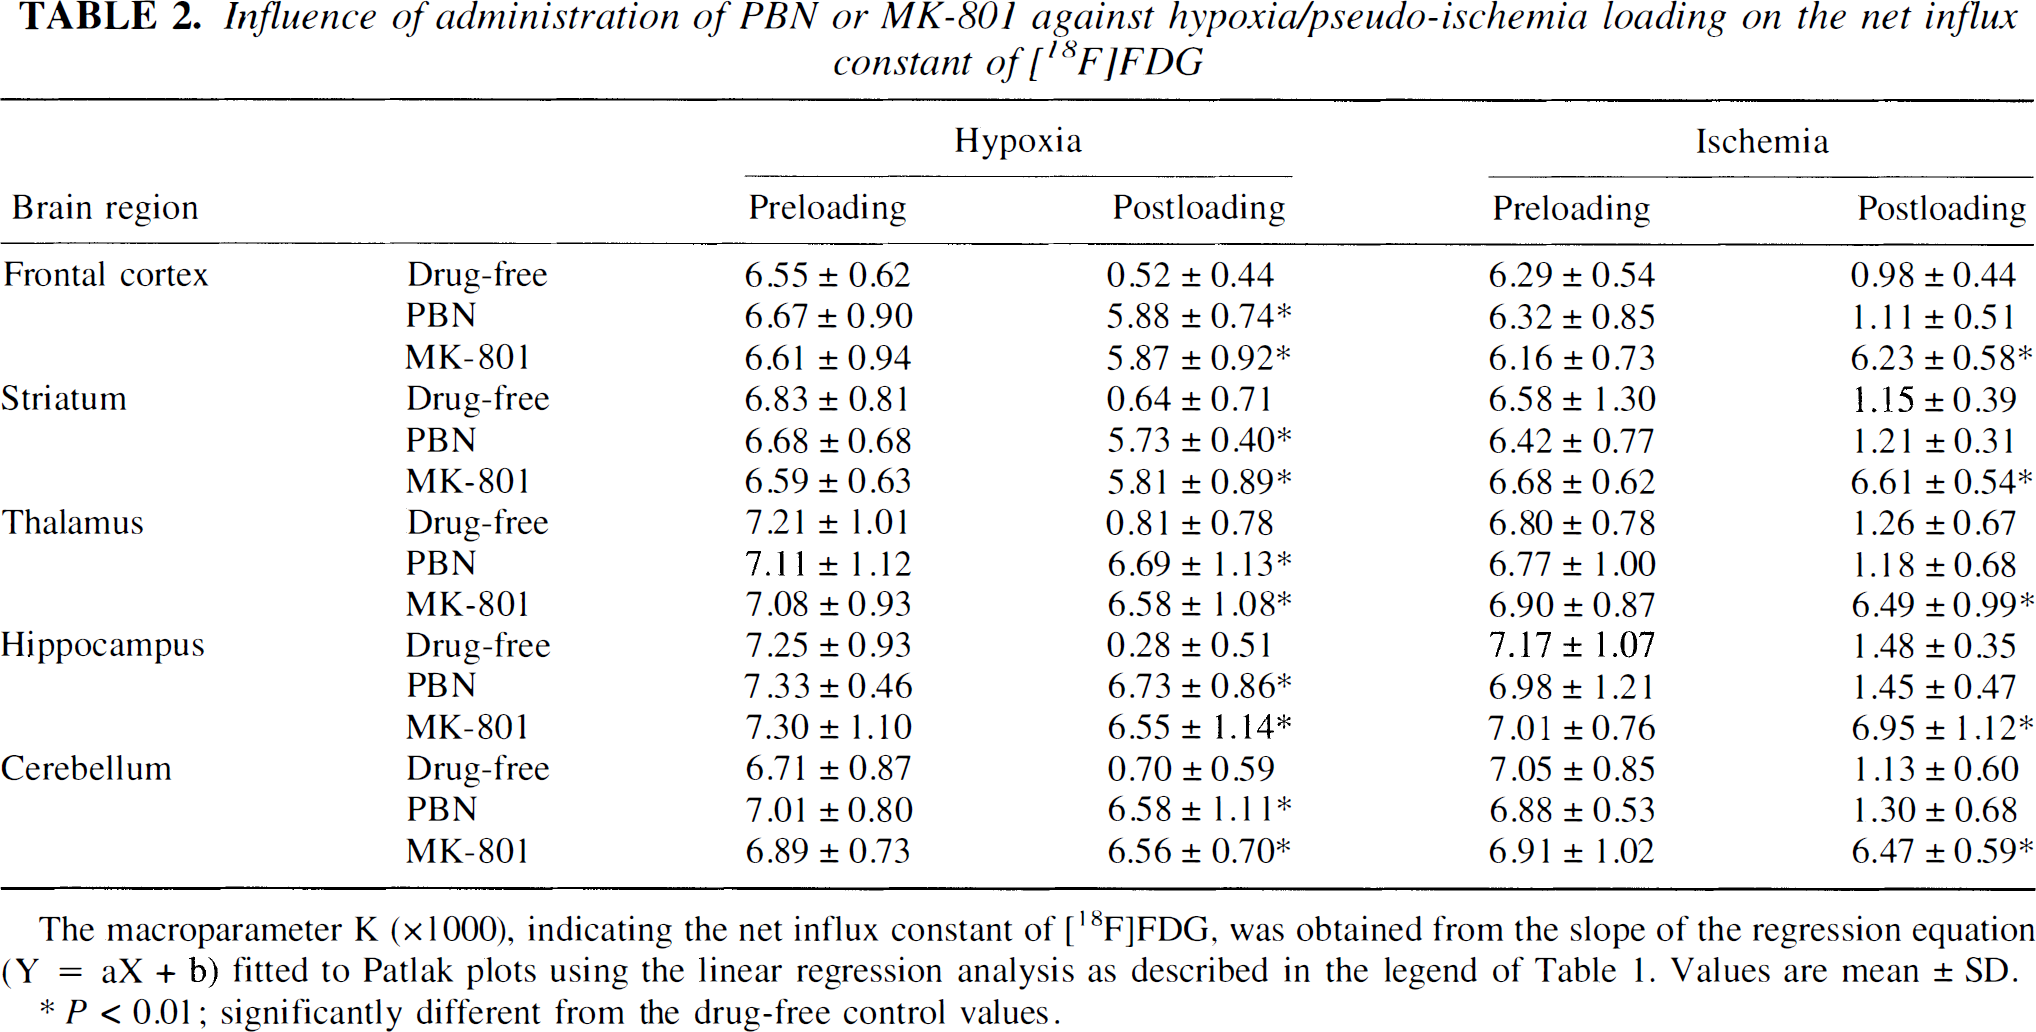
The macroparameter K (×1000), indicating the net influx constant of [18F]FDG, was obtained from the slope of the regression equation (Y = aX + b) fitted to Patlak plots using the linear regression analysis as described in the legend of Table 1. Values are mean ± SD.
P < 0.01: significantly different from the drug-free control values.
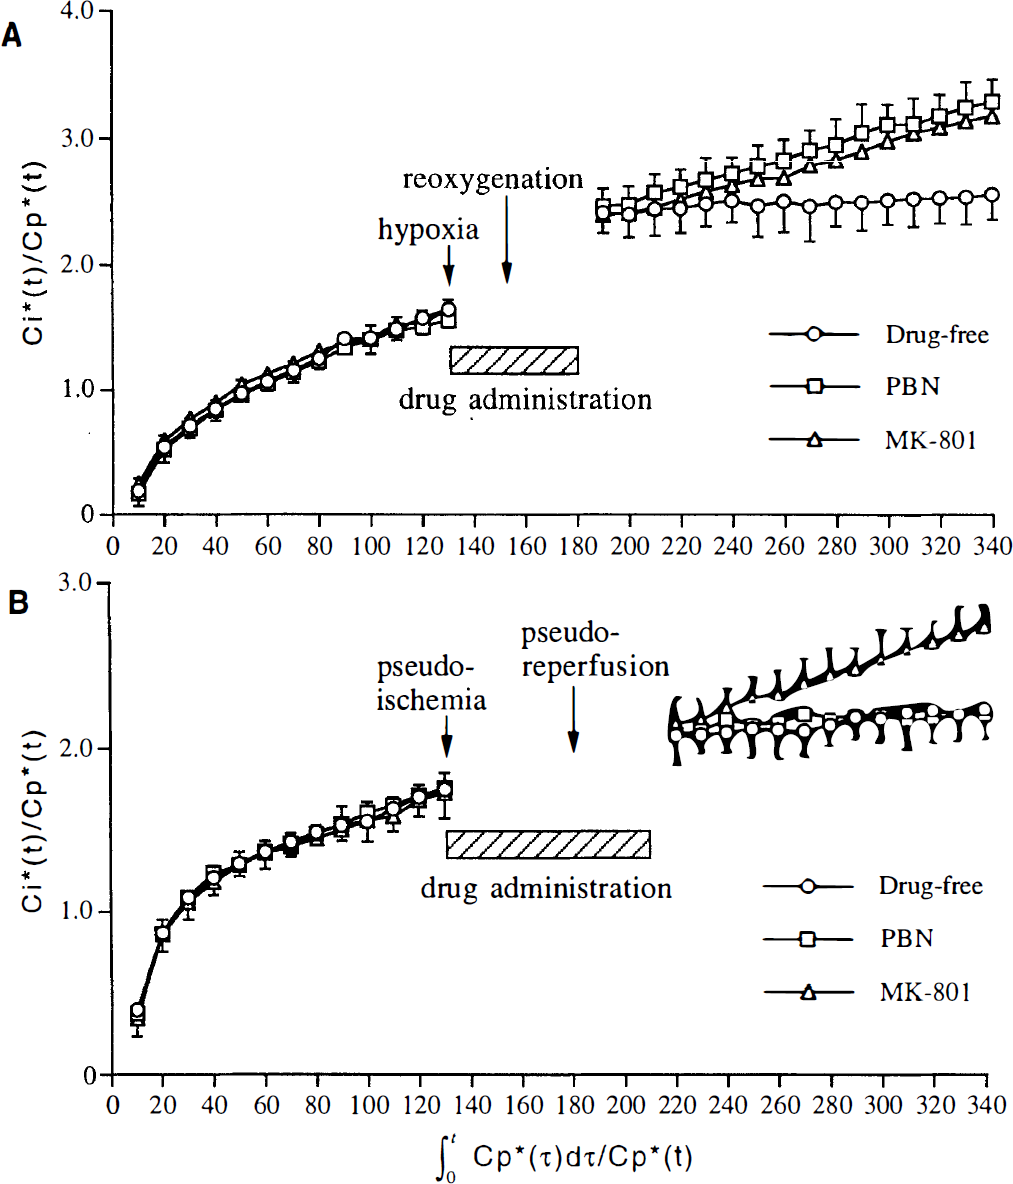
Influence of administration of α-phenyl-N-tert-butyl-nitrone (PBN) or MK-801 during hypoxia/pseudoischemia loading and the 30-minute period immediately after reoxygenation/pseudoreperfusion on the Patlak plots in the hippocampus: drug-free, PBN, and MK-801.
Whether the postpseudoischemia loading (from 30 minutes after pseudoreperfusion) decrease in the net influx constant of [18F]FDG was prevented by the administration of PBN (1 mmol/L) or MK-801 (100 μmol/L) during 50-minute pseudoischemia loading and the 30-minute period immediately after pseudoreperfusion was investigated. The Patlak plots in the hippocampus indicated that MK-801 protected against the decline in the postloading slope (K), whereas PBN did not (Fig. 3B). Similar results were obtained in each of the five brain regions examined (Table 2).
LC and Cp stability analysis
Ce*/Cp* and Ce/Cp were calculated by quantifying the TLC images, and when Vd*/Vd, which shows a proportional relation with LC, was calculated, no significant changes were noted before and after various durations of hypoxia/pseudoischemia loading or before and after the administration of neuroprotective drugs in addition to hypoxia (20 minutes)/pseudoischemia (50 minutes) loading (Tables 3 and 4). Also, the [14C]glucose radioactivity of the samples from the medium did not differ significantly before and after the start of the experiment (data not shown), suggesting that the medium glucose concentration (Cp) remained constant. Accordingly, these results confirmed that there were no changes in LC or Cp in Eq. 1 and that CMRglc is proportional to K.
Vd*/Vd values before and after various durations of hypoxia/pseudo-ischemia
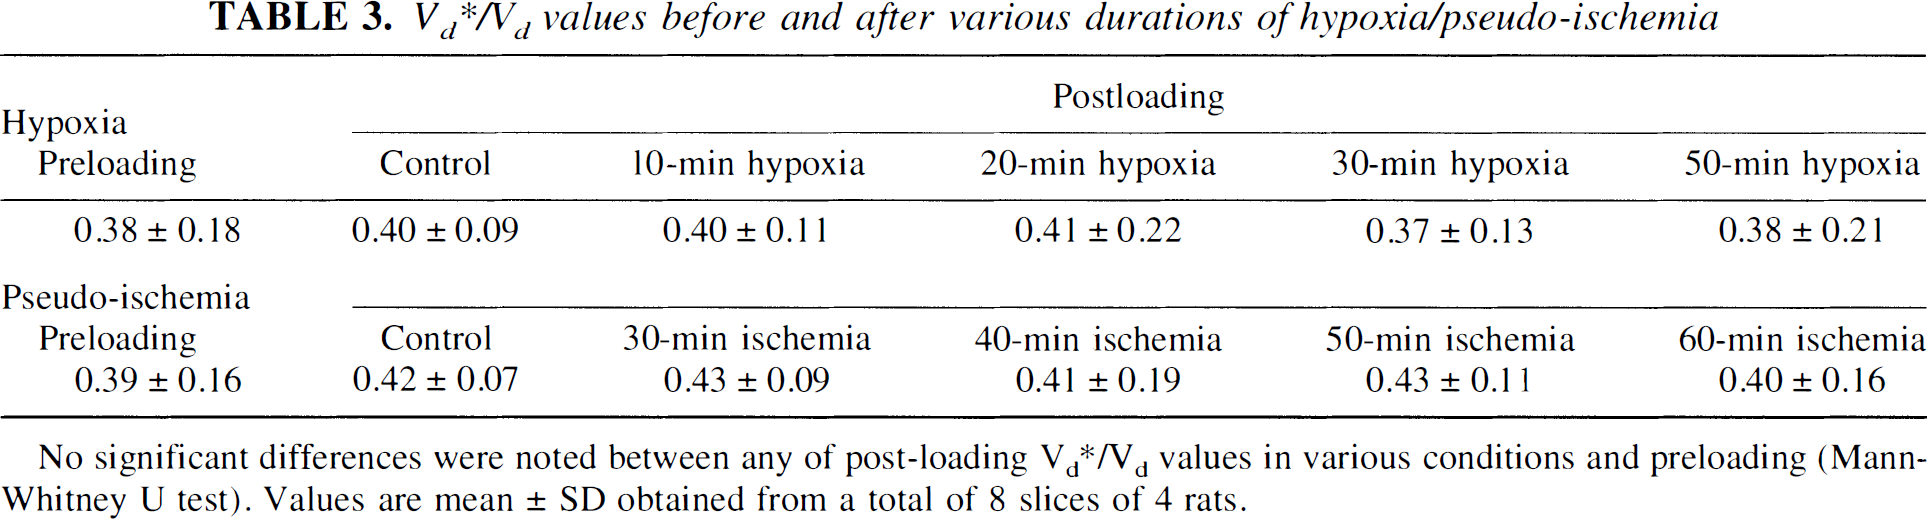
No significant differences were noted between any of post-loading Vd*/Vd values in various conditions and preloading (Mann-Whitney U test). Values are mean ± SD obtained from a total of 8 slices of 4 rats.
Vd*/Vd values before and after administration of PBN or MK-801 added to hypoxia (20 min)/pseudo-ischemia (50 min) loading
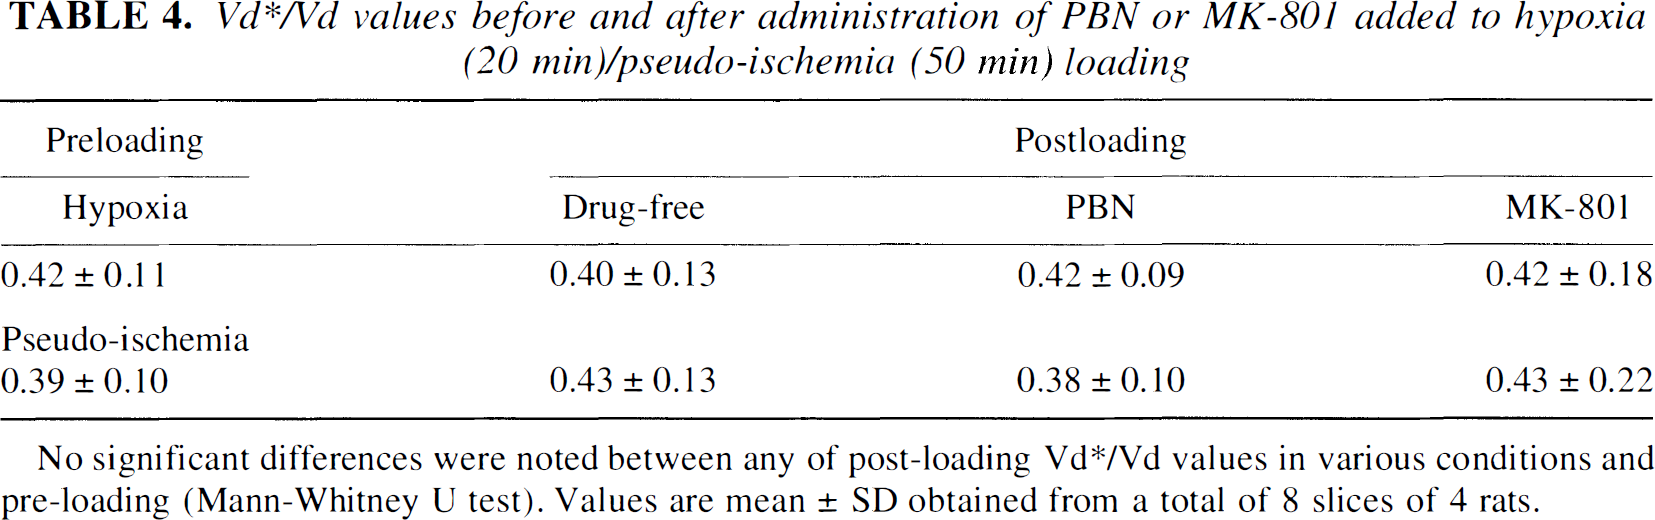
No significant differences were noted between any of post-loading Vd*/Vd values in various conditions and pre-loading (Mann-Whitney U test). Values are mean ± SD obtained from a total of 8 slices of 4 rats.
DISCUSSION
The image data obtained with dPAT in the present study were quantitatively analyzed based on the Patlak graphical method (Patlak et al., 1983), with the slope of the linear portion of the graph (K) indicating the net influx constant of [18F]FDG. Serial assessments of K can be considered as an index of CMRglc according to Eq. 1, assuming that LC and Cp do not change during a given intervention such as hypoxia/pseudoischemia or neuroprotective chemical loading. In fact, in our basic study, it was confirmed that neither LC nor Cp showed changes during the experiment. We considered brain slices exclusively from the aspect of metabolism, with the maintenance of a constant CMRglc used as an index of viability. After the initial part under nonsteady condition, the Ci*(t)/Cp*(t) under unloaded normal condition showed a linear relationship with time (from 60 to 320 to 340 minutes), indicating the constant CMRglc during this time course.
It has been claimed by numerous investigations that ischemia is more neurotoxic than hypoxia (Goldberg and Choi, 1993; Pringle et al., 1997). However, in the present study, the net influx constant of [18F]FDG after reoxygenation/pseudoreperfusion following loading with hypoxia/pseudoischemia of various durations was markedly inhibited with hypoxia lasting ≥20 minutes, whereas with pseudoischemia of ≤40 minutes, approximately the same level as the unloaded control was maintained. These results therefore indicate that hypoxia may induce irreversible neuronal damage within a shorter period than ischemia. Previously, Newell et al. (1995) also reported that the presence of glucose in hypoxia facilitates different mechanisms of neuronal damage and that glucose may exert a more deleterious effect on the neuron in the presence of hypoxia. DNA degeneration has been reported to occur in neurons subjected to oxygen deprivation but not to combined oxygen and glucose deprivation (Copin et al., 1996).
α-Phenyl-N-tert-butylnitrone is one of the most widely used spin trapping agents for the detection of reactive free radicals (Cao and Phillis, 1994). In the present study, the administration of PBN exerted a protective effect on the posthypoxia loading decrease in the net influx constant of [18F]FDG, whereas postpseudoischemia loading was ineffective. These results implicate free radicals in the neurotoxicity of hypoxia but not in that of pseudoischemia. Mitochondria use nicotinamide adenine dinucleotide as electron providers, with these electrons eventually transferred to O2 and ATP synthesized by the production of H2O (Coyle and Puttfarcken, 1993). As glucose is not present at the time of pseudoischemia loading, glycolysis does not occur. However, at the time of hypoxic loading, glycolysis is enhanced (Rego et al., 1996), and the electron provider nicotinamide adenine dinucleotide is produced in association with glycolysis. It then enters the mitochondrial electron transport chain, but because of the lack of O2, the electrons cannot be transferred to O2 and so accumulate in the mitochondria and leak from them. These electrons react with the O2 provided at the time of reoxygenation to form free radicals (Schreiber et al., 1995). This difference between the two is thought to be possibly due to the selective contribution of free radicals to the hypoxic neurotoxicity in this study. The neuroprotective effects of PBN and other radical scavengers such as superoxide dismutase/catalase against hypoxia-induced neuronal damage have also previously been described (Newell et al., 1995; Copin et al., 1996; Horáková et al., 1997), strongly implicating free radicals in hypoxic neurodegeneration. However, the effect of PBN against ischemia has been variously reported to be protective by some investigators (Cao and Phillis, 1994; Barth et al., 1996) and as showing little effectiveness by others (Pahlmark and Siesjö, 1996), with this latter view being supported by the present study.
When mitochondria are injured by hypoxia/ischemia (Gilland et al., 1998), ATP synthesis is inhibited (Stacpoole, 1997), with a state of energy insufficiency induced and glutamate release promoted (Siesjö, 1992). Synaptic glutamate acting at NMDA receptors mediates several physiological processes like synaptic transmission, neuronal development, long-term potentiation, and excitotoxic neuronal death (Prehn, 1998). Toxic activation of excitotoxic neurotransmitter receptors by glutamate is thought to play a critical role in a number of brain injuries including cerebral ischemia (Vornov et al., 1995) and hypoxia (Katchman and Hershkowitz, 1993). In the present study, the administration of MK-801 showed a protective effect on both the posthypoxia loading and postpseudoischemia loading decrease in the net influx constant of [18F]FDG. These findings suggest that glutamate is involved in the neuronal damage induced by both hypoxia and pseudoischemia and that definite neuroprotection can be achieved using an NMDA antagonist. Previous reports have also documented the protective effect of MK-801 against hypoxia-induced neuronal damage (Schulz et al., 1995) and the efficacy of MK-801 against cerebral ischemia (Barth et al., 1996; Pringle et al., 1997).
As described above, the discordant pattern noted in the protective effect of PBN and MK-801 suggests that the mechanisms of neuronal damage induced by hypoxia and pseudoischemia differ. Namely, MK-801 alone is protective against pseudoischemia-induced neurotoxicity, suggesting the selective involvement of glutamate in this condition. In contrast, in the case of hypoxia-induced neurotoxicity, either PBN or MK-801 alone provides adequate protection, suggesting that free radicals and glutamate in tandem provoke neuronal damage. Katchman and Hershkowitz (1993) claimed that NMDA receptor activation induced by glutamate release leads to the production of free radicals, thereby accelerating neuronal damage. On the other hand, oxygen radicals can enhance the release of glutamate and inhibit its reuptake and inactivation (Pellegrini-Giampietro et al., 1990) and furthermore enhance the toxicity of glutamate (Potter et al., 1991). This cooperative relation between free radical formation and glutamate release is thought to be involved in the generation and propagation of hypoxic/ischemic neuronal death. So far, principally with regard to ischemic neurotoxicity, a vicious cycle hypothesis has been proposed (Pellegrini-Giampietro et al., 1990; Barth et al., 1996). However, the present results suggest that this vicious cycle is more pronounced with hypoxia than with ischemia. As the mechanism underlying hypoxia/ischemia-induced neuronal damage, the glutamate excitotoxicity hypothesis (Benveniste et al., 1984; Simon et al., 1984), according to which energy insufficiency first develops, leading to enhanced glutamate release, followed by neuronal cell death, is well known. As in the case of pseudoischemia-induced neuronal damage, the involvement of free radicals is minor despite the contribution of glutamate, and a vicious cycle between the two is not formed. In the case of hypoxia, though, the degree of energy insufficiency is not as marked as that with ischemia (Rego et al., 1996), with the glutamate release thereby induced also thought to be less than that in pseudoischemia. However, in hypoxia, large quantities of free radicals are produced in mitochondria and glutamate release is enhanced. Moreover, these two form a vicious cycle, increasingly activating each other along a common path, which is thought to be responsible for the induction of irreversible neuronal damage within a shorter period than pseudoischemia.
In summary, this study demonstrated that serial quantitative evaluation of CMRglc using dPAT is useful for investigating the brain tissue injury associated with hypoxia/reoxygenation or ischemia/reperfusion as well as clarifying the underlying mechanisms and protective effect of various drugs against such injury.