
Abstract
Repetitive collapse of the upper airway during obstructive sleep apnea/hypopnea (OSA) exposes the brain of sufferers to frequent, transient, hypoxic episodes. The loss of cerebrovascular reactivity in sleep, and particularly in OSA, means that physiologic compensatory mechanisms may not ensure adequate brain oxygen levels. This 31P magnetic resonance spectroscopy study, of 13 males with severe, untreated OSA undertaken after overnight sleep deprivation, represents the first, seconds time-scale analysis of human brain bioenergetics during transient hypoxia and demonstrates that a moderate degree of oxygen desaturation during sleep has significant effects on brain bioenergetic status. Oxygen desaturation >10% of sleeping baseline resulted in decreases in brain adenosine triphosphate levels (P < 0.01), and increases in inorganic phosphate (P < 0.0001) with no concomitant changes in phosphocreatine or brain pH. This indicates that the mechanism of adenosine triphosphate depletion in these patients is different to that observed in normoxic, awake working brain. These data show that the buffering capacity of phosphocreatine and the creatine kinase system is not active in mild transient hypoxia and that cerebrovascular compensatory mechanisms are not adequate to prevent decrements in brain high-energy phosphates in OSA. Transient hypoxia experienced during sleep may impair brain function more than previously thought.
Introduction
Obstructive sleep apnea/hypopnea (OSA) is characterized by repetitive asphyxia and sleep fragmentation, leading to neurocognitive decrements, vascular disease, and reduced survival (Marshall et al, 2008). Obstructive sleep apnea/hypopnea patients experience repeated episodes of hypoxia, followed by normoxia, which resemble ischemia/reperfusion events (Suzuki et al, 2006).
Breath holding events in awake, healthy subjects elicit mechanisms to maintain cerebral perfusion by increased compensatory cerebrovascular reactivity, including increased cerebral blood flow and volume, although deoxygenation still occurs (Palada et al, 2007). Reduced awake cerebrovascular reactivity is present in OSA (Placidi et al, 1998; Urbano et al, 2008), but some loss of this parameter has also been reported in non-OSA subjects during sleep (Meadows et al, 2003) with lower reactivity also reported in the early morning (Ainslie et al, 2007). Decreased levels of oxyhemoglobin, raised intracranial pressure and decreased tissue oxygenation without an adequate compensating increase in cerebral blood volume (Balfors and Franklin, 1994; Olopade et al, 2007) have been recorded during obstructive apnea. Adults and children with OSA show deficits in a range of neurocognitive tests including impaired executive function and vigilance and increased depression and anxiety (El-Ad and Lavie, 2005). Obstructive sleep apnea/hypopnea is also associated with brain structural changes indicative of axonal injury (Macey et al, 2008). Studies in animals exposed to intermittent hypoxia show a range of deleterious effects in the cortex and other brain regions that may be modified by genetic factors and neuroprotective agents (Row, 2007).
The brain is an obligate aerobic organ, with high metabolic demand and no oxygen storage capacity. It is therefore highly sensitive to restrictions in its oxygen supply, and hence to hypoxic or ischemic insults. Information about the effect of hypoxia on energetics in the human brain is largely limited to data obtained after stroke, myocardial infarction, or cerebral hemorrhage in adults, or birth asphyxia in infants and it has been obtained on a relatively long (≥ 30 mins) time scale. There are little data available on the effect of transient or intermittent (mild, nontraumatic) hypoxia on cerebral energy levels in humans, and little data available on acute (time scale of seconds) responses to hypoxia. Such data are vital to accumulate because exposure to transient hypoxia (through snoring, diving, high-altitude flying by jet pilots) is common and occurs in crucial occupations. Existing data largely emanate from studies on high-altitude pilots and cosmonauts (Serebrovskaya, 2002) and suggest that even brief periods of intermittent hypoxia (a few minutes per day for only a few days) have effects such as increased ventilatory responses that last for many days or even weeks, and that changes in energy metabolism can be measured extremely early in hypoxia, before changes in oxygen consumption become apparent (Serebrovskaya, 2002). Long (minutes) time-scale studies in animal models of hypoxia have shown that 31P magnetic resonance spectroscopy (MRS) measures do not alter until oxygen levels reach a critical oxygen threshold (~40 mmHg) above which brain metabolism is not limited by oxygen supply (Allen et al, 1992; Rolett et al, 2002). Mild hypoxia in animal brains (20% to 40% reduction in pO2 on the time scale of minutes) has been reported to induce decreases in brain phosphocreatine (PCr) levels and decreased pH (Ben-Joseph et al, 1993; Cox et al, 1983) with further reductions in PCr and little change in adenosine triphosphate (ATP) levels on further decreasing oxygen levels (Cox et al, 1983). Decreased levels of oxyhemoglobin, raised intracranial pressure and decreased tissue oxygenation without an adequate compensating increase in cerebral blood volume (Balfors and Franklin, 1994; Olopade et al, 2007) have been recorded during obstructive apnea.
Given the characteristic pattern of recurrent hypoxia in OSA, we speculated whether such patients would have measurable changes in cerebral energetics during sleep using 31P MRS. Therefore, we investigated brain bioenergetic responses to the transient hypoxia induced by apneic episodes in deliberately sleep-deprived males with recently diagnosed, untreated, severe OSA.
Materials and methods
Subjects
Thirteen male subjects (mean age 48.8 years, range 30 to 61 years) with severe OSA previously diagnosed by polysomnography completed the study. Subjects' sleep was monitored for four nights before the study by actigraphy to assess sleep patterns to ensure > 6 h sleep per night before testing. Subjects abstained from alcohol and caffeine for 24 h before 31P MRS. Baseline questionnaire data included the Epworth Sleepiness Scale (Johns, 1991) and the Depression Anxiety Stress Scale (Lovibond and Lovibond, 1995). All subjects were then deprived of sleep to facilitate them falling asleep in the magnetic resonance imaging (MRI) scanner by constant monitoring from 21:00 h, and studied using 31P MRS at 7:00 h the following morning.
This study complied with Australian National Health and Medical Research Council guidelines on human research and was approved by institutional Human Research Ethics Committees. Informed consent was obtained from all participants.
Protocol
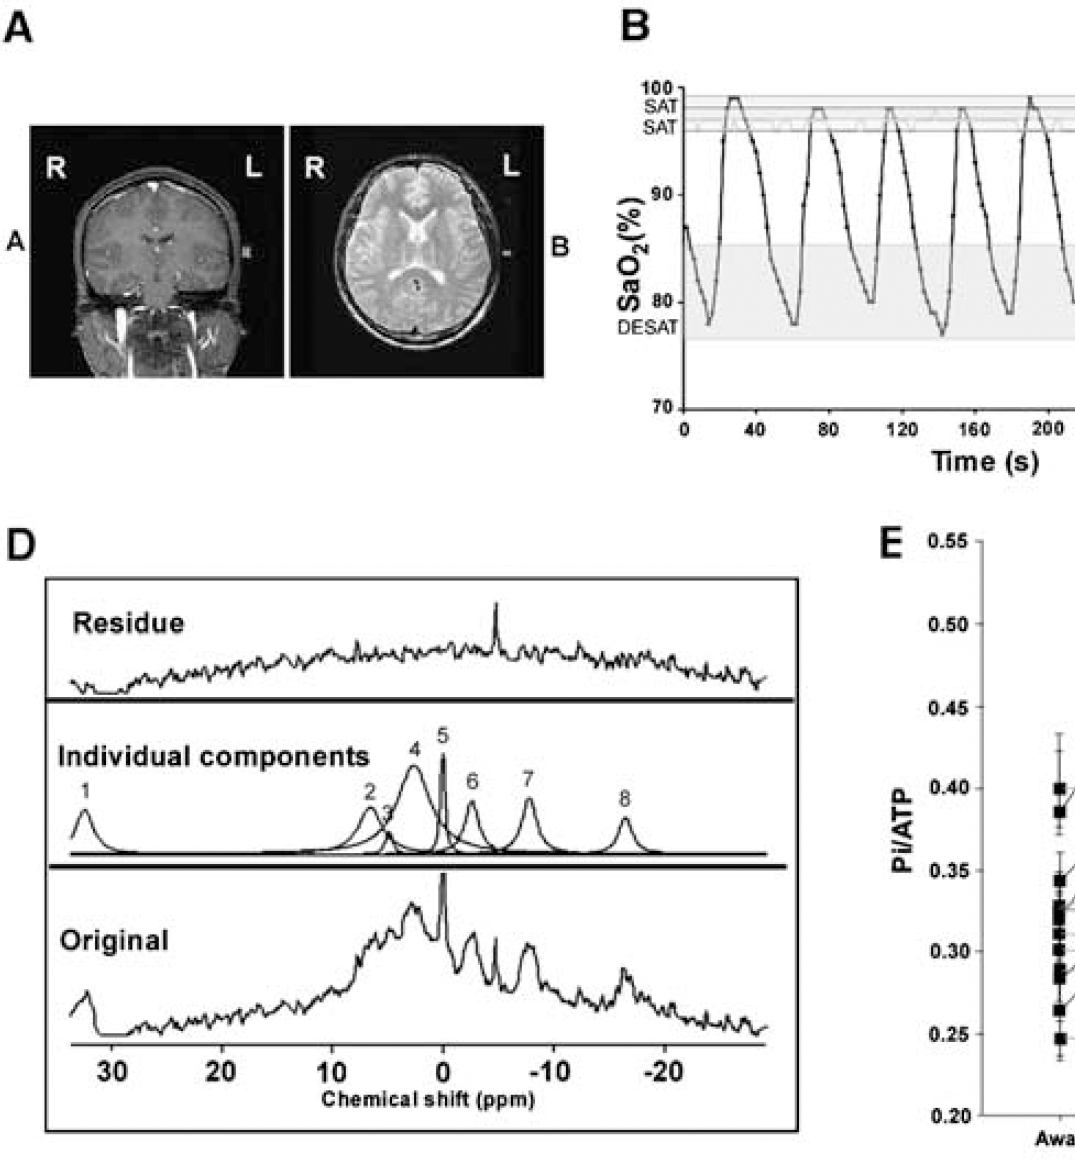
All spectra were acquired on a Philips (Best, The Netherlands) Intera 1.5 T scanner using a 10 cm 31P surface coil placed over the temporal lobe (Figure 1A). Scans were acquired using a simple pulse and collect sequence with an adiabatic pulse to deliver increased depth penetration and signal to noise. Phase cycling was not used and data collection was started after eight dummy scans for attaining steady state magnetization. Placement of the surface coil was checked by acquisition of an anatomic image to highlight the placement of the coil phantom relative to the patient and the coil shifted as required to ensure uniformity in coil placement across subjects. There was no significant contribution to the signal from muscle, as assessed by the PCr/ATP ratio, from the fact that the images showed little muscle in the area, and the length of the chosen pulse that would have been more depth selective for brain tissue rather than surface muscle. This method was selected over alternatives using gradient or additive localization techniques because of the lack of gradient noise, the ability to pick up signal from the surface of the cortex, and the good signal to noise (and hence time resolution) obtainable by this approach. The temporal lobe was chosen over the alternative placement position for the coil (occipital lobe) because it was more comfortable for the subject (their head was not resting on a hard radiofrequency (RF) coil. The area sampled by the coil represented mostly termporal lobe with some contributions from inferior frontal and lateral anterior parietal lobe. A pulse oximeter was taped to the subject's finger and average resting (awake) saturation level recorded.
(
Before the subject falling asleep eight spectra were collected representing the awake, saturated state. The subject was kept awake by keeping the room illumination bright, playing music, and talking to the subject. The spectra comprised the sum of 16 transients, collected across 1,024 data points with a duty cycle of 2 secs and no phase cycling. The room was then darkened, the music turned off, and the subject was allowed to fall asleep. Sleep onset was determined by lack of subject responsiveness, the presence of repetitive snoring, and small dips in SaO2. Spectra were then collected as a timecourse of 160 single scan spectra with one spectrum every 2 secs, corecorded with pulse oximetry data. Typically 10 full timecourses were acquired before the subject was removed from the magnet. The total scanning period did not exceed 70 mins. Of the 13 subjects, 5 desaturated in the magnet to levels >10% below their initial sleeping SaO2 (OSA-HYPOXIA) for > 10 secs, whereas 8 continued at levels of SaO2 <2% below initial sleeping SaO2 (OSA-non-HYPOXIA; see Figure 1B for typical SaO2 traces). Whether the subjects desaturated was related to their ability to fall asleep in the relatively uncomfortable environ of the magnet.
Analysis of Data
Spectra were divided into
Those obtained during the awake/alert period (AWAKE). These were processed as the sum of 16 transients. N = 8 spectra per subject.
Those spectra obtained during the sleeping period when SaO2 was within 2% of the subject's highest resting SaO2 (SAT). N = 4 to 5 spectra for the OSA-HYPOXIA group, N = 8 to 9 for the OSA-non-HYPOXIA group.
Those spectra obtained during the sleeping period when SaO2 was ≥ 10% below the subject's highest sleeping SaO2 (DESAT). The number of spectra available for each subject varied (N = 3 to 12).
These summed spectra compiled from the timecourse (2 or 3 above) were generally composed of the sum of at least 12 transients. A typical spectrum is shown in Figure 1C.
Spectra were processed using jMRUI (Version 2.1). Quantification of the reconstructed signals was performed in the time-domain. The AMARES algorithm was used to fit decaying sinusoids, corresponding to Lorentzian line-shapes in the frequency domain, to the resonances of phosphomonoesters (derived from phosphoethanolamine and phosphocholine), inorganic phosphate (Pi), PCr, and the γ, α, and β peaks of ATP and the coil phantom. All fits were unconstrained apart from that of Pi, which was constrained to a line-width of 14 Hz to curtail any tendency to include broad baseline components in the fit of this sinusoid. The first-order phase correction estimated by AMARES was set to zero, and the first 20 points of the free-induction decay (FID) weighted by multiplication with a quarter sine wave. Intracellular pH was also determined by jMRUI, using the frequency difference between Pi and PCr. Results were expressed as peak ratios, relative to total signal intensity and relative to the coil phantom. The β-ATP resonance was used for ATP estimation. An example of the fitting process is shown in Figure 1D.
The data were then analyzed to see whether the outcomes were associated with the subject's status as an OSA-HYPOXIA or OSA-non-HYPOXIA, or whether the outcomes varied depending on whether the subject was awake/alert or asleep. The statistical software package S-Plus Version 6.2 was used to analyze the data. Two-tailed tests with a significance level of 1% were used throughout. Linear mixed effects models were fitted to the outcomes of interest. These models are similar to repeated measures analysis of variance but permit different numbers of observations in each state for each patient. The patient identifier was considered as a random effect and desaturation status (i.e., whether the patient had significant desaturation events and hence whether the patient was defined as OSA-HYPOXIA or OSA-non-HYPOXIA) and state (DESAT or SAT) as fixed effects.
Results
There were no significant differences (Table 1) between OSA-HYPOXIA and OSA-non-HYPOXIA groups in scores on the Epworth Sleepiness Scale, Depression Anxiety Stress Scale, or body mass index, although broadly those who desaturated successfully in the magnet were less stressed, less depressed, and less anxious than those who did not. The OSA-HYPOXIA group was significantly older than the OSA-non-HYPOXIA group. There were no significant differences between the two groups on baseline actigraphy status or on polysomnography (Table 1) (Mann-Whitney U-test, α < 0.05).
Group metrics
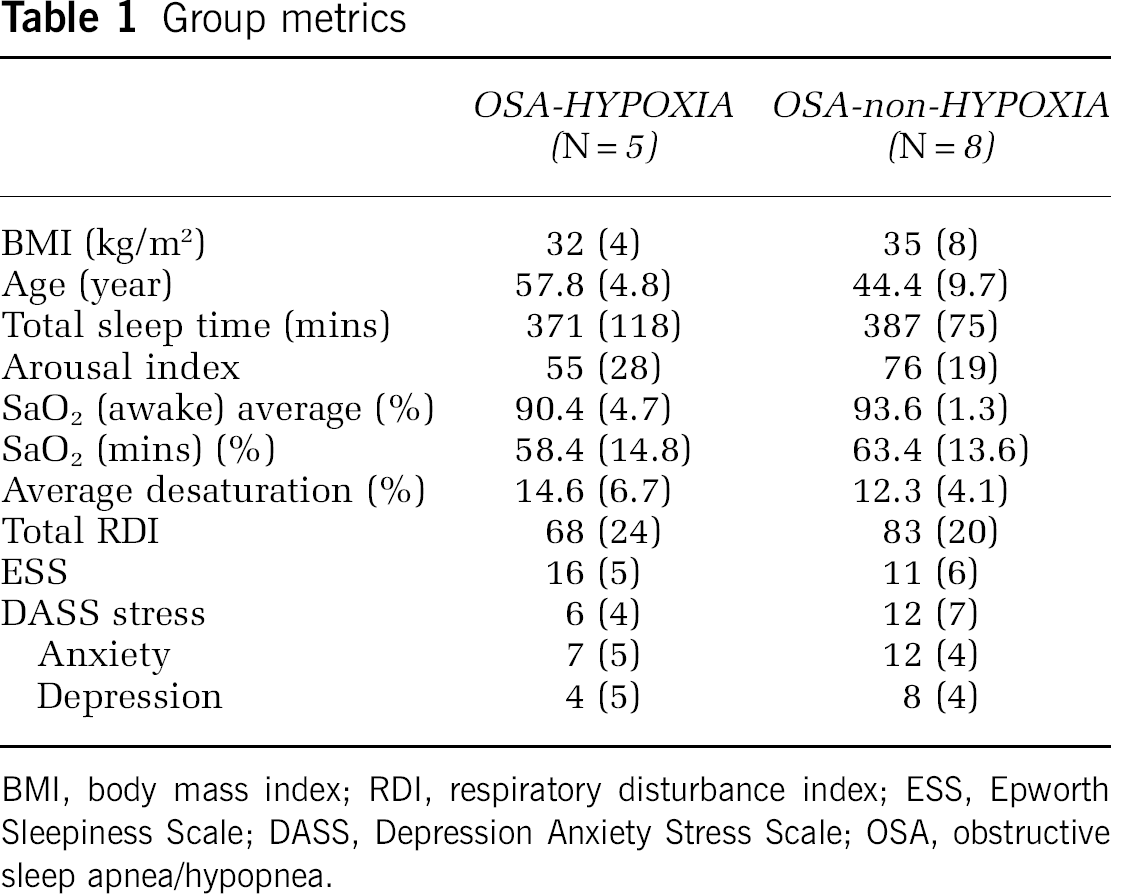
BMI, body mass index; RDI, respiratory disturbance index; ESS, Epworth Sleepiness Scale; DASS, Depression Anxiety Stress Scale; OSA, obstructive sleep apnea/hypopnea.
Group 31P ratios are shown in Table 2 (mean (s.d.)). Table 3 shows the outcomes of the statistical analyses of 31P MRS data. Adenosine triphosphate levels were decreased and Pi levels increased in subjects (Figures 1D and 1E) when desaturated > 10% compared with when asleep/saturated < 2% or when awake. There was no significant effect of transient 10% desaturation on levels of PCr or on brain pH, which are both markers of creatine kinase activity. There were no changes in any metabolite in spectra obtained when subjects were awake compared with when asleep but well saturated. There was no significant change in levels of phosphomono- or diesters, or in the signal arising from the coil phantom as a proportion of the total signal, indicating that the effect seen was not because of changes in signal relaxation time owing to the altered tissue oxygenation state although this has been reported to be minimal in hypoxia (Bandettini and Wong, 1997). The stability of these latter resonances (Table 2 and Table 3) also allows us to discount any changes arising on account of patient movement relative to the coil phantom.
Examples of 31P MRS metabolite ratios

Data are shown as averages (means) with standard deviations.
ATP, adenosine triphosphate; OSA, obstructive sleep apnea/hypopnea; Pi, inorganic phosphate; PCr, phosphocreatine; PME, phosphomonoesters; PDE, phosphodiester.
Shows the probabilities of a significant change in a metabolite ratio (α = 0.01) related to the hypothesis at the head of each column
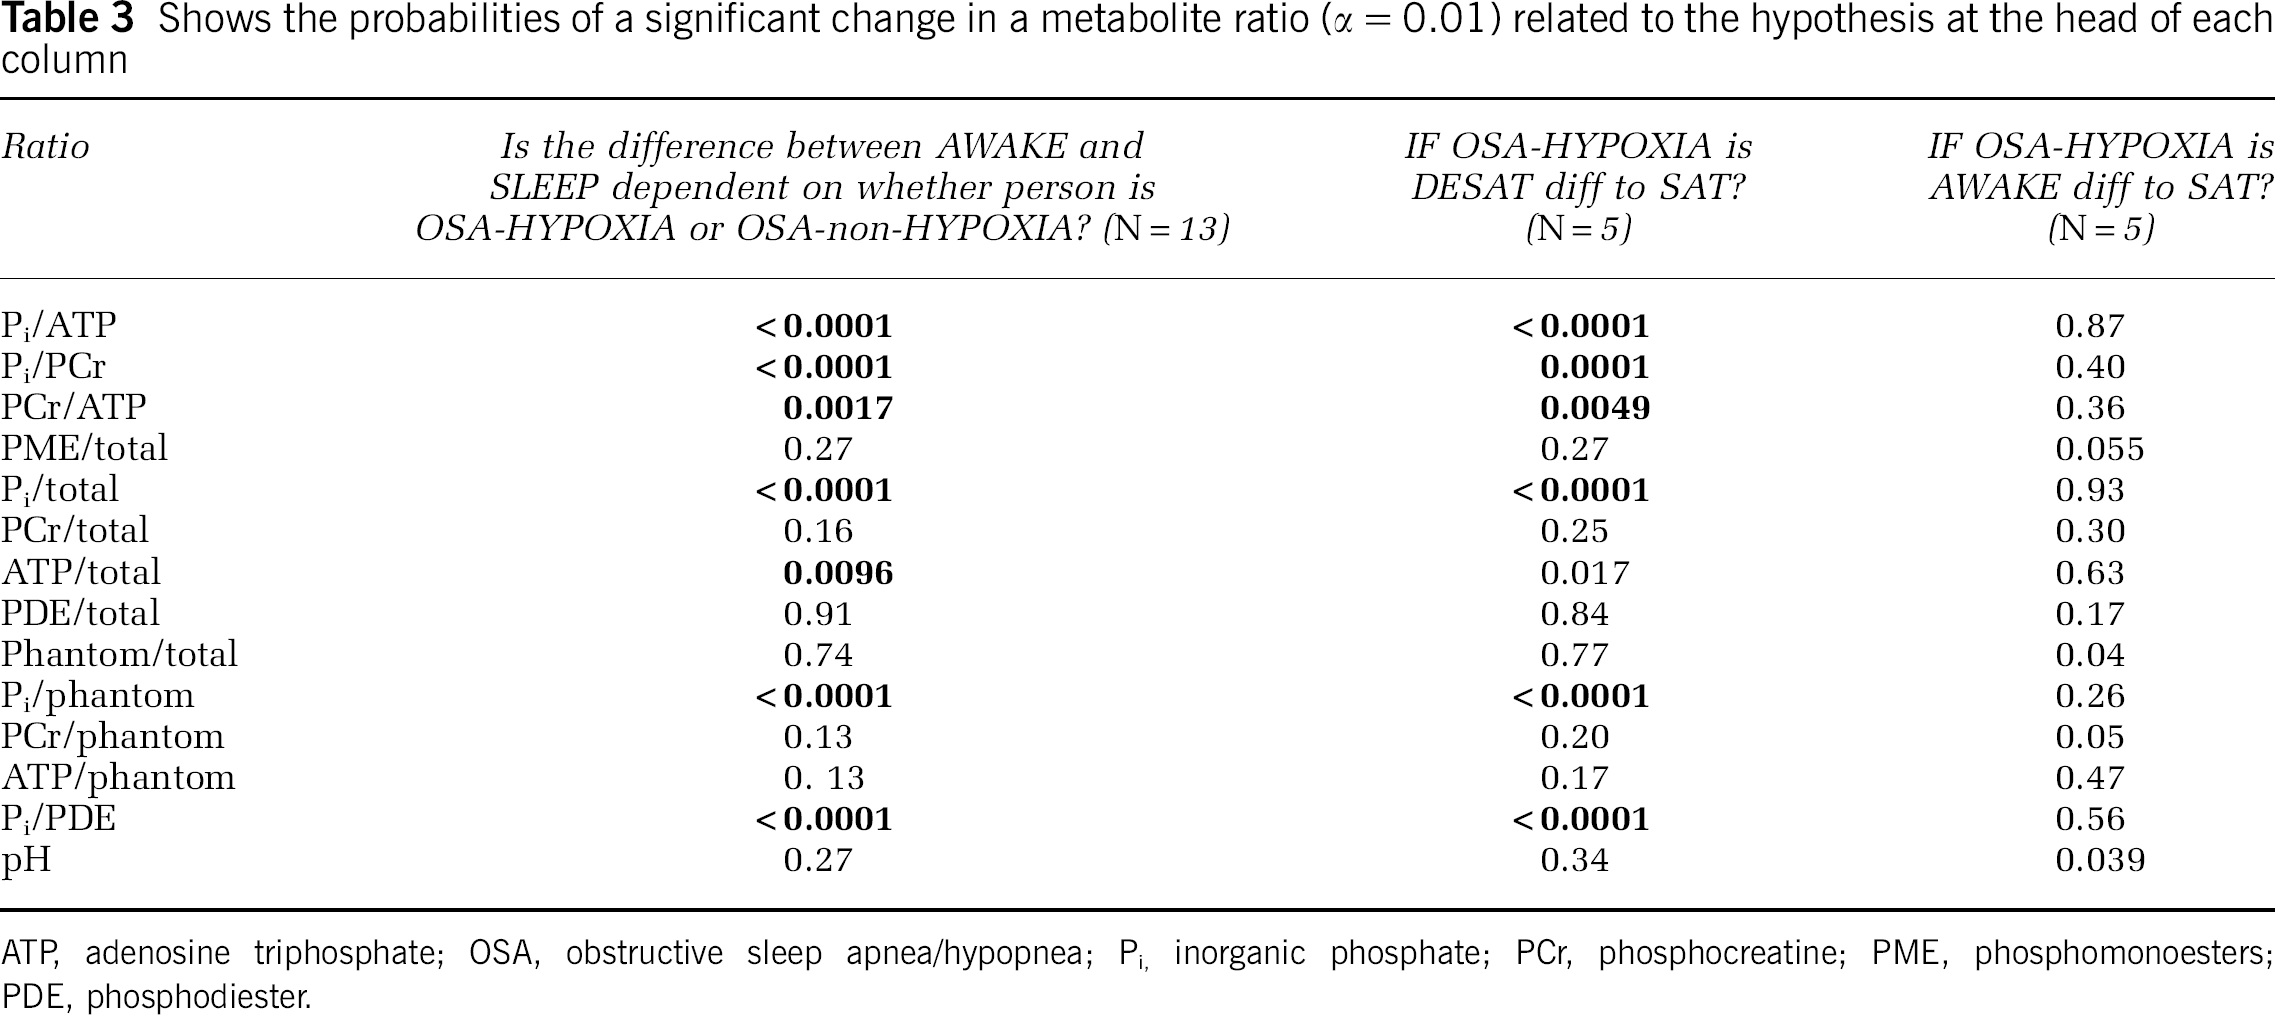
ATP, adenosine triphosphate; OSA, obstructive sleep apnea/hypopnea; Pi, inorganic phosphate; PCr, phosphocreatine; PME, phosphomonoesters; PDE, phosphodiester.
Discussion
This study represents the first seconds time-scale analysis of human brain bioenergetics during transient hypoxia and demonstrates that a moderate degree of oxygen desaturation has significant effects on brain bioenergetic status. Oxygen desaturation > 10% of sleeping baseline resulted in decreases in brain ATP levels, and significant increases in Pi with no concomitant changes in PCr or brain pH. This indicates that the mechanism of ATP depletion in these patients is different to that observed in normoxic, awake working brain. For example, in MRS photic stimulation studies of working brain, decreases are noted in PCr along with an increase in pH while ATP levels remain relatively constant (Kato et al, 1996; Rango et al, 1997; Sappey-Marinier et al, 1992). These latter changes have been suggested to arise from increased activity of the Na+/K+ ATPase, which is in turn linked to activity of cytosolic creatine kinase (Walliman et al, 1992). Under these circumstances, the ATP used is strongly buffered by PCr and is most likely not diffusion limited (Barros and Martinez, 2007). Indeed, it has been suggested that ATP is not at all diffusion limited in the cytosol, but may be in neural dendrites or where physical barriers exist. We speculate that in this study ATP levels are falling because of sudden cessation of ATP synthesis by hypoxic mitochondria, with these levels only inadequately (if at all) buffered by mitochondrial creatine kinase. Oxygen is the final electron acceptor in mitochondrial respiration, such that interruption of oxygen supply would in turn interrupt mitochondrial electron flow. Indeed there is some evidence that this is indeed the case, with studies showing dynamic alterations in cytochrome C oxidation status during apnea in OSA (McGown et al, 2003). Alterations to cytochrome C oxidase activity occur after hypoxia (Serebrovskaya, 2002) and the activity of this enzyme has also been shown to be sensitive to sleep status (Nikonova et al, 2005).
Taken together, these results suggest that the impact of OSA on high-energy metabolites is borne almost exclusively by brain mitochondria.
It is possible that the nuclear magnetic resonance visibility of the ATP and Pi is altered by hypoxia. Alterations in the mobility of small molecules (e.g., owing to binding to proteins) shorten their relaxation time and broaden their resonance line-width. There are earlier reports of periods of ischaemia resulting in decreased ATP visibility and increased Pi visibility (Humphrey and Garlick, 1991), which occurred on a 10 mins time scale in perfused heart. It is not known whether it occurs on the short (10 to 15 secs) time scale of hypoxaemia reported here. Whether the mechanism is because of binding of ATP or ATP depletion, the large changes in ATP signal are of interest, suggesting significant alterations in the dynamics of ATP (and Pi) in the hypoxemic brain.
Sleep was not formally assessed in the magnet in this study by electroencephalogram but the presence of lack of response to verbal stimuli, loud snoring, and oxygen desaturation were indicative of the presence of sleep. The number of patients who desaturated to > 10% from sleeping baseline was limited because of time and environmental constraints and though data were consistent, these results will need to be verified in other studies.
In this study, all subjects had severe OSA and were compared against their own baseline. Further studies will need to examine resting awake and asleep data in non-OSA subjects as well as more data in OSA to extend these preliminary findings. Moreover, assessing these results relative to the past research is complicated by lack of earlier comparative ‘control’ data. Cerebrovascular reactivity is significantly affected by sleep status in healthy subjects (Meadows et al, 2003, 2004) meaning that comparing these data with data from transient hypoxia studies in awake persons may be misleading. It is likely to be difficult to study transient hypoxia in during sleep in healthy controls because they are unlikely to sleep under conditions of forced hypoxia. Cerebrovascular reactivity and cerebral autoregulation are also different between healthy controls and those with OSA during the awake state (Placidi et al, 1998) with OSA patients being significantly impaired, even when awake. A healthy control group, such as trained breath-hold divers, has been also shown to have different (normal) cerebrovascular responses to hypoxia than those seen in OSA (Ivancev et al, 2007) indicating that breath holding healthy subjects capable of desaturating to the levels seen in OSA also may not be a suitable control population. We also used sleep deprivation to facilitate sleep onset (and thus, apnea and desaturation) in the magnet. Sleep deprivation is known to alter brain metabolism with 24 h sleep deprivation resulting in an 8% decrease in total brain metabolic rate with the temporal lobes showing a ~5% decrease relative to the baseline state (Thomas et al, 2000). There are few published studies of brain ATP/PCr changes with sleep deprivation, but a study using mental fatigue showed changes in the response of PCr and brain pH and not ATP (Kato et al, 1999). Therefore, it is unlikely that the findings in the desaturation group would be explained by sleep deprivation. However, we cannot exclude that sleep deprivation may interact with desaturation during sleep to produce the observed changes in brain bioenergetics.
Changes in brain 31P levels under transient hypoxia have not been examined earlier on this time scale although there is one recent study in occipital lobe of healthy controls undergoing mild transient hypoxia during wakefulness with a minimum of 5 mins spent in hypoxia (Vidyasagar and Kauppinen, 2008). This study showed no significant detrimental bioenergetic effects of mild (SaO2 range 0.83 to 0.95; euoxic PCr/γATP = 1.04 ± 0.38; hypoxic (SaO2 = 0.88) PCr/γATP = 1.03 ± 0.24). These data agreed with an earlier study in healthy humans, which also used inspired gas mixes to induce hypoxia and found no bioenergetic changes, again in the occipital lobe (Garde et al, 1995). Both studies of transient hypoxia during wakefulness concluded that increases in cerebral blood flow and volume were adequate to compensate for the reduced oxygen levels. Both of these studies used longer periods of hypoxia than those used in this study and examined a different brain region and may therefore not be directly comparable, but they do suggest that awake responses to hypoxia may be different to those seen in sleep.
Patients with OSA are typically exposed to many years of intermittent transient hypoxemia during sleep. The possibility exists that the mechanism we have seen in this study may represent a response to ‘ischaemic preconditioning’ (Dirnagl and Meisel, 2008). Preexposure of brain mitochondria to hypoxia has been shown to induce changes in channel opening properties, such that subsequent ischemic exposure results in increased opening of, for example, the mitochondrial K+(ATP) channel. This channel is highly abundant in brain mitochondria and is sensitive to ATP levels and its opening is an antiapoptotic effect that prevents opening of the mitochondrial permeability transition pore and decreases production of reactive oxygen species (Dirnagl and Meisel, 2008).
Taken together, data from this study point to vulnerability of the brain in OSA. The transient hypoxia induced by sleep apnea episodes induces a metabolic load on brain mitochondria. Brain metabolite levels measured in OSA subjects have shown that the neuronal integrity marker N-acetylaspartate is reduced in OSA, and remains reduced after continuous positive airway pressure treatment (Tonon et al, 2007), and lactate, a marker of pyruvate clearance rates (which relate to oxidative metabolism), can been seen in the brains of some patients (Kamba et al, 2003). Creatine, a bioenergetic marker, is lower in the hippocampus in OSA and levels are correlated with OSA severity and measures of cognitive performance (Bartlett et al, 2004). In healthy males, bioenergetic status has been linked to cognitive speed of processing (Rae et al, 2003).
The present data indicating brain bioenergetic status is acutely compromised in OSA with oxygen desaturation provides some insight into the pathogenesis of these neurobiologic deficits in OSA and how this may be modulated in some patients by either milder hypoxemic exposure or protective mechanisms in brain bioenergetic pathways (Dirnagl and Meisel, 2008; Shan et al, 2007). Further studies of human brain bioenergetics in OSA investigating larger patient numbers and different patient OSA phenotypes will be helpful in delineating how brain responses to hypoxemia determine clinical outcomes. In addition, measuring the effect of novel neuroprotective agents against changes in cerebral energetics may provide novel therapeutic measures in reducing the neurobiologic effects of untreated OSA.
Footnotes
Acknowledgements
The MRUI software package was kindly provided by the participants of the EU Network programmes: Human Capital and Mobility, [CHRX-CT94-0432] and Training and Mobility of Researchers, [ERB-FMRX-CT970160].