
Abstract
It remains unclear whether brain energetics is disturbed in patients with mitochondrial disease without clinical central nervous system involvement (MDW). The authors used the high temporal and spatial resolution phosphorus magnetic resonance spectroscopy (31P MRS) technique that they developed to study high energy phosphates (HEPs) and intracellular pH (pH) in the visual cortex of 9 normal subjects and 5 MDW patients with single mtDNA deletion at rest, during, and after visual activation. In normal subjects, HEPs remained unchanged during activation but rose significantly (by 17%) during recovery, and pH increased during visual activation with a slow return to rest values. In MDW patients, HEPs were within the normal range at rest and did not change during activation, but fell significantly (by 22%) in the recovery period; pH did not reveal a homogeneous pattern. In the brain of patients with MDW, energy balance remains normal until oxidative metabolism is intensively stressed, as during a postactivation phase. The heterogeneity of the physicochemical environment (that is, pH) suggests various degrees of subclinical brain involvement. The combined use of MRS and brain activation is fundamental for the study of brain energetics and may prove an important diagnostic tool in patients with MDW.
Mitochondrial diseases (MD) can manifest with a wide variety of symptoms affecting multiple organ systems, the nervous system being one of the most frequently involved (DiMauro and Moraes, 1993). Organ involvement is characterized by impaired synthesis of the high energy phosphates (HEPs) that store the energy that brain cells can immediately use for their functioning (Siesjo, 1978; Siegel et al., 1981; Erecinska and Silver, 1989). Phosphorus magnetic resonance spectroscopy (31P MRS) is a powerful technique to assess brain energetics, HEP synthesis, and content in vivo (Diehl et al., 1992) and has been applied to the study of normal subjects and patients with MD. Although it has been used extensively to study muscle under both rest and activated conditions (Arnold et al., 1985), brain studies have been performed mainly under rest conditions and conflicting results have been reported (Eleff et al., 1990; Barbiroli et al., 1993; Matthews et al., 1991). Sappey-Marinier et al. (1992) showed first that 31P MRS visual stimulation combined studies are feasible in humans, and Kato et al. (1998) have extended these studies to patients affected by mitochondrial encephalopathy with severe central nervous system (CNS) clinical involvement. It has recently been shown that normal brain energetics relies upon oxidative metabolism rather than anaerobic glycolysis to a different extent at rest, during activation, and during recovery, with maximum oxidative requirements during recovery (Fox et al., 1988; Masden et al., 1998). However, 31P MRS has received little attention in the study of brain energetics under activated conditions because of two major drawbacks—low spatial and low time resolution (Diehl et al., 1992). More than 10-minute acquisitions are required to study large volumes (≥32 cc) in which activated areas average out with nonactivated areas and with muscle on the skull. Because it is currently unclear whether brain energetics is disturbed in patients affected by mitochondrial disease without CNS clinical involvement (MDW), and because minimal impairment of oxidative phosphorylation may not be detected at rest, the authors decided to investigate brain energetics in patients with MDW under activated conditions. The authors recently described a simple ad hoc system that they developed (Rango et al., 1997) to observe brain visual areas energetics by 31P MRS during very short activation with a spatial resolution better than 10 cc. In the current study, the authors used this technique to investigate the energetics of the visual cortex at rest, during, and after sustained visual stimulation in normal subjects and in MDW patients with chronic progressive external ophthalmoplegia and single mtDNA deletion. Some preliminary results have been reported (Bozzali et al., 1998).
MATERIALS AND METHODS
Patient population
Five patients (2 males, 3 females) with MDW were included in the current study (Table 1). They all had chronic progressive external ophthalmoplegia with or without limb myopathy. In all cases, the diagnosis of MD was based on clinical examination and the combined findings of histology, biochemical analysis, and genetic analysis of muscle biopsy specimens (Bresolin et al., 1990; Bet et al., 1990). Southern blot analysis was performed on muscle biopsy of each patient. Patients with single mtDNA deletion were selected (Table 1), and only patients with a quantified amount of mtDNA deletion between 40% and 60% were included in the study. Full ophthalmologic and neurologic examinations, T1- and T2-weighted magnetic resonance imaging (MRI) brain studies, EEG, flash, and pattern reversal visual evoked potential were performed to exclude patients with any of the following: symptoms or signs of CNS involvement on neurologic examination, abnormal brain MRI studies, abnormal EEG, abnormal ophthalmologic examinations (except for ptosis or impaired ocular motility), and abnormal visual evoked potentials. Patients with other diseases or those taking drugs of any kind were also excluded. Mean age of patients with MDW was 41 (SD 14). Nine normal subjects matched with MDW patients for age (42, SD 13) and sex (4 males, 5 females) were studied. Each patient was matched with two normal subjects of the same age (age difference < 5 years) and sex except for patient no. 1 (female) who was matched with only 1 normal subject. Normal subjects were defined as having no history of neurologic disease, no history of major disease, a normal neurologic examination, a normal ophthalmologic examination, and normal T1- and T2-weighted MRI brain studies; also, they were not taking any drug. The two oldest normal subjects also underwent pattern reversal visual evoked potential, which were normal. Vascular risk factors were excluded.
Patient information
Muscle biopsy: for single deletion the deleted region in mitochondrial DNA (nucleotides) is reported in parentheses. CPEO, chronic progressive external ophthalmoplegia.
The study was approved both by the local and the national ethical committees. All subjects gave informed consent according to the declaration of Helsinki.
Magnetic resonance spectroscopy
The authors used a 1.5 T Magnetom (Siemens, Erlangen, Germany) MR system. Phosphorus MRS localized spectra were obtained from the visual cortex as previously fully described (Rango et al., 1997). Briefly, the authors localized the primary visual cortex on the basis of standard T1 MRI images. Free induction decays (FIDs) were obtained with a 5 cm diameter transmitter–receiver surface coil mounted on a sliding carriage positioned under the visual cortex. Acquisition parameters were a repetition time of 2 seconds and a flip angle between 40° and 60° to avoid saturation effects. A spectroscopy reference tube containing a saline solution of phenylphosphonic acid (15 mmol/L) was placed on the opposite side of the coil. The authors have shown that under these conditions the signal is derived from a calculated sampled volume ≤10 cc that corresponds mainly to the posterior calcarine cortex, with only a minor contribution from the underlying optic radiations and the surrounding V2 visual cortex and without muscle contamination (Rango et al., 1997). The mean calculated sample volume did not differ between normal subjects and patients (P = ns). Head and coil were fixed to a custom-made head holder that in turn was fixed to the MRI table. A repeat T1 MR imaging study was obtained at the end of spectra collection and compared with images obtained at the beginning of the spectra collection; studies were discarded if head positioning had changed. Blocks of 16 FIDs were collected for each of three 7-minute periods—at rest, during visual stimulation, and after visual stimulation. The method used to deliver visual stimulation has also been fully described (Rango et al., 1997). Briefly, it was delivered by goggles (Grass) that flashed at 8 Hz to reproduce a stimulation pattern used in previous work (Fox et al., 1988; Rango et al., 1997; Blamire et al., 1992). The authors used an infrared driven-computerized system that they developed connected to the MR system computer by which goggles were automatically turned on after 7-minute acquisition and turned off after 14-minute acquisition. The following variables were analyzed: βATP, PCr, PCr/βATP ratio, inorganic phosphate (Pi), pH, phosphodiesters (PDE). Because PCr and ATP are linked together in a bidirectional pH-dependent chemical reaction in which ATP is formed by PCr and vice versa with a 1:1 (PCr: ATP) molar ratio, the PCr + βATP variable was calculated and was then used for the following calculations. The values for each variable were normalized to the reference compound signal and expressed in arbitrary units. The PCr/Pi ratio in the three conditions and the PCr/βATP ratio at rest were also calculated.
Data were acquired with a spectral width of 2000 Hz and 2048 digitized points. Free induction decays were averaged off-line by custom-made analysis software that allowed automated averaging and data processing. Averaged FIDs were Fourier transformed after convolution difference (exponential line broadening = 150 Hz) and apodization (exponential multiplication = 20 Hz). Peak areas were obtained by the classical Levenberg–Marquardt frequency domain fitting method (assuming the presence of seven resonance lines corresponding respectively to phosphomonoester, Pi, PDE, PCr, γ-, α-, and β-ATP). Polynomial baseline correction was applied. Brain pH was calculated as previously described (Petroff et al., 1985; Rango et al., 1990). Spectra were analyzed without knowledge as to the origin of the spectra (patients or control subjects). Normal ranges were calculated for each experimental condition (mean ± 2 SD). Two-tailed t-tests, analysis of variance (ANOVA), and correlation coefficients (r) were used for statistical analysis. Bonferroni's correction for multiple comparisons was applied.
RESULTS
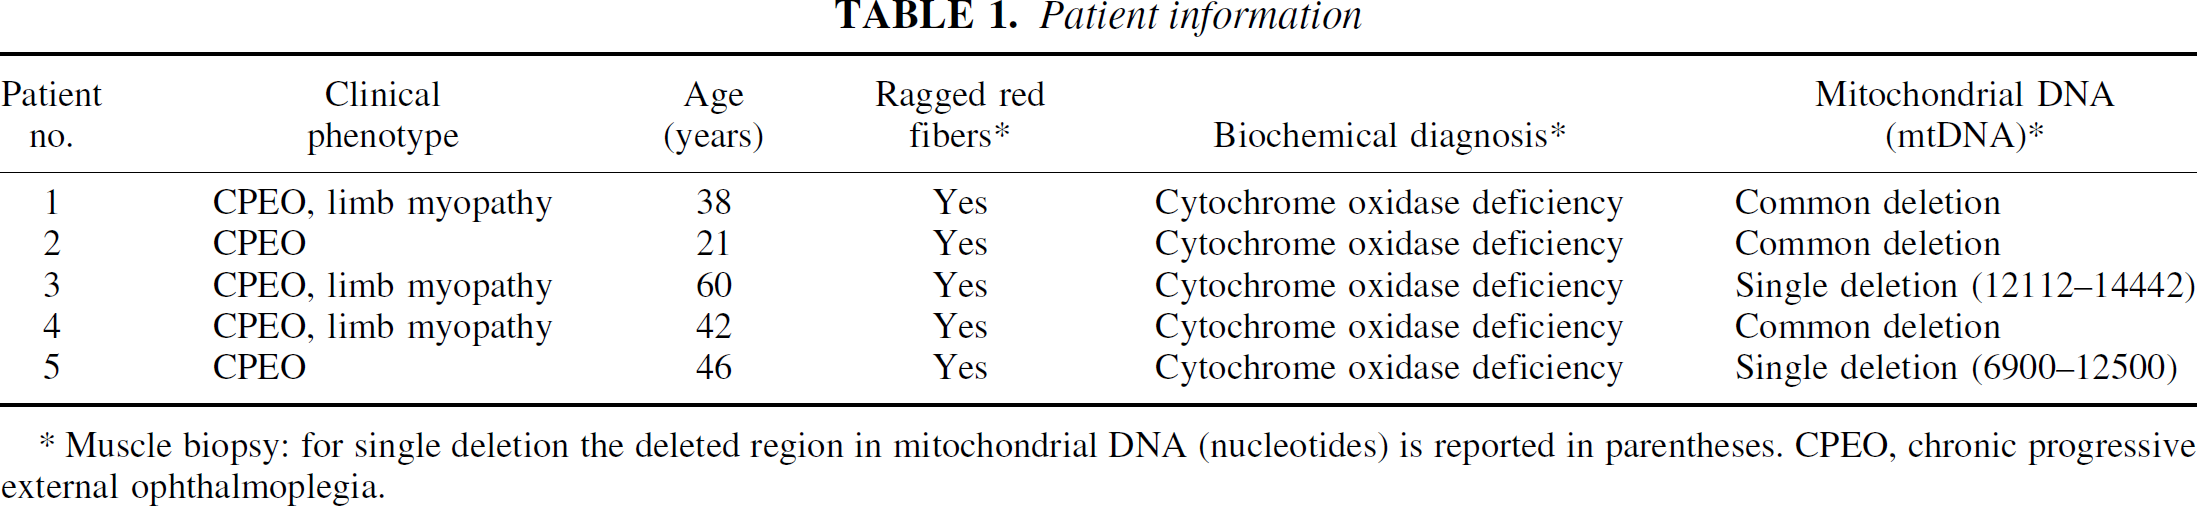
The respective mean PCr/βATP ratios at rest in normal subjects and patients were 1.62 (±0.28, SD) and 1.63 (±0.26, SD) with the ratio within the normal range (1.06 to 2.18) in all patients. The mean pH at rest was 6.95 (±0.09, SD) in normal subjects compared with 7.01 (±0.15, SD) in patients (P = ns). In normal subjects, the mean pH increased significantly during activation (7.06 ± 0.09, SD; P < 0.01) then returned towards resting values during recovery (7.02 ± 0.10, SD; P = 0.07). No significant change was found in mean pH in patients during activation or recovery, with the mean pH not differing between rest, activation (7.09 ± 0.08, SD), and recovery (7.09 ± 0.15, SD) (ANOVA, P = ns); pH analysis for each patient did not show a homogeneous pattern (Fig. 1). No difference was observed in the mean PCr + βATP at rest of the normal subject and the patient groups (12.62 ± 1.39 SD vs. 12.83 ± 1.54 SD; P = ns). In the former group (Fig. 2), the mean PCr + βATP did not vary significantly during activation (13.00 ± 1.27, SD; P = ns) but rose significantly (by 17%) during recovery (14.63 ± 1.16, SD; P < 0.009); subanalysis of βATP also showed a significant increase (P < 0.005). In normal subjects, no relation was found between age and PCr + βATP at rest (r = 0.09, ns), during stimulation (r = 0.11, ns), and during recovery (r = 0.07, ns). In the patient group (Fig. 2), mean PCr + βATP did not change significantly during activation (13.10 ± 1.40, SD; P = ns) but fell (by 22%) during recovery (9.40 ± 1.58, SD; P < 0.01). During recovery, mean PCr + βATP was significantly greater in the normal subject than in the patient group (P < 0.001). Normal ranges and values for each patient are shown in Fig. 3 and typical spectra in Fig. 4. PCr/Pi ratios were also calculated for comparison with previous literature. PCr/Pi at rest did not differ between patients and control subjects at rest (1.85 ± 0.16 SD vs. 1.87 ± 0.15 SD; P = ns). In normal subjects, PCr/Pi did not change significantly during activation (1.81 ± 0.15, SD; P = ns), but rose during recovery (2.02 ± 0.17, SD; P < 0.01). In patients, PCr/Pi did not change during activation (1.89 ± 0.14, SD; P = ns), but decreased significantly during recovery (1.71 ±0.15, SD; P < 0.01). At rest mean, PDE did not differ between normal subjects and patients (16.1 ± 1.2 SD vs. 15.9 ± 1.3 SD; P = ns). Mean PDE was not different in the 3 conditions both in normal subjects (activation 16.2 ± 1.3, SD; recovery 16.1 ± 1.2, SD; ANOVA, P = ns) and in patients (activation 16 ± 1.2, SD; recovery 15.9 ± 1.3, SD; ANOVA, P = ns).
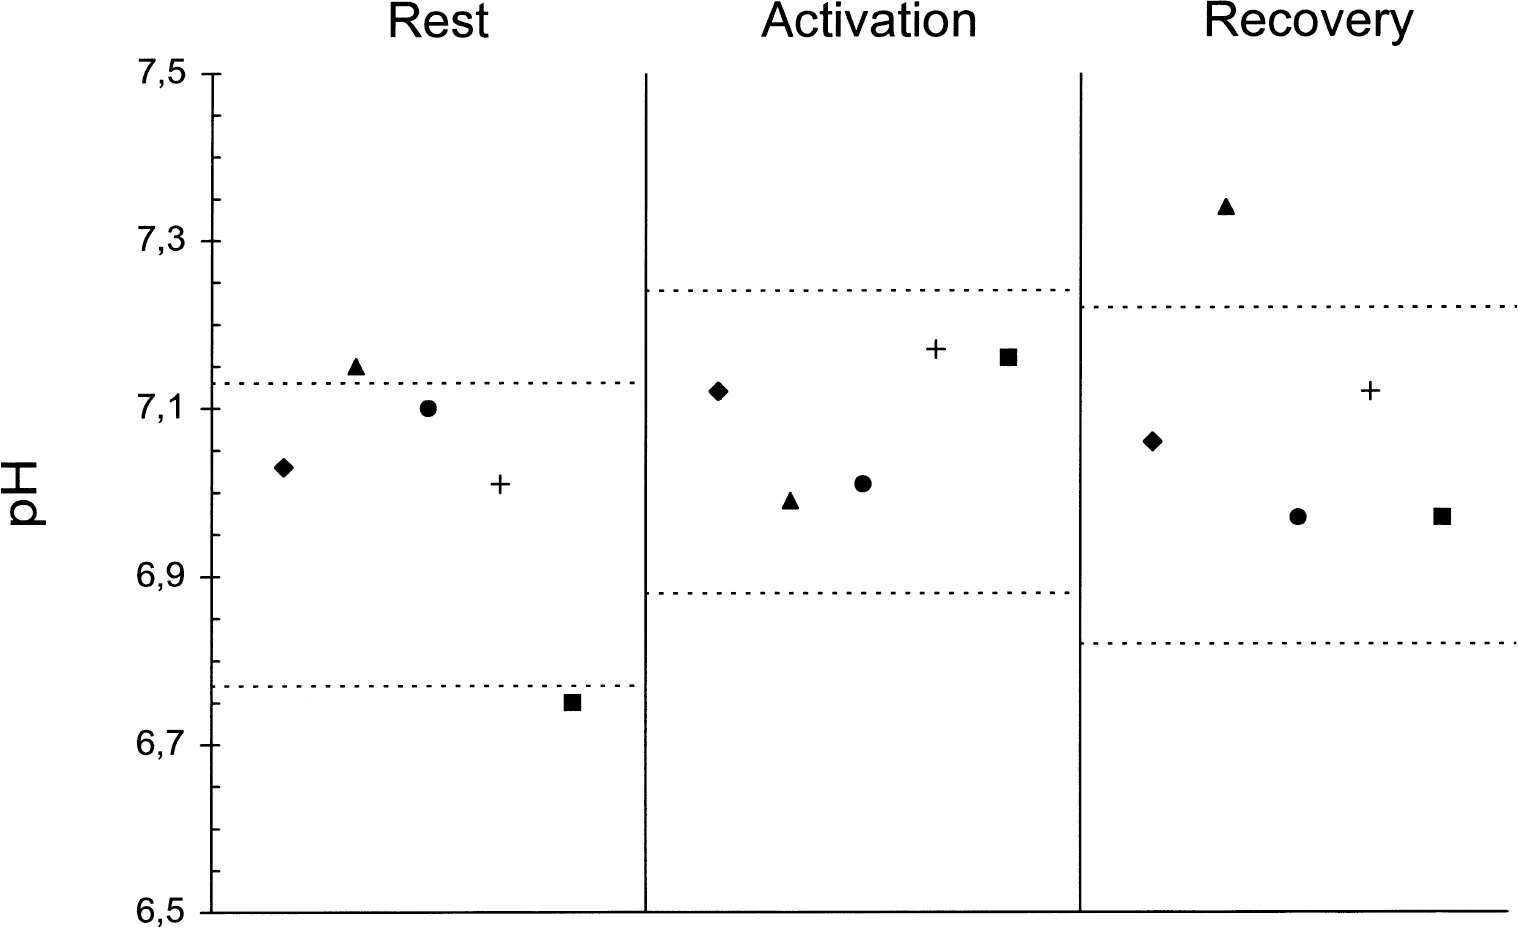
Bar graph shows PCr + βATP values in patients and controls (arbitrary units, mean + SEM) in the three experimental conditions. †P < 0.009 versus PCr + βATP at rest in the same group (paired t-test). *P < 0.01 versus PCr + βATP at rest in the same group (paired t-test).
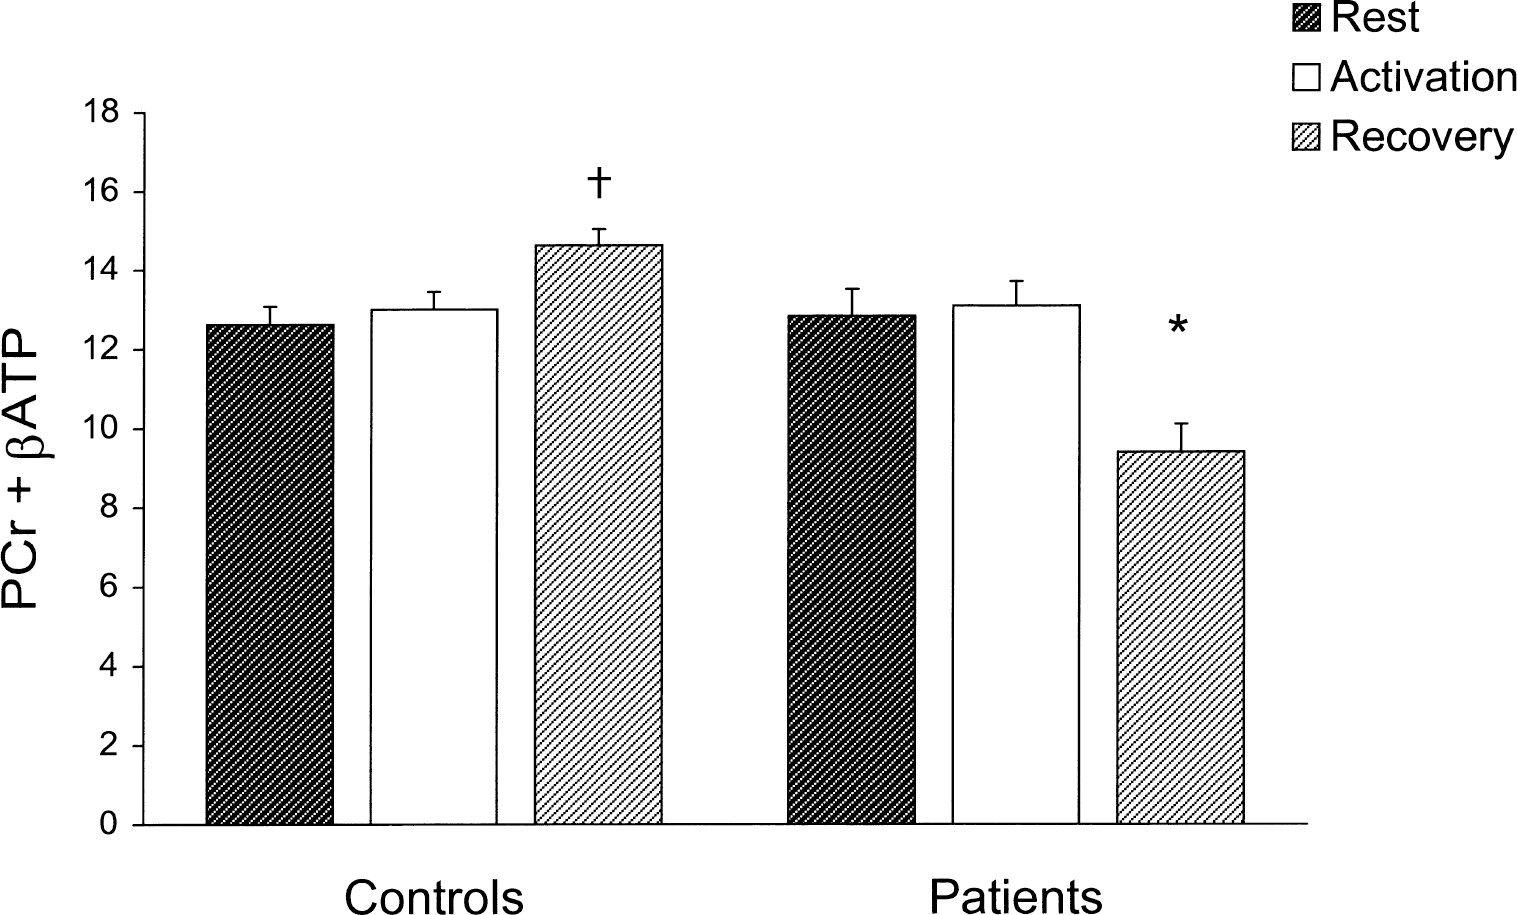
Single PCr + βATP values of patients in the three experimental conditions. See Fig. 1 for explanation of symbols. The normal range for each condition is shown between the dotted lines.
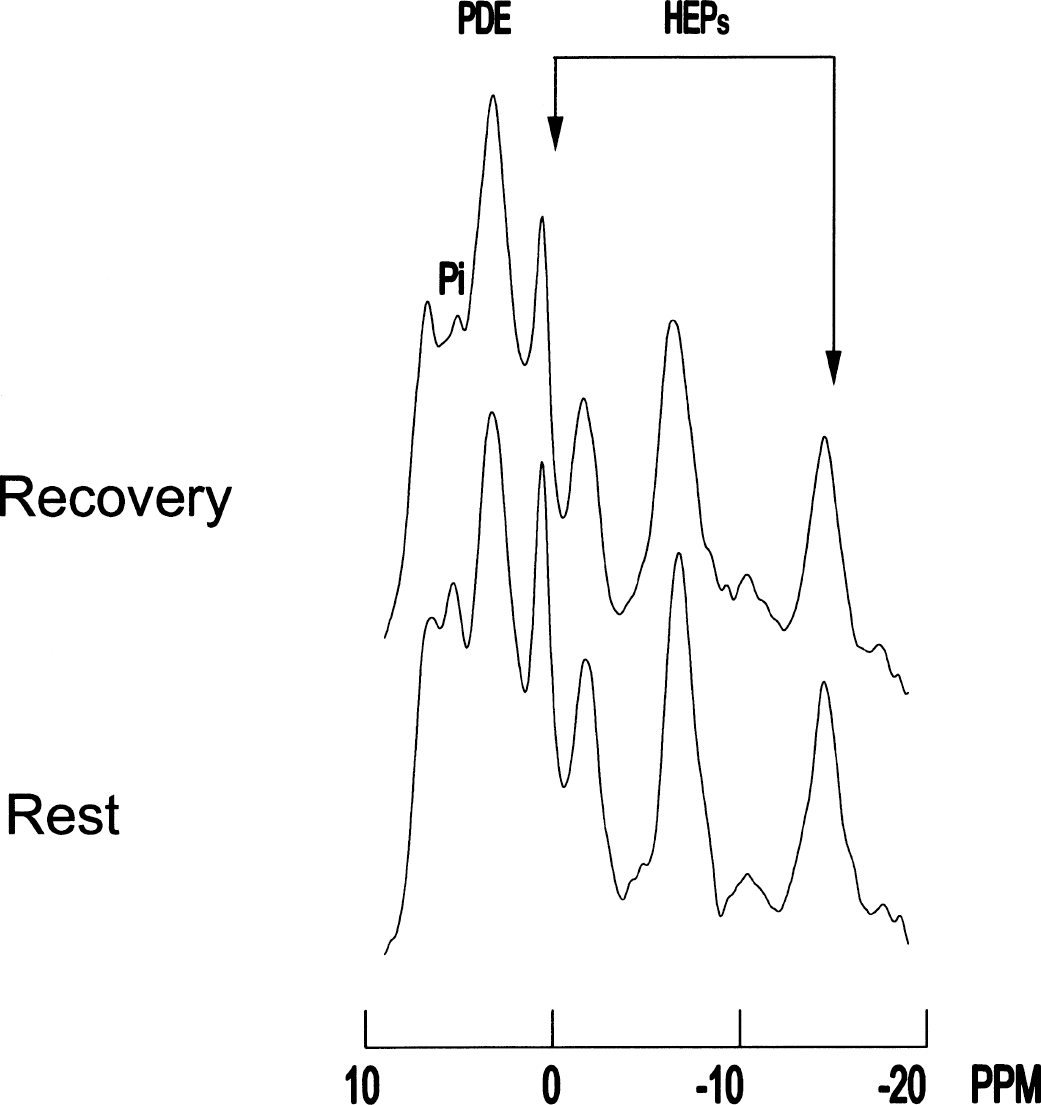
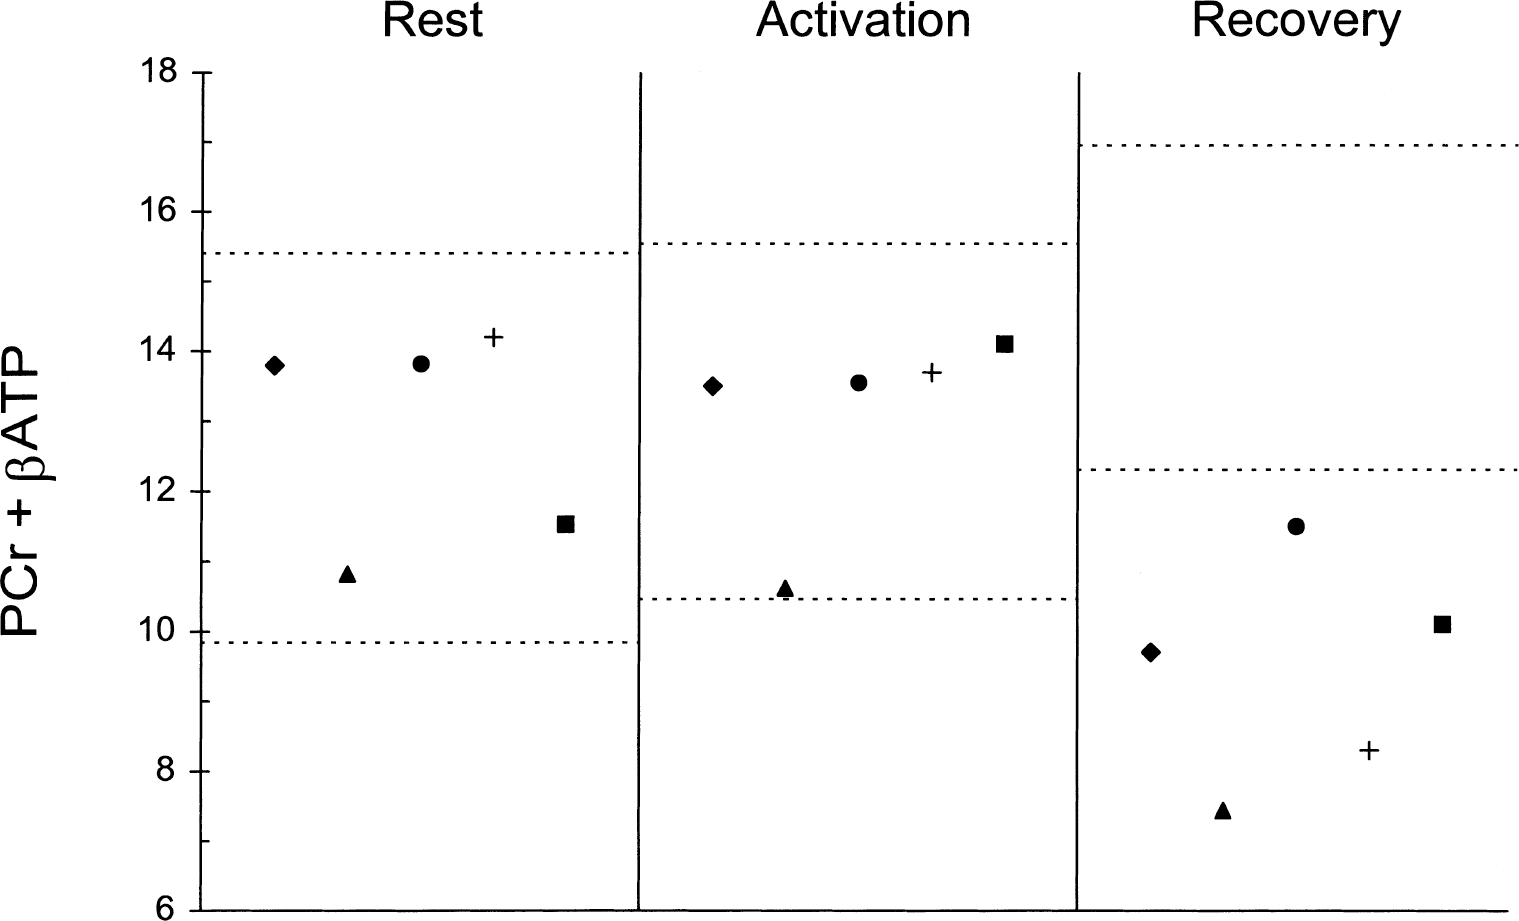
31P spectra obtained from the visual cortex of a patient: comparison between rest and recovery. Arrows indicate high energy phosphates (HEPs) (left arrow, PCr; right arrow, βATP). Spectra acquisition processing parameters: sweep width = 2000 Hz, 2048 digitalized points, convolution difference to remove broad signal (exponential line broadening = 150 Hz), exponential multiplication (20 Hz) to improve signal-to-noise ratio, no baseline correction. Note that during recovery both PCr and ATP are decreased. Note also that Pi becomes partly magnetic resonance spectroscopy invisible during recovery, a phenomenon already described in muscle activation studies as invisible Pi; this may give artificially high PCr/Pi values. Phosphodiester peak is unchanged. This subject's HEP changes were among those closest to the group mean and were not the most dramatic responses.
One patient (no. 3) had a repeat scan at 4 months with overlapping PCr + βATP values (rest 13.87 vs. 13.79, activation 13.61 vs. 13.66, recovery 11.52 vs. 11.58) and with overlapping pH values (rest 7.10 vs. 7.12, activation 7.02 vs. 7.02, recovery 6.98 vs. 6.97).
DISCUSSION
Brain energetics during activity can be accurately investigated by studying the HEP compounds ATP and phosphocreatine (Siesjo, 1978; Siegel et al., 1981; Erecinska and Silver, 1989). PCr represents a high energy reservoir linked to ATP in a bidirectional pH-dependent chemical reaction in which ATP is formed by PCr and vice versa with a 1:1 (PCr: ATP) molar ratio. The equilibrium for this reaction favors ATP formation so that energy demands in excess of the capacity of cells for ATP synthesis are met initially only through a shift in this equilibrium, which maintains ATP concentration constant through PCr hydrolysis (Siesjo, 1978; Siegel et al., 1981; Erecinska and Silver, 1989). Previous studies have used the ratios between intracellular compounds, such as PCr/ATP, as an index of brain energetics. The authors have shown that, in line with experimental results (Chesler and Kraig, 1987), pH changes significantly during activation and does not return readily to rest values after the end of activation. For this reason PCr or ATP cannot be taken separately as indexes of brain energetics and HEP content as a pH change variation causes changes in opposite directions for PCr and ATP. This pH effect is amplified by the use of their ratio and, therefore, the PCr/ATP ratio does not appear to be a precise indicator of the intracellular energy state for activation studies. The use of PCr/Pi as an indicator of intracellular energy status has been used largely in rest and activation studies (Chance et al., 1986; Sappey-Marinier et al., 1992). It is easy to use and does not need a reference compound; however, it is a semiquantitative index and changes in PCr/Pi ratio are not linearly correlated to changes in HEP content. Moreover, Pi is difficult to measure because it overlaps with phosphomonoesters peak and this may be a source of measurement error (Diehl et al., 1992). Therefore, although requiring a reference compound, the use of PCr + ATP appears more appropriate to study brain energetics because it measures directly the overall HEP content.
The authors recently demonstrated that during very short visual stimulation there is a high activation-related energy requirement in the visual cortex (Rango et al., 1996, 1997; Bozzali et al., 1998). This does not appear to be the case during sustained visual stimulation as used in the current study. Indeed, positron emission tomography findings (Fox et al., 1988) have shown that in such a case there is an increase of glucose metabolism that would account for a maximum increase of 8% of ATP synthesis. In this study, HEPs remain unchanged during brain activation, thus confirming that the activation-related energy need is low. It is likely that adaptation and accommodation phenomena intervene (Kandel et al., 1991) during sustained stimulation, which would reduce the activation-related energy need. In fact, retinal adaptation to light is known to occur in a matter of seconds (Kandel et al., 1991) and prolonged visual stimulation leads to accommodation along the optic pathway (Kandel et al., 1991; Sappey-Mariner et al., 1992).
This is the first study to demonstrate that in normal subjects there is a postactivation increase of HEPs that lasts long after stimulation has ceased. This finding is in line with findings from other authors (Madsen et al., 1998) who have recently reported an increase of glucose oxidation during the postactivation phase, as compared with rest and activated conditions. Although part of increased glucose oxidation is likely to provide energy to restore rest conditions (that is, intracellular and extracellular NA+/K+ gradients, neurotransmitter synthesis, etc.) (Siesjo, 1978; Siegel et al., 1981; Erecinska and Silver, 1989), the current findings suggest that increased glucose oxidation is in excess of actual energy requirement, or in other words, that under these conditions oxidative metabolic pathways and oxidative phosphorylation are not tightly coupled to energy requirements. In this regard, the central role of ADP concentration in regulating energetics metabolism and ATP concentration (with low ADP concentration increasing both) has been stressed in several in vitro and in vivo studies (Siesjo, 1978; Siegel et al., 1981; Chance et al., 1986), but its actual significance has been questioned (Siesjo, 1978). The current results indicate that, at least in the postactivation state, oxidative pathways and ATP synthesis are not tightly regulated by ADP concentration, which, given that ATP is increased, is very likely to be decreased (Siesjo, 1978; Siegel et al., 1981; Erecinska and Silver, 1989).
All of the patients with MDW in the current study had PCr/ATP ratios at rest in the normal range. The values at rest observed were in line with positron emission tomography studies (Frackowiak et al., 1988), which have reported normal brain metabolism in patients with MDW, but are apparently in contrast with some previous 31P MRS reports (Eleff et al., 1990; Barbiroli et al., 1993) of low brain PCr/ATP ratios. However, it has already been pointed out by other authors (Matthews and Arnold, 1990) that in these latter studies either brain spectra were obtained from large and unlocalized volumes, which were contaminated by skull muscle, or control subjects were not matched by age and sex with the patients, thus making the results not fully comparable. Moreover, in these studies no visual evoked potential, MRI studies, EEGs, or neurologic examination were performed; therefore, patients with instrumental evidence of CNS damage may have been included, unlike in the current study. Also, in previous studies, both a decrease and no change in PCr/Pi or HEPs during stimulation have been reported in normal subjects (Sappey-Marinier et al., 1992; Chen et al., 1997). Intrinsic error in the use of the PCr/Pi ratio, differences in sample volume and location, differences in visual stimulus pattern, and length of stimulation (Kandel et al., 1991; Marrett et al., 1992) may explain such differences. The current results are in line with studies in which similar stimulation patterns were used (Chen et al., 1997). The authors did not find any age-related PCr changes during stimulation. In one study (Murashita et al., 1999), age-dependent stimulation-related PCr changes in large sampled volumes that included most of the occipital lobes have been reported. In this study, which contradicted previous results from the same group (Kato et al., 1996), PCr decrease during stimulation was found only in an aged subgroup (mean age = 54.4 years), but not in the group as a whole. However, no EEGs, T2-weighed MRI studies, neurologic examination, nor visual evoked potential were obtained; therefore, it is not unlikely that subjects with CNS damage, or damage along the visual pathways, or both, were included in the aged subgroup. Moreover, the stimulation pattern differed from the one used in most of the studies on visual activation, including the current study, thus making comparison very difficult.
The authors found that intracellular pH at rest was abnormal in two patients and normal in the other three, suggesting that the physicochemical environment was not homogenous in the different patients. Further studies are needed to elucidate this. In any case, the variability of pH in patients with MDW should suggest caution in the use of the PCr/ATP ratio as an index of the energetic state also at rest, and at least should not be used when pH is markedly abnormal.
At rest, the authors found no difference between HEP content in normal subjects and in patients with all the single values falling within the normal range. The HEP content remained unchanged during activation in patients with MDW, as in normal subjects, but it decreased in the postactivation period. This means that even in the absence of clinical involvement, the brain of patients with MDW cannot cope with increased oxidative requirements such as those of the postactivation period that eventually lead to energy imbalance. Conversely, activation causes no energy failure because during this period additional energy demands are low and primarily sustained by an increase of anaerobic glycolysis (Fox et al., 1988). The heterogeneity of the physicochemical environment found in the current study, as expressed by pH, indicates that the degree of brain involvement may vary in severity among patients. Altogether, the current findings suggest that the oxidative phosphorylation and respiratory chain abnormalities found in the muscle are also expressed in the brain in the absence of otherwise detectable CNS involvement. The combined approach of 31P MRS and brain activation offers the possibility of elucidating the extent and role of deranged brain energetics in patients with MDW with different genetic abnormalities and in patients with other mitochondrial phenotypes. Indeed, Kato et al. (1998) have reported a decrease of PCr/Pi using a longer visual activation in two subjects affected by mitochondrial miopathy, encephalopathy, lactic acidosis, and stroke-like episodes (MELAS) and severe CNS clinical involvement. Brain metabolism in MELAS and more generally in patients with mitochondrial disease and clinical CNS involvement differs deeply from brain metabolism in patients with MDW. In patients with clinical CNS involvement, oxidative impairment in brain is severe and anaerobic glycolysis is already largely activated at rest (Frackowiak et al., 1988; Shishido et al., 1996; Sano et al., 1995). Uncoupling between blood flow, glucose and oxygen metabolism, abnormal changes of blood flow in response to changes in CO2, and direct vessels involvement have also been well described (Frackowiak et al., 1988; Shishido et al., 1996; Sano et al., 1995; Dimauro and Moraes, 1993). Therefore, it is not surprising that even a smaller further energy requirement, as during visual activation, causes energy imbalance and decreased PCr/Pi ratio in brain tissue of MELAS patients. Graded activation could be used to determine the threshold beyond which energy failure occurs by changing the stimulus parameters—that is, timing, intensity patterns, frequency, and so on—because it is well known that oxidative requirements change with stimulus (Fox and Raichle, 1984; Marrett et al., 1992). Although other kinds of stimuli may be used, visual activation of the brain appears optimal given its high oxidative metabolism (Siesjo, 1978; Siegel et al., 1981; Fox et al., 1988) and its high content of oxidative phosphorylation enzymes (Martin, 1996).
Finally, it has been recently hypothesized that aging and various degenerative disorders may share a common pathogenesis involving mitochondrial defects and energy failure (Muller-Hocker, 1992; Wallace, 1992). However, the effect of repeated energy failure in the human brain is currently unknown. The current findings suggest that whereas stimulation “prepares” the normal brain for increased energy requirements, the brain of patients with MDW may be most vulnerable to repeat activation. Although there is no initial clinical CNS involvement in patients with MDW, with time some of them may develop additional clinical features involving the brain. The combined use of 31P MRS and brain activation in longitudinal studies may help to elucidate the relation between mitochondrial defect, repeated energy failure, and development of brain damage, and thus may prove to have prognostic, other than diagnostic, value.
Footnotes
Acknowledgments
The authors gratefully acknowledge support from Telethon, Italy. The authors also thank Dr. A. Castelli for technical assistance.